


BMR won the NDFD test. br2 short corn still shipped 2.5 lb more ECM per cow. Ready to see why the cows disagreed?
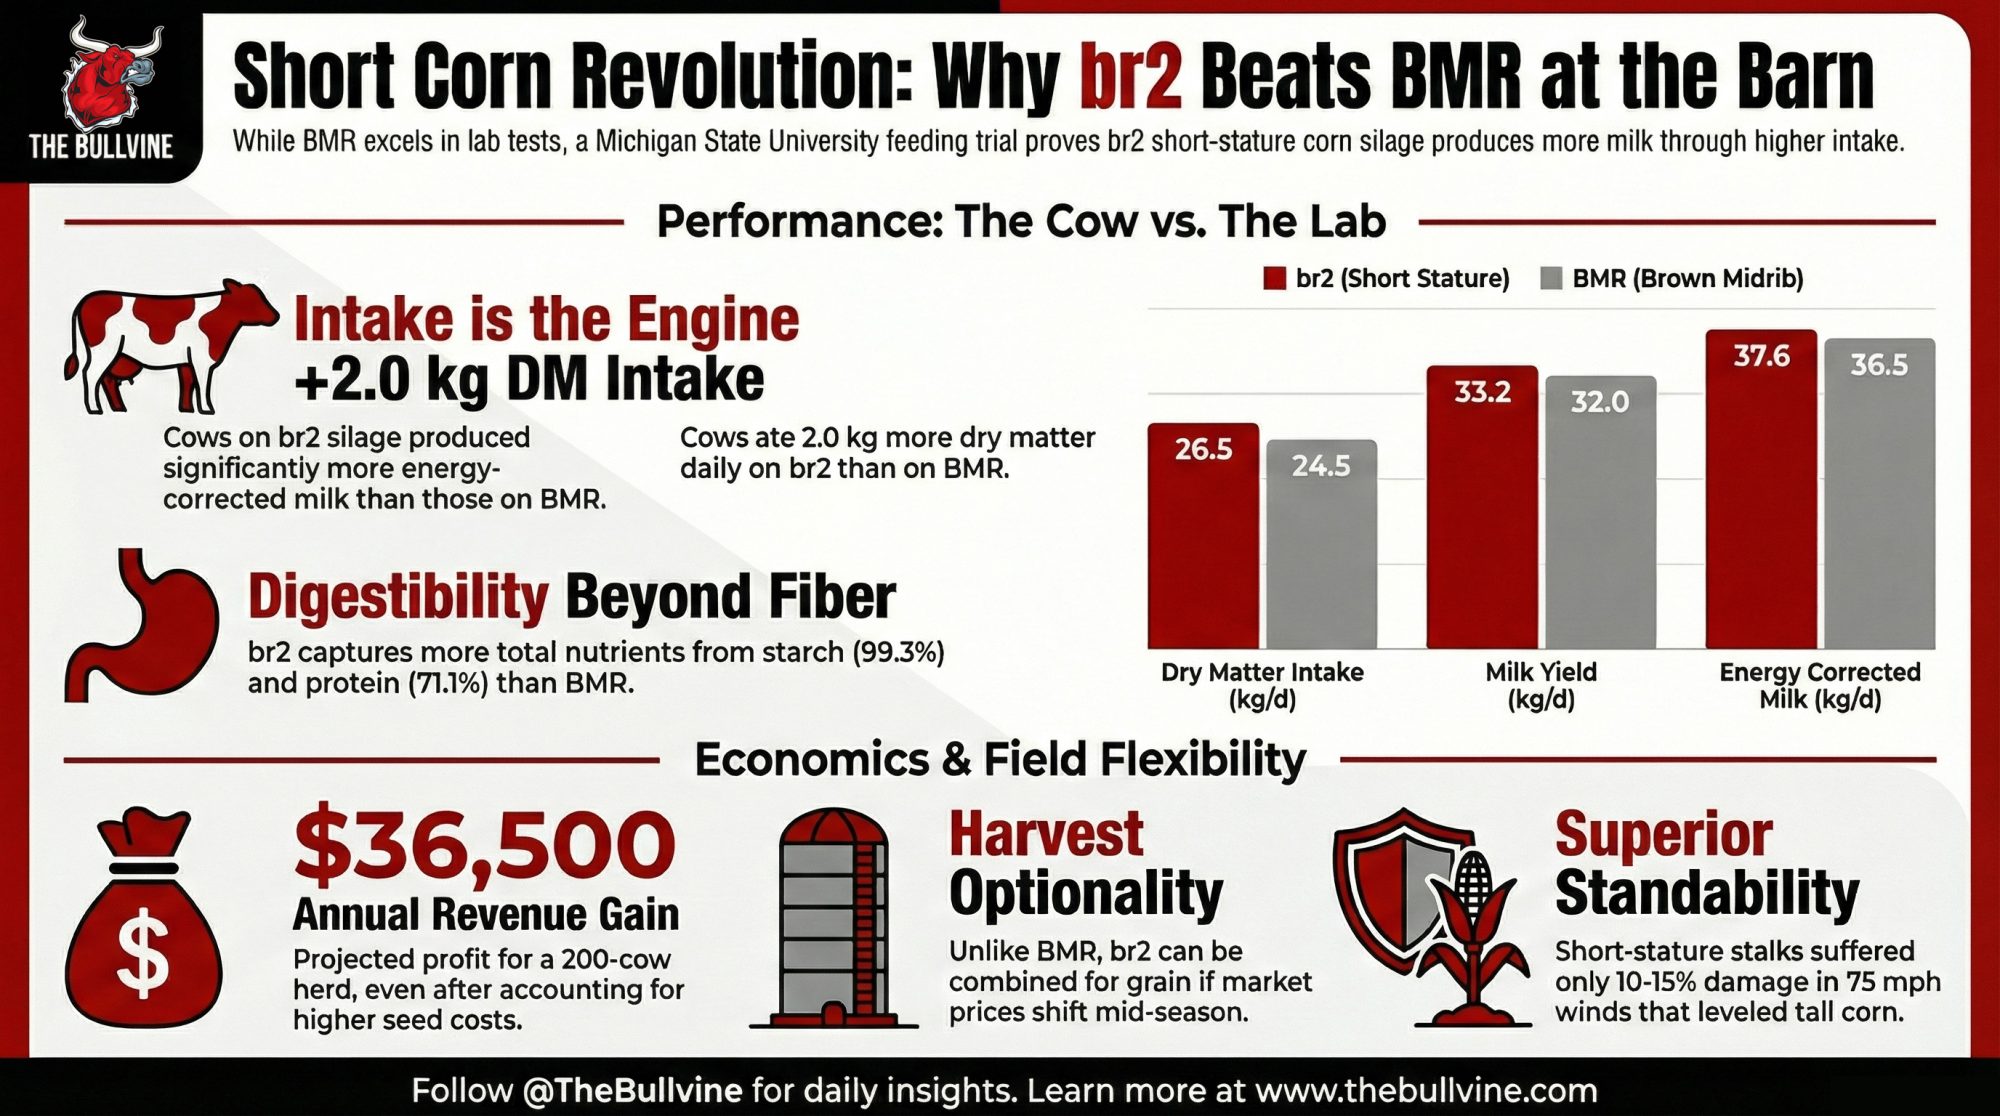
Executive Summary: Michigan State’s first short‑stature br2 feeding trial put three br2 hybrids head‑to‑head with a tall conventional and a Pioneer BMR — and the br2 silage shipped 2.5 lb more ECM per cow per day than BMR in mid‑lactation Holsteins. On paper, BMR still owned the NDFD column, but cows on br2 ate about 2 kg more dry matter and pulled more energy out of organic matter, starch, and protein, so total‑tract digestibility and milk moved their way. Fat test slipped roughly 0.13 points versus BMR while fat pounds stayed similar, which looks a lot less scary once you know CoBank is already warning about butterfat oversupply and cheesemakers chasing a tighter protein‑to‑fat ratio. When you turn it into barn math, that ~2.5 lb ECM bump pencils out to roughly $36,500 a year on 200 cows (and north of $90,000 on 500) at a $20/cwt pay price, against about $50/acre more in seed cost from higher-priced bags and higher plant populations. br2 also brings standability and optionality BMR can’t — similar or better DM yield than tall corn, less lodging risk in storms, and the option to shell it for grain if the milk‑to‑corn ratio flips, instead of being stuck chopping every acre. The fine print: feed efficiency was lower on br2, BMR still has the best data in very early lactation, and we’re talking about one Michigan trial plus an Italian study that only tested brachytic against tall corn, so this is strong first evidence, not a universal law yet. For 2026, the smart move is to trial br2 on a slice of your silage acres, budget the seed premium up front, and sit down with your nutritionist so higher forage intake actually replaces purchased energy instead of just giving you a bigger feed bill for the same milk.
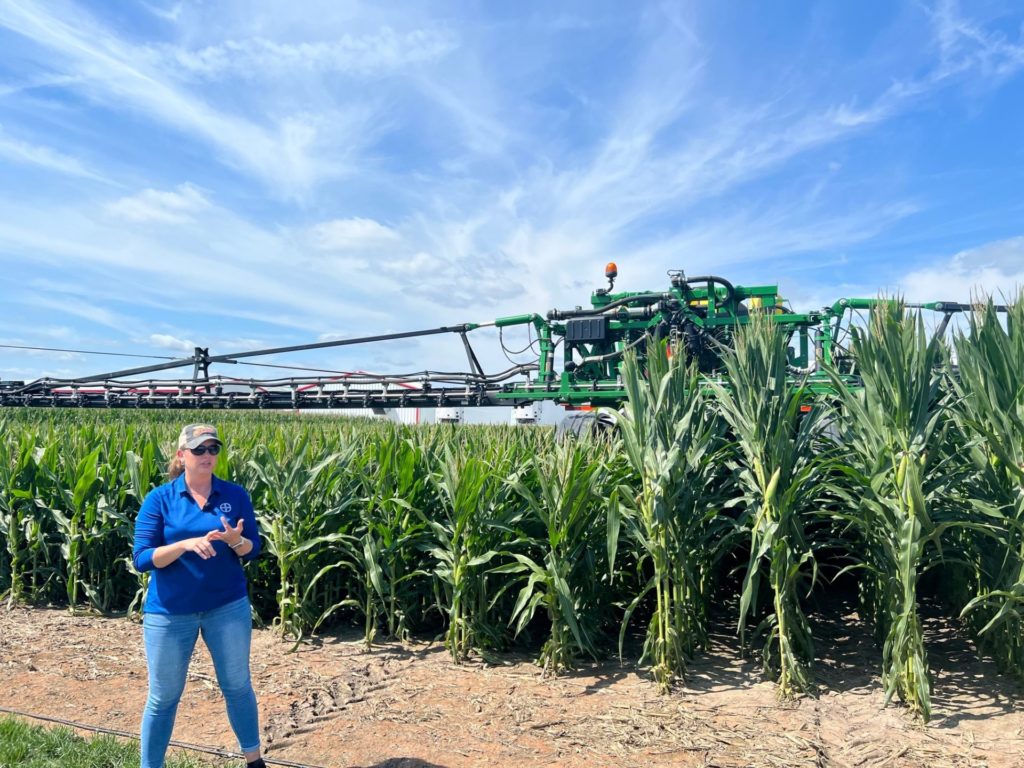
When Bayer’s Ground Breakers program offered Andy DeVries a chance to test Preceon short-stature corn on his Rosendale, Wisconsin, silage acres, the pitch was standability. What he found went further.
“Preceon delivered yields comparable to BMR, but with exceptionally high starch and similar digestibility,” DeVries shared during a January 2026 Ground Breakers session, as recounted by Bayer senior VP Elzandi Oosthuizen. “Watching Preceon silage go into the wagon made it easy to understand where that starch is coming from.”
Then, Michigan State University published the numbers, turning his field observation into a peer-reviewed challenge to a long-standing industry assumption.
For twenty years, 30-hour NDF digestibility has been the number on every seed brochure. Higher NDFD, more milk. Simple, intuitive, and — according to the first published feeding trial of br2 corn silage — incomplete.
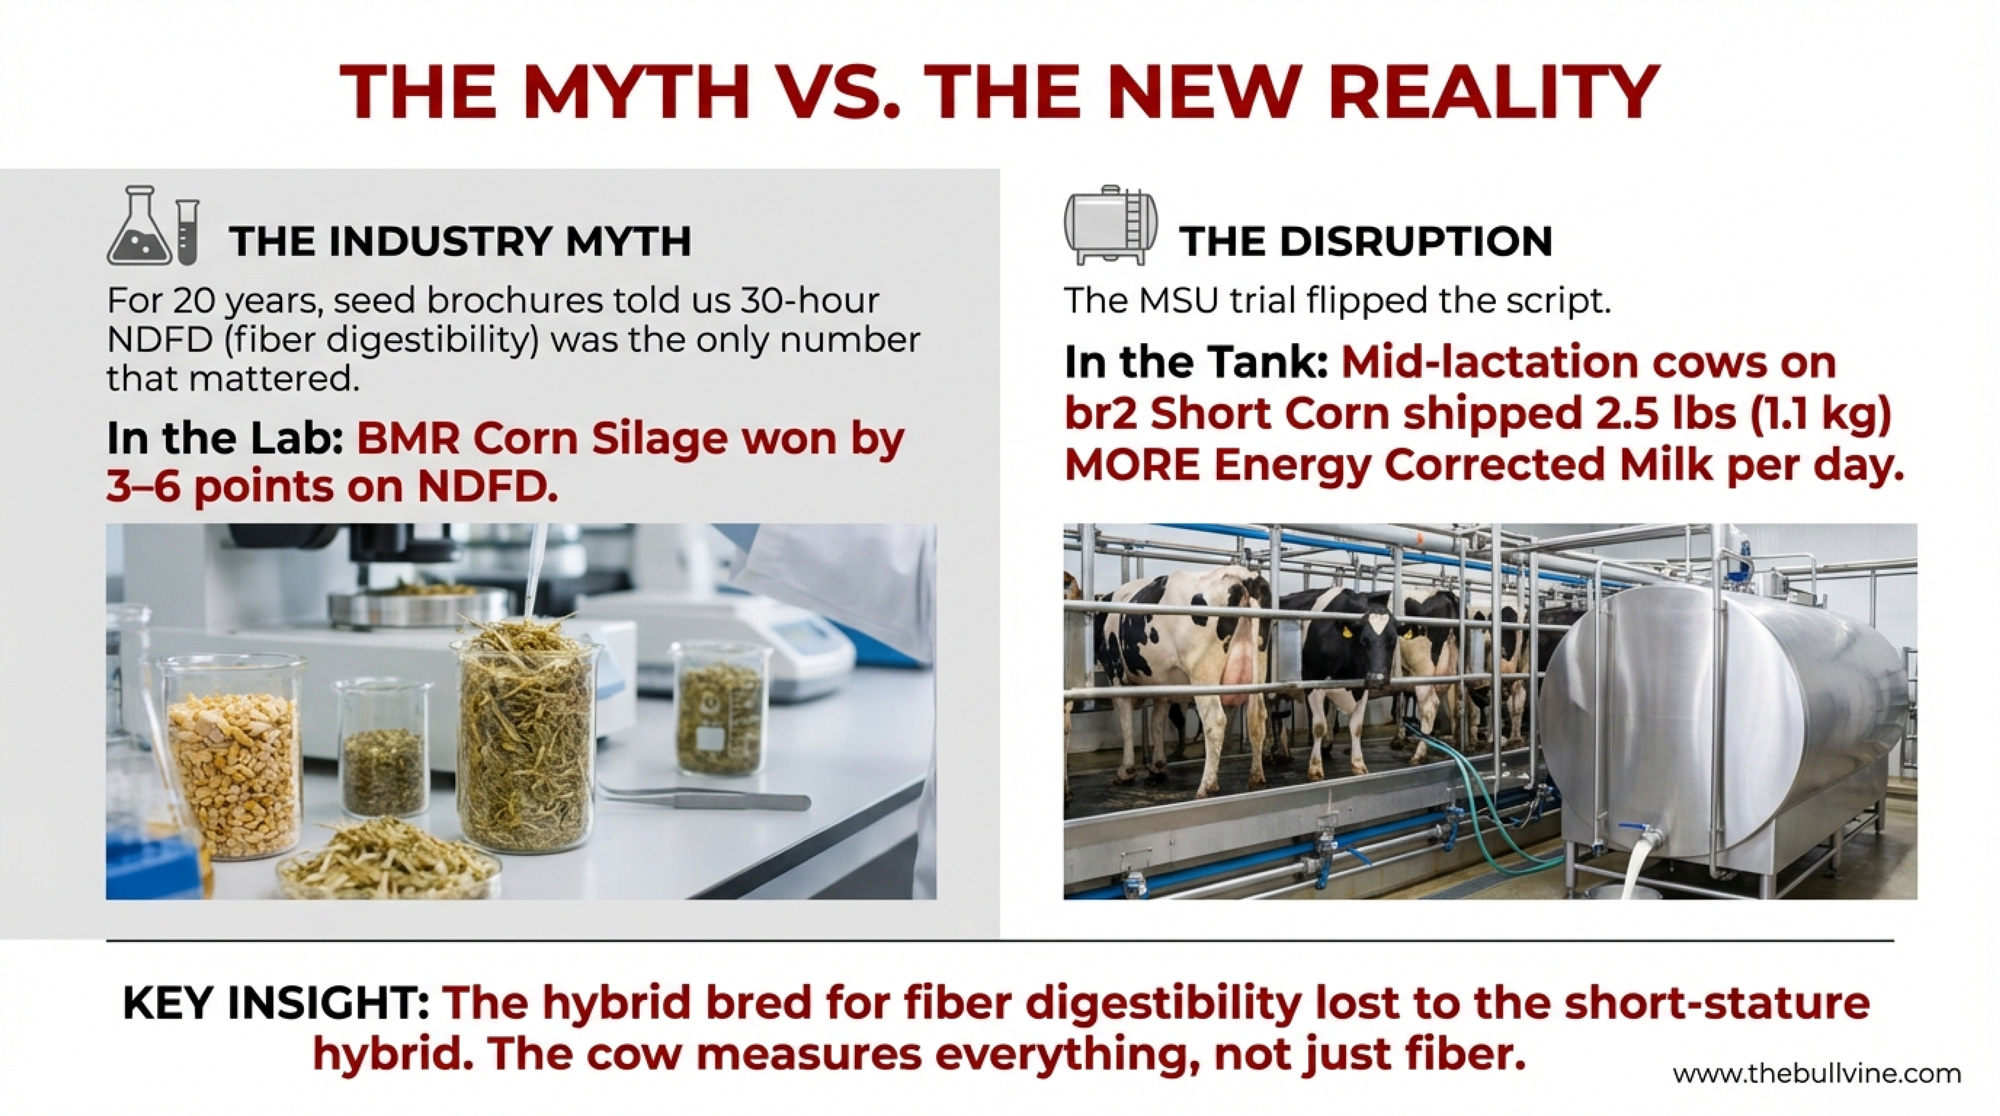
Mid-lactation Holsteins fed short-stature br2 corn silage produced 1.1 kg more energy-corrected milk per day than cows on BMR (37.6 vs. 36.5 kg/d, P = 0.01), even though BMR had a 3- to 6-point NDFD advantage in the lab. The hybrid bred specifically for fiber digestibility lost to the one that wasn’t, because the cow measures everything, not just fiber.
| Measure | br2 (avg of 3) | BMR | Difference | P-value | Winner |
| DMI (kg/d) | 26.5 | 24.5 | +2.0 | < 0.01 | br2 |
| Milk (kg/d) | 33.2 | 32.0 | +1.2 | < 0.01 | br2 |
| ECM (kg/d) | 37.6 | 36.5 | +1.1 | 0.01 | br2 |
| Fat (%) | 4.32 | 4.45 | −0.13 | < 0.01 | BMR |
| Fat (kg/d) | 1.43 | 1.40 | +0.03 | 0.14 | —* |
| Protein (kg/d) | 1.15 | 1.10 | +0.05 | < 0.01 | br2 |
| ECM/DMI | 1.43 | 1.51 | −0.08 | < 0.01 | BMR |
One caveat up front: br2’s ECM advantage over tall conventional corn was not statistically significant in this trial (P = 0.11). The bulletproof comparison is br2 vs. BMR. That distinction matters when you’re deciding which fields to switch.
Nobody Bred This Corn for Your TMR
The brachytic2 mutation shortens internodes — the stem segments between leaf nodes — while preserving leaf area, ear size, and grain fill. It cuts plant height by roughly a third. Same engine, lower chassis.
Bayer picked up the trait for grain standability, not silage quality. The 2020 Midwest derecho drove the investment. Bayer’s own research (Barten et al., 2022, published in Crop Science) documented that short-stature plots in the derecho’s path suffered only 10–15% damage from 50–75 mph winds, while tall corn in adjacent fields was, in some cases, “completely unharvestable.”
Shawn McDonald, a Bayer agronomist, told Brownfield Ag News in September 2024 that Preceon is “only about 7 feet tall with 24-to-28-inch ear heights,” and that it “has significant reductions in green snap risk.” The dairy feeding angle came later. But when VandeHaar’s lab fed br2 silage to lactating Holsteins, the cows rewrote the priority list.
40 Cows, Five Hybrids, One Question
Sarmikasoglou et al. published in JDS Communications (2025; 6(6):776–780). Here’s what they set up:
- 40 Holstein cows (20 primiparous, 20 multiparous), 150 ± 42 DIM, averaging 35 ± 6.4 kg milk/d at enrollment
- Incomplete Latin square with three 21-day periods, balanced for carryover effects
- Five silage hybrids: one tall conventional (DKC59-07RIB, Dekalb/Bayer), one BMR (P0956AMX, Pioneer), and three short-stature br2 hybrids (Bayer)
- All diets formulated to 18% CP, ~24% forage NDF, and ~26% starch on a DM basis
- Preplanned contrasts: Tall vs. Short (average of three br2 hybrids) and BMR vs. Short
- Silage planted May 15, 2023, at the MSU Dairy Cattle Teaching and Research Center; chopped September 21–22 at 34% DM; feeding trial ran January–April 2024
One cow was removed for clinical mastitis; her data were excluded. Funding came from Bayer Crop Science, and co-authors D. Hammer and T. Dietz are Bayer employees — standard practice for industry-university trials. The study was peer-reviewed and published in JDS Communications.
What the Cows Actually Said
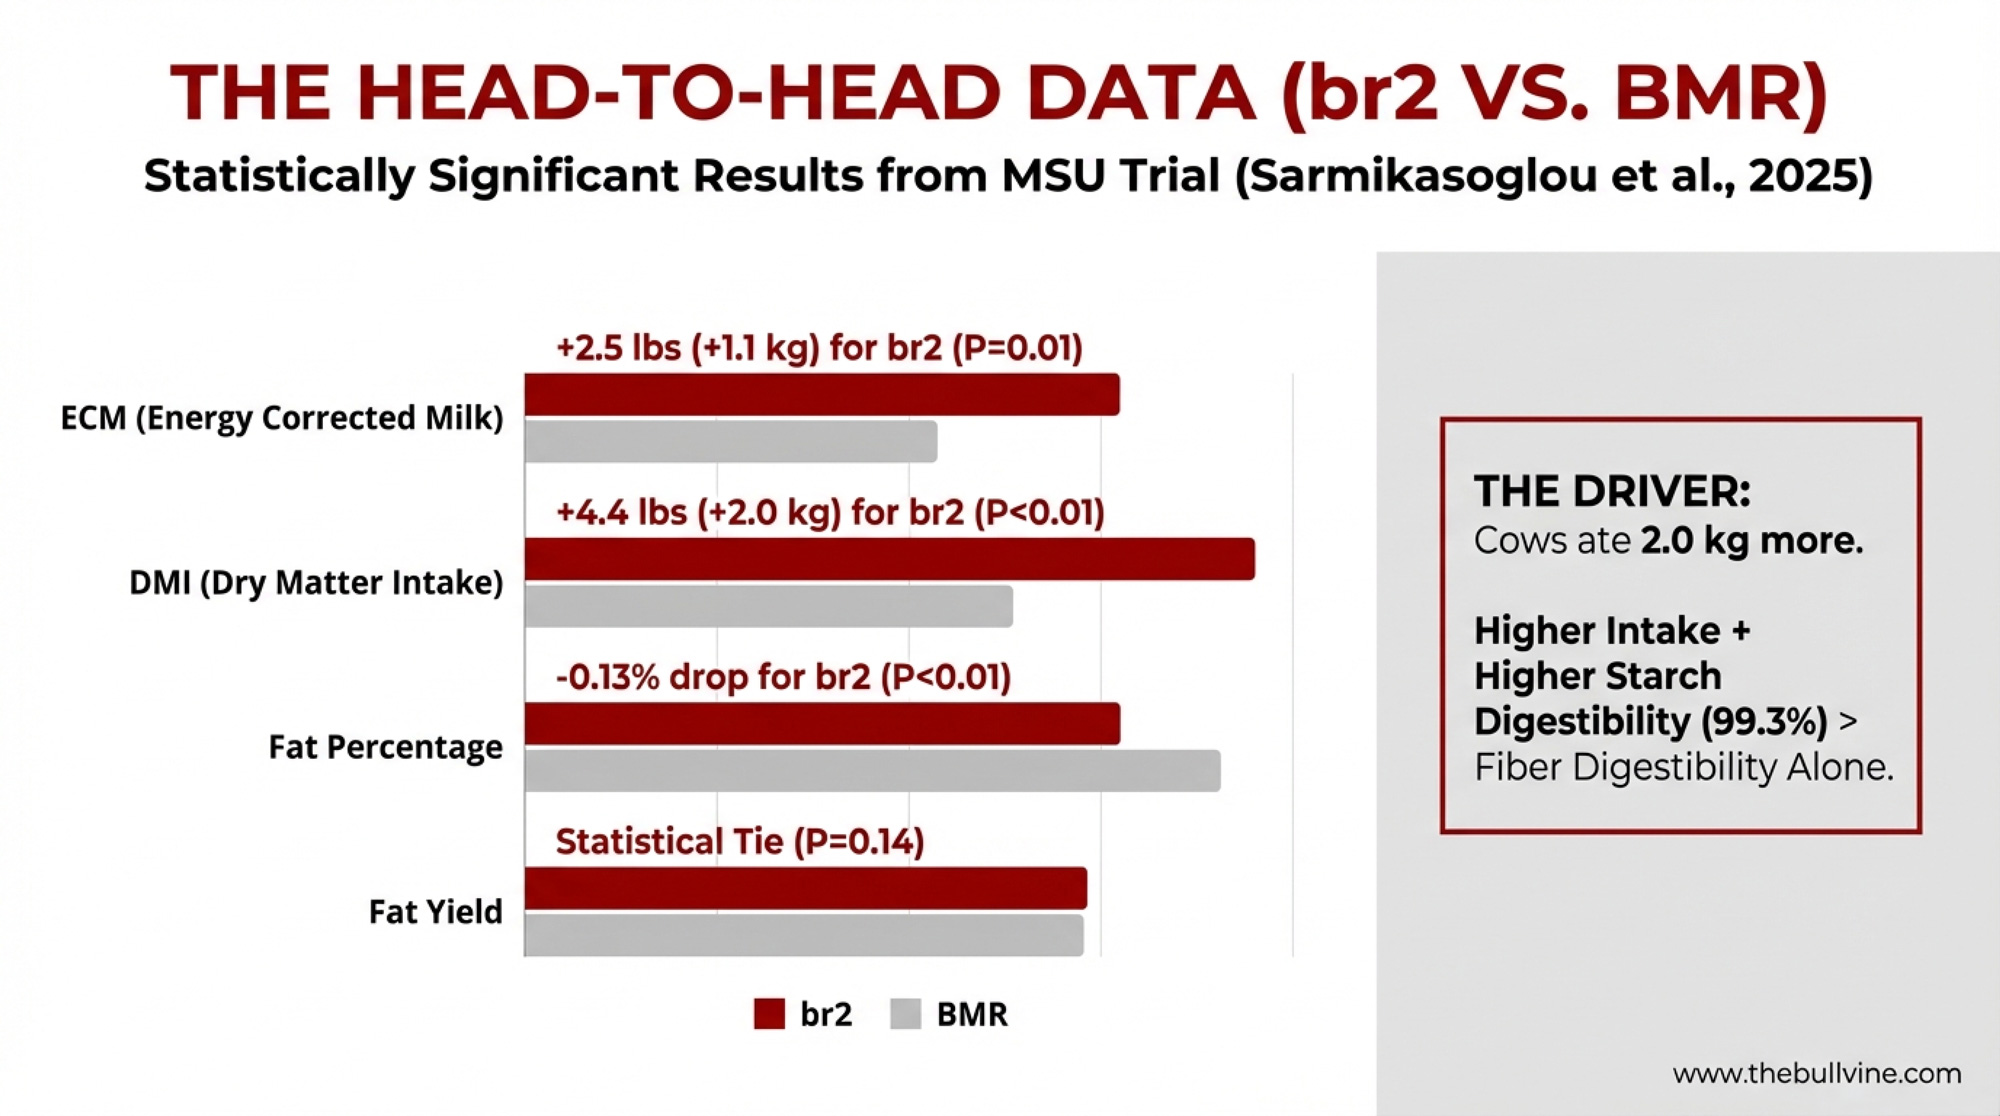
Here’s the statistically significant comparison — br2 vs. BMR:
| Measure | br2 (avg of 3) | BMR | Difference | P-value |
| DMI (kg/d) | 26.5 | 24.5 | +2.0 | < 0.01 |
| Milk (kg/d) | 33.2 | 32.0 | +1.2 | < 0.01 |
| ECM (kg/d) | 37.6 | 36.5 | +1.1 | 0.01 |
| Fat (%) | 4.32 | 4.45 | −0.13 | < 0.01 |
| Fat (kg/d) | 1.43 | 1.40 | +0.03 | 0.14 |
| Protein (kg/d) | 1.15 | 1.10 | +0.05 | < 0.01 |
| ECM/DMI | 1.43 | 1.51 | −0.08 | < 0.01 |
Against tall conventional, br2 bumped milk yield (33.2 vs. 32.5 kg/d, P = 0.02) but the ECM gap — 37.6 vs. 37.0 — wasn’t significant (P = 0.11). Fat yield was nearly identical (P = 0.39). Don’t project revenue off that comparison.
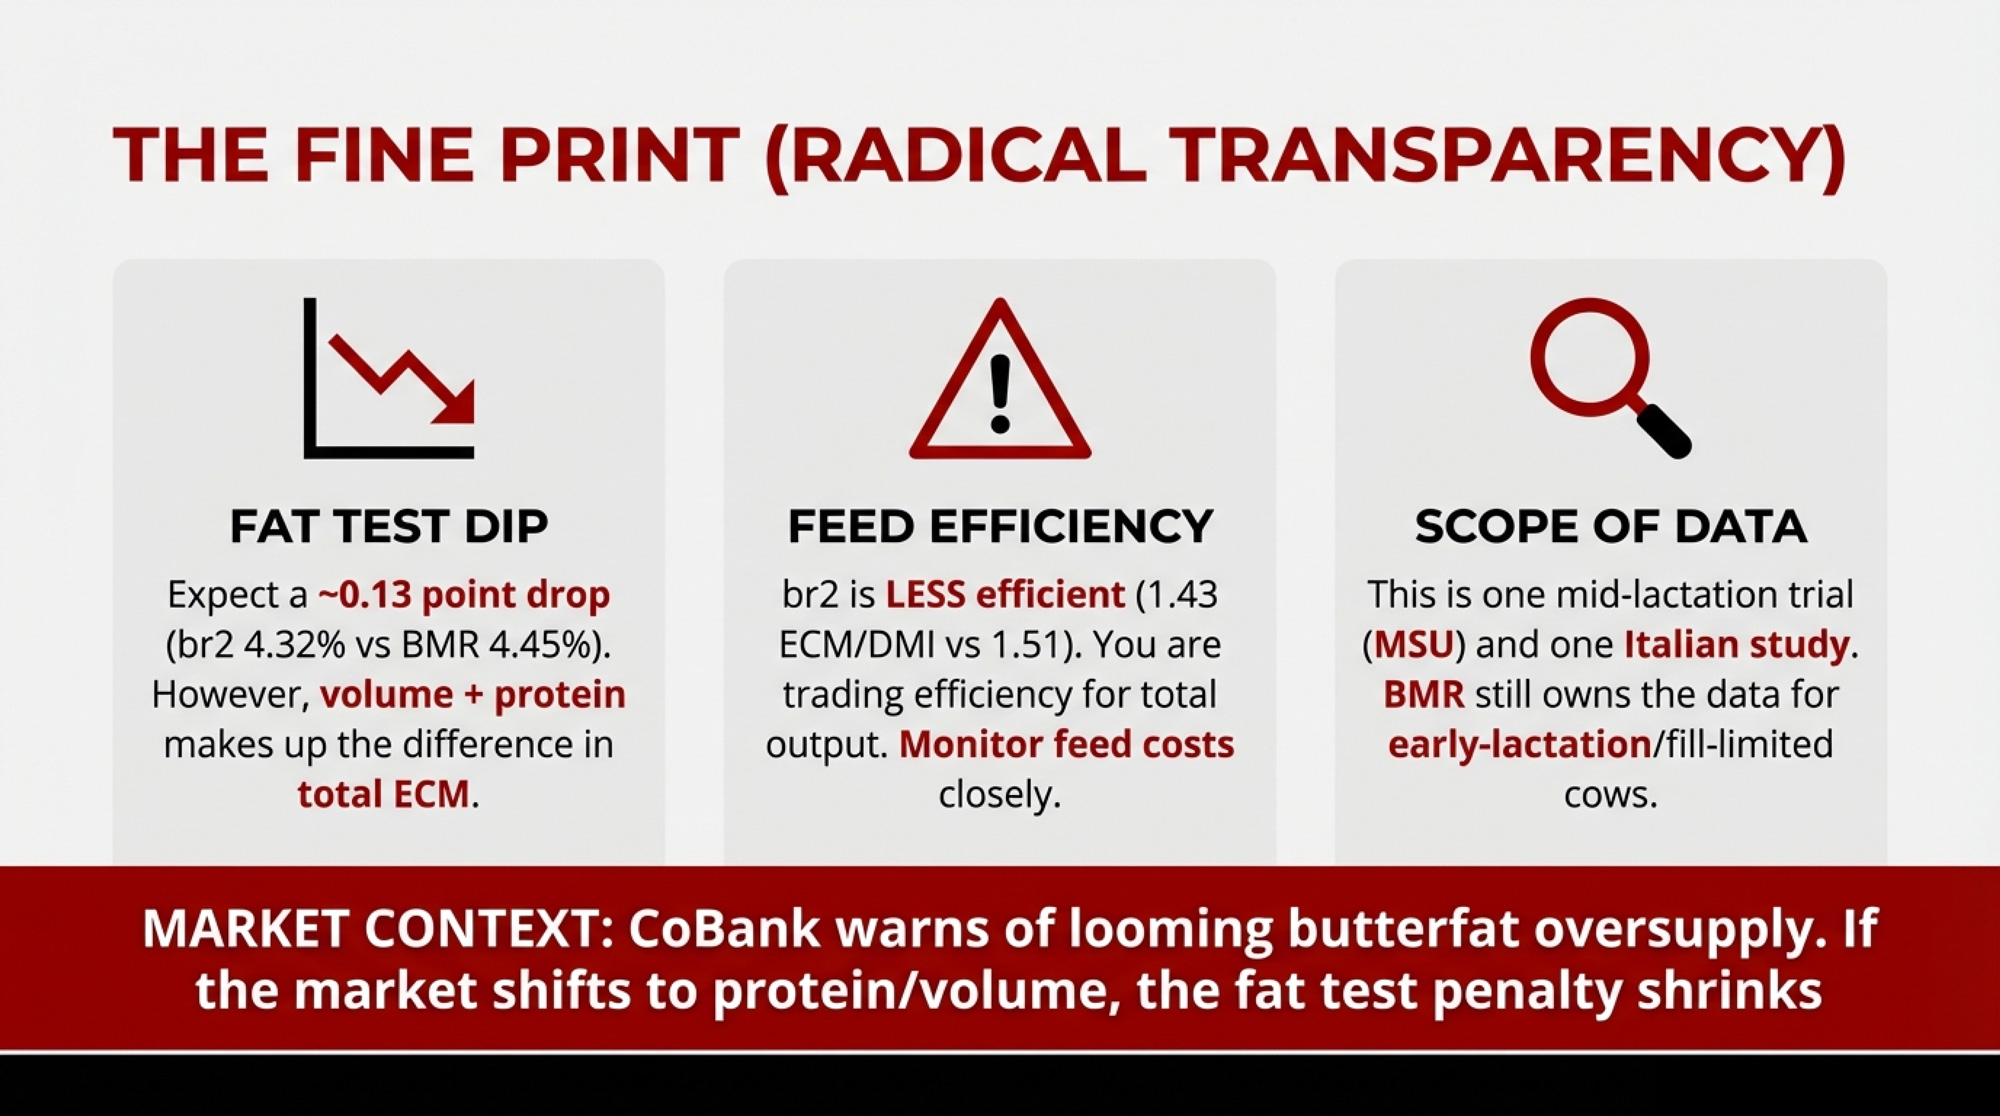
br2 beat BMR on production at the cost of lower feed efficiency and a lower fat test. If your market pays hard on fat percentage, that 0.13-point drop versus BMR isn’t a footnote — it’s a spreadsheet conversation.
A note on scope: The trial tested one Pioneer BMR hybrid (P0956AMX). BMR performance varies across genetics and growing conditions — this result speaks to one hybrid in one Michigan field in one year, not BMR technology broadly.
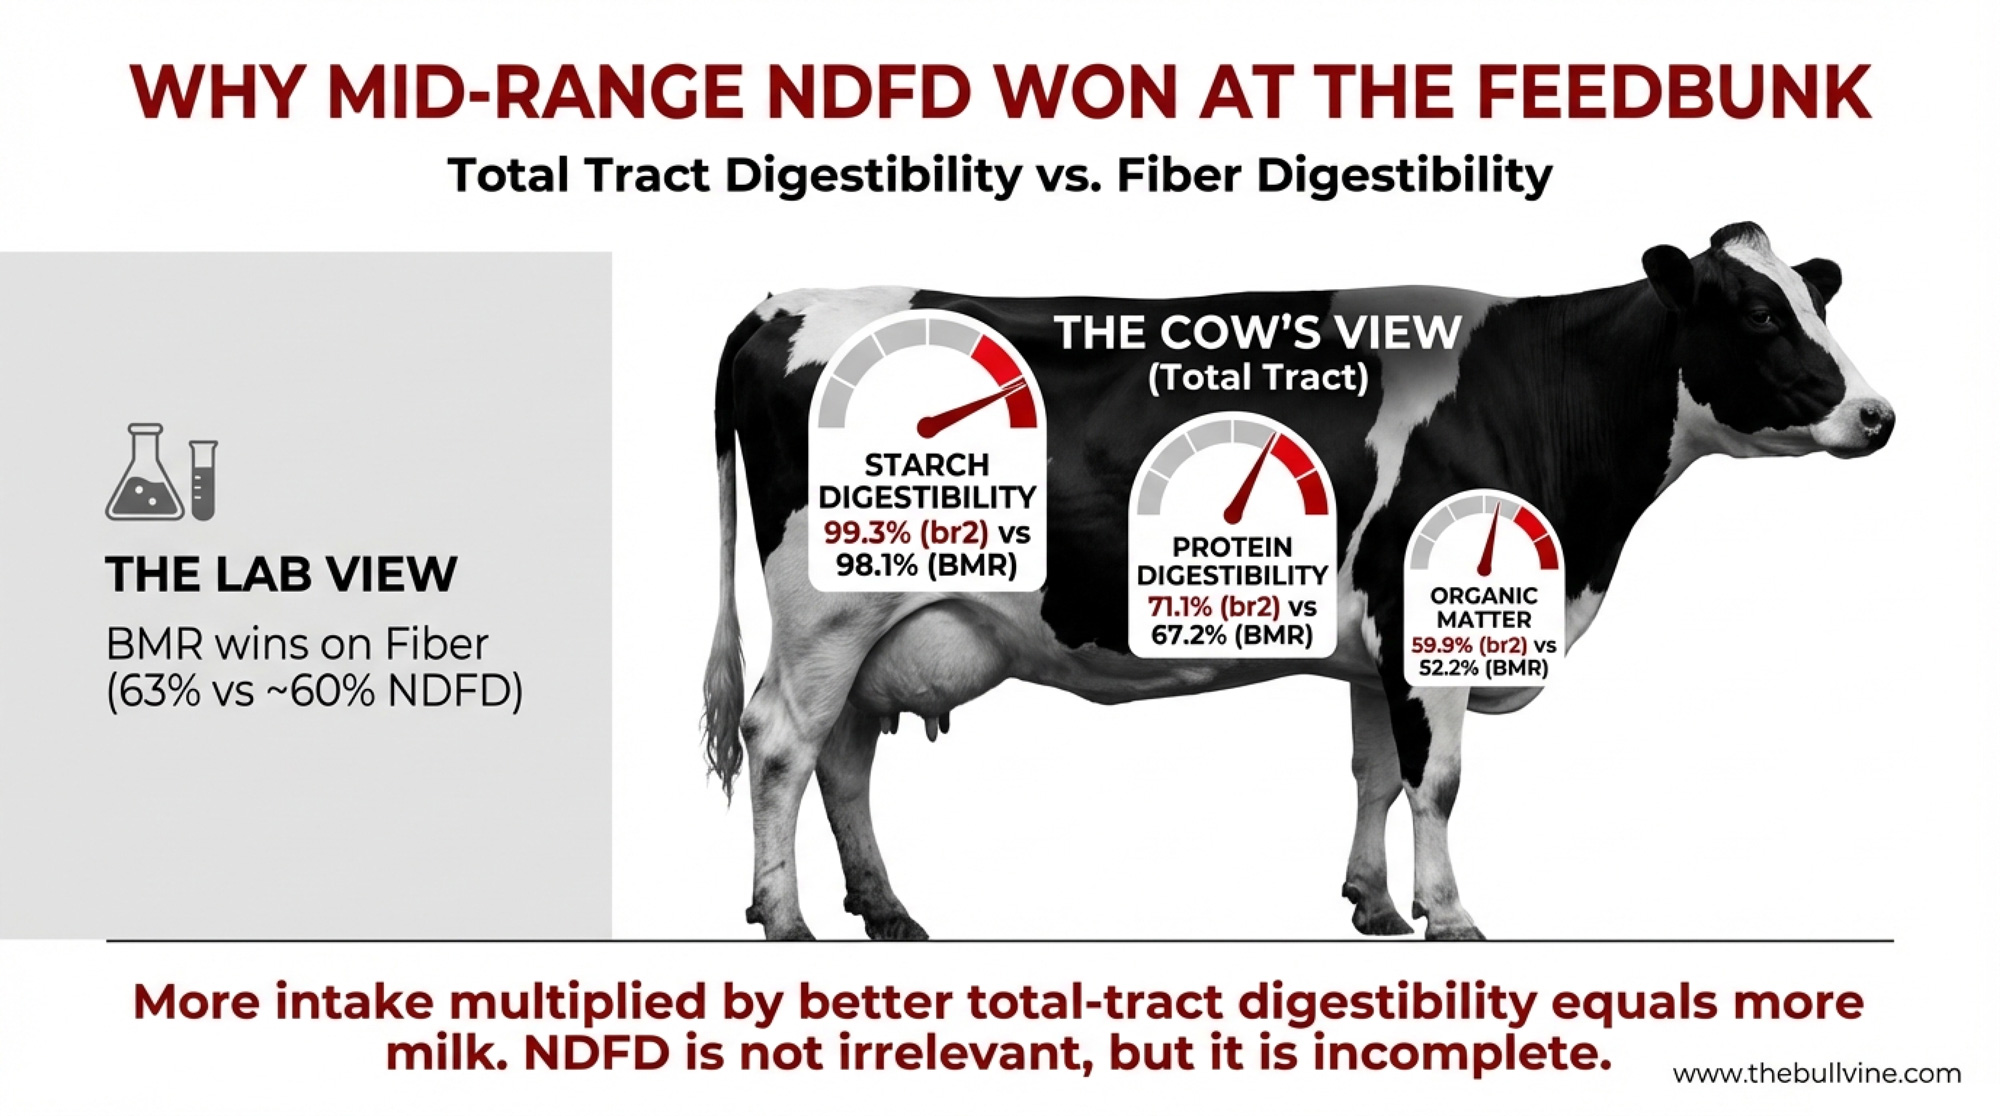
Why Did Mid-Range NDFD Win at the Feedbunk?
Line up the 30-hour in vitro NDF digestibility and BMR wins on paper: Tall 53%, short hybrids 57–60%, BMR 63%. If you’ve spent a decade picking hybrids off that NDFD column, the choice looks obvious.
The cows disagreed.
Total-tract digestibility told a different story:
| Nutrient | BMR | Short (avg of 3) | P-value |
| Organic matter | 52.2% | ~59.9% | < 0.01 |
| Starch | 98.1% | ~99.3% | < 0.01 |
| Crude protein | 67.2% | ~71.1% | < 0.01 |
| NDF | 45.4% | ~45.2% | 0.88 |
BMR’s fiber was more digestible in the test tube. But in the cow — where OM, starch, and protein digestibility all contribute to energy supply — br2 captured more total nutrients. And the cows ate 2.0 kg/d more of it than BMR.
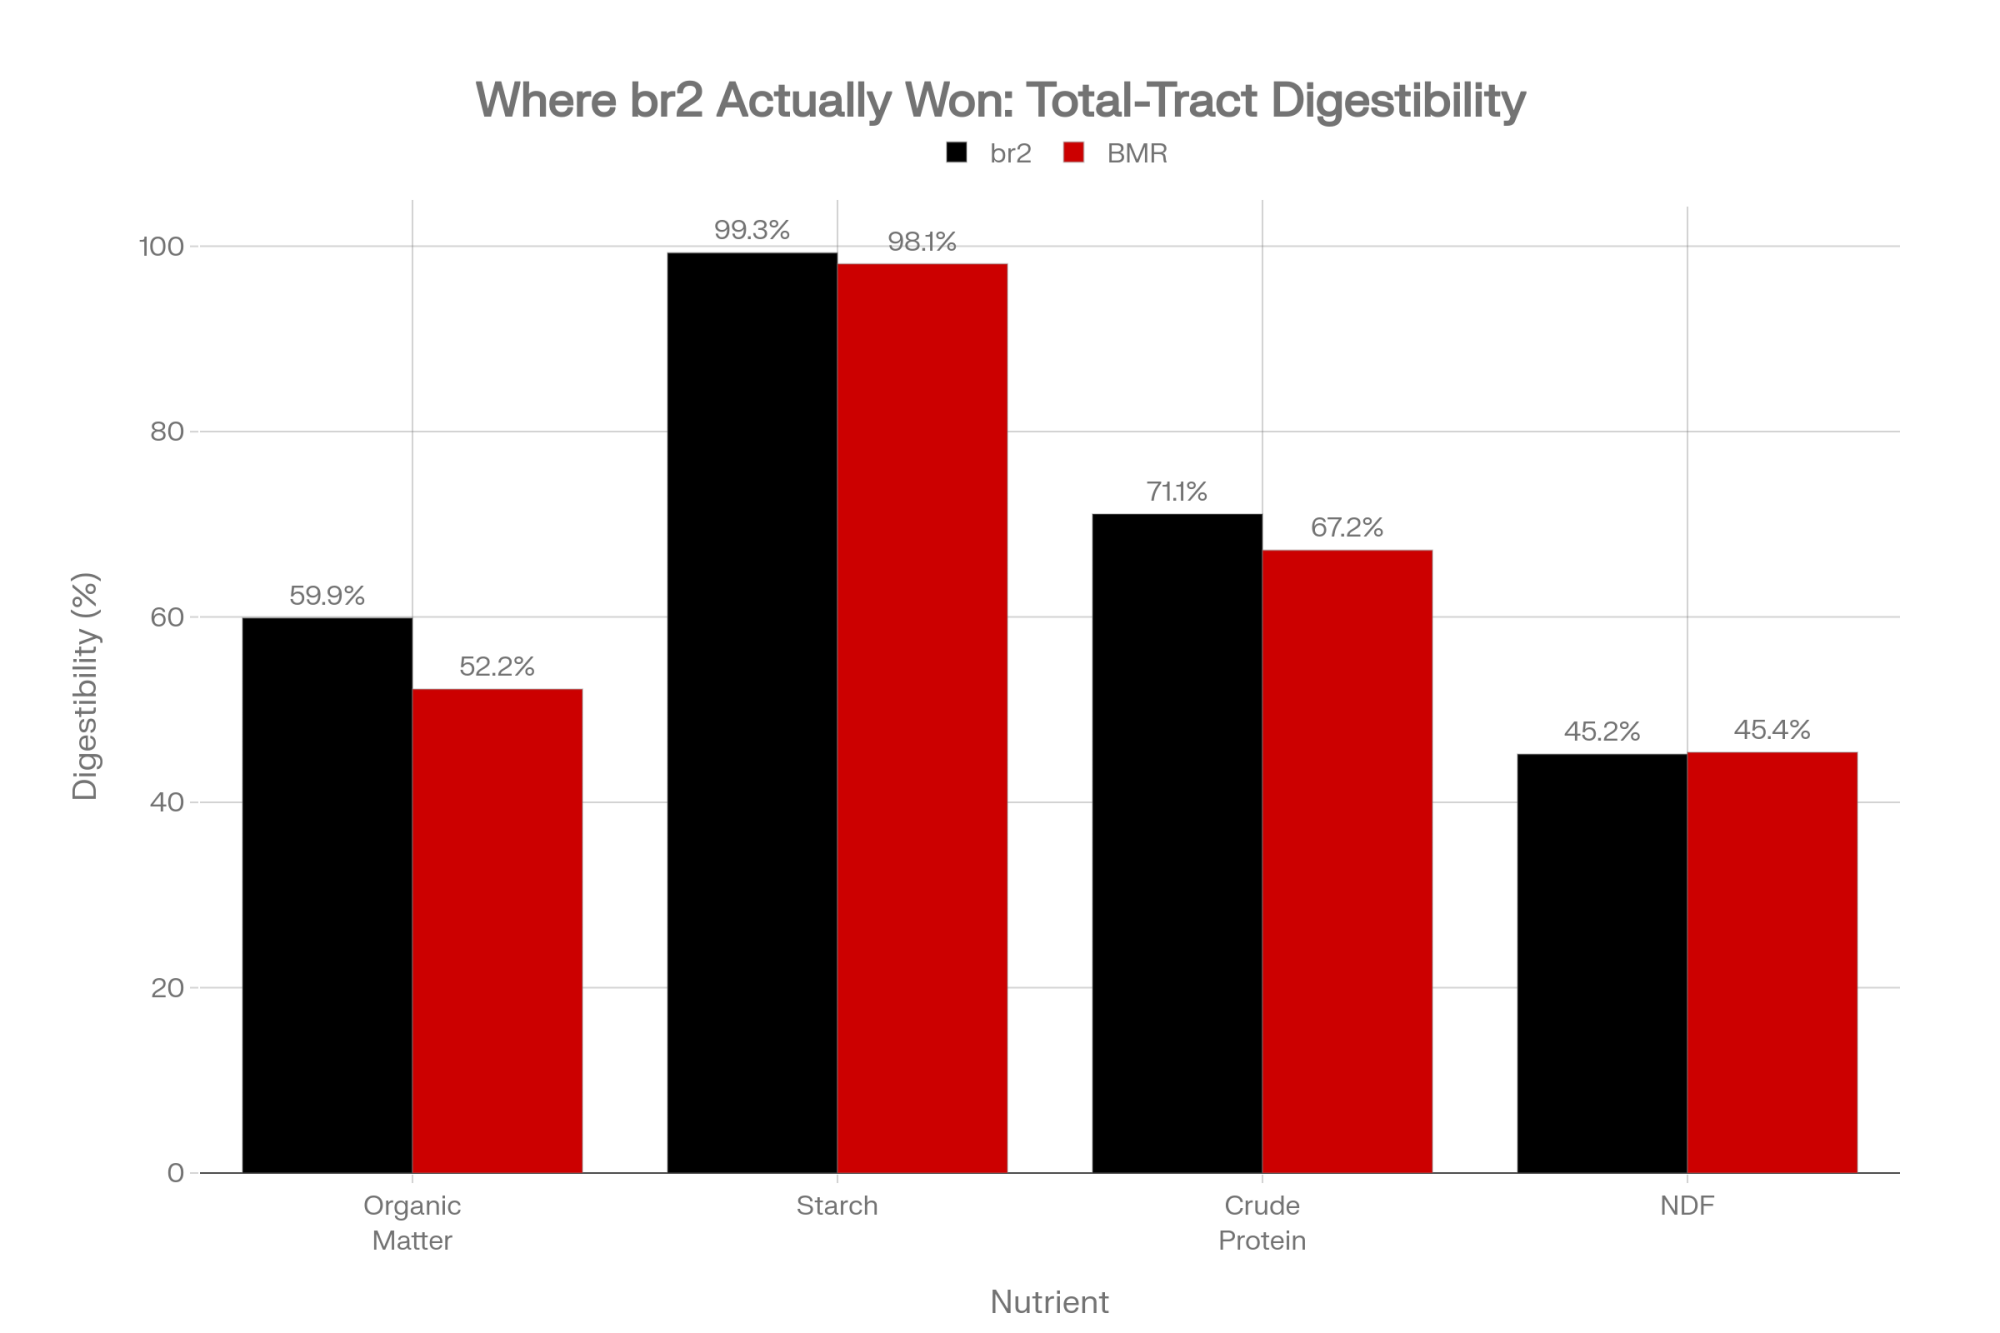
More intake multiplied by better total-tract digestibility equals more ECM shipped. That’s a story about NDFD’s limits as a sole selection metric, not NDFD’s irrelevance. The in vitro number accurately measured one thing. The cow measured everything.
The Caveats MSU Disclosed
The MSU team was candid. Diets ran higher NDF (~29% DM) and lower starch (~26% DM) than what’s typically optimal for mid-lactation cows. They noted the 2023 Michigan drought could have affected BMR silage quality, and mycotoxin levels weren’t tested.
They also acknowledged that mid-lactation cows may respond differently to BMR than early-lactation cows, where fill limitation is the main intake constraint. Honest limits from the researchers themselves.
BMR Is a Commitment. br2 Is Optionality.
Here’s something the NDFD column on a seed brochure can’t tell you: BMR is a commitment. Once it’s in the ground, you’re chopping it. Period. BMR’s lower DM yield and poorer standability make it a poor candidate for leaving in the field past optimal chop timing, and its grain yield doesn’t justify combining.
Every BMR acre is a silage-only acre. br2 is optionality.
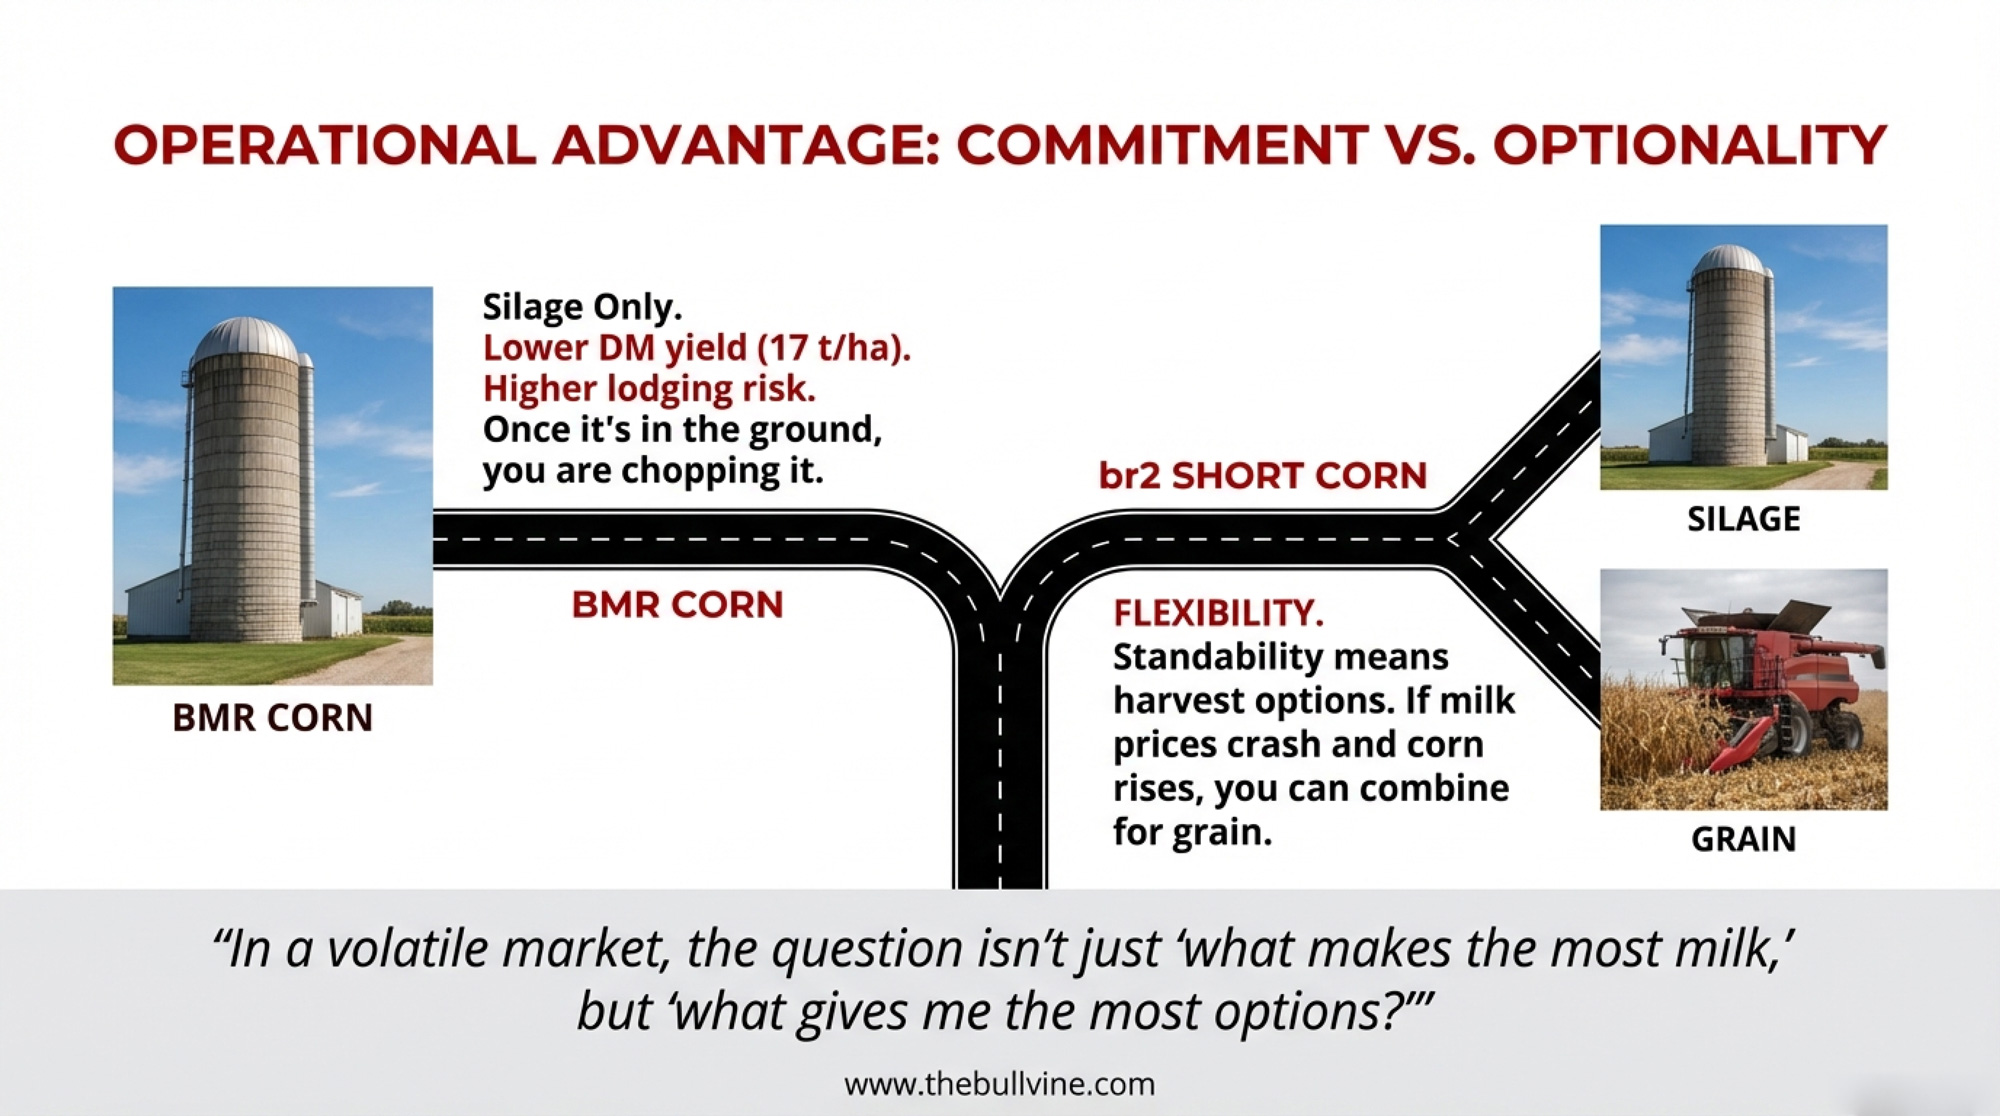
In the MSU trial, br2’s DM yields ran comparable to — or better than — tall conventional. One short-stature hybrid hit 21 t/ha, compared with 19 for tall and just 17 for BMR. That yield drag on BMR is well-documented: the MSU paper cites Sattler et al. (2010) and Wallau et al. (2022), noting that “bm3 corn typically has lower DM yields and poorer standability compared with conventional corn.”
Think about what that means in practice. You plant 200 acres of br2 for silage, but milk prices soften mid-summer while corn basis strengthens. You redirect acres to grain without taking a yield hit. Try that with BMR, and you’re looking at lower grain yields from a hybrid that wasn’t bred for it — if it’s still standing. That’s the kind of per-acre economics that separates surviving operations from the ones that don’t make it.
| Characteristic | BMR | br2 | Advantage |
|---|---|---|---|
| DM yield vs. tall | Lower (−2 t/ha in MSU trial) | Similar or better | br2 |
| Standability | Poorer (lodging risk) | Better (low green snap) | br2 |
| Harvest flexibility | Silage only (poor grain yield) | Can pivot to grain | br2 |
| NDFD (in vitro) | Highest (63%) | Mid-range (57–60%) | BMR |
| Total-tract OM digestibility | 52.2% | 59.9% | br2 |
| Total-tract starch digestibility | 98.1% | 99.3% | br2 |
| ECM (mid-lactation cows) | 36.5 kg/d | 37.6 kg/d | br2 |
| Feed efficiency (ECM/DMI) | 1.51 | 1.43 | BMR |
| Market optionality | None (committed to silage) | High (silage or grain) | br2 |
In a volatile corn market, the question isn’t just “which hybrid makes the most milk?” It’s “which hybrid gives me the most options if the market moves?”
Are You Shipping Fat or Shipping Energy?
br2 silage dropped fat percentage versus both tall and BMR — 4.32% vs. 4.43% tall and 4.45% BMR (P < 0.01 for both). Fat yield in kg/d wasn’t significantly different from tall (P = 0.39) or from BMR (P = 0.14).
The percentage drop matters in markets that pay on component test. Before you react, look at how ECM is actually calculated.
The widely used Tyrrell and Reid formula adjusts milk to 3.5% fat and 3.2% protein:
ECM (lb)=(0.327×milk lb)+(12.95×fat lb)+(7.65×protein lb)
A BMR cow producing 71 lb of milk at 4.45% fat (3.1 lb fat) and 3.46% protein (2.4 lb protein) ships roughly 82 lb ECM.
A br2 cow producing 73 lb of milk at 4.32% fat (3.2 lb fat) and 3.47% protein (2.5 lb protein) ships roughly 84 lb ECM.
Two more pounds per day despite the lower fat test — because the volume gain and protein bump more than offset the fat-percentage drop. The fat coefficient (12.95) is heavy, but it multiplies pounds of fat, not percentage.
(The MSU paper used NASEM 2021’s NEL-based ECM equation, which weights fat, protein, and lactose somewhat differently. The illustration above uses the simpler Tyrrell and Reid formula common in extension materials. Both point in the same direction.)
Where the Component Markets Are Heading
CoBank’s Corey Geiger laid out the butterfat oversupply case in a September 24, 2025, Knowledge Exchange report titled “Soaring demand for dairy foods fueled a US butterfat boom, but cheesemakers need milk protein levels to catch up.”
“For 10 years, the market couldn’t supply enough of it, and now there’s an oversupply — it’s almost too much of a good thing,” Geiger wrote. Cheesemakers, he noted, “strive for a protein-to-fat ratio near 0.80.”
By January 2026, he was telling Brownfield that 2026 could be tough for dairy producers, with butterfat production running 5–6% above year-ago and spot butter already down nearly $0.70 from its August high. If you’re watching where component markets are heading, br2’s lower fat test may actually align with the shift.
But if your FMMO class puts steep weight on fat test, run the math both ways with your own component differential before committing acres.
Does Italy Confirm the Pattern?
A separate trial in the Journal of Dairy Science (Catellani et al., published online February 25, 2026; Università Cattolica del Sacro Cuore with UW-Madison’s Ferraretto) pointed in the same direction from a different angle.
Their brachytic hybrid was fed to 24 Holsteins (SSC group at 82 ± 31 DIM, TSC group at 85 ± 34 DIM), which produced 1.8 kg more milk per day (44.7 vs. 42.9 kg/d) with higher energy density but on lower DMI (25.0 vs. 26.8 kg/d). More milk from less feed. The opposite intake mechanism from MSU.
Two trials, same production direction, two different pathways. Catellani’s trial only compared brachytic to tall — no BMR head-to-head. Treat them as converging evidence, not interchangeable results.
The MSU paper referenced an earlier, unpublished version of Catellani’s work (cited as a personal communication) that “found no effects on DMI, ECM, or BW.” The published version told a different story — a reminder of why peer-reviewed data matters more than conference-corridor results.
The Revenue Math — and What It Costs to Get There
Our August 2025 coverage cited a +5 lb ECM figure based on preliminary, pre-publication data. The peer-reviewed numbers came back lower. Here’s what the published data actually support, using the statistically significant br2-vs-BMR comparison:
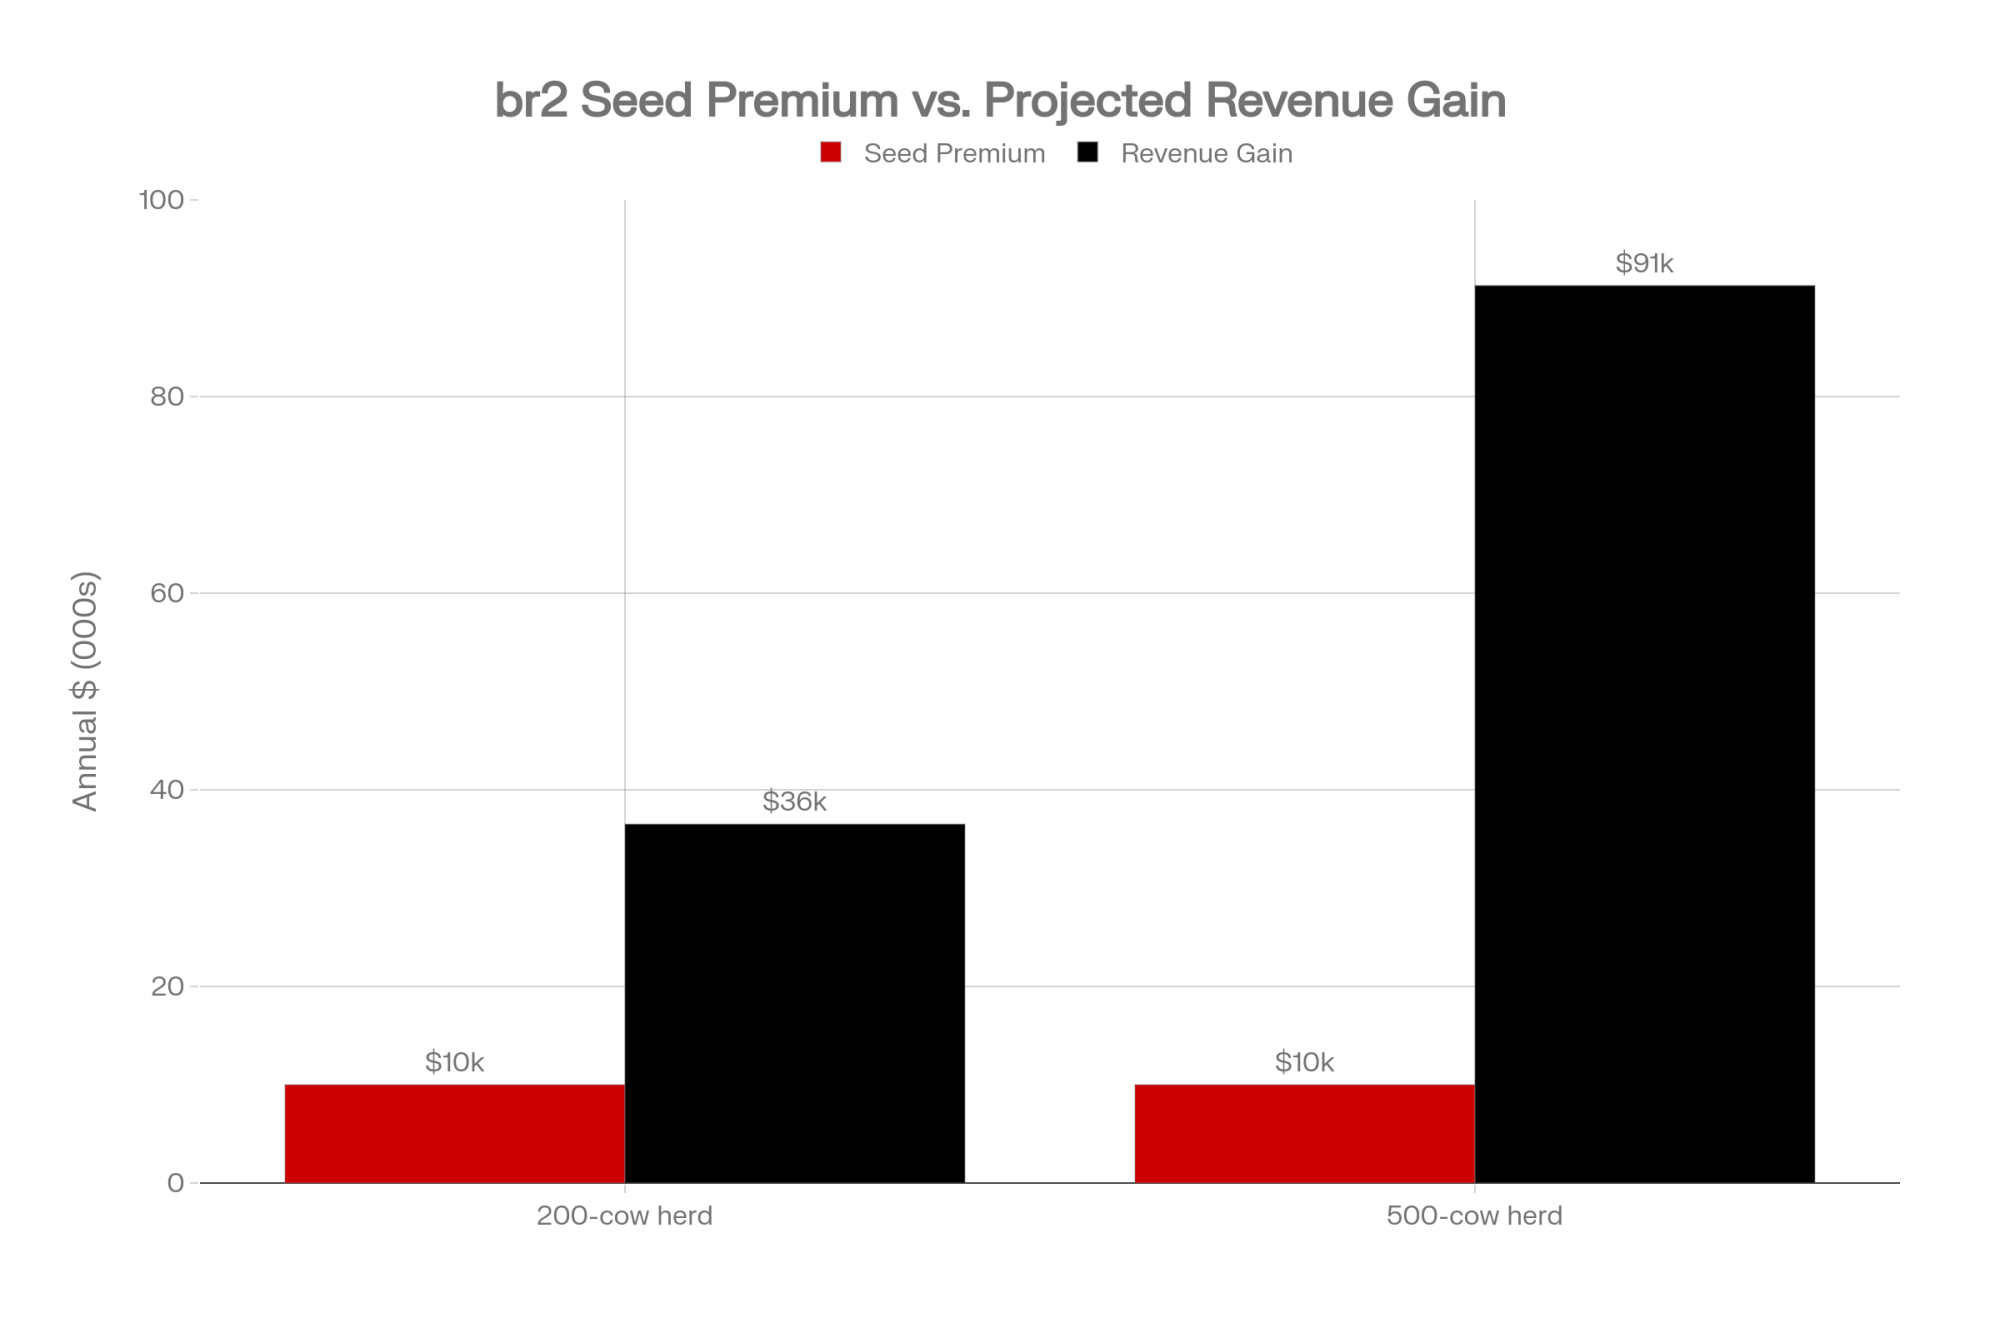
| Herd Size | Daily ECM Gain (~2.5 lb) | Annual Added Revenue (@ $20/cwt) |
| 200 cows | 500 lb/d | ~$36,500 |
| 500 cows | 1,250 lb/d | ~$91,250 |
| 1,000 cows | 2,500 lb/d | ~$182,500 |
Assumptions disclosed: +2.5 lb ECM/cow/day (1.1 kg/d, P = 0.01, from Sarmikasoglou et al.), full-year feeding, $20/cwt blended pay price. Your real-world response depends on hybrid, growing conditions, lactation stage, and ration design.
The Seed-Cost Compounding Effect
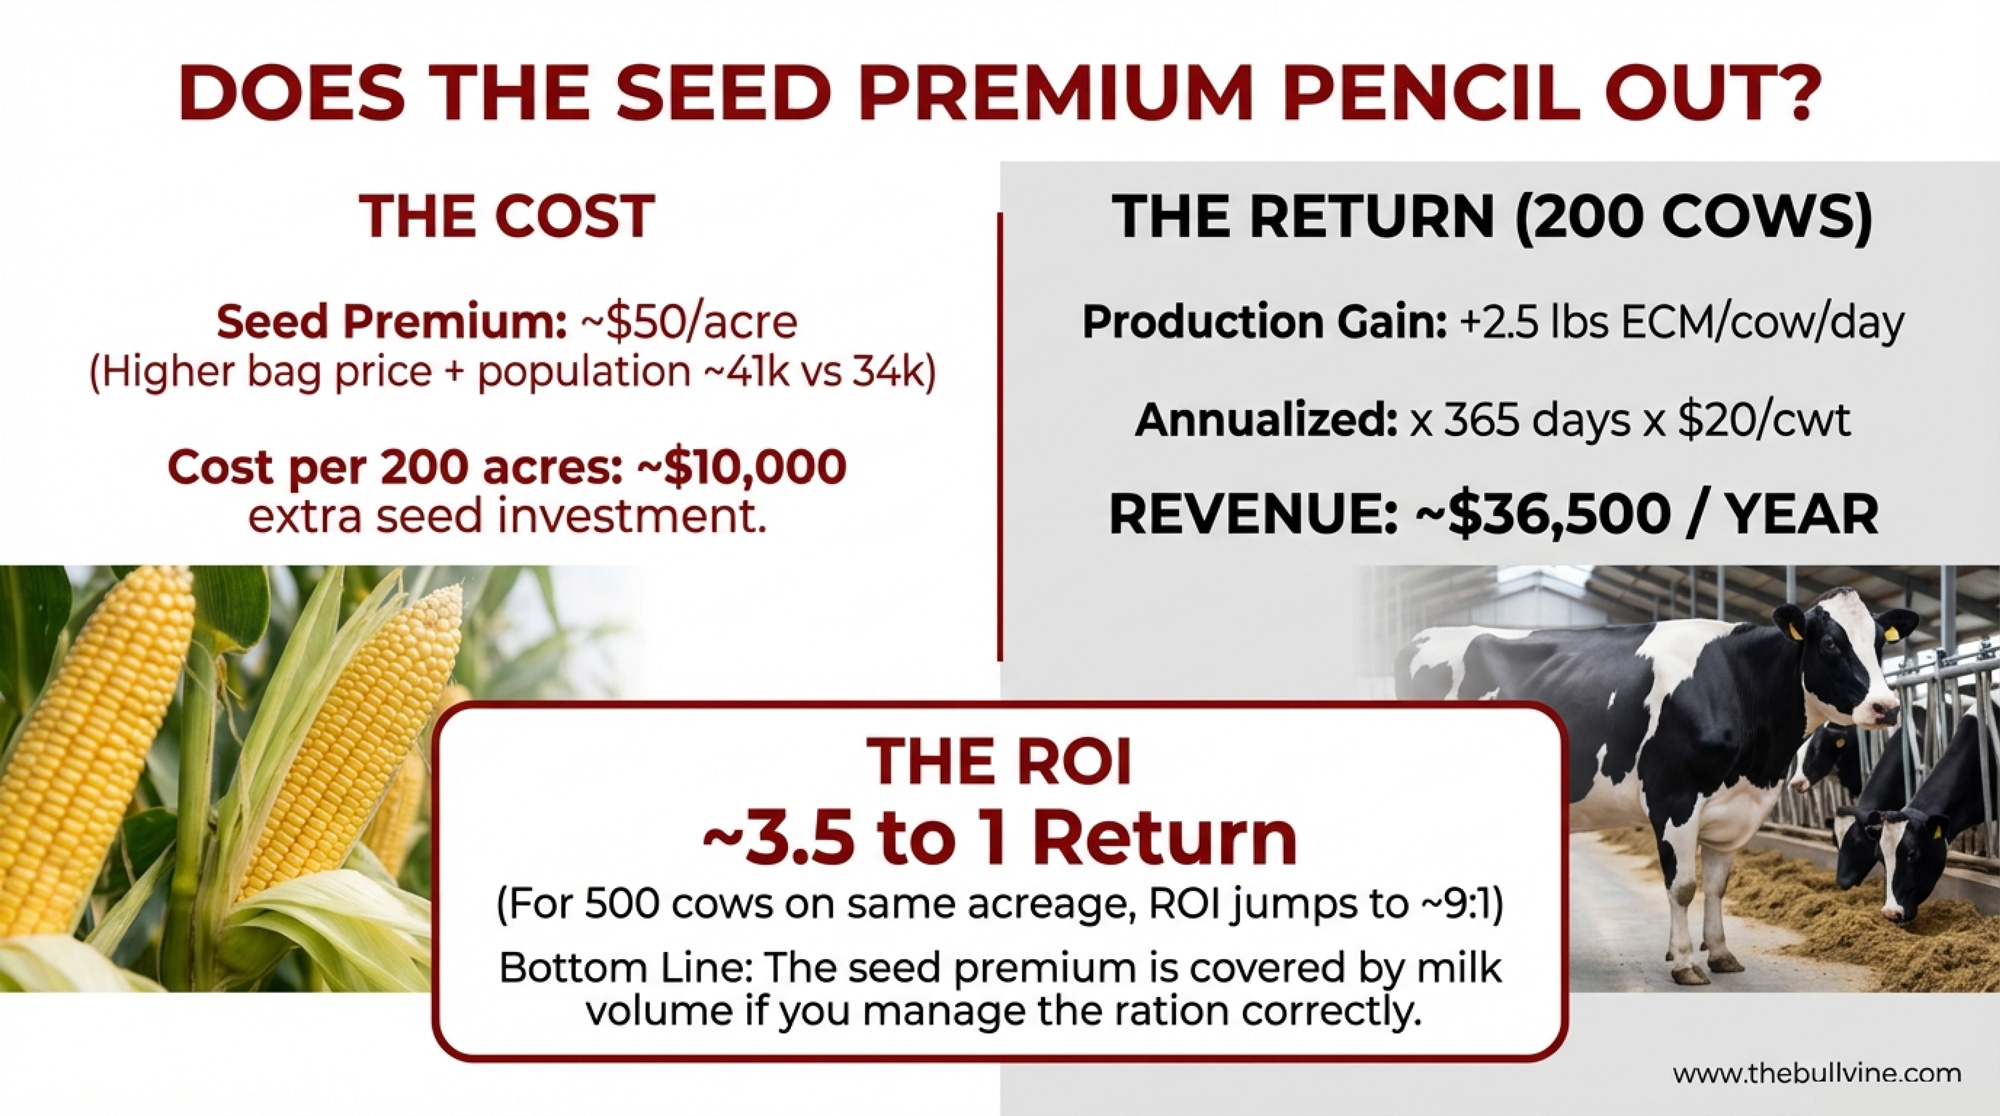
Seed premiums for br2 run roughly 15–25% higher per bag, and the per-acre gap widens because Preceon growers plant at significantly higher populations. Bayer’s February 2026 press release reported Ground Breakers planted Preceon at an average of approximately 41,600 plants per acre, compared to roughly 34,500 for traditional corn.
MSU Extension’s Jonathan LaPorte published “Seed Selection: Beyond Yield and Disease Resistance (Corn Edition)” on July 10, 2025, with a cost-comparison tool showing how bag-price differences narrow or widen dramatically depending on seeding rate. When both bag price and seeding rate climb simultaneously — as they do with Preceon — the per-acre premium compounds.
| Variable | Conventional | br2 (Preceon) | Premium |
|---|---|---|---|
| Seeding rate (plants/acre) | 34,500 | 41,600 | +20% |
| Seed cost per bag | ~$280 | ~$335 | +20% |
| Cost per acre | $110–120 | $160–175 | ~$50 |
| Total premium (200 acres) | — | — | $10,000 |
| Annual revenue gain (200 cows) | — | — | $36,500 |
| Annual revenue gain (500 cows) | — | — | $91,250 |
| ROI multiple (200 cows) | — | — | 3.5:1 |
| ROI multiple (500 cows) | — | — | 9.1:1 |
At a conventional seed cost of roughly $110–120/acre (a typical 80,000-kernel bag at ~$280 and 32,000–34,500 seeds/acre), a 20% seed premium plus a 20% increase in population pushes br2 toward $160–175/acre. That’s roughly $50/acre more.
On 200 silage acres, that’s about $10,000 in extra seed. Set against a 200-cow herd’s projected $36,500 annual ECM advantage, the math pencils to roughly 3.5:1. A 500-cow herd on the same acreage? Closer to 9:1.
Then there’s the equipment question. All silage respondents in Bayer’s 2025 post-season survey reported “achieving target moisture at harvest” with “comparable packing and processing characteristics relative to traditional corn,” according to Bayer’s February 2026 press release. Header modifications for short corn may carry a meaningful cost — our August 2025 coverage cited estimates of $15,000–22,000 per machine based on conversations with Midwest equipment dealers, though no independently verified figure has emerged from the 2025 Ground Breakers feedback. Newer machines appear to adapt better, but expect setup changes and a learning curve in year one. Talk to someone who’s actually chopped it at your latitude before you assume your setup works as-is.
What Your Nutritionist Needs to Hear Before Planting
br2’s advantage over BMR in this trial ran through intake — cows ate 2.0 kg/d more on br2. If nobody adjusts the ration to let that extra forage intake substitute for purchased energy — corn, bypass fat, commodity supplements — you’re feeding more total DM without optimizing the economic return.
The cow produces more milk, but your feed costs rise alongside it. That’s the difference between a management strategy and a feed bill problem.
To get this right, you need to move past the “wait and see” approach.
The 2-Minute Nutritionist Drill
Don’t let your nutritionist treat br2 like “shorter tall corn.” If you do, you’re leaving money on the table. Ask these three questions before the seed hits the soil:
- The Displacement Question: “If these cows eat 2.0 kg more forage, which purchased energy source are we dropping first to keep the ration cost-neutral?”
- The Component Pivot: “Our fat test might dip 0.13 points. Does the volume gain at 3.5% ECM still beat our current BMR margin at today’s component prices?”
- The Starch Strategy: “Since br2 has higher total-tract starch digestibility (99.3%), can we pull back on ground corn without losing peak milk?”
By forcing these questions early, you ensure that the extra 2.5 lb of Energy Corrected Milk isn’t “eaten up” by an unadjusted feed bill. You aren’t just looking for a nutritionist who can balance a ration; you’re looking for one who can balance a budget.
That’s not a nutrition question. It’s a feed-cost question.
Where the Data Gets Thin
No trial result transfers perfectly. Be skeptical in these spots:
Early lactation, high-starch rations. The MSU trial tested mid-lactation cows (150 DIM) on higher-NDF, lower-starch diets. Whether br2’s advantage holds in early lactation on aggressive starch levels is an open question.
The paper cited Oba and Allen (2000), which documented BMR’s advantage with fill-limited, early-lactation cows. Separately, Utah State researchers (Holt et al., 2013) fed BMR vs. conventional corn silage from calving through 180 DIM to 28 multiparous Holsteins and found a 2 lb ECM/cow/day advantage for BMR. That’s the feeding window where BMR still has the strongest evidence.
Feed-efficiency-constrained operations. Feed efficiency (ECM/DMI) was significantly lower on br2 than BMR — 1.43 vs. 1.51 (P < 0.01). If you’re purchasing most of your forage, that efficiency gap costs real money per ton DM.
Regions without adapted hybrids. Bayer’s Preceon portfolio is expanding to 16 hybrids for 2026, including five new additions in the 100–118 day relative maturity range, with geographic expansion into the Northeast. It’s still available only through the Ground Breakers program, with a minimum commitment of 40 acres.
“The roadmap is deliberate,” said Lindsey Battle, Preceon Strategy and Launch Lead, in Bayer’s February 2026 press release. “We are scaling in phases — validating performance across more acres, more environments, and more management systems as we move to full commercial launch.” Bayer’s Ader told Hoosier Ag Today in December 2025 that the biotech version of the short-stature trait “should start launching in 2027 and will continue scaling from that area.”
One trial, one year, one drought-stressed Michigan field. The MSU team planted all five hybrids on 2.19-hectare (5.4-acre) plots on Marlette fine sandy loam, used Vita Plus Titanium inoculant, and sent samples to Cumberland Valley Analytical Services.
They wrote: “Further studies in other growing environmental conditions seem warranted.” VandeHaar presented the same data at a Balchem webinar on November 4, 2025. His lab is part of a USDA-funded multi-university effort, with related trials underway at the University of Maryland under Dr. Fabiana Cardoso. But multi-site, multi-year data doesn’t exist yet.
What br2 Means for Your 2026 Silage Acres
- Frame your hybrid decision around br2 vs. BMR, not br2 vs. tall. That’s where the ECM data are statistically significant (P = 0.01). If you’re switching acres, switch BMR acres first — especially on fields where standability has cost you.
- Run the fat-test math with your own component differential. Fat percentage dropped 0.13 points on br2 vs. BMR, but fat pounds per day were not significantly different (P = 0.14). Use the ECM formula with your herd’s actual numbers. CoBank’s Geiger flagged in September 2025 that butterfat oversupply is already compressing prices. If that trend continues, the fat-test trade-off shrinks.
- Budget ~$50/acre extra for seed. Ground Breakers in 2025 averaged 41,600 plants/acre vs. 34,500 for traditional corn. The premium comes from both a higher bag price and higher planting rates.
- Think about the insurance policy. In a volatile corn market, br2 gives you a harvest pivot that BMR never will. Every br2 acre can go to grain if the milk-to-corn ratio shifts.
- If your fat premium is steep and stable, br2’s 0.13-point fat-test drop versus BMR could narrow the margin. But fat pounds per day were statistically identical (P = 0.14). Model both sides.
- If seed cost is the concern, roughly $10,000 extra (about $50/acre) on 200 acres against a projected $36,500 ECM gain (200 cows) or $91,250 (500 cows) yields a 3.5:1 to 9:1 return — assuming the trial response holds at full or even half strength.
- If you’re feeding early-lactation cows on high-starch rations, BMR still has the stronger evidence base — both from Oba and Allen (2000) and Holt et al. (2013). Target br2 to mid-lactation pens or fields where standability and dual-purpose optionality matter most.
- 30-day action: Sit down with your nutritionist and agree on the ration adjustment plan before seed goes in the ground. The MSU data show br2 cows eat 2.0 kg/d more than BMR cows. How does that extra intake flow through your ration economics — and what purchased feed does it replace?
- 90-day action: After chopping, run a separate silage analysis on your br2 versus your conventional or BMR storage. Get NDFD, starch, and OM digestibility from Cumberland Valley or equivalent — so you have your own total-tract comparison by fall.
- 365-day action: Compare ECM per acre across hybrids at year-end. Not ECM per cow — ECM per acre planted. That’s the number that captures yield, quality, and optionality together.
- If you can get into the Ground Breakers program, trial br2 on 10–20% of your silage acres this spring. Bayer is expanding to 16 hybrids across the 100–118 day RM range for 2026. Target your most wind-exposed fields or BMR ground that hasn’t clearly outearned conventional on ECM per acre. Map those acres for separate harvest and dedicated storage to keep your feeding comparison clean.
Key Takeaways
- If you’re feeding mid‑lactation cows off BMR today, MSU’s first br2 trial says short‑stature corn can ship about 2.5 lb more ECM per cow per day, even when BMR wins on NDFD in the lab.
- If your milk cheque still rewards volume plus protein more than fat test, a ~0.13‑point fat‑% drop on br2 looks a lot smaller next to higher ECM and CoBank’s warning that butterfat is already drifting into oversupply.
- If you can afford roughly $50/acre extra in seed, the projected ECM gain pencils out to about $36,500/year on 200 cows and $90,000+ on 500, which more than covers the seed premium as long as your ration allows extra forage intake to replace purchased energy.
- If standability and flexibility matter on your acres, br2 gives you similar or better DM yield than tall corn, less lodging risk, and the option to shell for grain — something BMR’s lower yield and standability don’t offer.
- If you’re thinking about going all‑in, remember the fine print: lower feed efficiency than BMR, better data for BMR in early‑lactation high‑starch diets, and only one Michigan plus one Italian trial so far — this is a “trial 10–20% of your acres and watch the ECM per acre” move, not a flip‑the‑whole‑farm overnight move.
The Bottom Line
DeVries tested Preceon for standability and found a feeding advantage. VandeHaar’s lab gave it a P-value. The question now isn’t whether br2 can outproduce BMR — one peer-reviewed trial says it did. The question is whether it will do the same on your ground, in your growing year, fed to your cows.
Pull your field-by-field yield records from 2025. Convert to tons DM per acre. Multiply by your nutritionist’s milk-per-ton estimate for each silage. Which hybrid actually won on ECM per acre — and does it match the one you’re about to put in the planter?
Complete references and supporting documentation are available upon request by contacting the editorial team at editor@thebullvine.com.
Learn More
- Unlock Hidden Dairy Profits Through Lifetime Efficiency: How Modern Genetics and Strategic Nutrition Can Cut Feed Costs by $251 Per Cow – Breaks down a 30-day regional action plan to slash feed bills using precision breeding for Residual Feed Intake, delivering a roadmap for implementing the exact genetic and nutritional adjustments needed to maximize your herd’s metabolic potential.
- $90K Less Margin, 214K More Cows: Beef‑on‑Dairy, Calf Checks and Your 2026 Survival Playbook – Exposes the structural $100,000 revenue gap facing mid-sized herds in 2026 and delivers a battle-tested survival playbook that uses component premiums and beef-on-dairy revenue to shore up your margins against softening milk prices.
- Sorghum: The Drought-Tolerant Feed That’s Changing the Dairy Game – Reveals how disruptive low-tannin BMR hybrids and steam-flaking technology can slash irrigation costs by 60% while matching corn’s energy output, providing a high-margin alternative for operations fighting water scarcity or volatile corn futures.
 The Sunday Read Dairy Professionals Don’t Skip.
 The Sunday Read Dairy Professionals Don’t Skip.
Every week, thousands of producers, breeders, and industry insiders open Bullvine Weekly for genetics insights, market shifts, and profit strategies they won’t find anywhere else. One email. Five minutes. Smarter decisions all week.


