


Guelph pulled 171,843 Ontario bulk tank tests and found the biggest FFA drivers weren’t your pump. They were your close-up pen, your ration, and three-incentive-day months.
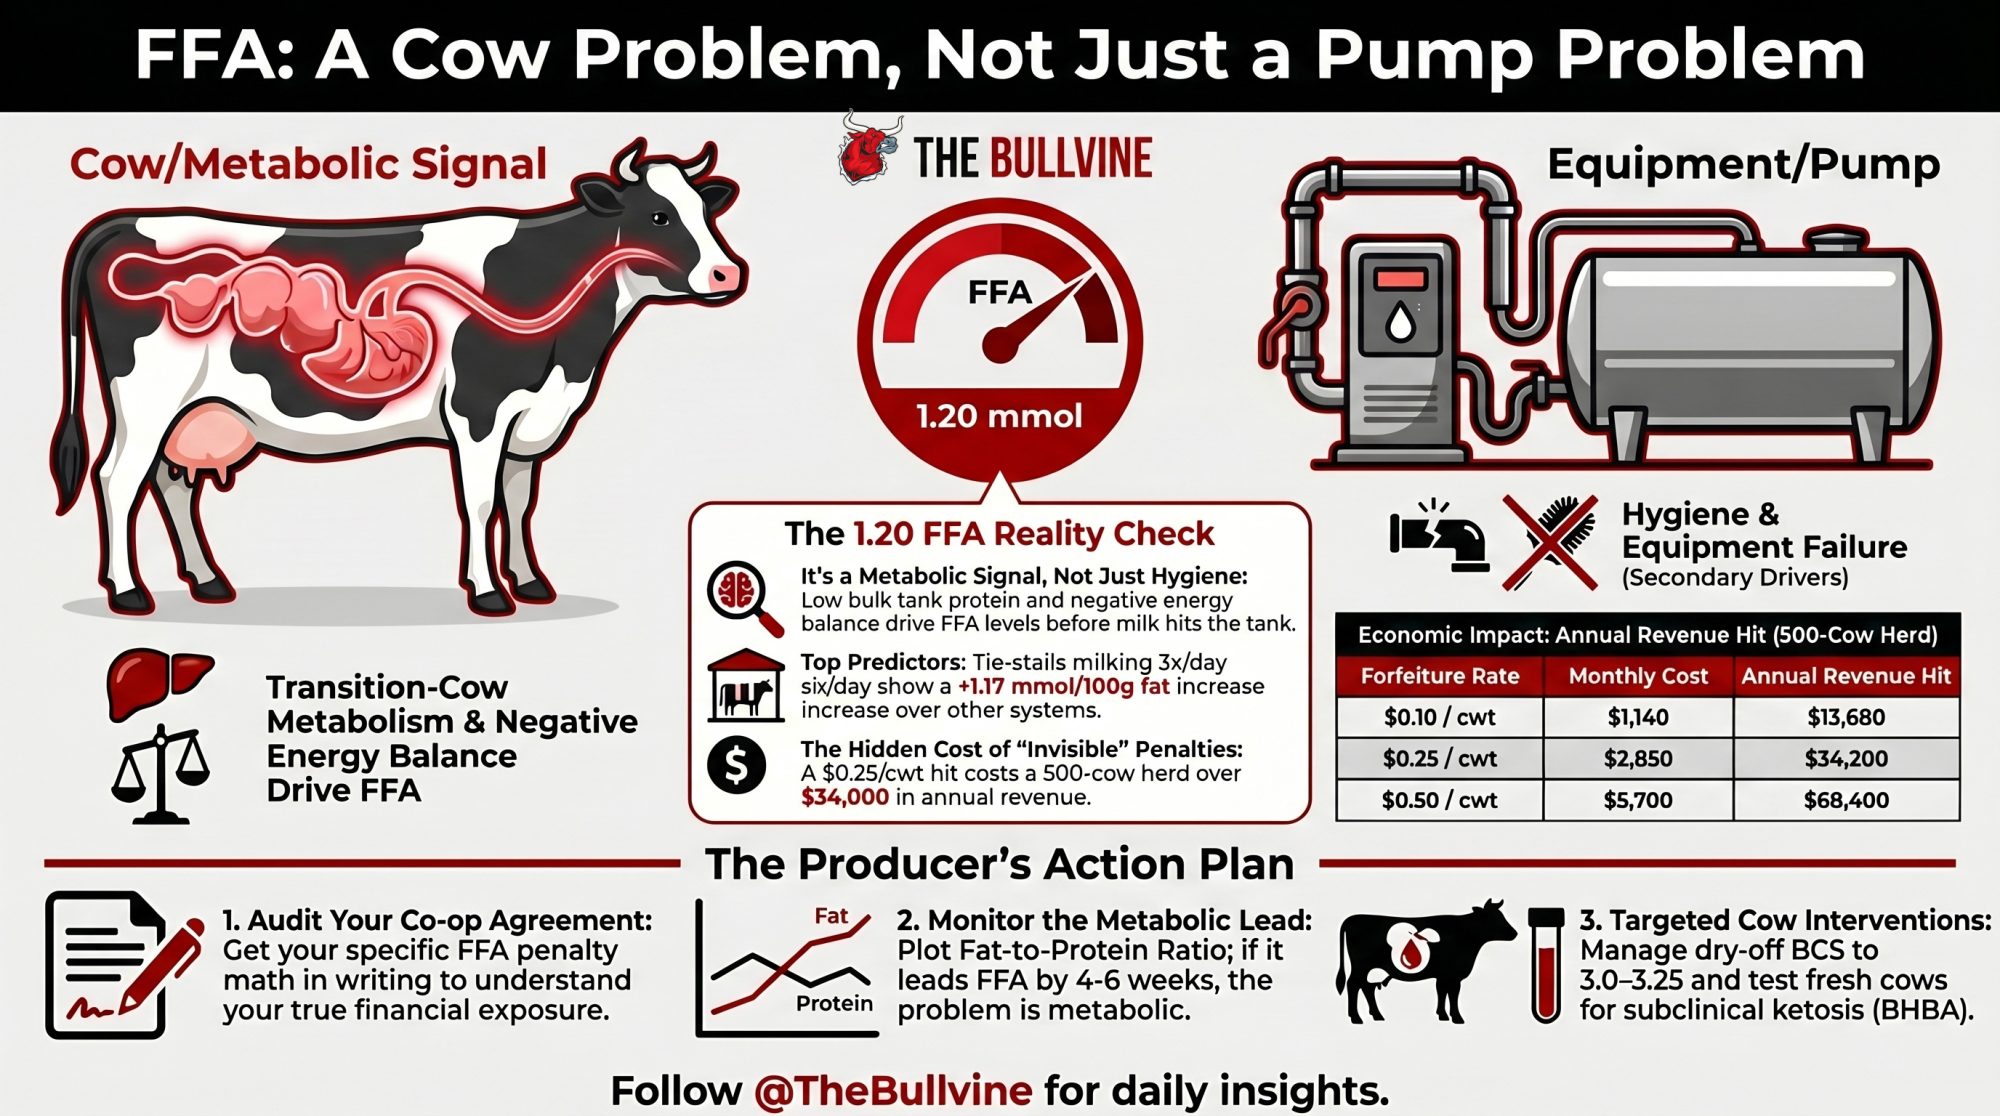
Executive Summary: Guelph researchers Hannah Woodhouse and Dr. David Kelton, working across 171,843 monthly bulk tank observations from every Ontario dairy farm over four years, have reframed the 1.20 mmol FFA sensory threshold as a transition-cow test, not a hygiene test — the significant predictors of an elevated month are lower bulk tank protein, non-parlor milking systems, three-incentive-day months, and higher bacteria counts, not your pump.¹ A companion 293-farm paper (J. Dairy Sci., Feb 2025) attached a 1.17 mmol/100g fat association to the tie-stall + ≥3×/day combination alone, and flagged that no operation in the 109-farm parlor freestall subsample posted a monthly average at or above 1.20.² The FFA penalty side lives almost entirely in the processor-specifications clause of your co-op supply agreement — BC Milk confirms FFA doesn’t affect provincial-pool pay, and no major North American processor posts its $/cwt FFA schedule publicly.³ On a 500-cow US herd producing 11,400 cwt/month at March 2026’s $16.16/cwt Class III, a $0.10–$0.50/cwt hit pencils at $13,680–$68,400/year, and FMMO reform’s 85–93¢/cwt Class-price reductions just tightened the margin in front of that number.⁴ The fastest intervention isn’t a facilities spend: plot FPR alongside FFA for six months, start fresh-cow BHBA testing at ≥1.2 mmol/L cutoff, move dry-off BCS into the 3.0–3.25 window, and layer in rumen-protected choline at the Arshad et al. (2020) dose.⁵ The demographic layer matters too — with US heifer inventories at a 20-year low and CoBank projecting 438,844 fewer dairy heifers in 2026, any parity-shift cull decision runs into $3,000+ replacement costs.⁶ The operator action: pull your last six bulk tank reports and your supply agreement this week, and get your co-op’s FFA penalty math in writing.

In January 2023, Dairy Farmers of Ontario field staff triggered an investigation on a 40-cow Holstein tie-stall that had averaged 1.32 ± 0.50 mmol FFA/100g fat across 752 samples between August 2018 and October 2022 — with more than 54% of samples at or above the 1.20 sensory threshold. The milking equipment tech had already been out. Vacuum fine. Liners fine. Filters changed at every milking, three times a day.
University of Guelph researcher Hannah Woodhouse and Dr. David Kelton walked into that barn and found what the data had been whispering all along: cracked milking unit claws with curdled milk inside, unequal milking intervals as short as three hours, and palm fat fed at 300 g/head/day with the dose pushed higher during fall DFO incentive months.¹ The equipment problems were real. But the ration, the intervals, and the calendar were doing most of the damage — and the equipment tech was never going to solve any of that alone.
That anonymized case farm sits at the clinical end of a bigger story. A body of peer-reviewed Guelph work covering every Ontario dairy farm over four years has reframed the 1.20 mmol bulk tank free fatty acids line as a transition-cow and management test, not a hygiene test.¹,² And the penalty exposure that follows it isn’t on your pay statement — it’s in the “processor specifications” pass-through buried in your co-op supply agreement.
What the 1.20 Bulk Tank Free Fatty Acid Threshold Is Really Measuring
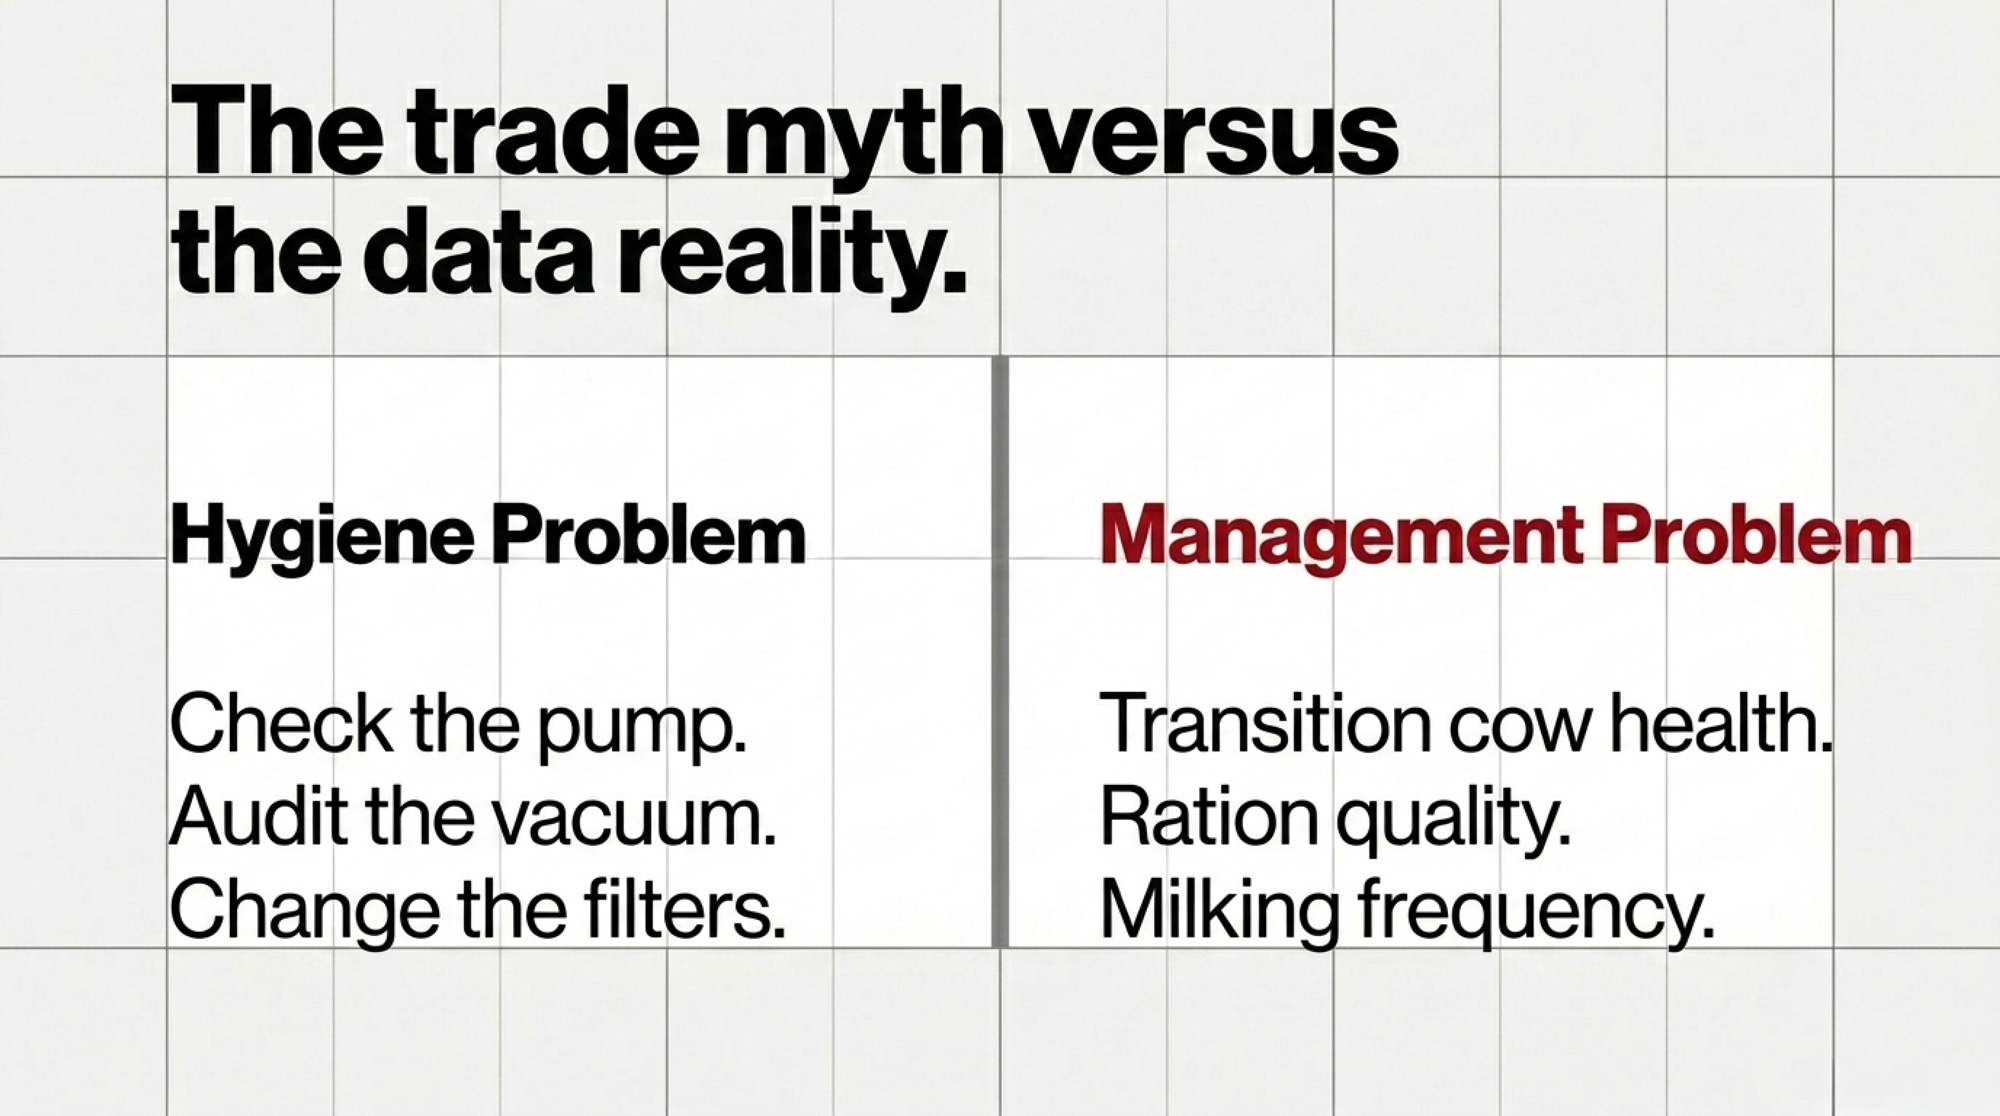
Start with what the 1.20 line does to milk. Above it, trained taste panels pick up rancid notes in butter and cheese, foam stability drops, and cheese-milk coagulation suffers.¹ That’s why processors penalize above threshold. And it’s why the trade spent a decade calling this a hygiene problem — check the pump, audit the vacuum, change the filters.
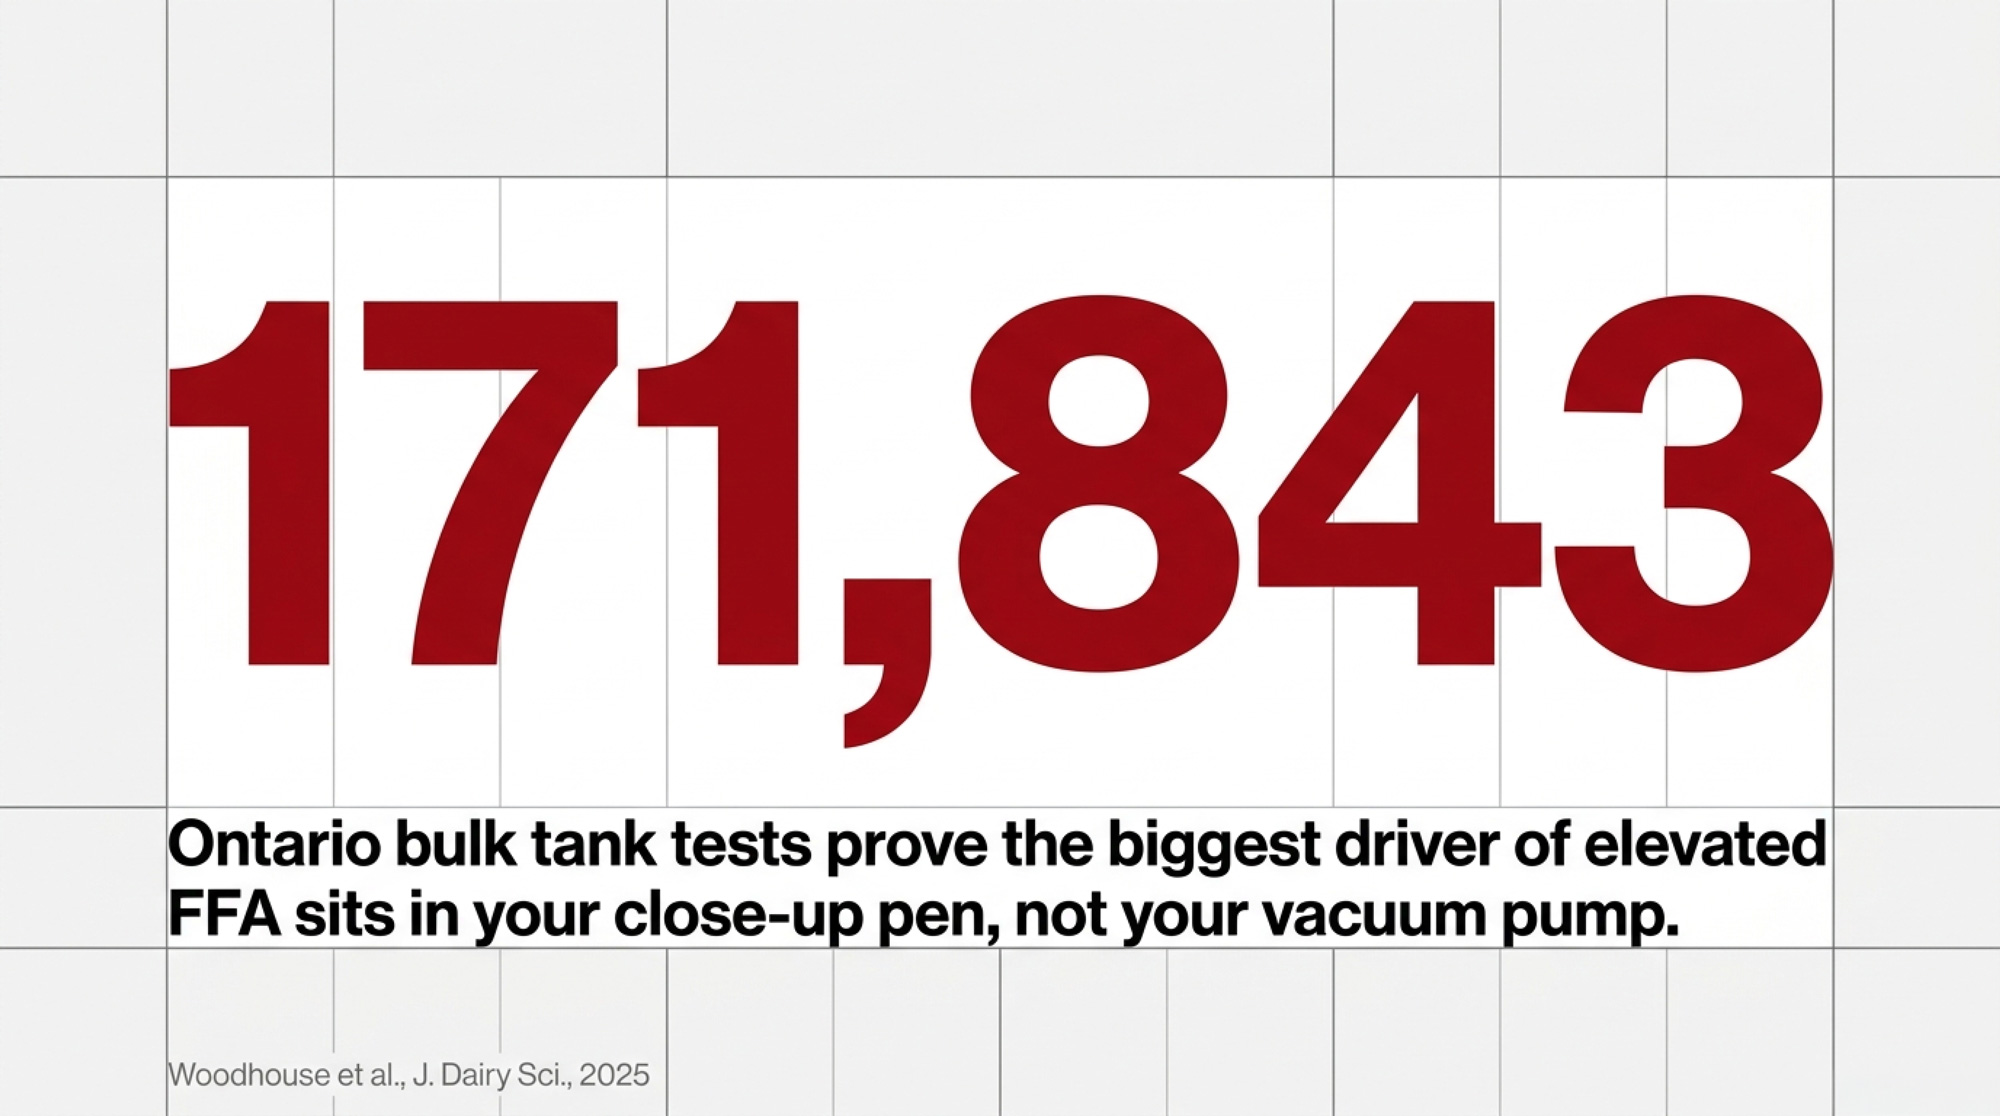
The Woodhouse et al. JDS Communications work tells a different story. Monthly bulk tank averages across all 3,771 Ontario dairy farms, August 2018 through December 2022, totaled 171,843 observations. Roughly 7% of those monthly averages sat at or above 1.20, and the significant predictors of an elevated month weren’t hardware — they were lower bulk tank milk protein, non-parlor milking systems, three-incentive-day months, and higher bulk tank bacteria counts.⁷
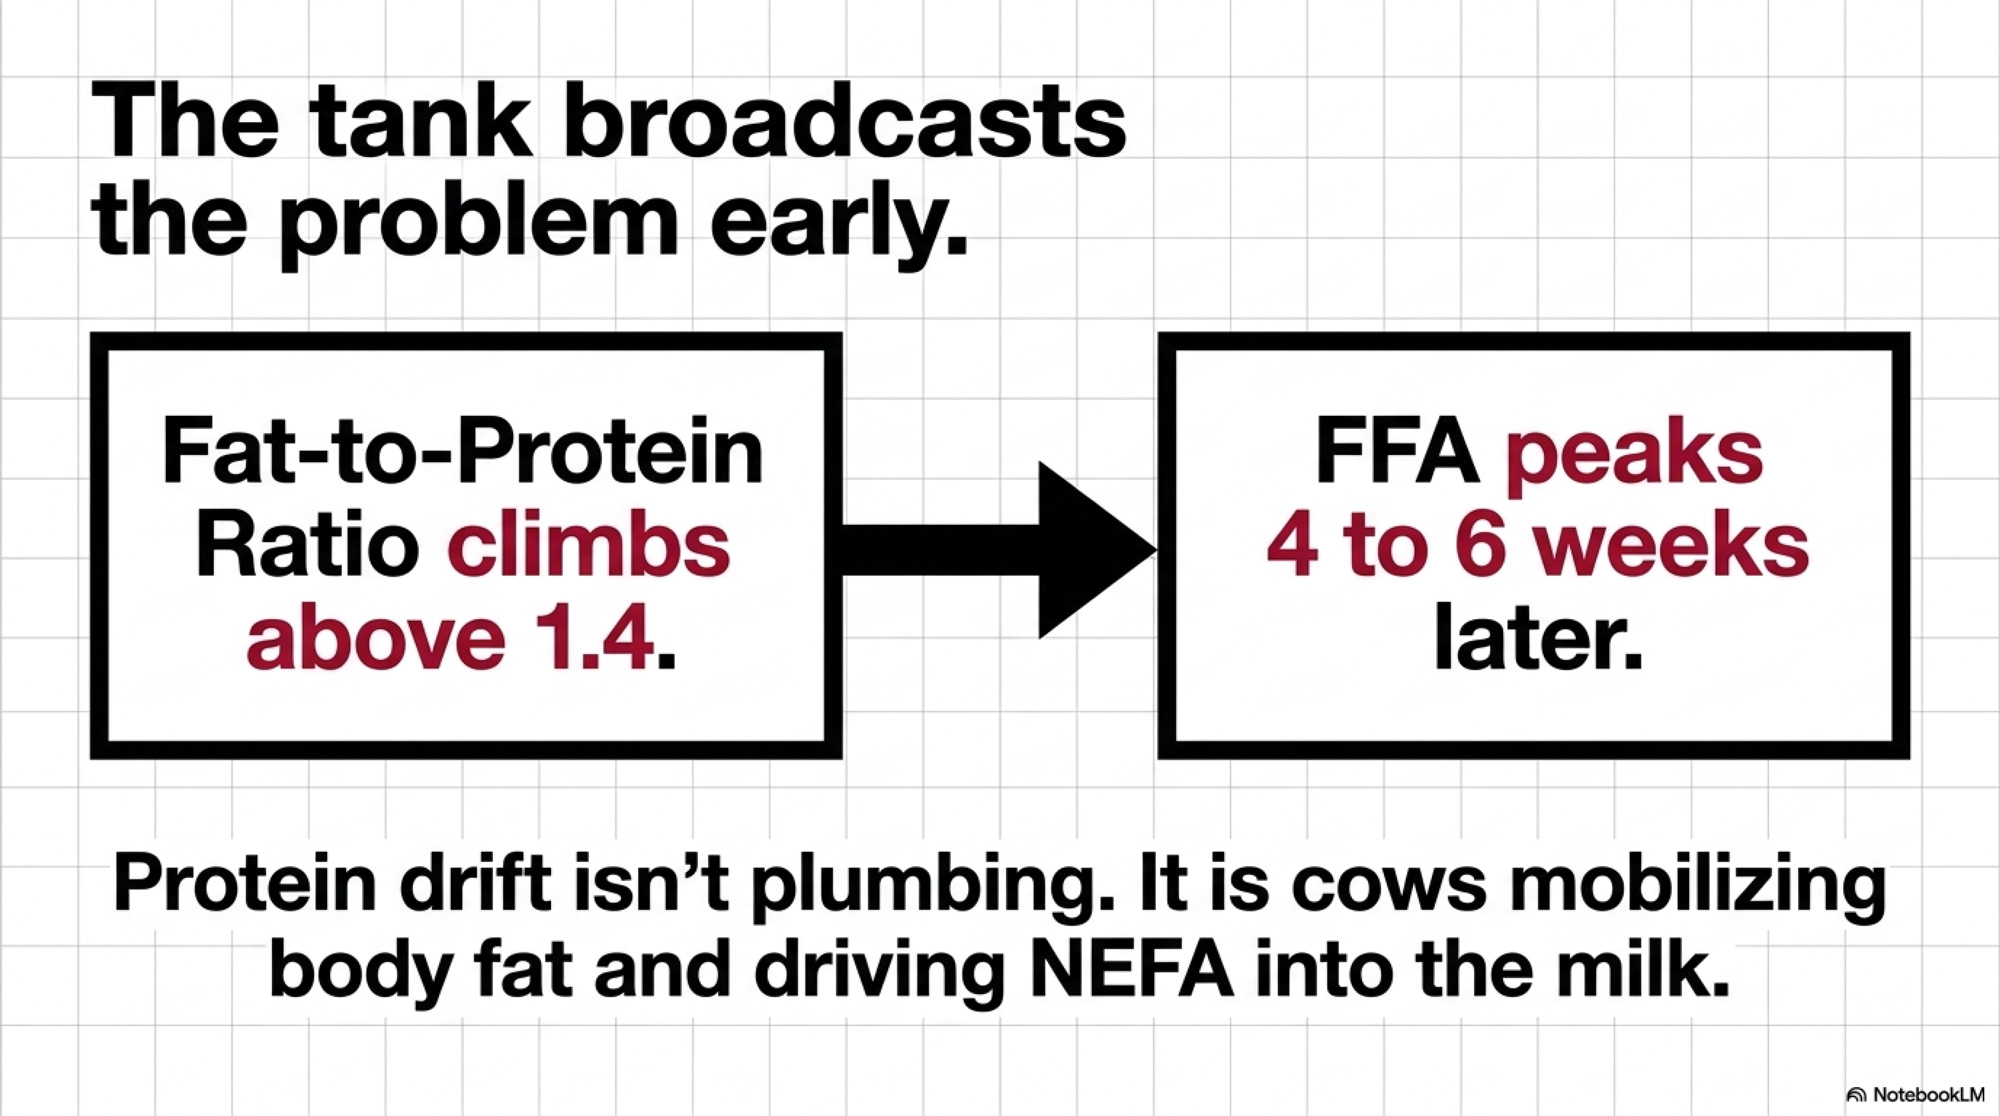
Protein drift in a bulk tank isn’t a plumbing signal. It’s a metabolic signal — cows in negative energy balance, mobilizing body fat, driving NEFA and lipase activity into milk that’s already biochemically compromised before it touches a single piece of stainless. The 1.20 line isn’t testing your milking system. It’s testing your transition cow program.
Writing for AgProud in September 2024, Woodhouse put it in producer-ready terms: dairy producers can manage individual cows, ration quality, milking frequency, and milk filter changes to reduce FFA levels.⁸ Cows and ration come first on her own list. Filters last. The paper’s predictor ranking points squarely in the same direction.⁷
| Dimension | Old industry assumption | Guelph 2024-2025 evidence | Operator action |
| Primary cause | Pump/vacuum/liner wear | Transition-cow energy deficit (low BT protein) | Call vet first |
| Key predictor | Equipment age | Tie-stall + ≥3×/day (β=1.17) | Audit housing × milking freq |
| Filter protocol | Replace more often | Filter <2×/day adds only β=0.27 | Keep, don’t over-weight |
| Seasonality driver | Summer heat on equipment | 3-incentive-day months | Map incentives to FFA peaks |
| Parlor freestall herds ≥1.20 | Common | 0 of 109 farms | Benchmark target |
Is This a Metabolic Problem or an Equipment Problem?
The Woodhouse et al. farm-factors paper (J. Dairy Sci., February 2025) put direct measurements on that question. It’s a cross-sectional study of 293 Canadian dairy farms — 238 in Ontario, 55 in British Columbia, split across 71 tie-stall, 109 parlor freestall, and 113 AMS freestall operations. Mean bulk tank FFA: 0.84 mmol/100g fat, SD 0.40, range 0.26–3.67. Ten percent of herds sat at or above 1.20.²
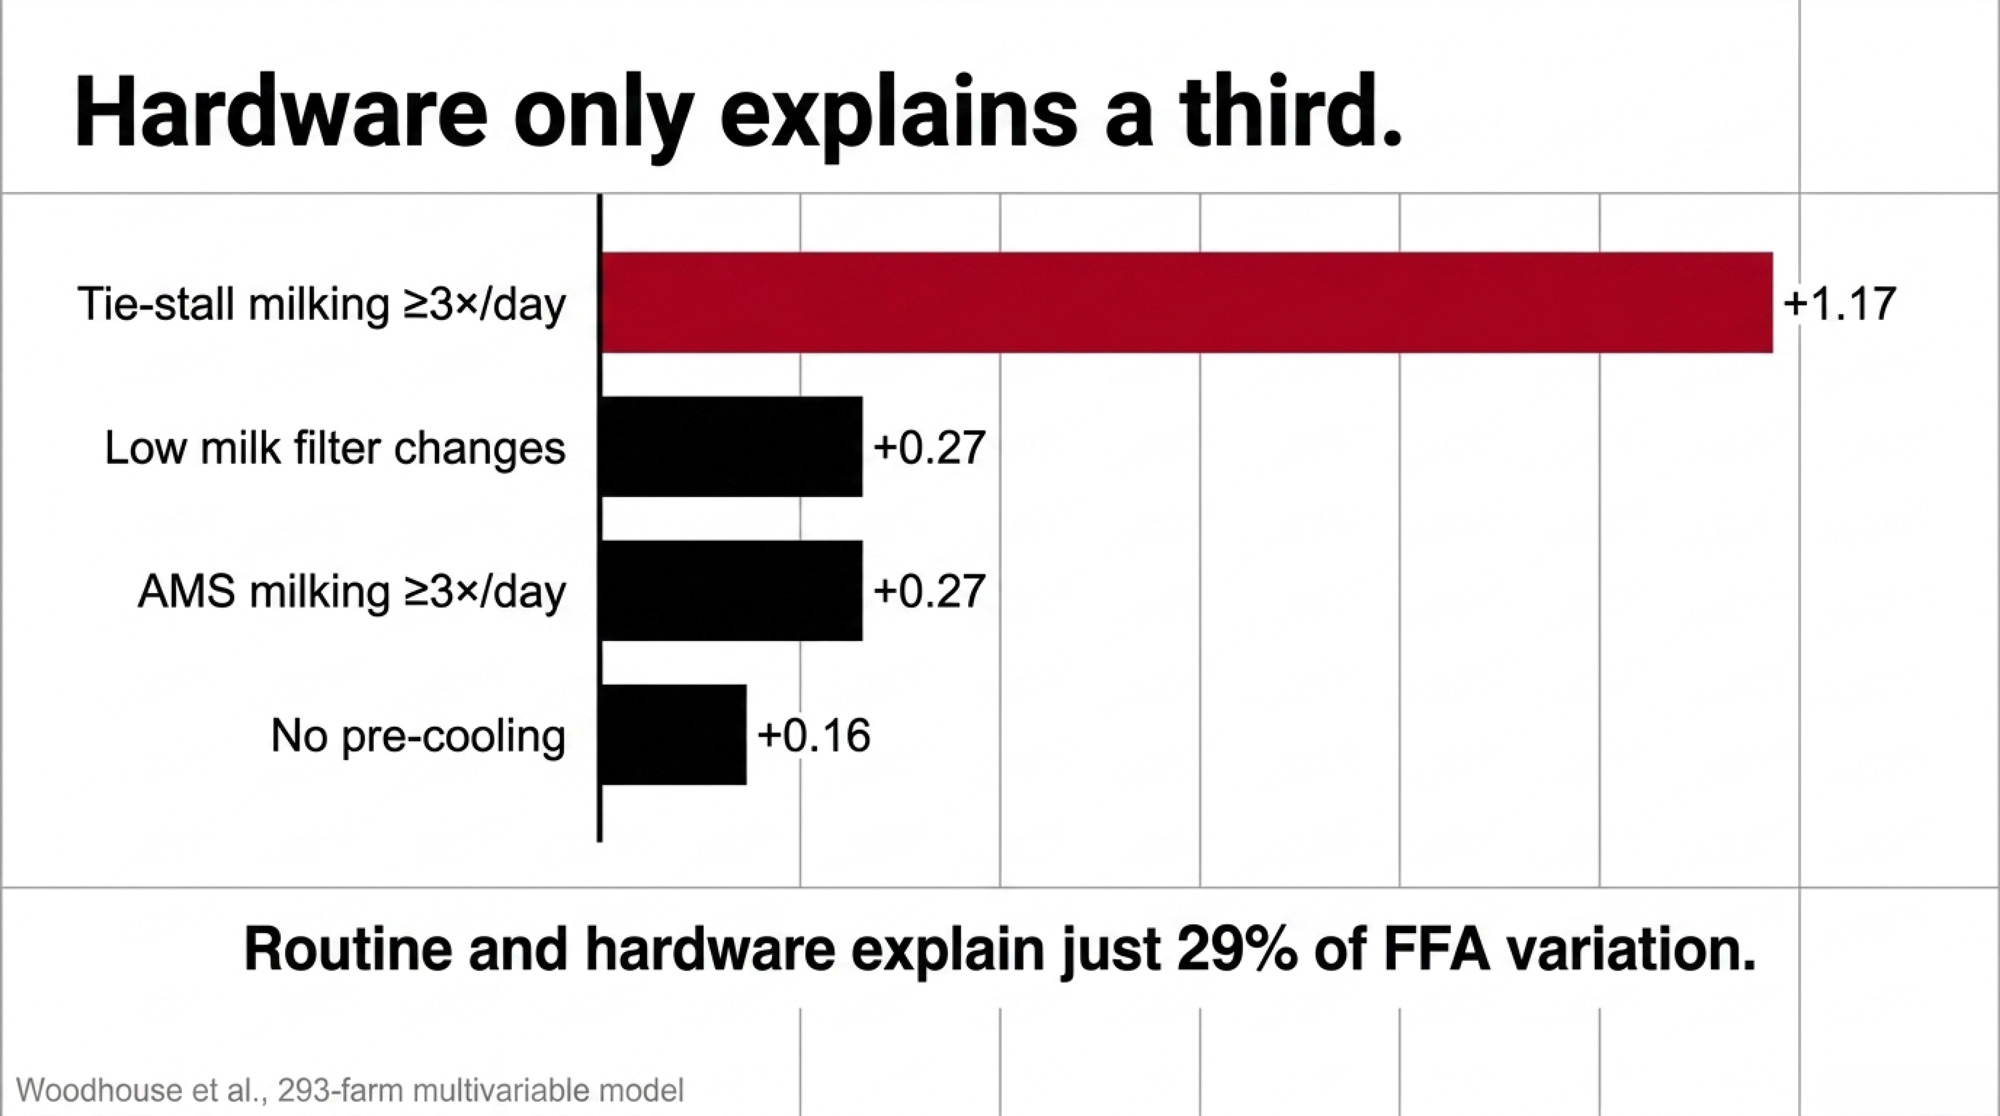
The final multivariable model is where the argument lands. Not in round numbers —in published beta coefficients:
- Tie-stall barns milking ≥3×/day: β = 1.17 mmol/100g fat (95% CI 0.76–1.59)
- AMS herds milking ≥3×/day: β = 0.27 (95% CI 0.12–0.41)
- Not changing the milk filter at least 2×/day on ≥3×/d farms: β = 0.27 (95% CI 0.10–0.44)
- No pre-cooling: β = 0.16 (95% CI 0.02–0.30)
And this one matters: **in the 109-farm parlor freestall subsample, no operation posted a monthly FFA average at or above 1.20 during the study window.**² That’s a snapshot, not a universal law. But it’s a loud snapshot.
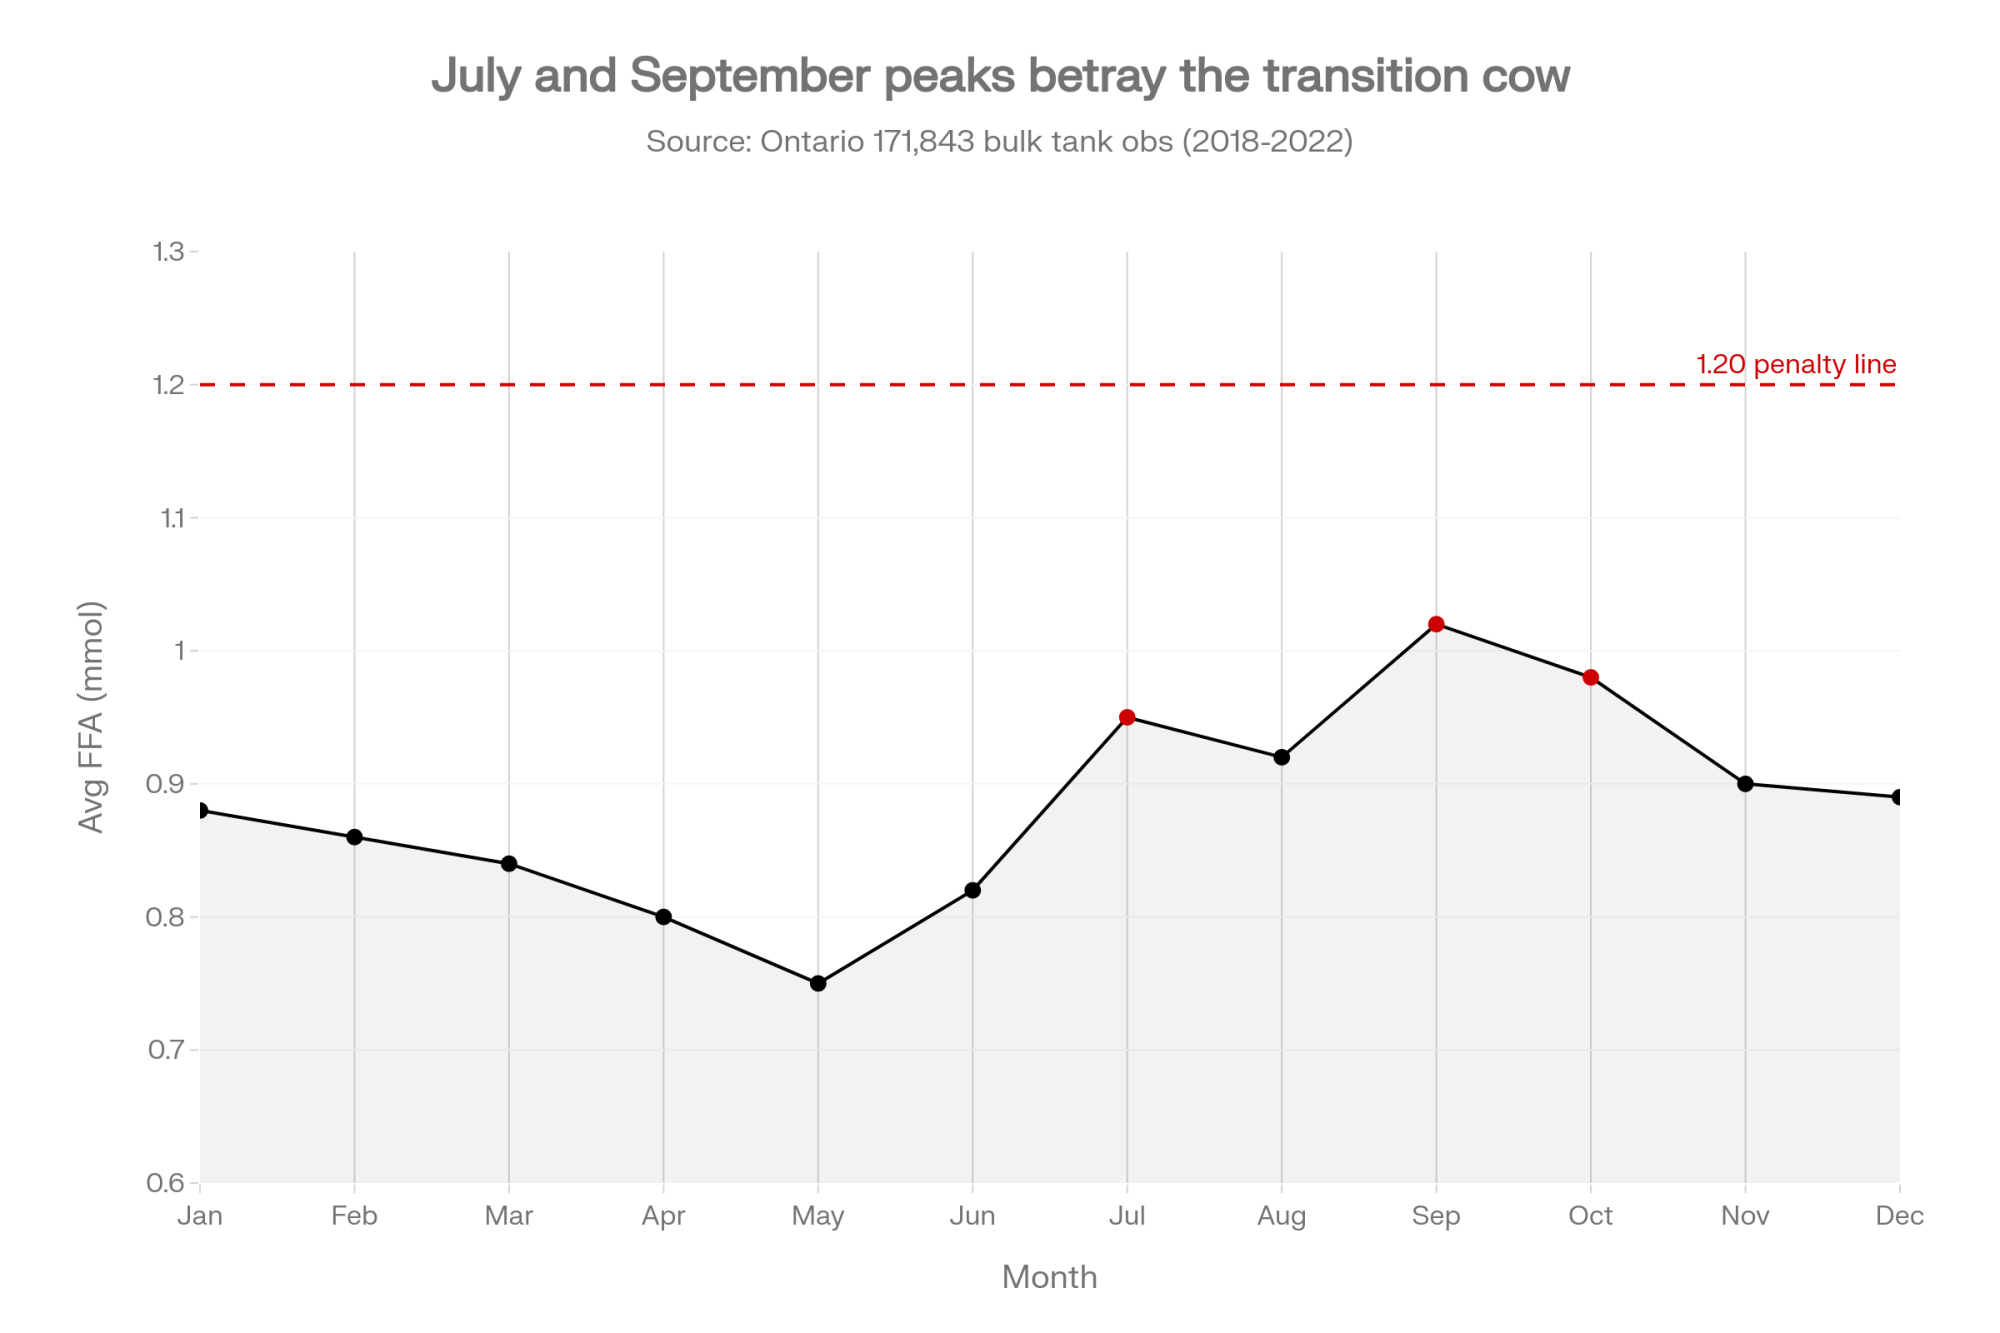
The adjusted R² on the model was 29%, which is an honest way of saying hardware and routine only explain about a third of the variation — the rest sits in cows, rations, and calendars.² Ontario’s broader surveillance closes the loop: FFA lowest in May, highest in July and September, every year.⁷ Equipment doesn’t know what month it is. Transition cows do.
What’s the FFA Penalty Actually Worth on Your Herd?
Here’s where most coverage of this paper waves a dollar figure around and hopes you don’t check the schedule behind it. We’re not going to do that.
The Canadian disclosure landscape is thinner than it looks. DFO reports FFA back to every Ontario producer on every bulk tank load.¹ BC Milk has reported FFA back to producers since August 1, 2019 — but the BC Milk Marketing Board’s own Component & Quality Testing page explicitly states that FFA “does not factor into producer’s component or quality results and has no impact to a producer pay” at the provincial-pool level.³,⁹ That doesn’t mean there’s no penalty. It means the penalty, if any, flows through the processor-specifications clause of the individual producer agreement — which is not public.
On the US side, FMMO pooling doesn’t set FFA penalties at all. Those live entirely in co-op supply agreements and processor contracts, and we could not locate a single publicly posted $/cwt FFA penalty schedule from a major North American processor or co-op at publication. What is public is the penalty mechanism: above threshold, the plant either discounts the load, downgrades it out of cheese milk, or diverts it to a lower-value class. The dollar hit depends on your co-op, your plant, and your class mix.
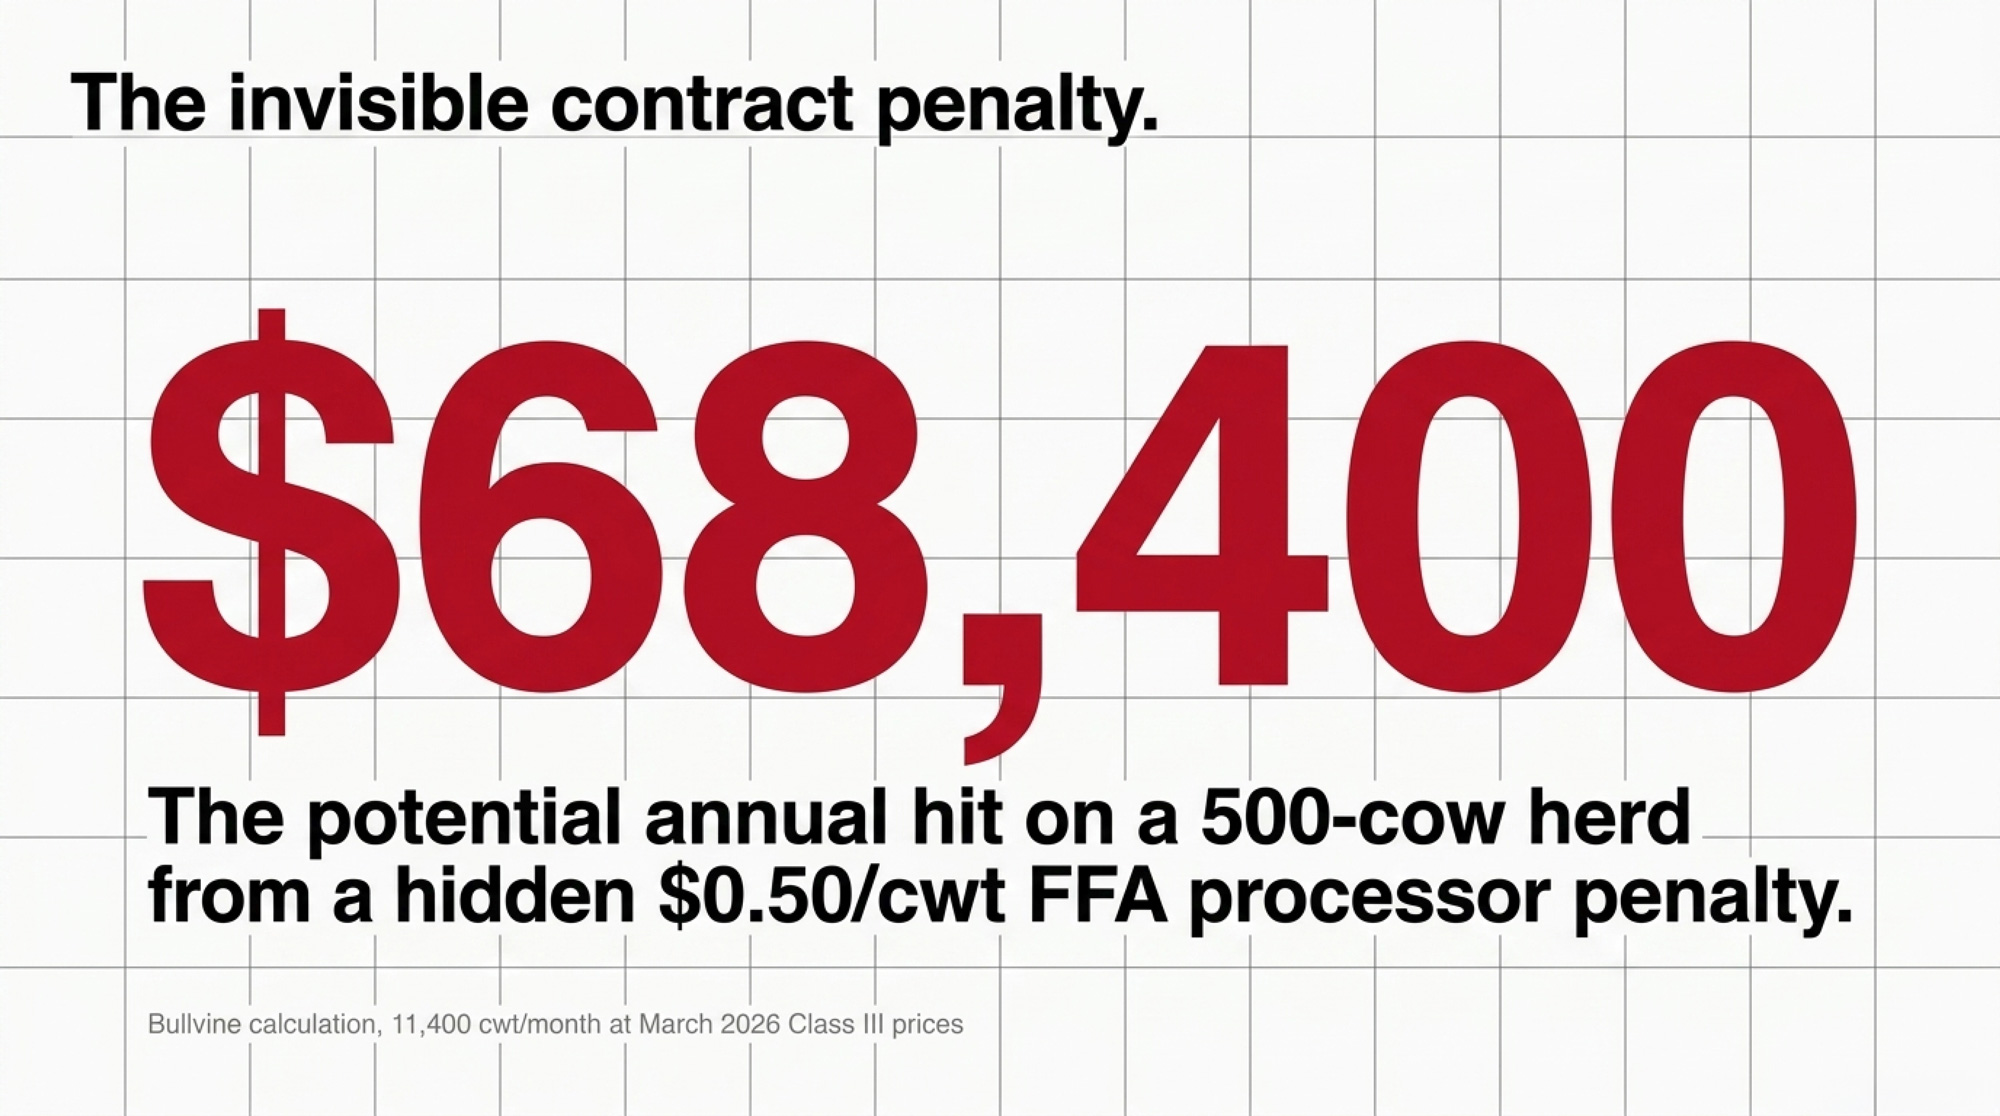
So the barn-math in this piece is a worked example with reader-supplied inputs, not a documented exposure. Here’s the frame for a 500-cow US herd:
- 500 cows × 75 lb/cow/day × 30.4 days ÷ 100 = 11,400 cwt/month.
- At the USDA AMS-announced March 2026 Class III price of $16.16/cwt, gross milk value ≈ $184,224/month.¹⁰
- Multiply 11,400 cwt by your own co-op’s FFA forfeiture ($/cwt) to size your exposure.
| Illustrative $/cwt Forfeiture | v | Annual Cost | % of Annual Gross |
| $0.10/cwt | $1,140 | $13,680 | 0.6% |
| $0.25/cwt | $2,850 | $34,200 | 1.5% |
| $0.50/cwt | $5,700 | $68,400 | 3.1% |
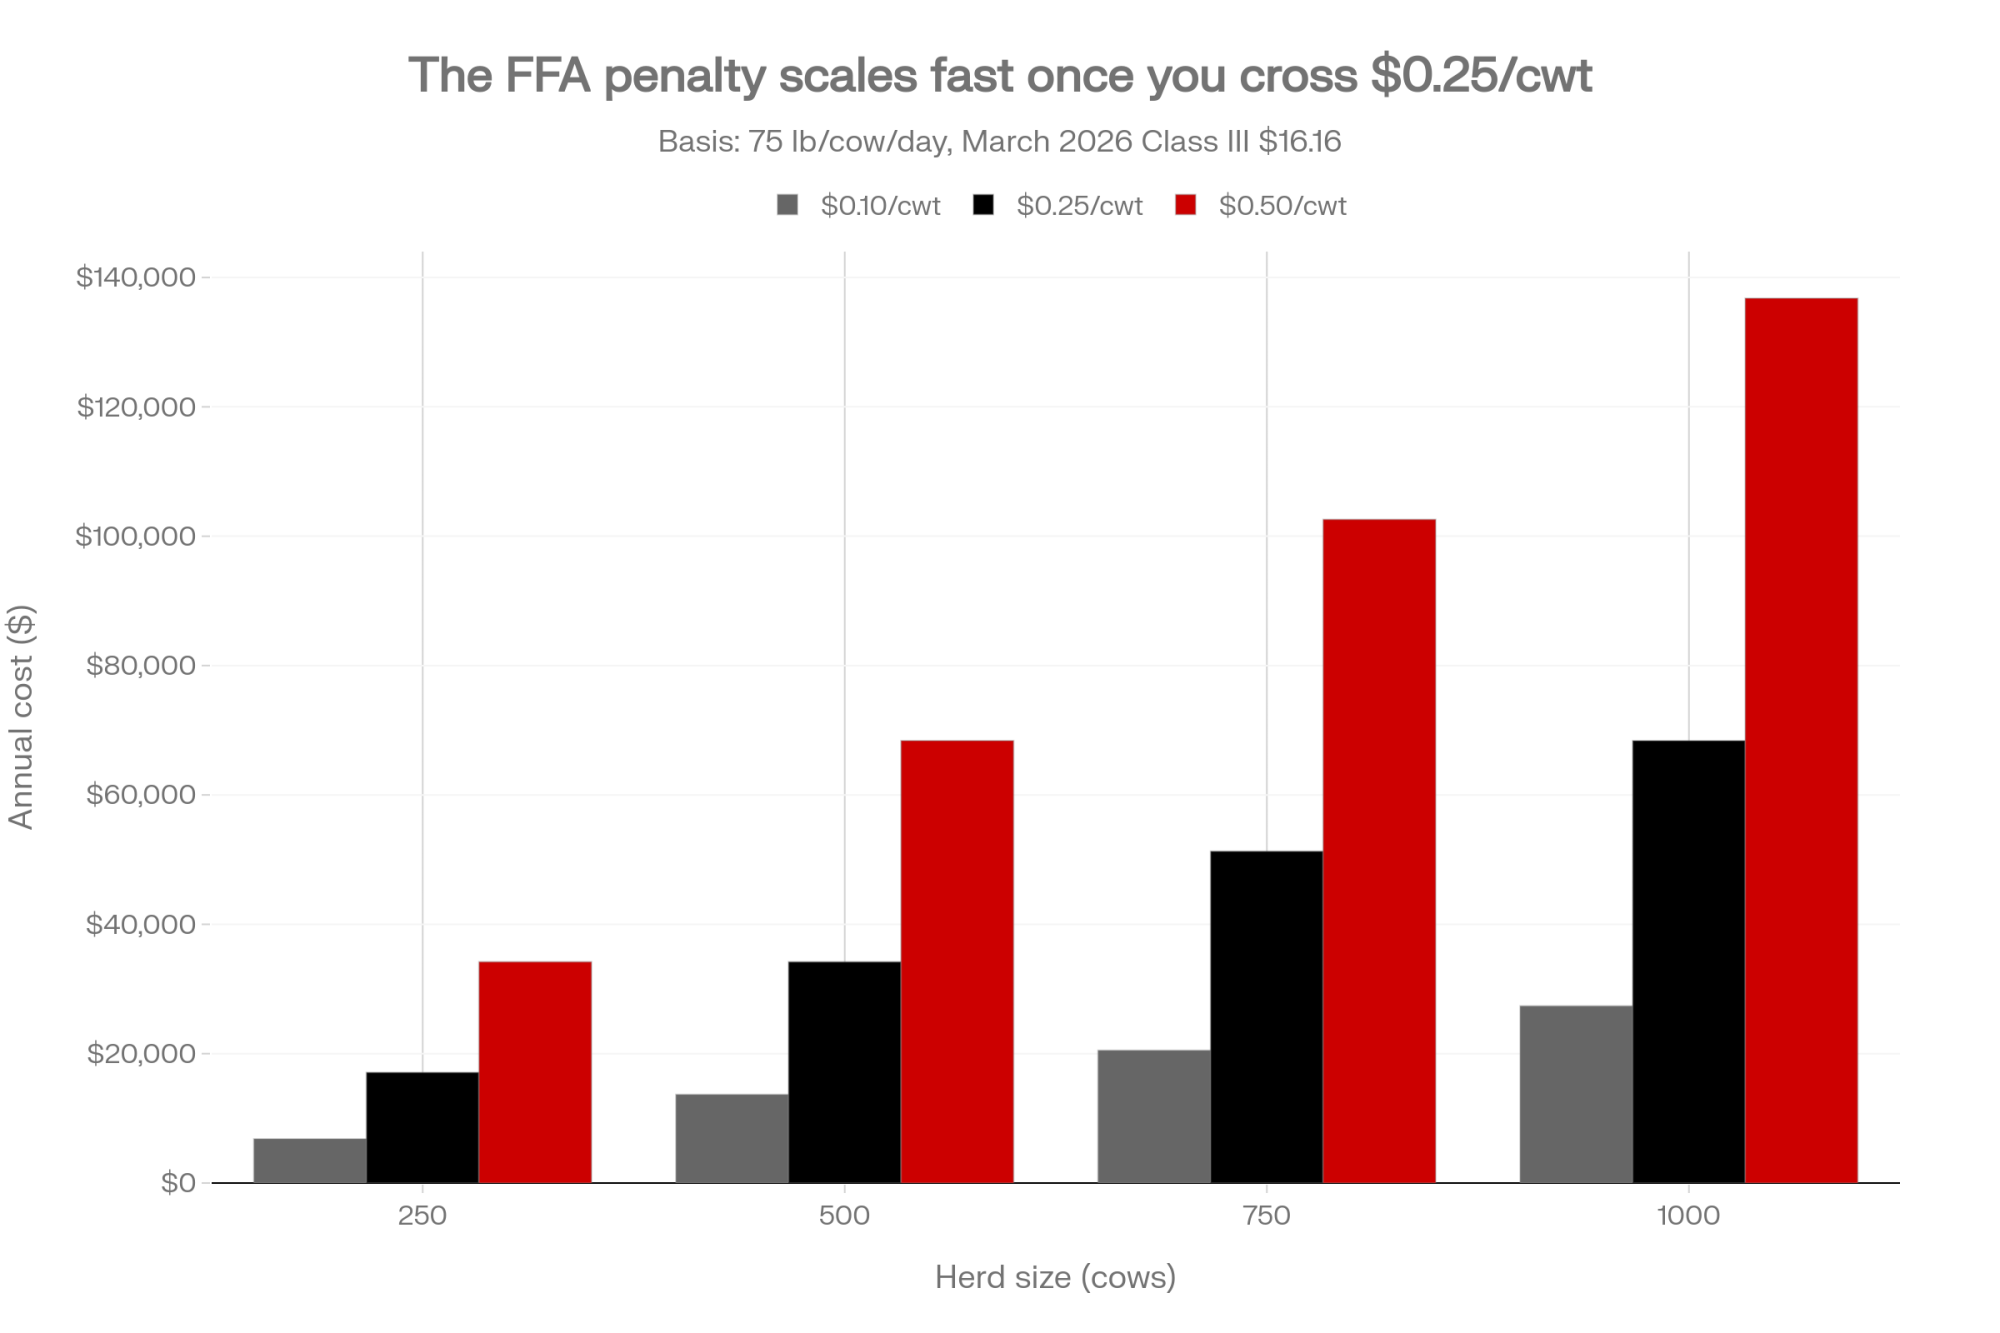
Halve the herd to 250 cows at the same production and price and the middle line pencils at about $17,100/year. Whatever your co-op’s number is, it’s not a rounding error — and the only way you’ll know it is to pull the agreement. That’s the point of the contract-audit step in the next section.
Did FMMO Reform Make the US FFA Penalty Sharper?
Federal milk marketing order reform took effect June 1, 2025. The USDA AMS final rule, issued January 15, 2025, after a 49-day national hearing and producer referenda across all 11 orders, reshaped component pricing formulas and raised processor make allowances:¹¹
| Product | New Make Allowance (per lb) |
| Cheese | $0.2519 |
| Butter | $0.2272 |
| Nonfat Dry Milk | $0.2393 |
| Dry Whey | $0.2668 |
The butterfat recovery factor was adjusted to 91% (from 90%), and the composition factor upgrade — updating skim milk to 3.3% true protein, 6.0% other solids, 9.3% nonfat solids to reflect modern milk — was held back six months and took effect December 1, 2025.¹¹
AFBF economist Daniel Munch put hard numbers on the gap in his September 22, 2025, Market Intel piece. Higher make allowances pulled $337 million from pool revenues in the first three months alone, with Class price reductions of 85–93¢/cwt, and the six-month composition-factor delay cost farmers roughly $100 million in compensationagainst what full reform would have delivered on the original timeline.¹²
Margin pressure pushes operators harder toward co-op production incentive signals. The Ontario analysis flagged three-incentive-day months as a significant predictor of elevated FFA.⁷ Fat supplements rise. Marginal cows get pushed. The quality penalty — whatever your agreement says it is — then bites exactly the milk you overproduced. Neither side of that loop appears as a line item on the pay statement.
The Fastest Intervention That Doesn’t Cost $50,000
Before spending a dollar on facilities, run the JDS finding backward. Pull three bulk tank reports. Calculate fat-to-protein ratio. Penn State Extension flags a herd-level FPR above 1.4 as an energy-deficit and subclinical-ketosis signal when more than about 40% of the measured group exceeds it.¹³ A validation study refined the individual-cow cut-off to >1.42 (sensitivity 92%, specificity 65%) for subclinical ketosis.¹⁴ Twenty-minute diagnostic. Zero dollars.
Then the protocol. Do these now, not next quarter:
- This week: Pull your last six bulk tank FFA reports from your co-op quality lab and plot FPR on the same months. If FPR leads FFA by 4–6 weeks, that’s your metabolic signal.
- This week: Pull your co-op supply agreement. Find the “processor specifications” or “quality” clause and the line that references FFA. Then email your quality manager and ask, in writing, for (a) the exact $/cwt or class-downgrade math the plant applies above 1.20, and (b) what share of your last six quality adjustments was attributable to FFA. Save both answers. This is the barn-math input only you can get.
- This month: Score every cow going dry. Anything above BCS 3.5 goes into a limit-fed pre-dry pen; dry-off BCS in the 3.0–3.25 range minimizes post-calving NEFA mobilization.¹⁵ Costs labor, not capital. Tank effect lags 6–8 weeks.
- This month: Start fresh-cow BHBA testing. Blood BHBA ≥1.2 mmol/L is the widely used subclinical-ketosis cutoff with balanced sensitivity and specificity in hand-meter field work; Oetzel’s ≥1.4 mmol/L threshold marks the jump in DA and clinical ketosis risk.¹⁶ Test days 3–5 and 10–14. At ~40 calvings a month and roughly $1.00/test, that’s about $80/month.
- Within 60 days: Work rumen-protected choline into the close-up ration at the Arshad et al. (2020) meta-analysis dose of 60 g/cow/day at 25% active, from 21 days pre-calving through at least 28 days postpartum.⁵ That meta-analysis of 21 trials reported an average milk response of ~2.3 kg/day and ~0.08 kg/day fat, with substantial between-trial and between-herd variation.⁵ Balchem’s published summary of pooled ReaShure trials puts the sustained response at roughly 700 kg more milk over a standard 305-day lactation — real, but not uniform across herds.¹⁷ Ask your nutritionist for a per-cow-per-day cost based on current feed contracts; it will move with commodity markets and isn’t a single published number.
And the longer horizon:
- 90 days: Six months of FFA + FPR plotted; at least two fresh-cow BHBA cohorts logged; your co-op’s FFA penalty math on file in writing; a decision on which of the three paths below you’re actually taking.
- 365 days: Re-plot your fall FFA peak year-over-year against parity distribution and incentive-day calendar. Decide whether you can document a structural shift worth bringing to a co-op board meeting.
Filter changes still matter. The Woodhouse TTR follow-up paper (J. Dairy Sci., February 2026) found “milk too cold” alarms associated with an average FFA of 1.31 mmol/100g fat — the only alarm type with a significant increase over baseline — and more than 15% of alarm-associated samples already sat at or above 1.20.¹⁸ Real. Measurable. Worth doing. But changing the filter without fixing the transition cow problem is putting a new battery in the smoke alarm while the fire burns.
When Does an FFA Problem Become a Culling Decision?
Some FFA problems aren’t managerial. They’re demographic.
When the fall peak climbs year over year and herd average parity sits above 3.2, protocol upgrades blunt the problem but don’t solve it. Older multiparous cows carry more metabolically active visceral fat, mobilize NEFA faster, and compound ketosis risk at every subsequent calving. The Woodhouse/Kelton case farm added another wrinkle: late-lactation cows carry higher LPL activity, so extending lactation to fill quota can amplify lipolysis risk.¹
A working operator rule — Bullvine editorial rule-of-thumb, not a published threshold — if more than 30% of your parity 4+ cows test BHBA >1.4 mmol/L across two consecutive calvings, that cohort belongs on the voluntary cull list before the next dry-off. The cull market makes the call easier than it was two years ago: RFD-TV reported Southern Plains lean-cow (85–90%) auction prices at roughly $167/cwt in early March 2026, with bulls north of $200/cwt in parts of the South on tight supplies and strong grinding demand.¹⁹ A 1,400-lb parity 4+ Holstein at $167/cwt returns about $2,338 — real cash that partially funds her replacement.
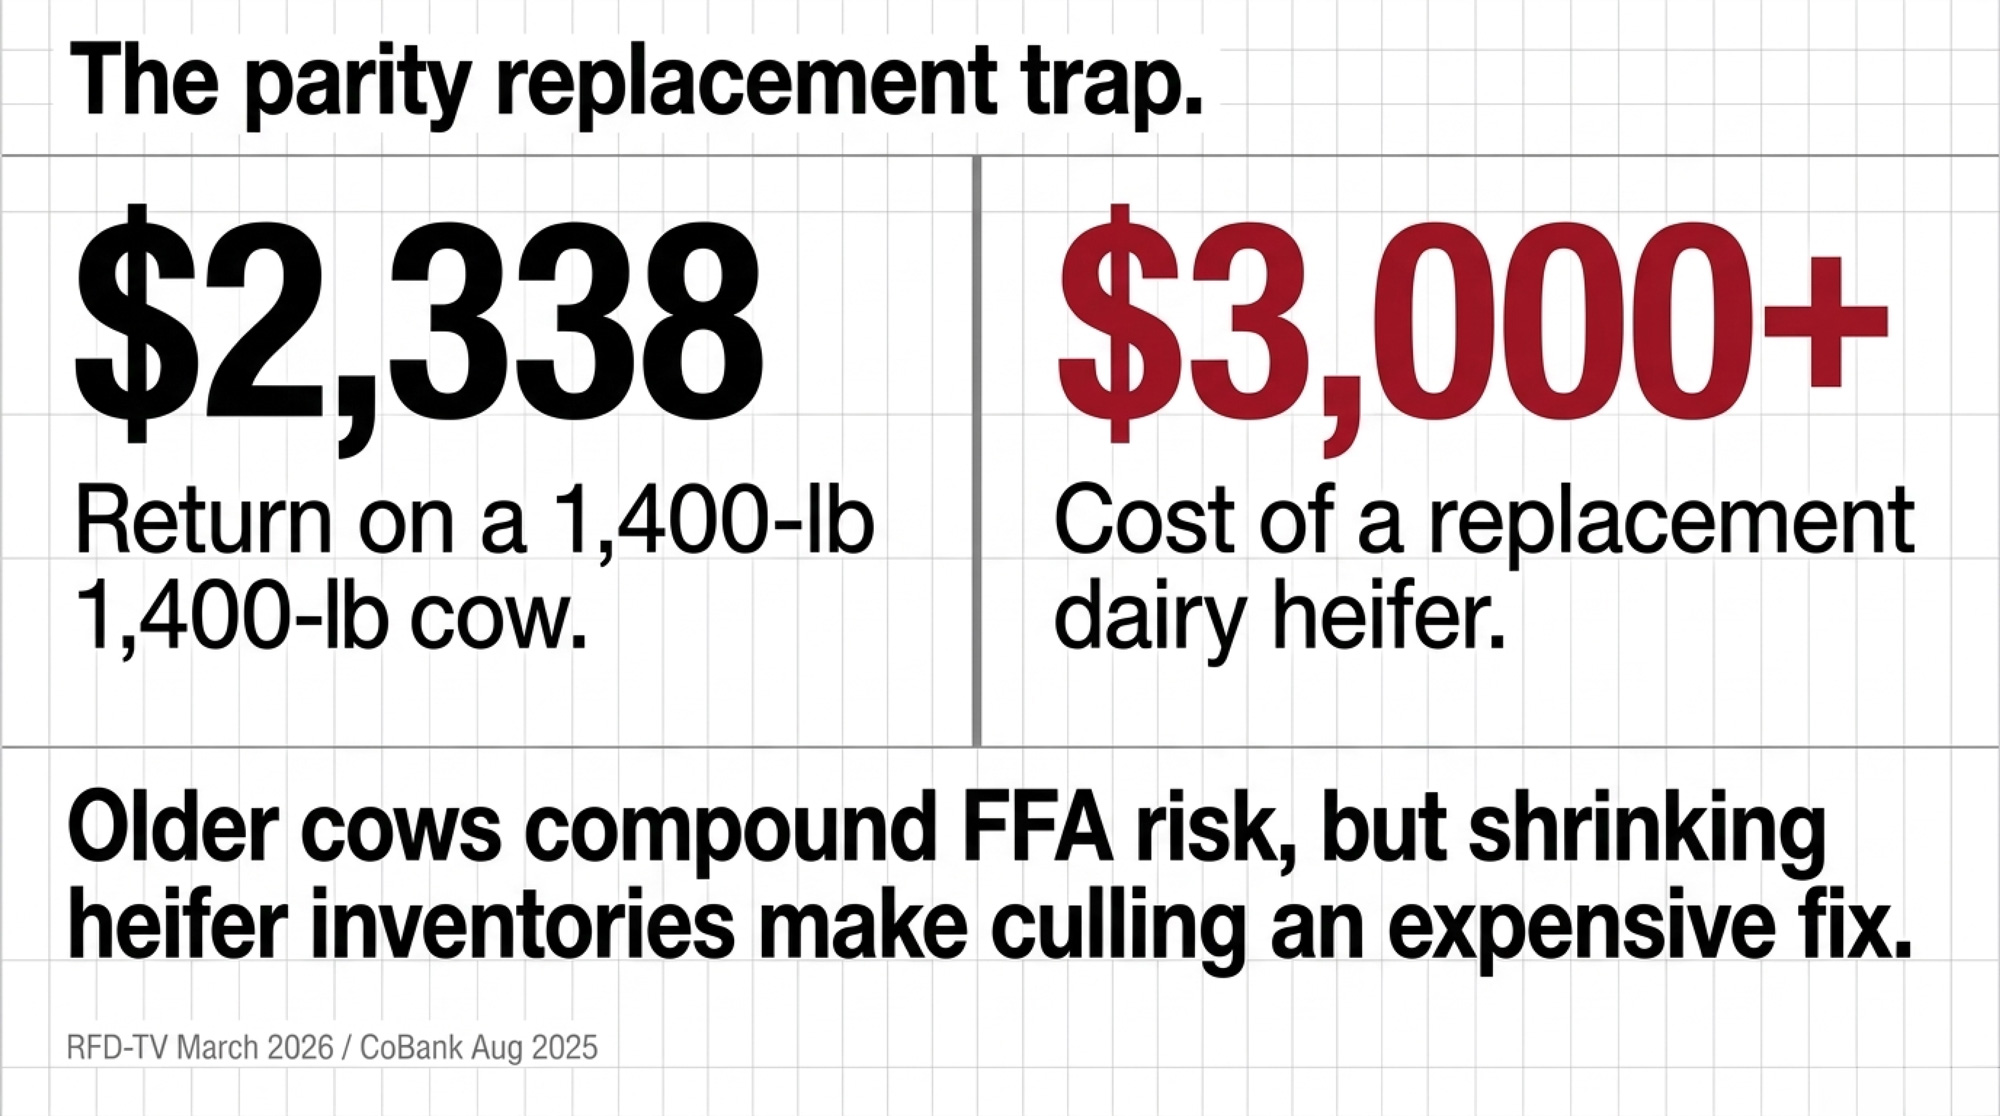
But the replacement side is brutal. CoBank’s August 2025 Knowledge Exchange outlook put US dairy heifer inventories at a 20-year low, with a predictive model showing 438,844 fewer dairy heifers in 2026 versus 2025 — driven largely by ~398,925 more beef-on-dairy calves — and total replacement inventories expected to shrink by roughly 800,000 head before rebounding in 2027, with heifer prices potentially above $3,000/head.²⁰
Walking herd average parity from 3.2 to 2.8 in that market isn’t cheap or fast. Typical structural FFA correction through parity shift runs 18–24 months under normal replacement supply, closer to 24–30 months under today’s conditions — a Bullvine analytical projection based on typical parity-turnover mechanics, not a sourced forecast. But running RPC forever on a metabolic age that keeps escalating is more expensive, slower, and quieter.
Options and Trade-Offs for Your Operation
| Path | Best-fit trigger | Core spend / year (500-cow) | Payback window | Backfire risk |
| 30/60/90 protocol only | Seasonal pattern, parity ≤3.2, no YoY escalation | RPC ~60 g/cow/day + BHBA testing (~$960/yr) | 6–9 months | Misdiagnosed demographic problem |
| Protocol + parity 4+ culling | Parity >3.2, YoY peak climb >0.15 mmol | Above + ~$3,000/head replacement cost | 18–24 months | Heifer market ($3,000+/head, 438,844 shortfall) |
| Add contract audit | Any herd, any pattern | Operator time only | Immediate | Co-op refusal = your new baseline |
| Status quo | “Filters and hope” | $13,680–$68,400/yr penalty exposure | Never | Compounding margin loss under FMMO reform (85–93¢/cwt) |
Three paths, depending on what your six months of data say:
- Run the 30/60/90-day protocol only. Works when the pattern is managerial — seasonal, spring-recovering, no year-over-year escalation. RPC plus BHBA testing is the core spend. Backfires if you’ve misdiagnosed a demographic problem and your fall peak climbs again next October.
- Run the protocol plus targeted culling of parity 4+ repeat-ketosis cows. Works when herd average parity tops 3.2 and year-over-year peaks escalate more than 0.15 mmol/100g fat. Pays out over 18–24 months. Backfires if you can’t source replacements at workable economics at CoBank’s projected heifer prices.²⁰
- Run the contract audit alongside either path. Even a clean-FFA herd benefits from knowing exactly what the FFA threshold in its supply agreement says and what share of quality adjustments the co-op will attribute to FFA in writing. The answer — or the refusal — is your baseline for every future conversation.
DFO publishes the mechanics of its FFA reporting to every Ontario producer.¹ BC Milk publishes the framework while clarifying that FFA does not affect provincial-pool pay — any producer-level penalty flows through the processor-specifications clause of the individual agreement.³ Most US co-op supply agreements reference a processor-level FFA threshold but don’t publish the penalty math. That absence isn’t universal bad faith — some co-ops share full component and quality schedules with members on request. It’s the absence of a public, standardized FFA penalty framework across North America that makes this a contract-audit problem, not a headline problem.
What This Means for Your Operation
- When FFA climbs, your first call is your transition-cow vet. The equipment tech is the second call. That’s the core reframe the Guelph data demands.⁷,²
- If April readings stay above 1.10 after a winter-stress recovery window, you’re not looking at a seasonal problem. You’re looking at a structural one — a parity question, not a filter question.
- If FPR leads FFA by 4–6 weeks in your own six-month data, your tank is broadcasting the metabolic signal before the sensory threshold catches it. Act on the FPR.
- If more than 30% of your parity 4+ cows throw BHBA >1.4 mmol/L across two consecutive calvings, that cohort is carrying your fall FFA peak — and at $167/cwt lean-cow prices, the market is paying to move them.¹⁹
- If your co-op’s incentive-day calendar sits 3–5 weeks ahead of every FFA elevation on your statement, you’ve documented exactly the mechanism the Ontario data flagged.⁷ That’s a specific conversation to have with your quality manager, in writing.
- If your co-op can’t — or won’t — put the FFA portion of your last six quality adjustments in writing, that silence is your baseline. Everything you do next sits against it.
- If the 30-day protocol pencils at low four figures a month and your contract-audit reveals a meaningful $/cwt FFA hit, the expensive fix is cheaper than the invisible one.
Key Takeaways
- If bulk tank milk protein is drifting down, the odds of elevated FFA climb sharply in the Ontario data — call your vet before the equipment tech.⁷
- If your herd is tie-stall and milking ≥3×/day, the Woodhouse farm-factors paper attaches a 1.17 mmol/100g fat association to that single combination — the single biggest lever in the model.²
- If herd average parity is above 3.2 and fall FFA peaks are escalating year over year, you’re looking at a demographic problem the 30-day protocol alone won’t solve, in a heifer market projected to shrink by 800,000 head before rebounding in 2027.²⁰
- If you don’t know your co-op’s FFA penalty math in writing, you don’t know your exposure. Period.
- If you execute the 24-month plan and document the before/after, you’ve earned a governance argument, not just a management win.
The Question You’ll Face Next October
The Woodhouse/Kelton case farm ran 1.32 mmol FFA on average over four years, with 54% of samples elevated.¹ That’s not an outlier. It’s a data point with a mailing address. The research doesn’t cull the parity 4+ cow for you. It doesn’t pull your supply agreement. It doesn’t translate the processor-specifications clause the pay statement leaves out.
What it does — through exact betas, seasonal patterns, and 171,843 monthly bulk tank observations across every Ontario dairy farm — is prove that the margin test hiding inside every bulk tank FFA reading is measurable, attributable, and fixable on a timeline shorter than the opacity of the system suggests.
Here’s the harder question. An operator who fixes their FFA and says nothing lets the current arrangement continue as designed — program worked, producer responded, questions about disclosure never get asked. An operator who fixes their FFA and walks a documented before/after into a co-op board meeting — with their own supply agreement in one hand and AFBF’s $337 million pool-revenue analysis in the other — is doing something different. So what are you going to bring to your co-op board next October — your FFA numbers, or your silence?
Editor’s note: This article contains editorial analysis and opinion by The Bullvine. It describes general industry patterns and does not refer to any specific named co-operative, processor, or producer other than those expressly attributed. Specific contract terms, quality schedules, and regulatory frameworks vary by co-op and jurisdiction; producers should consult their own agreements and advisors.
Complete references and supporting documentation are available upon request by contacting the editorial team at editor@thebullvine.com.
Learn More
- Fat Alone Shuts Down Immunity: The $150/Cow NEFA Trap You’re Building in the Dry Pen. — Reveals how overconditioning late-lactation cows bakes in metabolic failure before calving. This management guide delivers four tactical levers to break the lipolysis cycle and slash high-NEFA counts by up to 20% per group.
- $15 Pizza. 73-Cent Milk Check. The Real Super Bowl Score for Dairy Farmers. — Follows the money on the June 2025 FMMO reform that diverted $337 million from producer pools to processors. This economic analysis arms you with specific calculations to recalibrate breakevens against widening farm-to-retail price spreads.
- America’s 800,000-Heifer Crisis: How Chasing Beef Premiums Broke Our Replacement Pipeline — Dismantles the “cheap beef-on-dairy” myth that created a structural 20-year low in heifer inventories. It exposes the hidden $585-per-service opportunity cost and warns of a $3,500 replacement market coming by 2027.
 The Sunday Read Dairy Professionals Don’t Skip.
 The Sunday Read Dairy Professionals Don’t Skip.
Every week, thousands of producers, breeders, and industry insiders open Bullvine Weekly for genetics insights, market shifts, and profit strategies they won’t find anywhere else. One email. Five minutes. Smarter decisions all week.
