


A 2026 Canadian lipid infusion trial shows that elevated NEFA — without calving or infection — suppresses lymphocyte function within 3 hours. Here’s the barn math, and the four dry-period levers that actually fix it.
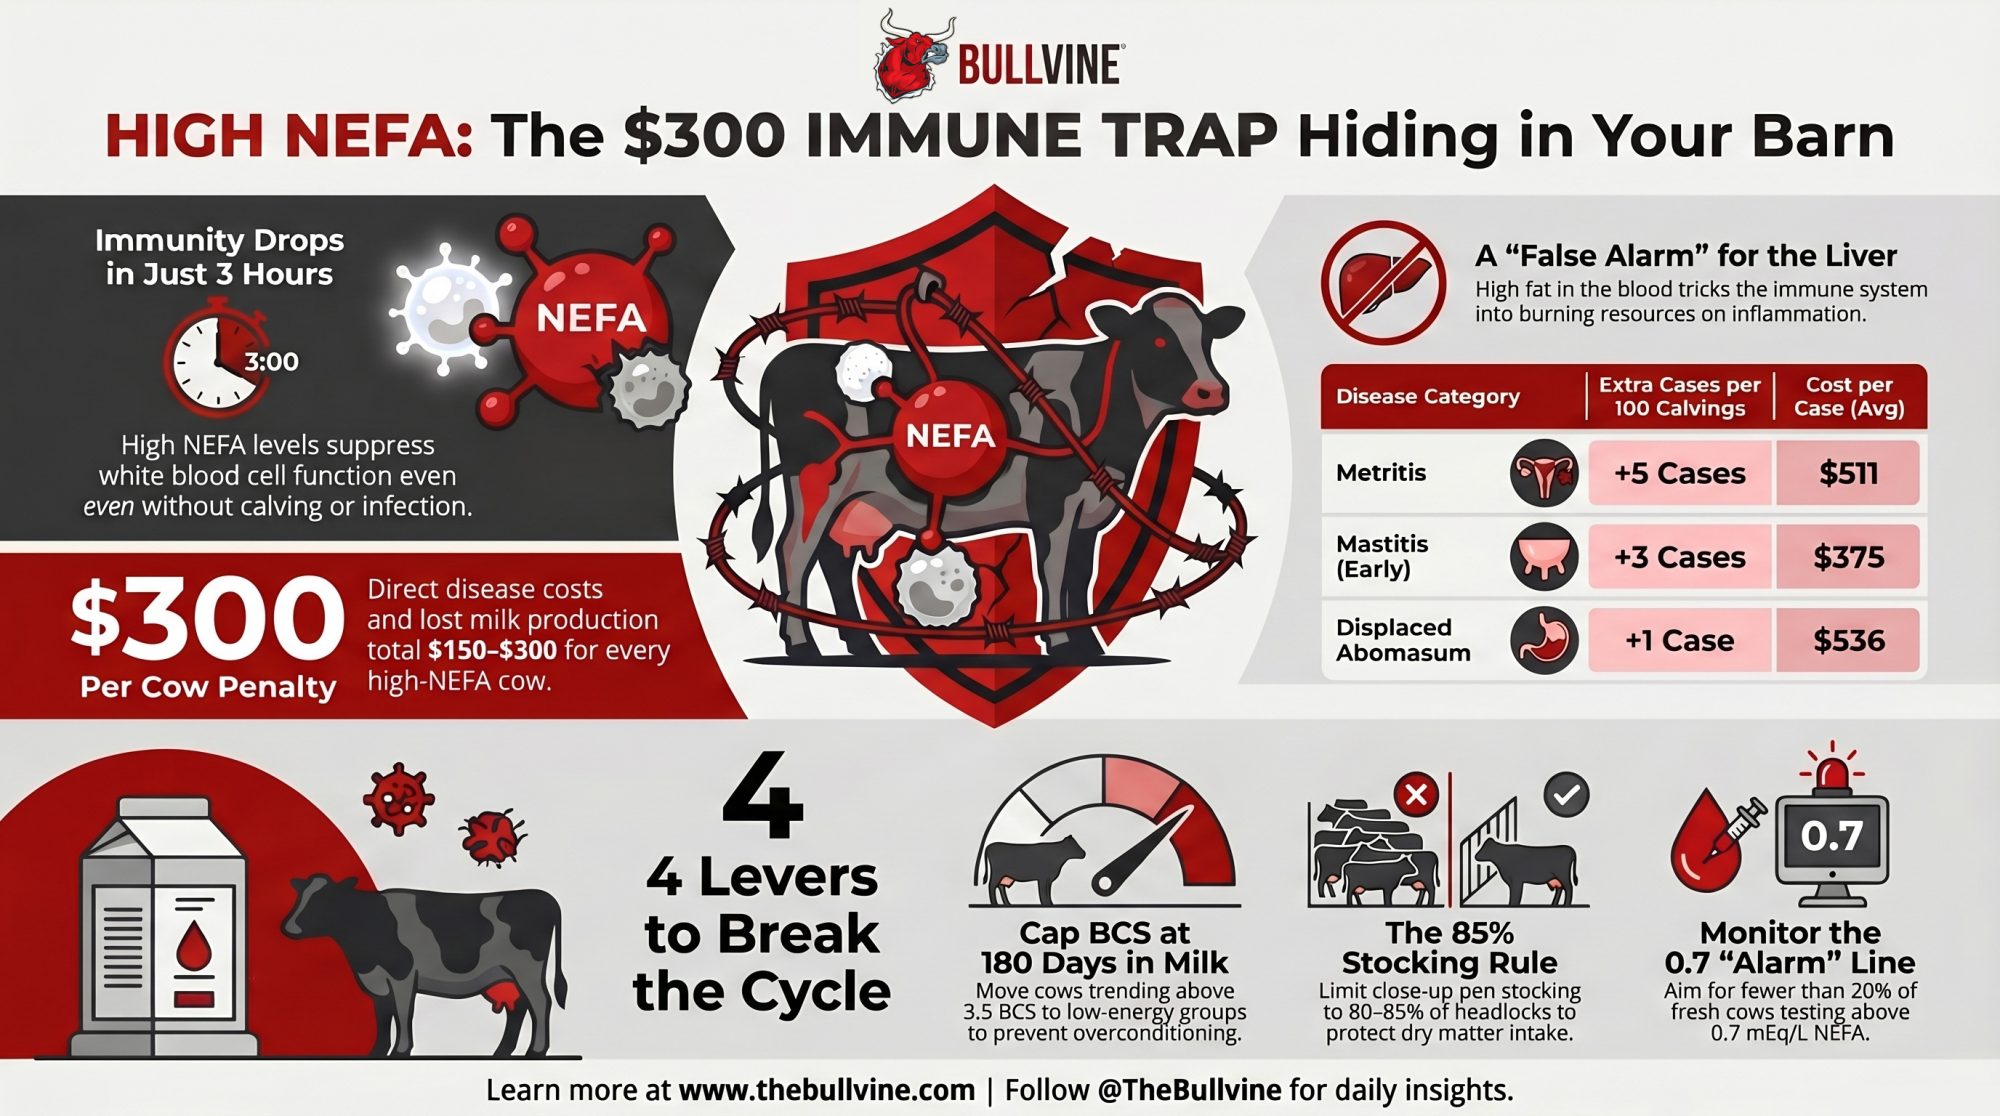
Executive Summary: A 2026 lipid-infusion trial at Agriculture and Agri-Food Canada’s Sherbrooke center proves that elevated NEFA — without calving, infection, or hormonal change — suppresses lymphocyte proliferation and neutrophil killing capacity within three hours. Pierre Lacasse’s team infused dry, non-pregnant Holsteins with fat and watched haptoglobin spike 40-fold and immune cell function crater at NEFA concentrations (1.39 mM) you’d see on any freestall with overconditioned fresh cows. That shifts NEFA from “useful transition marker” to direct immune lever with per-cow costs attached. Our barn math, built on Ospina (2010) disease-risk data and Liang (2017) per-case costs, puts the direct damage at roughly $139–$162 per high-NEFA cow — and closer to $150–$300 once you factor milk loss, compromised oocytes, and early culling. In a 250-cow herd where a third of fresh cows clear 0.7 mEq/L, that’s an estimated $10,000+ in avoidable disease costs annually. Ontario benchmarking shows about 40% of dry cows are already overconditioned before close-up, which means the problem is being built in the late-lactation pen months before you see the vet bill. The article walks through the full cost table, the immunology behind it, four management levers that address the root cause, and a 30-day checklist you can run against your own herd records this month.
Eleven days fresh, milking well, and lame by Tuesday. The DA surgery cost ranged from $432 to $640—that’s the U.S. cost estimate, depending on parity (Liang et al., 2017). By the time the manager on a 260-cow freestall in eastern Ontario tallied dumped milk, the metritis treatment that followed, and the lost peak yield, that single cow had burned through close to $1,200 before her first test day.
Bad luck — until the herd vet pulled NEFA on twelve more fresh cows. Five came back above 0.7 mEq/L. Same threshold. Same immune-compromise pattern. Different animals. The damage across the fresh group worked out to an estimated $150–$300 per high-NEFA cow, with about a third of calvings landing in that band. Those losses weren’t random. They were upstream, predictable, and largely built into the operation’s own dry-cow program.
How Much Does Excessive NEFA Cost per 100 Calvings?
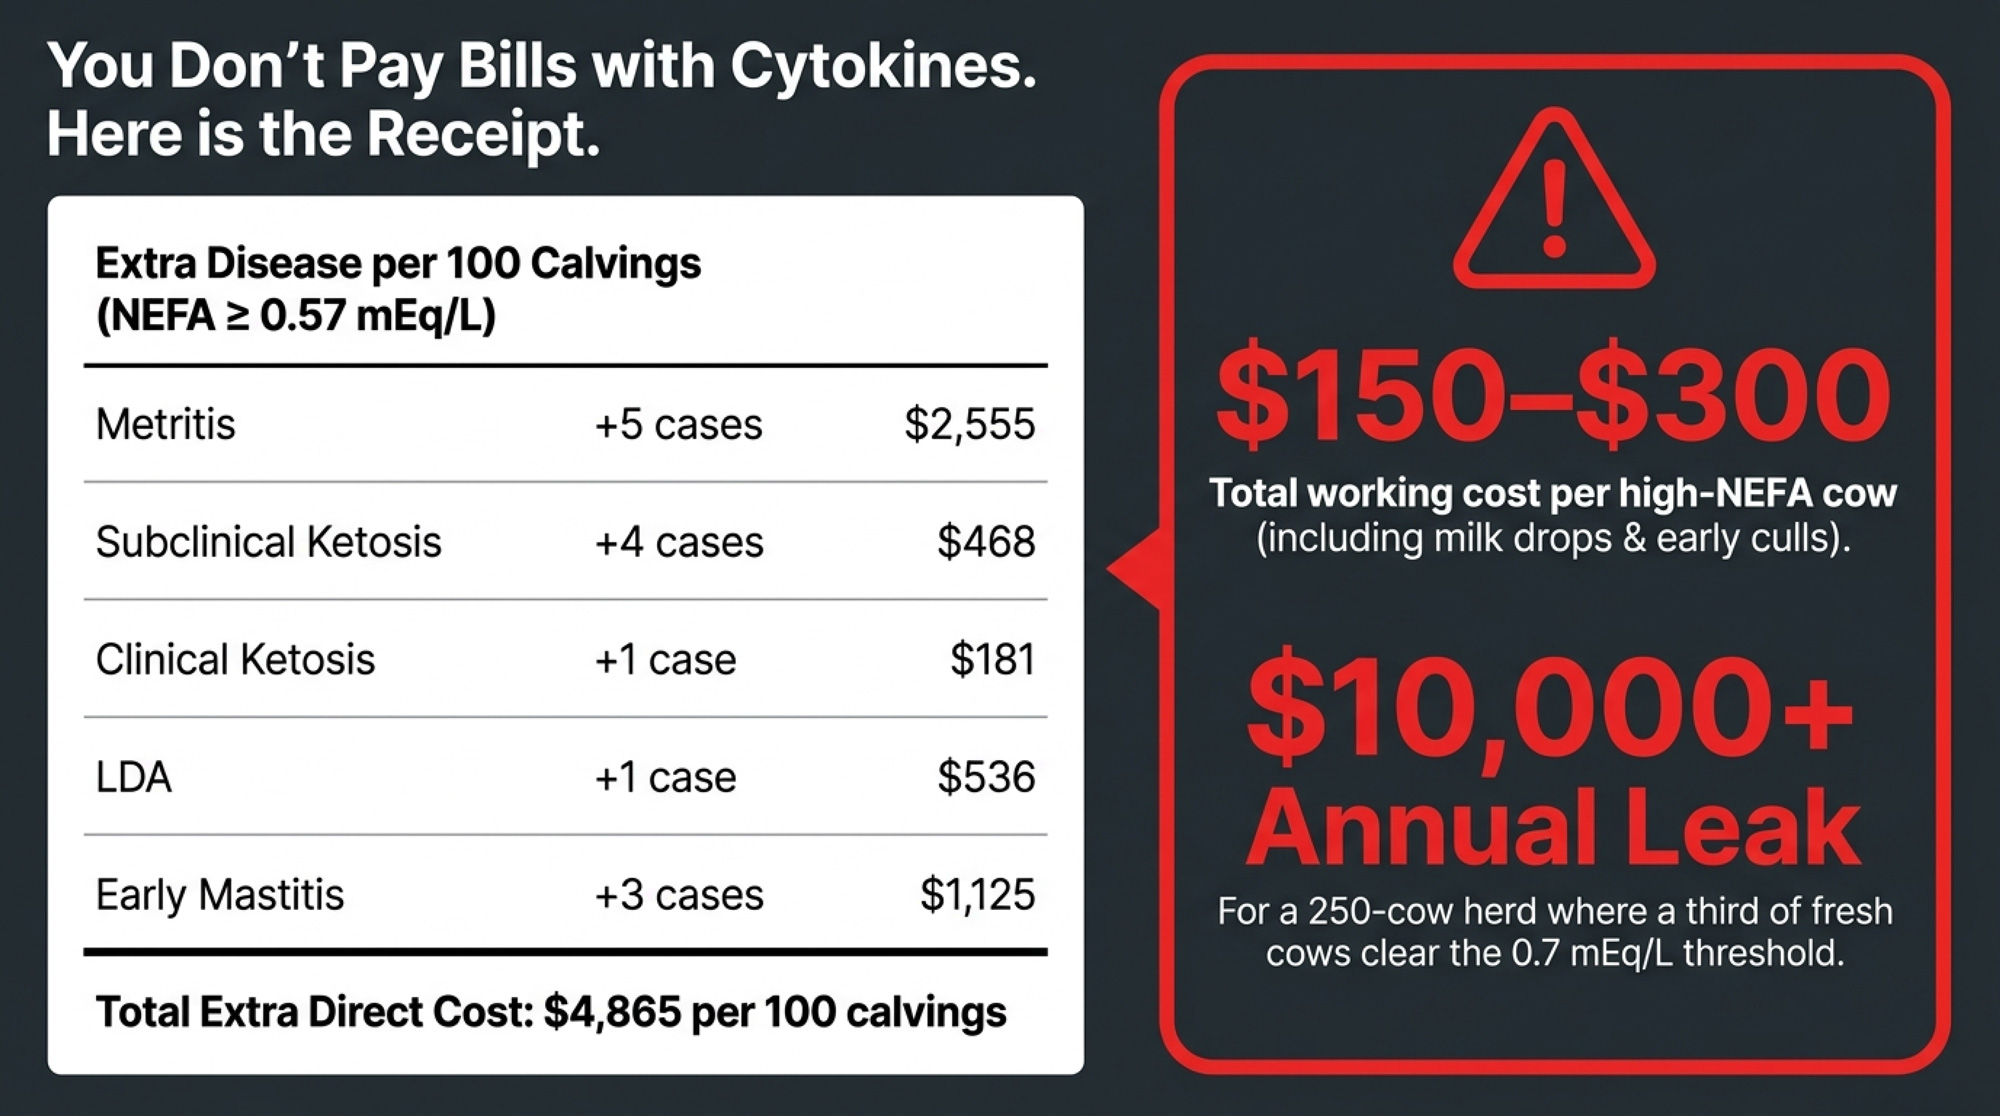
You don’t pay bills with cytokines. So, before the science, here’s the bill.
Across 2,758 cows on 100 northeastern U.S. freestall herds, Ospina et al. (2010) found that cows with postpartum NEFA at or above 0.57 mEq/L had a risk ratio of 9.7 (95% CI 4.2–22.4) for displaced abomasum, with all risk ratios for DA, clinical ketosis, metritis, and retained placenta exceeding 1.8. That 0.57 mEq/L threshold is the ROC-optimized cutpoint for predicting clinical disease within 30 DIM. The widely used herd-alarm threshold of 0.7 mEq/L sits well above it — meaning cows that clear 0.7 carry even greater risk.
Take 100 calvings on a herd where roughly one-third of fresh cows land above 0.7 mEq/L. Here’s a conservative estimate of the additional disease cost in that high-NEFA subset:
| Disease | Est. Extra Cases / 100 Calvings | Cost per Case | Total Cost |
| Metritis | +5 | $511 (Pérez-Báez et al., 2021) | $2,555 |
| Subclinical Ketosis | +4 | $117 component cost (McArt et al., 2015) | $468 |
| Clinical Ketosis | +1 | $181 multiparous (Liang et al., 2017; primiparous: $77) | $181 |
| LDA | +1 | ~$536 midpoint (Liang et al., 2017; $432 prim. / $640 mult.) | $536 |
| Early Mastitis (first 60 DIM) | +3 | ~$375 midpoint (Liang et al., 2017; $325 prim. / $426 mult.) | $1,125 |
| Total Extra Direct Cost | — | — | $4,865 |
Note: Per-case costs are from U.S.-based studies. A 2010 Canadian estimate put subclinical ketosis alone at ~$203 CDN per case — higher than the U.S. figure used here.
Spread across 30–35 high-NEFA cows, that’s approximately $139–$162 per cow in direct disease cost. Factor in harder-to-capture losses — milk production drops, NEFA-damaged oocytes reducing conception rates, premature culling — and $150–$300 per high-NEFA cow is a defensible working range. The upper end carries more uncertainty, but even the conservative floor adds up fast.
For a 250-cow herd calving about 200 per year, with a third in the high-NEFA band, the direct disease cost is roughly $10,000, based on the table above. Include indirect losses, and you’re potentially looking at $15,000–$18,000 annually — though the upper figure depends on repro and culling assumptions that vary by herd.
Plug in your own disease counts from DairyComp or your herd records. If your numbers run higher than this example, your cost per high-NEFA cow will be higher, too.
Can NEFA Alone Suppress a Cow’s Immune System?
For years, the industry treated high NEFA as a useful marker — a symptom of the broader transition mess. Calving stress, hormonal surges, DMI crashes, and social disruption. Under that logic, managing NEFA feels optional. A wellness upgrade, not a survival lever.
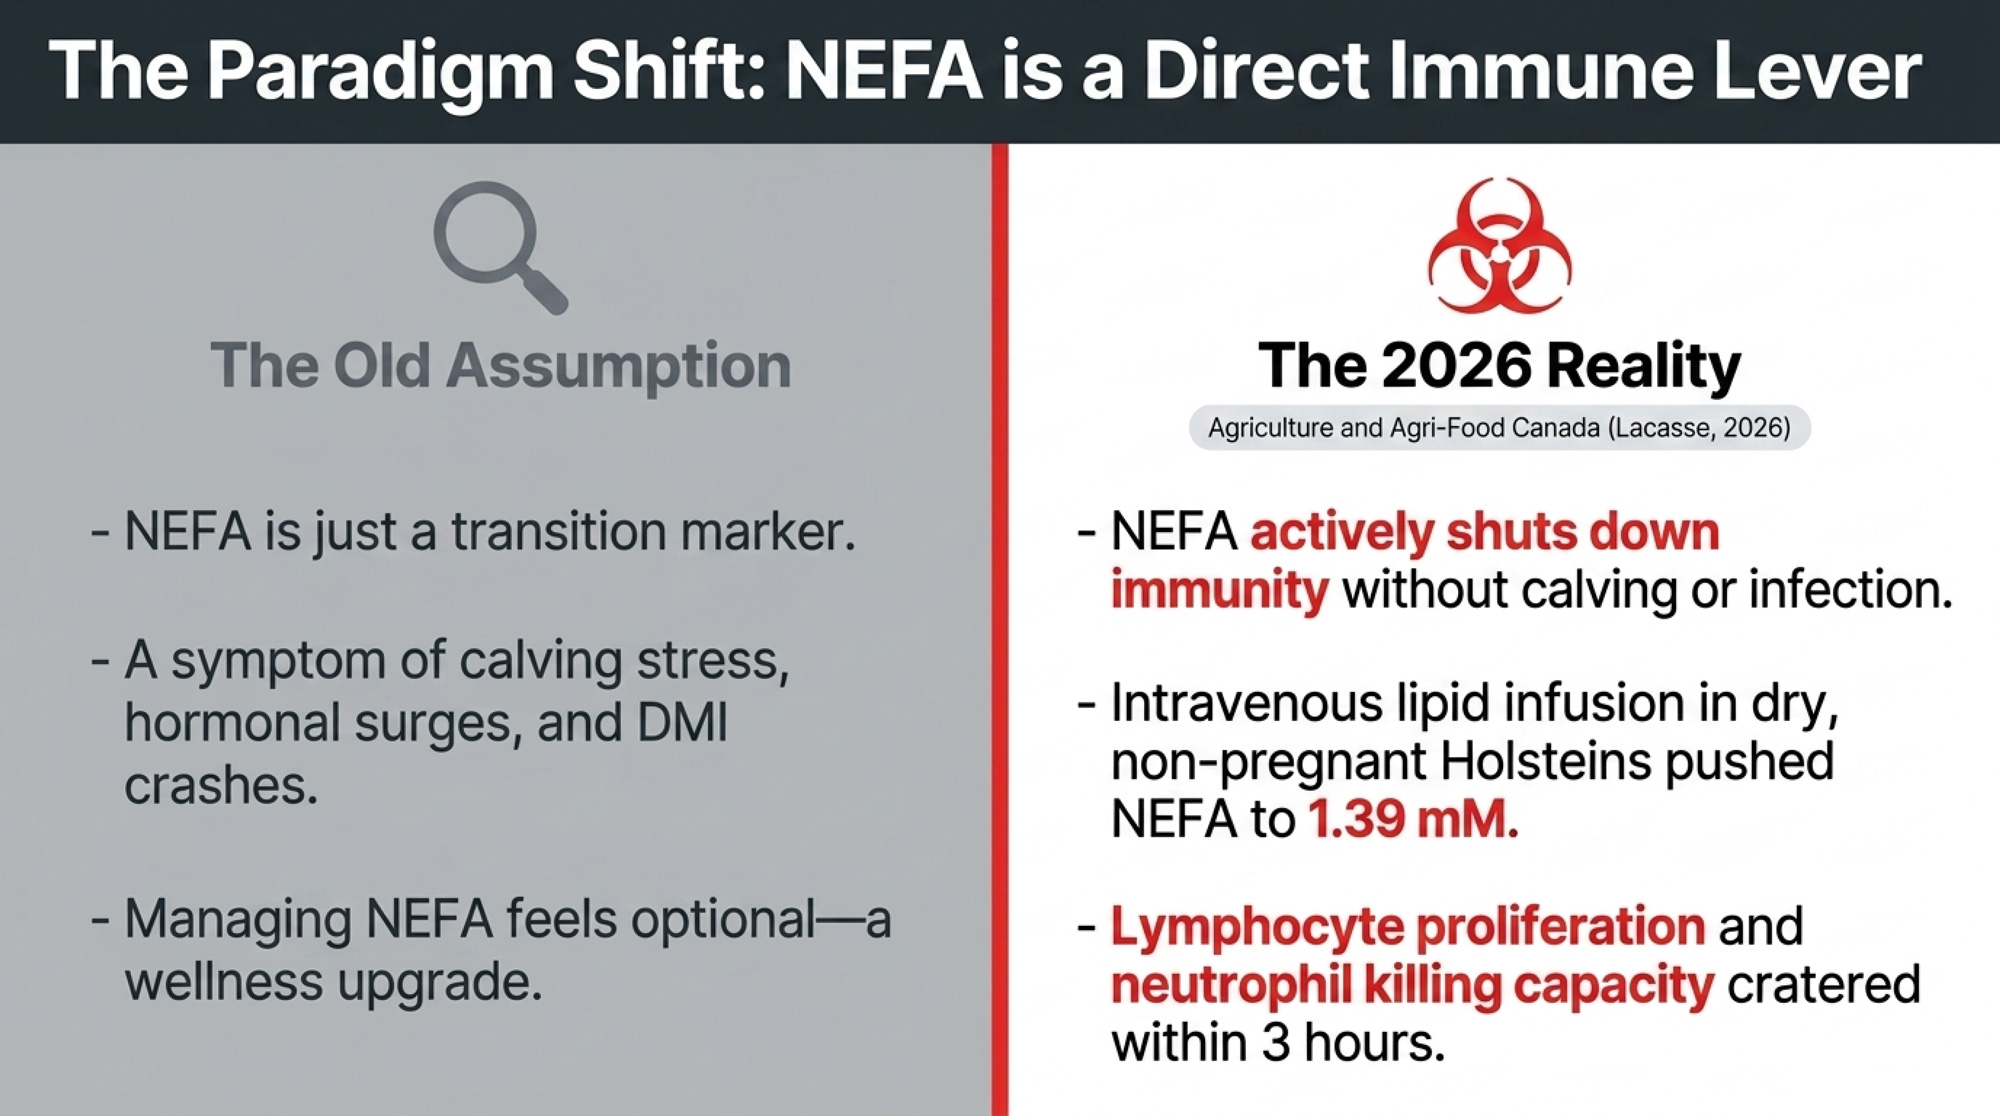
Pierre Lacasse’s team at Agriculture and Agri-Food Canada’s Sherbrooke Research and Development Center just broke that assumption. Published in the Journal of Dairy Science (2026, In Press), they used six dry, non-pregnant Holsteinsin a 3 × 3 double Latin square. Each cow cycled through three treatments: saline control, intravenous Intralipid 20% at 1 mL/kg body weight per hour for 6 hours, and the same lipid infusion plus glutathione. No calving. No uterine contamination. No ration change. Just controlled fat in the bloodstream.
Plasma NEFA jumped from 0.06 to 1.39 mM — well within the range you’d see in overconditioned early-lactation cows on Ontario or U.S. freestalls. And then the immune system started misfiring.
The False Alarm: How Fat Tricks Your Cow’s Immune System
Think of what happened in those cows as the immune system hitting the gas and the brake at the same time.
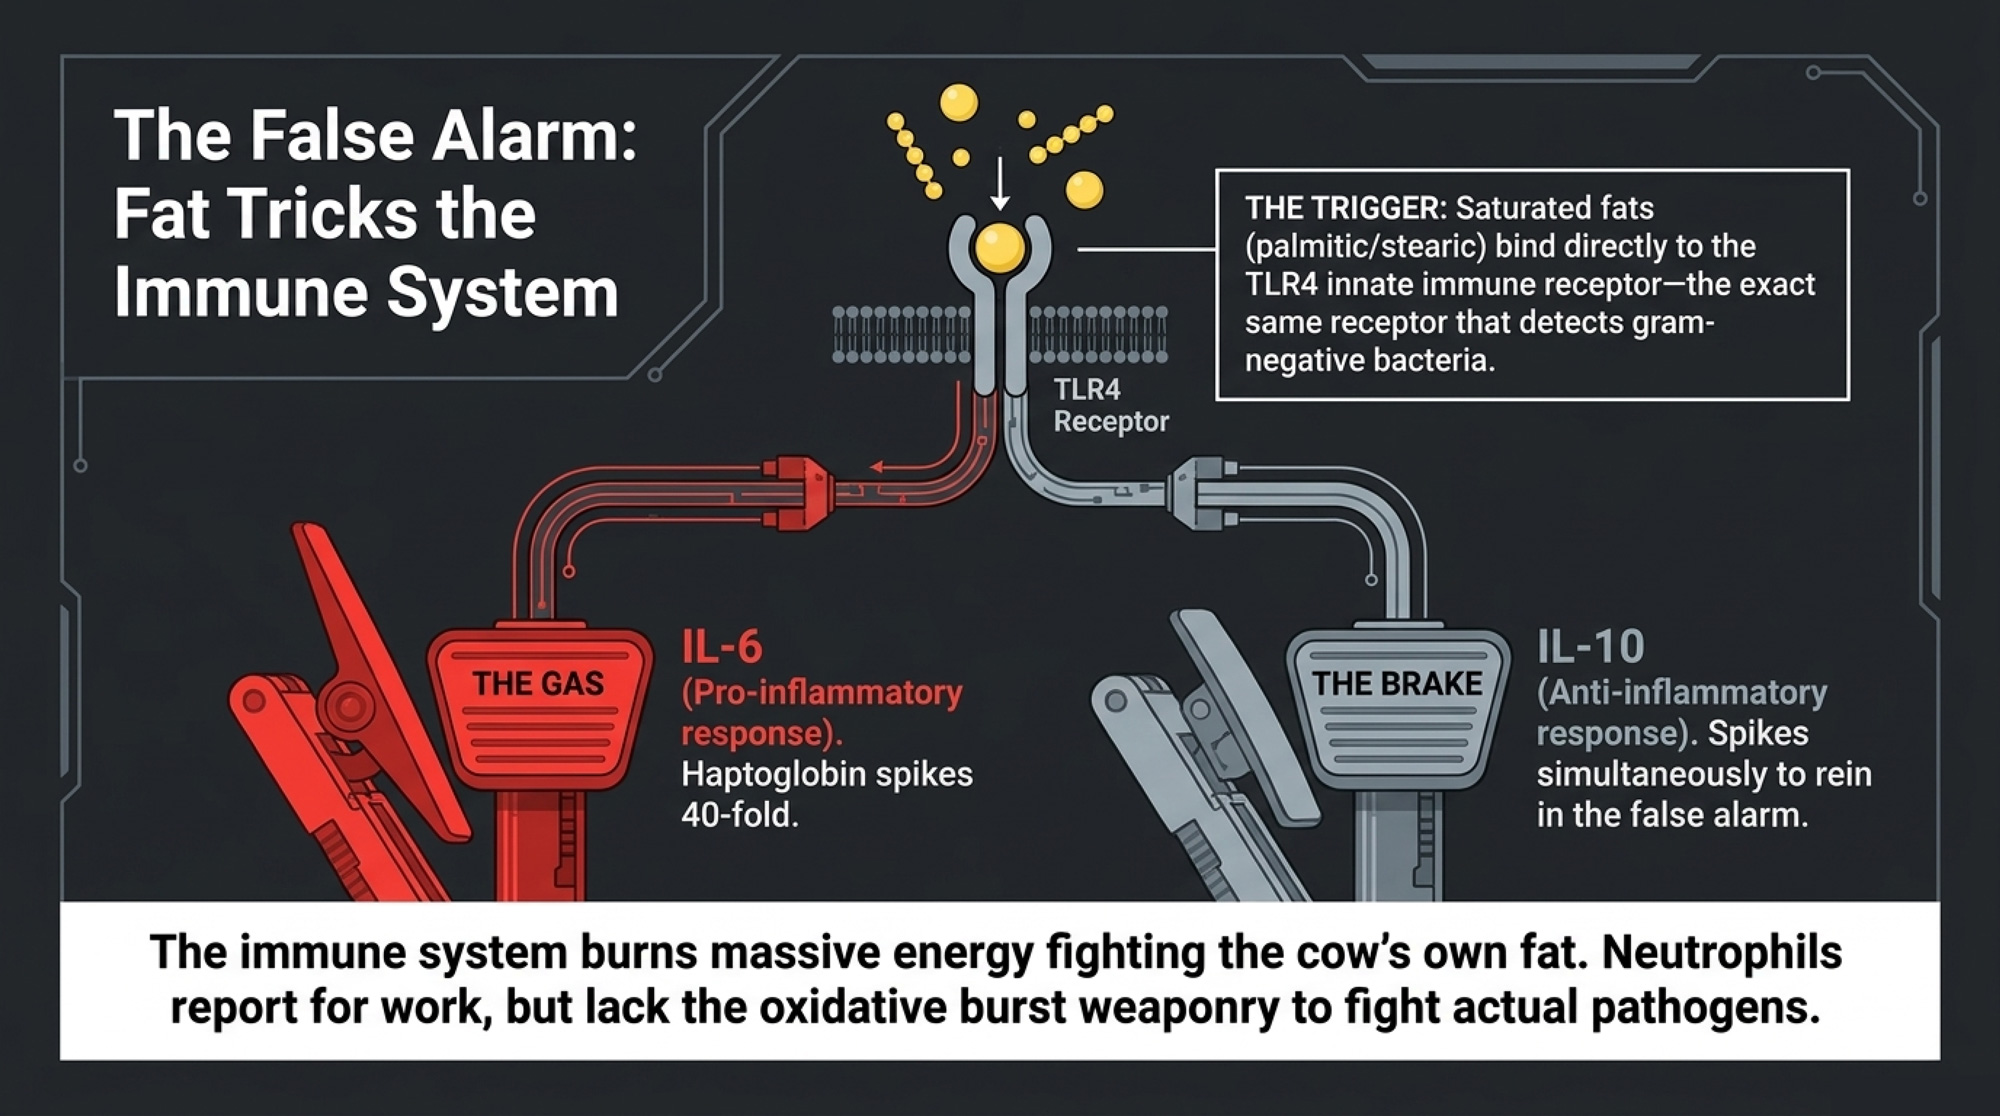
Haptoglobin — typically undetectable in healthy cattle — spiked roughly 40-fold. Serum amyloid A rose 20-fold, peaking at 18 hours post-infusion. Both are acute-phase proteins that the liver cranks out when it perceives a systemic threat. In Lacasse’s cows, the only threat was their own circulating fat.
IL-6 (pro-inflammatory) climbed — that’s the gas pedal, launching the acute-phase response. But IL-10 (anti-inflammatory) went up simultaneously — the brake, the body trying to rein in the inflammation it just triggered. When both spike together without a pathogen present, you’re looking at an immune system burning resources on a false alarm while losing the capacity to fight the real thing.
Lymphocyte proliferation — the ability of T and B cells to divide and mount a defense — dropped within three hoursof starting the infusion. Neutrophils still showed up and swallowed bacteria, but their oxidative burst was significantly compromised. The cells reported for work. Their weaponry didn’t.
Here’s why. Saturated fatty acids — palmitic and stearic, the dominant players in bovine NEFA — bind directly to TLR4, the same innate immune receptor that recognizes gram-negative bacterial endotoxin. Once TLR4 fires, the inflammatory machinery kicks on — IL-6, TNF-α, the full alarm suite. TNF-α then feeds back to drive more lipolysis and suppress appetite, deepening negative energy balance in a vicious loop. Zhou et al. (2018) confirmed that NEFAs strongly upregulate the TLR2/4–NF-κB pathway in ketotic cows, and that this inflammatory over-activation closely tracks circulating NEFA levels.
BHB piles on. At concentrations of 2.5–5.0 mM, it inhibits both basal glycolysis and glycolytic capacity in neutrophils — cutting the fuel supply to the cells that need it most.
Not every cow that crosses the 0.7 line gets clinically sick. Many don’t. But the Lacasse data shows those cows are operating with measurably weakened immune defenses during the exact window when pathogen exposure is highest — and the ones that do get sick cost you real money.
Where the NEFA Spike Actually Starts
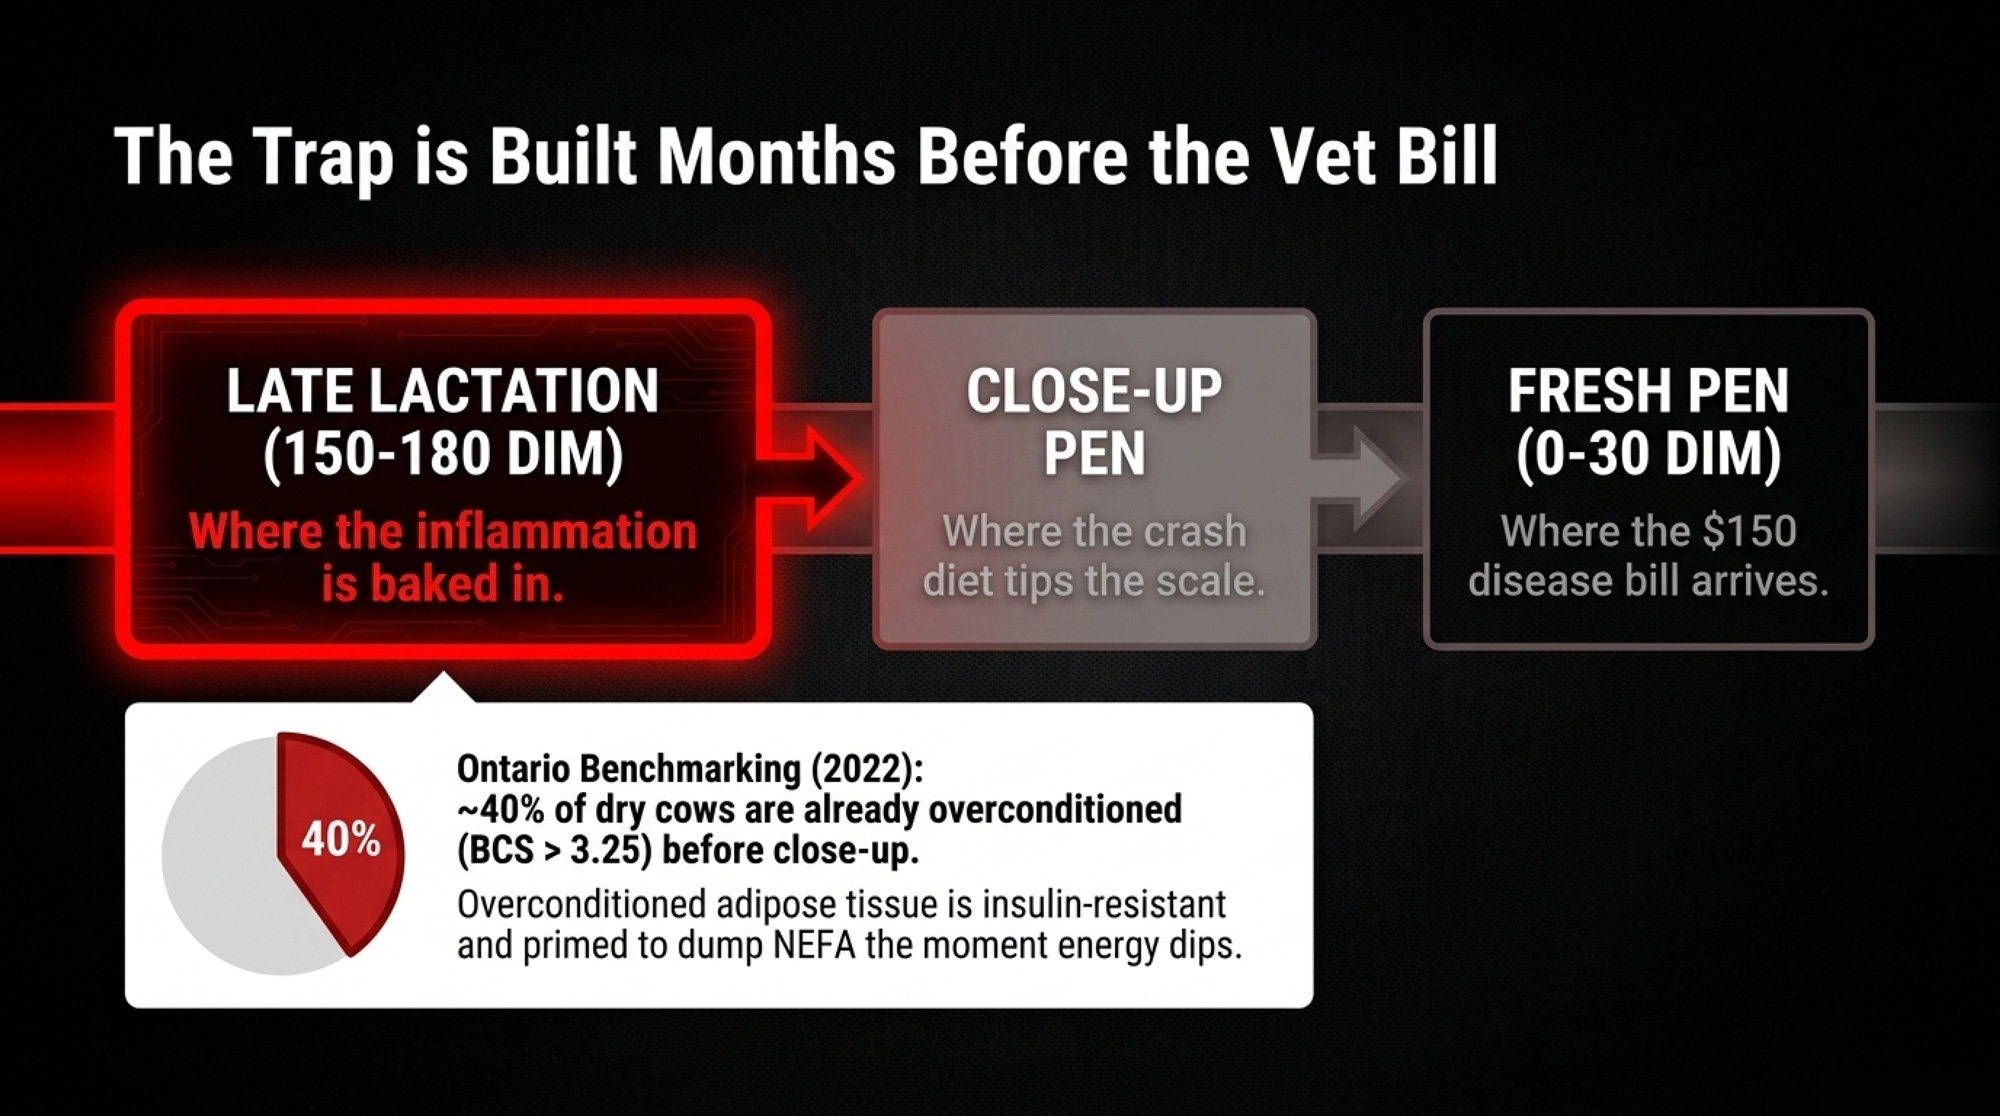
Most people troubleshoot NEFA in the fresh pen. On the eastern Ontario herd that triggered this story, nearly half the cows that later tested above 0.7 mEq/L had been dried off at BCS 3.5 or higher. The NEFA spike didn’t originate in the close-up pen. It started months earlier, in the late-lactation group.
Ontario benchmarking data says that’s not unusual. A 2022 project across 31 Ontario herds (average 192 cows) found a mean dry-cow BCS of 3.23 ± 0.32, with roughly 40% of dry cows overconditioned, exceeding the target range of 2.75–3.25. Four out of ten. And that’s the average herd in the study.
Those overconditioned cows carry adipose tissue that’s already inflamed before calving — larger adipocytes, more macrophage infiltration, upregulated TNF-α and IL-6 expression inside the fat depot itself. That tissue is insulin-resistant and primed to dump NEFA the moment energy balance tips negative. And crash-dieting them during the dry period makes it worse — cows that lose BCS prepartum actually run higher NEFA and face more metabolic disease.
The Ontario government’s recommendation: BCS 3.0–3.25 at dry-off and calving. Ohio State’s March 2026 guidance: 3.0–3.5 at dry-off, maintaining — not gaining — through the dry period.
Is Your Close-Up Pen Creating High-NEFA Cows?
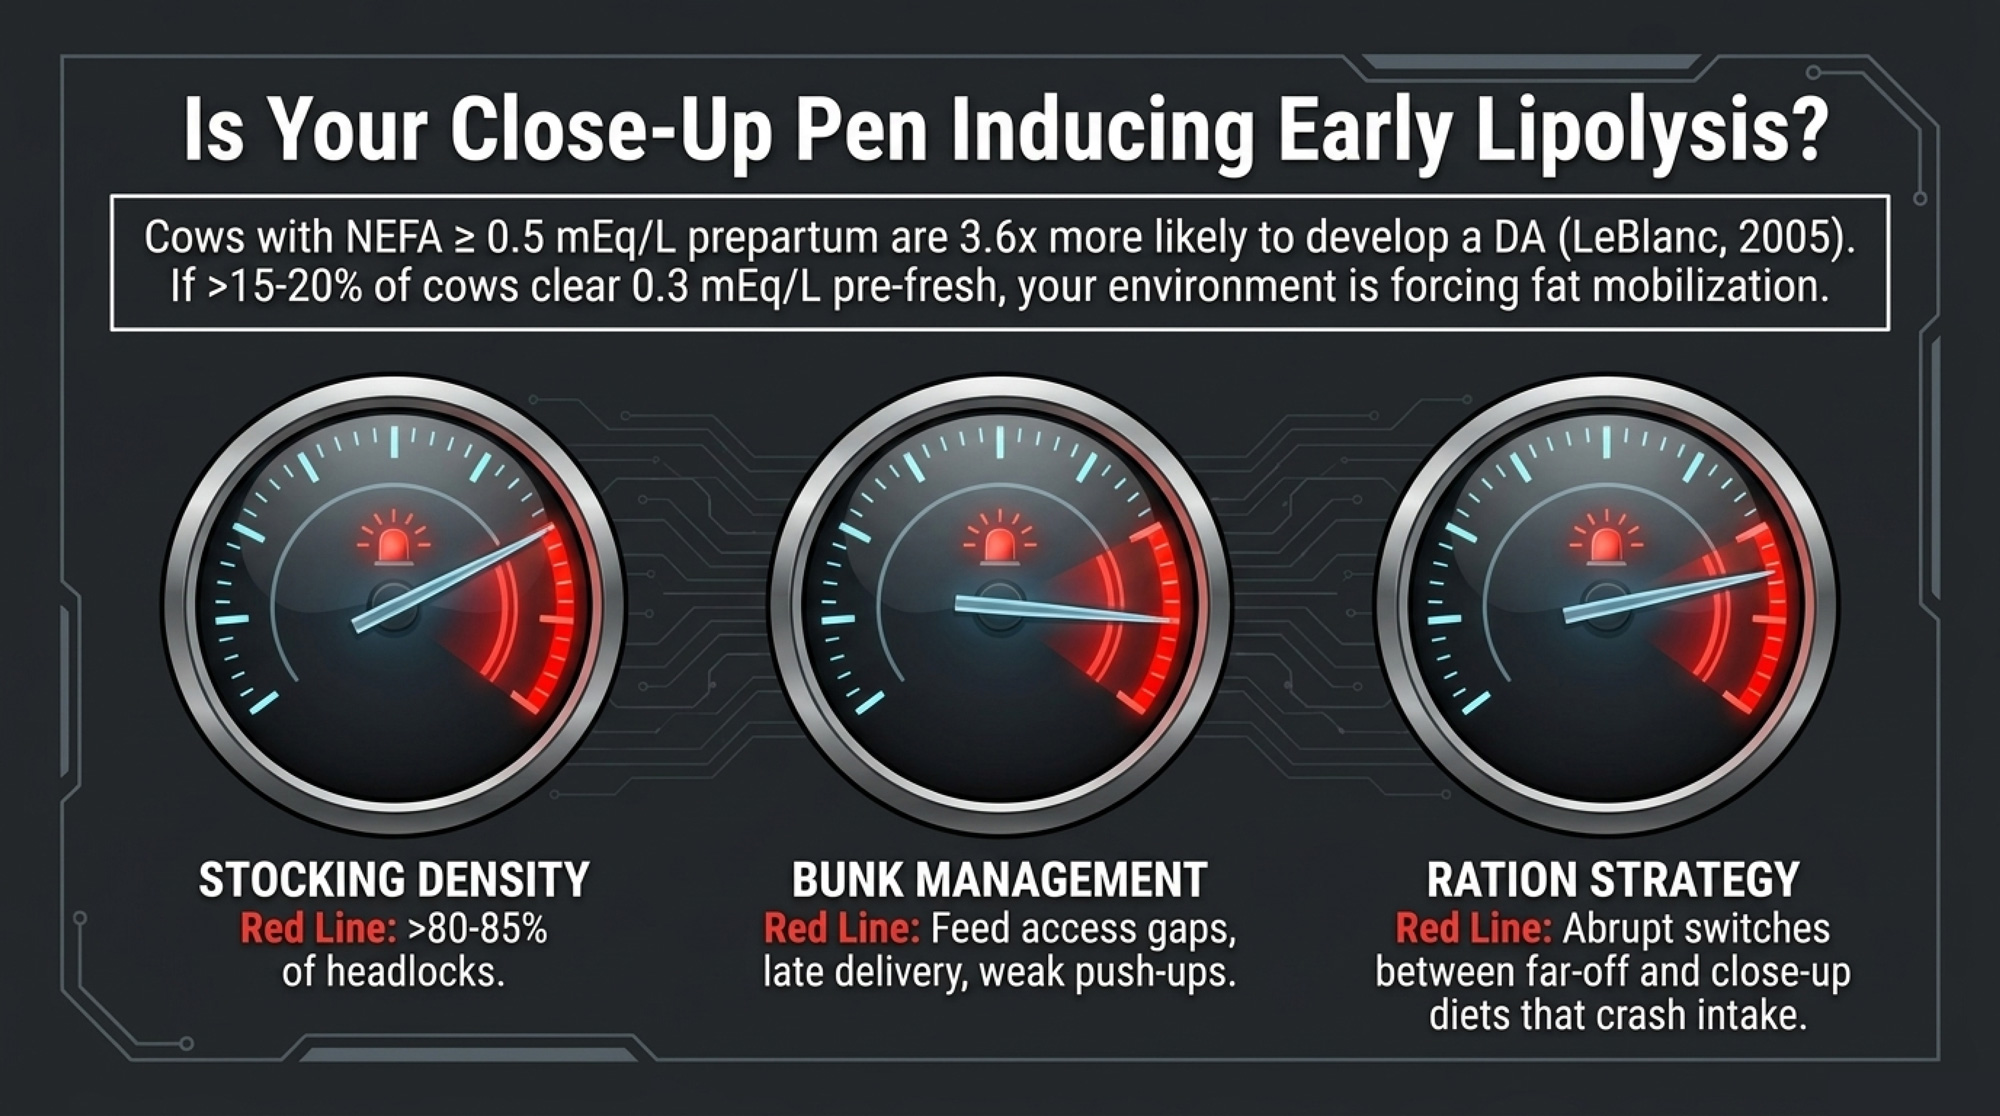
LeBlanc et al. (2005) studied 1,044 cows across 20 Ontario herds and found that cows with NEFA at or above 0.5 mEq/L in the last week prepartum were 3.6 times more likely to develop a DA after calving. Even with BCS nailed, the close-up pen can induce early lipolysis in cows.
A monthly pre-fresh NEFA panel — 10–12 close-up cows sampled 2–14 days before calving — turns guesswork into a scorecard. If more than 15–20% clear the 0.3 mEq/L prepartum line, your close-up environment is generating avoidable fat mobilization.
What to look at first:
- Overcrowding above ~80–85% of headlocks in the close-up pen.
- Feed access gaps — late delivery, weak push-ups, heat stress, pulling cows off the bunk.
- Abrupt ration switches between far-off and close-up diets that crash intakes.
- Carried-over overconditioning — the 3.75 BCS cow tips into NEB earlier than her 3.0 penmate on the same feed.
Four Levers to Break the NEFA Cycle
You won’t eliminate negative energy balance. You can decide how many cows go deep into the red zone.
| Lever / Option | Primary target metric | Typical cost per cow (US$) | Expected impact on high-NEFA cows | Notes |
|---|---|---|---|---|
| Cap BCS at 180 DIM | % cows ≥3.5 BCS at 150–180 DIM | 0–5 (management time) | ↓ 10–20%high-NEFA cows | Re-penning and feed adjustments prevent overconditioning upstream. |
| Tune close-up pen (≤80–85% stocking, intake) | NEFA ≥0.3 prepartum; close-up DMI | 5–15 (space/feed changes) | ↓ 5–15% high-NEFA cows | Space and feed access cut lipolysis before calving. |
| Monthly NEFA/BHB panels (pre- and postpartum) | % cows ≥0.3 pre; ≥0.7 post; 0–30 DIM disease counts | 15–25 lab + handling | Indirect – flags problems early | Data KPI; pays when paired with actual changes, not as a stand-alone. |
| Rumen-protected choline as main “solution” only | NEFA/BHB on supplemented cows | 25–40 per transition | Small unless BCS/pen already fixed | Risk of expensive window dressing if cows are still dried off fat. |
1. Cap late-lactation BCS. Score at 150–180 DIM and again 6–8 weeks before dry-off. Anything trending above 3.5loses access to extra grain and moves to your lowest-energy lactating group. Trade-off: You need a system that also protects thin cows — this isn’t “take feed away from everyone.”
2. Tune the close-up pen for actual intake. Target ≤80% stocking on headlocks. Build a controlled-energy, high-forage diet. Stage concentrate increases; don’t hit fresh cows with a big day-one jump. Trade-off: Pen space is the bottleneck on many operations. If you can’t regroup, lean harder on ration design and feed-push timing.
3. Make NEFA/BHB a standing monthly KPI. Sample 10–12 close-up and 10–12 fresh cows. Alarm thresholds: fewer than 15–20% above 0.3 mEq/L prepartum; fewer than 15–20% above 0.7 mEq/L postpartum. Trade-off: A few hundred dollars a month in lab costs. Only worth it if you’ve already decided what you’ll change when results run hot.
4. Deploy rumen-protected choline as a margin tool, not a silver bullet. RPC supports hepatic triglyceride export and can lower NEFA/BHB — when BCS is under control and intake is solid. Trade-off: Expensive window dressing if you’re still drying off fat cows and jamming 120% stocking into the close-up pen.
The manager on that eastern Ontario herd didn’t reach for a new supplement first. After the NEFA panels exposed the pattern, the initial move was to score BCS at 180 DIM and pull grain on everything trending above 3.5. The vet adjusted the close-up ration and pushed to get stocking below 85%.
What This Means for Your Operation
- Pull NEFA on 10–12 fresh cows (3–14 DIM) this month. If more than 20% come back at or above 0.7 mEq/L, you’ve got a lipolysis problem with real dollar consequences — not just a metabolic footnote.
- Score BCS on your late-lactation cows (150–180 DIM) this week. If they’re routinely hitting 3.5+ before the dry period, the NEFA problem is baked in before your close-up program even starts. Ontario benchmarking says ~40% of dry cows are overconditioned. Know your number.
- Run your own version of the barn math above. Plug in your actual case counts per 100 calvings. Multiply by the per-case costs in the table. The number will either reassure you or get your attention fast.
- Count headlocks and count cows in your close-up pen. Above 85%? Intake is being compromised regardless of what’s printed on the ration sheet.
- If you’re spending $25–$40/cow on metabolic support products but haven’t audited BCS at dry-off in the past 6 months, you’re treating a symptom downstream of the cause.
- Set up rolling 90-day tracking. NEFA percentage above threshold bundled with 0–30 DIM disease incidence per 100 calvings. If NEFA improves and the disease doesn’t within the first 90 days, hold the course — immune function recovery lags metabolic improvement by roughly one calving cycle. If both improve, you’ve found your lever.
- Three consecutive monthly panels above 20%? That’s your signal to change late-lactation BCS management or to close up stocking — not just treat more sick cows.
Key Takeaways
- Lacasse’s 2026 lipid-infusion trial proves NEFA alone suppresses lymphocyte proliferation and neutrophil killing at concentrations common in early-lactation cows — independent of calving, infection, or hormonal change. NEFA management is a direct immune lever, not an optional wellness metric.
- Postpartum NEFA at or above 0.57 mEq/L carries a risk ratio of 9.7 for DA and a significantly elevated risk of metritis and clinical ketosis within 30 DIM (Ospina et al., 2010). Each high-NEFA fresh cow likely carries $139–$162 in direct disease cost, with the full economic impact potentially reaching $150–$300.
- Ontario benchmarking shows ~40% of dry cows are overconditioned — and overconditioned adipose tissue is already inflamed and insulin-resistant before calving even begins.
- The highest-ROI move for many herds in 2026 may not come in a jug. It may come from a BCS ceiling at 180 DIM and a quieter, better-fed close-up pen.
If you don’t know how many of your last 20 fresh cows cleared the 0.7 mEq/L line, that’s your first report to run this month. Lacasse’s work — done right here in Canada — says those aren’t just cows having a rough first week. They’re cows whose immune defenses were significantly compromised by the fat they were allowed to carry. That’s a management decision with a dollar sign attached.
Complete references and supporting documentation are available upon request by contacting the editorial team at editor@thebullvine.com.
Learn More
- The Hidden Equipment Failure Costing Dairy Farms $100,000 Annually – And Why Most Farmers Don’t Know They Have It – You’ll gain a surgical protocol for transition health that stops the profit bleed from inconsistent execution. This breakdown exposes how “decision-driven” variation triples treatment costs and arms you with the specific benchmarks to capture immediate annual savings.
- 3 Temptations Taking Down Dairy Farms in 2026—and the 40-Day Discipline That Saves Them – This strategic deep-dive reveals why the 40-day transition window is your operation’s ultimate economic firewall. It delivers a high-stakes framework to stress-test your debt-to-EBITDA ratios against $18 milk, ensuring your long-term expansion doesn’t outrun your biological reality.
- The Isoacid Revolution: Are You Throwing Money Down the Pit? – This analysis breaks down how emerging isoacid technology slashes NEFA and BHB levels by optimizing rumen function. It delivers the metabolic edge needed to close the energy gap and predicts disease risk 72 hours before clinical signs appear.
 The Sunday Read Dairy Professionals Don’t Skip.
 The Sunday Read Dairy Professionals Don’t Skip.
Every week, thousands of producers, breeders, and industry insiders open Bullvine Weekly for genetics insights, market shifts, and profit strategies they won’t find anywhere else. One email. Five minutes. Smarter decisions all week.
