


If Iran keeps Hormuz choked, your 500‑cow dairy won’t lose $7K at the fuel tank — it’ll lose $146K in the feed lane.
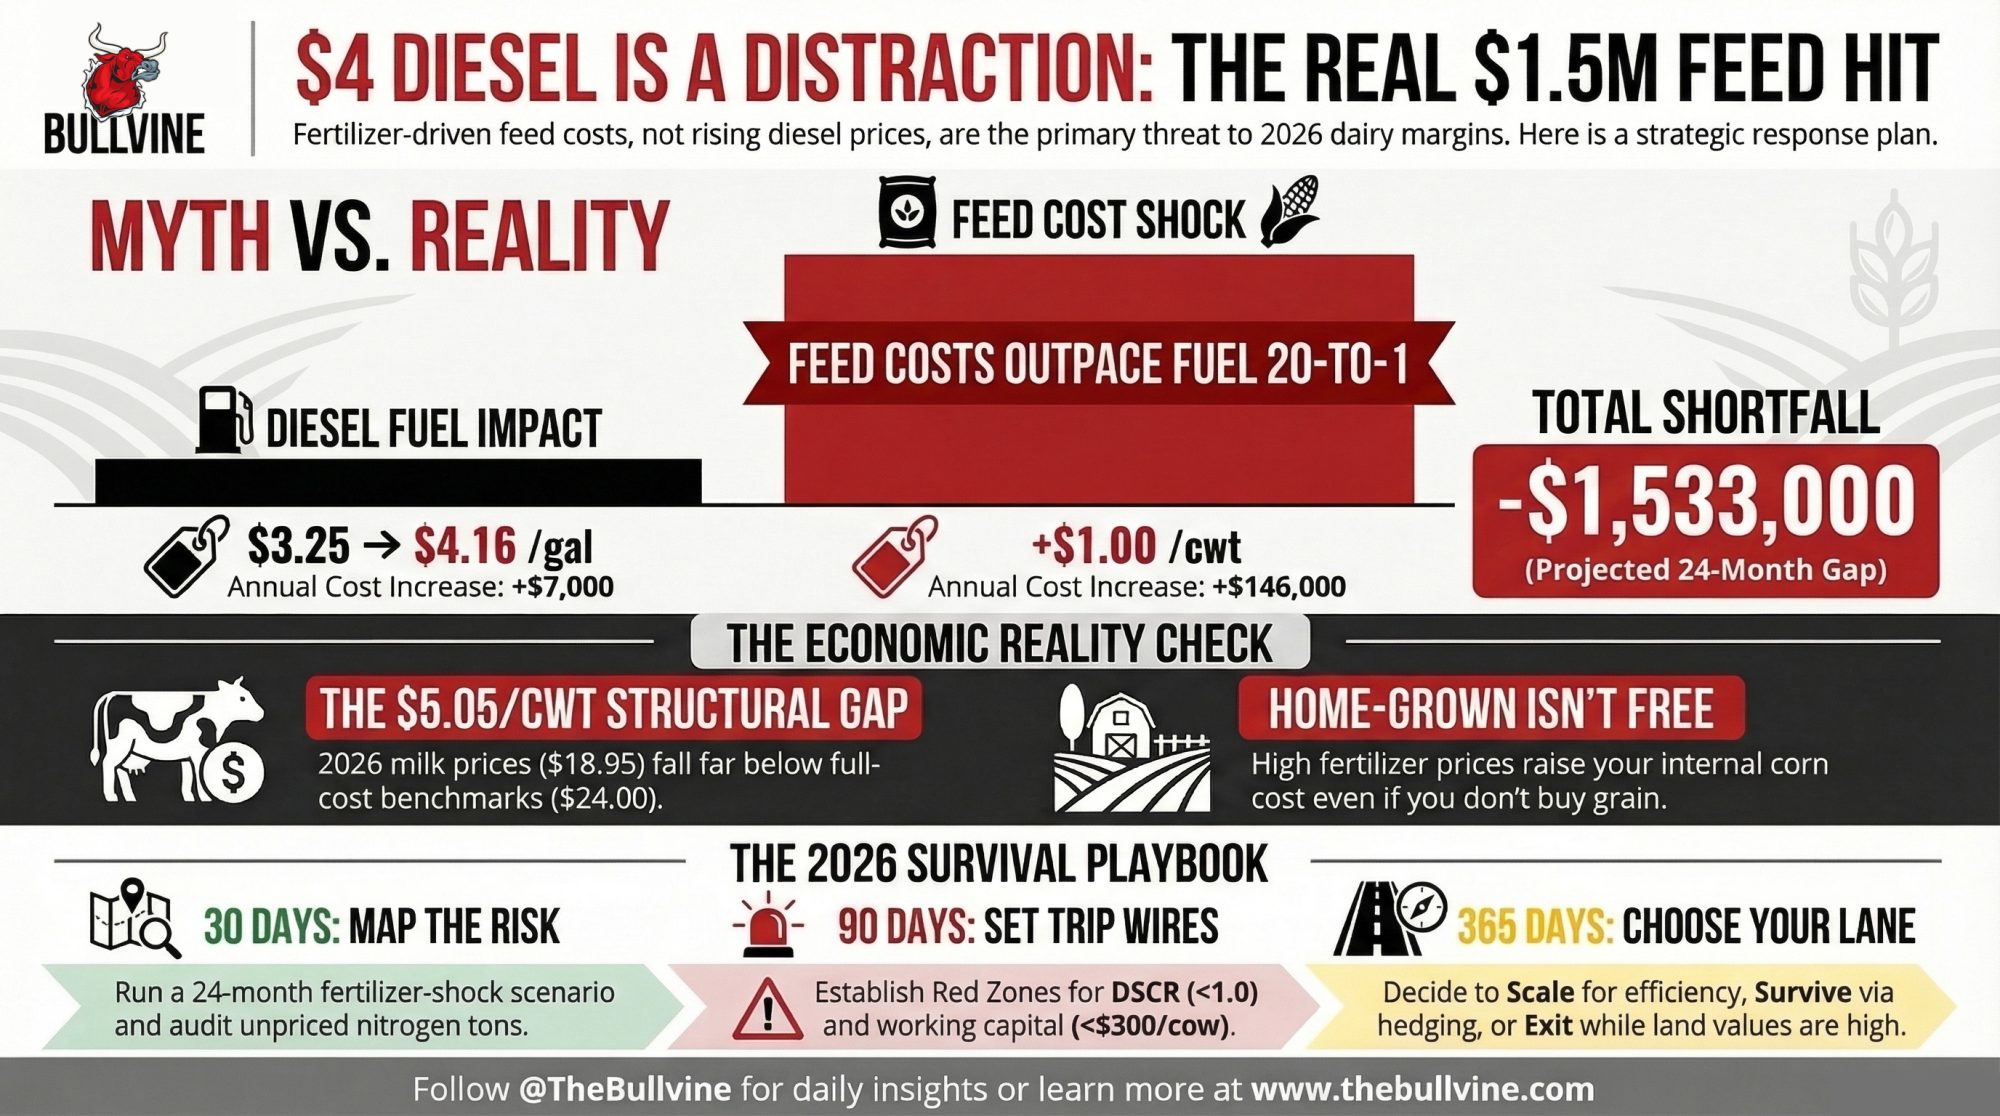
Executive Summary: The Iran–Hormuz war has shoved U.S. diesel over $4/gal and yanked fertilizer prices sharply higher, but for a 500‑cow Iowa dairy, $4.16 diesel is the distraction — the real 2026 hit is a fertilizer‑driven feed shock. USDA’s 2026 all‑milk price sits near $18.95/cwt while full‑cost benchmarks for many herds run $23–$24/cwt, so a lot of dairies start the year structurally in the red before that feed increase even shows up. In the modeled 500‑cow herd, higher diesel adds roughly $7,000 a year, but a realistic $1.00/cwt jump in feed cost tied to spiking urea and sulfur markets adds about $146,000 — pushing the 24‑month full‑cost shortfall toward $1.5 million if nothing else changes. That’s exactly why Kansas State economist Gregg Ibendahl argues fertilizer is “by far and away a bigger percent of total farm expenses than what fuel is” when Middle East conflict drives oil higher. The article walks through that barn math step‑by‑step and then gives a 30/90/365‑day playbook: run a 24‑month fertilizer‑shock scenario with your own numbers, set DSCR and working‑capital trip wires with your lender, pair milk‑side tools like DMC/DRP with feed coverage, and use strong cull and land markets as levers instead of last‑minute fire sales. In the end, it forces a decision every 300–700‑cow herd can’t dodge: if feed stays $1.00/cwt higher for the next two years, are you scaling, tightening up to survive, or planning a strategic exit while asset values still work in your favour?

For a typical 500‑cow family dairy based on real Iowa financials near Waterloo, and the 24‑month picture lands at roughly $1.5 million in negative cash flow once a fertilizer‑driven $1.00/cwt feed shock is layered into the barn math.
The herd we’re modeling here is a composite, built from the financials of several real Iowa operations. It isn’t one specific farm — but the math is designed to land close to what a lot of 500‑cow Midwest herds are actually facing: home‑grown forage and corn, buying the rest, carrying a normal amount of debt. Diesel at $4.16/gal feels like the obvious villain after the Iran conflict and the Strait of Hormuz closure pushed U.S. diesel prices to their highest level in nearly two years. But when you plug USDA’s $18.95/cwt all‑milk outlook into a 24‑month projection for a herd like this — then add a $1.00/cwt feed increase tied to fertilizer — it isn’t the fuel bill that does the real damage.

From Hormuz Headlines to a Fertilizer Squeeze
The year didn’t start with spreadsheets. It started with fuel tickets.
In late February and early March 2026, Iran’s war and attacks in the region raised the risk of serious disruptions in the Strait of Hormuz, the narrow corridor that handles a large share of global crude and refined product flows. Energy analysts warned it wasn’t just crude at stake — refined products like diesel and jet fuel that transit Hormuz were also in the line of fire, and buyers in Europe and Asia were already scrambling.

By early March, Reuters reported the U.S. national average diesel price hitting $4.04/gal — up 14.7¢ in a single dayand the highest in almost two years. Diesel futures on NYMEX surged more than 60¢/gal in two trading sessions, hitting a two‑year high as Hormuz risk repriced the entire energy complex. Regional rack prices in the Corn Belt climbed accordingly, putting posted farm prices like $4.16/gal across much of Iowa squarely in line with what herds are seeing at the pump right now.
While diesel was getting the headlines, the fertilizer market was moving just as fast — and in a way that cuts much closer to your feed line.
Brownfield Ag News reported that fertilizer bidding in parts of the U.S. was effectively paused as traders tried to price the Iran conflict. Argus Media showed New Orleans (NOLA) urea barge prices jumping from roughly $470/short ton to the $520–$550/st range in about a week, driven by shipping risk and short‑term supply fears. Analysts estimate that a large share of global fertilizer nutrients — roughly one‑third by some trade counts, including around 30% of seaborne urea — normally moves through Hormuz.
Sulfur was already on a tear. Brownfield quoted Fertilizer Institute economist Veronica Nigh, who said sulfur prices had roughly tripled compared to pre‑2022 levels, and that the Iran‑Hormuz situation was “only going to escalate markets” for sulfur‑dependent fertilizers like MAP and DAP. Those higher sulfur and nitrogen costs ripple straight into the N‑P‑K blends that underpin Corn Belt corn production.
Kansas State ag economist Gregg Ibendahl made the same point to Brownfield: fertilizer is “by far and away a bigger percent of total farm expenses than what fuel is.” That’s why he sees fertilizer as the bigger worry if oil stays high — and it’s the core tension driving the dairy feed cost 2026 story this article unpacks.
For a 500‑cow Iowa herd, those headlines don’t show up as lines on a Bloomberg chart. They show up as a much fatter feed‑cost line on the ledger.
Why “We Grow Our Own Corn” Isn’t a Free Pass on Fertilizer Risk
The first pushback you’ll hear at the coffee shop: “We grow our own corn — why should higher fertilizer prices hit our TMR?”

That’s where opportunity cost bites. Even if you never cut a check to a grain buyer, the economic cost of your corn is whatever you could reasonably sell it for in today’s market. If fertilizer pushes the cost of production per bushelhigher, you either:
- Raise your internal cost of corn in the ration, or
- Let the “crop side” of the business quietly eat that higher cost so the dairy side can pretend corn is still cheap.
Here’s what that looks like in practice. Say it costs you $4.50/bu to grow corn this year — and the local elevator bid is $5.20/bu. Your TMR is using $5.20 corn whether you wrote a check or not. That extra $0.70/bu flows straight through to feed cost per cwt. On a ration running roughly 55 lb of corn silage equivalent per cow per day across 500 cows, that spread adds up faster than most herds want to admit. And when fertilizer prices spike, the gap between your growing cost and your opportunity cost can widen — or your growing cost itself climbs toward that market price, erasing the discount you thought you had.
Corn budgets from land‑grant economists across the Corn Belt consistently show fertilizer as the single biggest line item in production costs, often topping $200/acre for N‑P‑K when nitrogen prices spike. Iowa and Minnesota extension economists are blunt: when key inputs run higher, the cost per bushel of own‑grown corn rises, whether you sell that corn or feed it yourself.
If you don’t price home‑grown corn at its true opportunity cost, your checkbook might say the dairy is breaking even — but your crop enterprise is quietly subsidizing the cows. In 2026, with fertilizer linked directly to Hormuz risk and global trade, pretending home‑grown corn is insulated from that world is more wishful thinking than risk management.
What Does a $1.00/cwt Feed Shock Really Cost a 500‑Cow Herd?
USDA’s February 2026 Livestock, Dairy, and Poultry Outlook pegs the U.S. all‑milk price forecast at $18.95/cwt. At the same time, USDA‑ERS cost‑of‑production data and The Bullvine’s own analysis show average full‑cost benchmarks for large U.S. herds around $19.14/cwt, with the smallest herds north of $42.70/cwt. Even before diesel and fertilizer prices are re‑priced, many dairies start 2026 structurally in the red.

For this modeled 500‑cow herd, the working assumptions look like this, based on 2025 actuals and ERS‑style cost curves:
- 500 milking cows, averaging 80 lb/cow/day (0.8 cwt/day).
- Annual shipments ≈ 292 cwt/cow → about 146,000 cwt/year.
- Milk price assumption: $18.75/cwt (USDA all‑milk less a modest local basis).
- Full‑cost baseline: $23.00/cwt (feed, labour, interest, repairs, utilities, fuel, depreciation, and unpaid family labour).
The barn math:
- Milk revenue: 146,000 cwt × $18.75 ≈ $2,737,500/year.
- Total full cost: 146,000 cwt × $23.00 ≈ $3,358,000/year.
- Full‑cost shortfall: about $620,500/year.
Before any 2026 shocks, a herd built like this is already staring at roughly $620,500/year in full‑cost red ink. Equity is quietly covering the gap.
How Much Does $4.16 Diesel Actually Add?
USDA‑ERS and extension budgets typically put fuel and oil in the ballpark of $40–$60/cow/year when diesel sits closer to $3.25/gal. For this model, call it $50/cow/year at that lower level.
If the 2026 diesel average ends up at $4.15–$4.20/gal due to Hormuz disruptions and tighter inventories, that’s roughly a 28% increase in fuel costs.
Back‑of‑the‑envelope:
- Extra fuel cost per cow: $50 × 0.28 ≈ $14/year.
- For 500 cows: 500 × $14 ≈ $7,000/year.
Seven thousand dollars isn’t nothing. You still feel it every time you fill the tank. But set it beside a $620,000/year full‑cost gap, and it isn’t what decides if your farm is solvent in 24 months.
What Happens When Feed Runs $1.00/cwt Higher?
Feed is where the fertilizer story shows up on the ledger.
Between DMC margin reports and independent economic work, the underlying numbers suggest that many U.S. herds carried total feed costs in the $9–$12/cwt range through 2024–25, depending on ration and region. That’s where this composite herd lands.
Now layer in the fertilizer picture:
- NOLA urea up $50–$80/st in a week, with barges trading $520–$550/st vs. roughly $470/st the prior week.
- A large share of globally traded urea and other nutrients — estimates run around 30% — normally transits Hormuz.
- Sulfur prices have roughly tripled compared to pre‑2022 levels, squeezing MAP/DAP and other sulfur‑dependent fertilizers.
Under that setup, it’s realistic to model total feed ending up $1.00/cwt above 2025 for this herd.
For 146,000 cwt:
- Extra feed cost: 146,000 × $1.00 = $146,000/year.
Roll that into the full‑cost picture:
- Effective full cost: $24.00/cwt.
- New total cost: 146,000 cwt × $24.00 = $3,504,000/year.
- Gap vs. $18.75 milk: ≈ $766,500/year.
| Scenario | Annual Full-Cost Gap | 24-Month Shortfall | Driver |
| Baseline (No Shocks) | $620,500/year | $1,241,000 | Milk $18.75, Costs $23.00/cwt |
| With Fertilizer Feed Shock | $766,500/year | $1,533,000 | Feed +$1.00/cwt = $146K/year extra |
| Feed Shock Alone (Incremental) | +$146,000/year | +$292,000 | Urea, sulfur, opportunity cost |
| Diesel Increase (Context) | +$7,000/year | +$14,000 | $4.16/gal, 28% above baseline |

Stretch it over two years:
- Without the feed shock, roughly $1.24 million in modeled full‑cost shortfall over 24 months.
- With the feed shock: roughly $1.53 million over 24 months.
That ~$290,000 difference over two years comes mostly from the fertilizer‑driven feed hit. And the feed shock itself — $146,000/year — is more than 20 times the modeled diesel increase on this herd.
On a cash‑cost basis — just bills paid — you might convince yourself you’re roughly breaking even at $19.00 milk. But once you include economic costs like depreciation, unpaid family labour, and realistic opportunity cost on home‑grown feed, this model says you’re still effectively short about $4.00/cwt. That’s how family equity quietly disappears over a 24‑month run — not in one crash, but in a slow bleed.
Picture three bars side‑by‑side:
- Diesel at $4.16/gal adds about $7,000/year.
- A $1.00/cwt feed shock adds about $146,000/year.
- The existing full‑cost gap is about $620,500/year — climbing to $766,500/year with the feed hit, and roughly $1.53 million over two years.
On that chart, the diesel bar barely clears the x‑axis.
The Turn: When Fuel Complaints Become Margin Decisions
Once that 24‑month picture is on the table, the lender conversation shifts — fast. Suddenly, the questions aren’t about fuel surcharges anymore.
The pattern playing out in lender offices across Iowa and Wisconsin this winter looks something like this: a producer walks in focused on $4‑plus diesel and shop bills, and by the time the 24‑month model is on screen, the conversation has shifted to feed cost per cwt, DSCR, and working capital per cow.
In those meetings, the math usually walks through three simple lines:
- USDA’s $18.95/cwt 2026 all‑milk forecast as the revenue anchor.
- The herd’s own 2025 full‑cost per cwt is in the $23–$24 range as the base.
- A $0.50–$1.00/cwt feed increase tied to fertilizer and acreage shifts if input prices stay elevated.
Seeing a mid‑six‑figure negative full‑cost margin per year in black and white changes priorities. Diesel stops being the complaint and becomes a line item inside a larger margin plan. The discussion moves from arguing over fuel surcharges to “What are my coverage options on milk and feed?” and “What happens to my DSCR if I don’t move?”
The contrarian takeaway is blunt: in 2026, building your risk plan around diesel alone is a distraction. The combination of sub‑$19/cwt milk, ERS full‑cost benchmarks, and a very realistic $1.00/cwt increase in feed costs is where the survival decision sits.
30/90/365‑Day Playbook for Fertilizer‑Driven Feed Risk
Once you accept a 24‑month picture like this one, the diesel surcharge argument stops mattering. What matters is the timeline.
Next 30 Days: Put the Risk on Paper

1. Run a 24‑Month Fertilizer‑Shock Scenario
Use your actual numbers, not somebody’s averages:
- Start from 2025 milk shipped and full costs from your own books.
- For 2026–27, plug in:
- All‑milk near $18.95/cwt, adjusted for your basis.
- Total feed at 2025 feed/cwt + $1.00.
- Non‑feed costs are flat unless you already know they’re moving (labour raises, interest resets, major repairs).
If that model shows a six‑figure annual full‑cost gap, the exact dollar amount matters less than the direction: if nothing changes, equity is doing the work.
2. Ask Your Nutritionist for Two “What‑If” Rations
Skip the small talk. Give them scenarios:
- Scenario A: corn $0.50/bu higher than your current purchase or opportunity cost; realistic protein prices.
- Scenario B: corn $1.00/bu higher, similar protein assumptions.
For each, ask for the updated feed cost per cwt and expected milk and components under your conditions. You’re not trying to guess the market. You’re trying to know your Plan B and Plan C before you’re forced into them.
3. Audit Your Fertilizer Exposure with Your Retailer
Sit down and actually map it:
- Tons of N, P, and K have already been purchased for 2026, and at what prices?
- Remaining tons still open while NOLA urea and related products trade higher on Hormuz news.
- Any signals of no bid, allocation, or tonnage caps on nitrogen, phosphate, or sulfur‑linked products from their suppliers.
For a herd like this one, that audit often surfaces an uncomfortable number: a sizable chunk of planned nitrogen for 2026 corn acres still unpriced — one of the key drivers behind the modeled $1.00/cwt feed risk.
4. Write This Number on the Whiteboard
What percentage of your 2026 milk and feed is actually priced or protected today? Write it down next to your current DSCR. If both answers make you uncomfortable, that’s the signal to act on the next two sections — not wait for better numbers.
Next 90 Days: Move from Drift to Defined Trip Wires
5. Put Numeric Trip Wires on the Wall — and Share Them with Your Lender
Exact thresholds vary by lender and operation, but these bands are consistent with how many Midwest ag banks think about DSCR and working‑capital risk:
| Metric | Healthy (Green) | Warning (Yellow) | Critical (Red) |
| DSCR | > 1.25× | 1.0× – 1.25× | < 1.0× |
| Working capital/cow | > $600/cow | $400 – $600/cow | < $300/cow |
| Feed cost vs 2025 | Baseline | +$0.50/cwt (3 months) | +$1.00/cwt (3 months) |
The key is for you and your lender to react to the same signals, rather than for them to quietly watch your ratios slip from the other side of the desk.
6. Pair Milk‑Side Tools with Feed‑Side Coverage
Dairy Margin Coverage (DMC) still has a role, but it only protects income over feed and doesn’t touch the sharp rise in non‑feed costs since 2021 — often 15–25% higher once you factor in labour, interest, repairs, and utilities on many herds.
The matched approach that pencils best for a herd in this position:
- On the milk side, use Dairy Revenue Protection (DRP) and/or forward contracts to put floors under a portion of projected 2026 milk, on top of DMC where it still pencils.
- On the feed side, layer in cash contracts, HTAs, or options to cover 50–70% of expected corn and protein usage at levels that still work in the 24‑month model.
You give up some upside. In return, you reduce the chance that low milk and high feed hit at the same time and shove your DSCR under 1.0× for multiple quarters.
7. Use Strong Cull Cow Prices as a Strategic Lever
USDA and market reports show record‑high average cull cow prices in 2024, with national averages near $127/cwt, and outlooks suggest 2025 stays historically strong with tight U.S. beef supplies.
In a herd running this model, the logical cull protocol looks like this:
- Identify the bottom 5–10% of cows by margin — factoring in reproduction, components, health, and feed efficiency, not just volume.
- Compare the economics of feeding those cows another year at higher feed costs versus shipping them into today’s beef market.
- Look at how many stalls would be better filled by more profitable cows or left open in a high‑feed‑cost environment.
Fewer cwt shipped in the short term vs. potentially stronger cash flow per stall when feed is expensive. That’s the trade‑off.
Next 365 Days: Decide Whether You’re Scaling, Surviving, or Exiting
If the Iran conflict, Hormuz closure, and tight fertilizer supplies stretch through the 2026 planting and harvest windows, this isn’t just a rough patch. It’s the operating environment for at least one full feed year.
At some point in the next year, most mid‑size herds will be pushed into one of three lanes:
- Scaler: You see a credible path to lower cost per cwt by growing more cows per worker, better use of parlours and barns, and stronger purchasing power. This demands capital, management depth, and a lender willing to back it. You gain lower unit costs if it works; you give up flexibility and increase exposure if markets turn faster than you can adapt.
- Survivor: You aim to hold the current scale but treat DSCR, working capital per cow, and feed cost per cwt as non‑negotiable dashboard metrics. That means consistent use of DMC/DRP and feed coverage so you’re managing margins, not just prices.
- Strategic Exit: You recognize that with $18.95/cwt milk and $23–$24/cwt full costs, your current structure may not carry the risk you’re facing. You use still‑strong land values, elevated cull and replacement prices, and, if necessary, restructuring tools to exit or reshape the business on your own timeline instead of waiting for the bank to decide.
Brownfield and Iowa State survey work describe remarkably resilient Iowa and Corn Belt farmland values into 2024 and 2025, with high‑dollar sales continuing and roughly 80–84% of Iowa farmland reported as debt‑free in recent data. For operations under real margin strain, that resilience is a capital‑preservation lifeline.
If you act before you’ve burned through working capital, strong land values can function as a strategic exit ramp — letting you pay down debt, reposition, or walk away with balance‑sheet strength intact, rather than waiting until the bank is making the decisions for you.
The point isn’t which lane is “right.” It’s that pretending those choices aren’t on the table is the riskiest move of all.
What This Means for Your Operation
- If your rolling 3‑month feed cost per cwt is already $0.50–$1.00 above your 2025 average, you’re absorbing a fertilizer‑driven feed shock that can add roughly $70,000–$150,000/year to a 500‑cow herd.That’s the scale of risk this article is working with — not just a few cents on diesel.
- If your 24‑month cash‑flow at roughly $18.95/cwt milk and $23–$24/cwt full costs shows a six‑figure annual gap, you’re effectively financing operations with equity unless you change something. That’s when you have to decide: to scale, to survive, or to exit strategically.
- If your lender can’t hand you your current DSCR and working capital per cow, you’re making risk calls with less information than they have. Ask for those metrics and agree on trip wires that trigger specific actions — not “we’ll see what happens.”
- If your risk work focuses only on milk price and leaves feed completely open, you’re betting that fertilizer, corn, and protein behave. The 2026 fertilizer and Hormuz situation suggests that’s not a bet to leave unhedged.
- If you haven’t given your nutritionist and fertilizer supplier concrete “what if” scenarios to model, your next 30‑day move is simple: book those meetings and come out with backup rations, clear feed‑cost numbers, and a map of how much 2026 fertilizer is already priced.
- If you’re in the bottom DSCR or working‑capital bands and still planning business as usual, you’re letting the market decide when you hit the wall. Choose your lane while beef, land values, and buyer demand still work in your favour.
Key Takeaways
- If your total feed cost per cwt ends up more than $1.00 above your 2025 baseline, then on a 500‑cow herd shipping ~146,000 cwt/year, you’re looking at roughly $146,000/year in extra feed cost — a 20× issue compared to the diesel increase in this model.
- If your full‑cost model at around $18.95/cwt milk and $23–$24/cwt costs stays negative for two years, the real decision isn’t whether you can “tough it out” — it’s whether to scale, survive with tight trip wires, or pursue a strategic exit while asset values still work for you.
- If you don’t run a 24‑month fertilizer‑shock scenario and set DSCR, working‑capital, and feed‑cost trip wires in the next 30 days, you’re letting the fertilizer and feed markets decide how much equity you burn.
The Bottom Line
The 500‑cow Iowa herd in this article isn’t your farm. But its math looks uncomfortably close to what USDA and ERS numbers imply for a lot of real herds in 2026. Diesel is still going to sting every time you fill the tank. The real question is whether your feed and fertilizer lines are quietly doing far more damage over the next two years.
Pull your 2025 feed cost per cwt, your latest DSCR, and your working capital per cow. Layer in a $1.00/cwt feed increase on a 24‑month projection. What do your own numbers say — and do your current contracts protect you if that’s the path you’re on?
Complete references and supporting documentation are available upon request by contacting the editorial team at editor@thebullvine.com.
Learn More
- Feed Cost Reality Check: How Smart Dairy Operators Can Lock in $200+ Per Cow Savings While Markets Stay Predictable – Gain an immediate tactical edge by exploiting the current feed market stability window. This guide reveals how strategic alternative proteins and precision feeding can slash $200+ per cow from your annual bill, directly offsetting fertilizer-driven shocks.
- 4.23% Butterfat, $187,000 Gone: The Margin Math That Broke 2025 – And Shapes Your 2028 – Protect your farm equity by mastering the structural shifts shaping your bottom line through 2028. This analysis exposes why record component tests often mask a slow bleed and arms you with a framework to align genetics with future processor demands.
- The New Dairy Playbook: 5 Trends Redefining Profitability in 2025 – Future-proof your revenue streams by discovering how to neutralize rising labor and interest costs. This playbook breaks down the ROI on automated feeding and beef-on-dairy premiums, transforming your operation into a high-margin, data-driven profit engine starting today.
 The Sunday Read Dairy Professionals Don’t Skip.
 The Sunday Read Dairy Professionals Don’t Skip.
Every week, thousands of producers, breeders, and industry insiders open Bullvine Weekly for genetics insights, market shifts, and profit strategies they won’t find anywhere else. One email. Five minutes. Smarter decisions all week.


