


A 400-cow freestall has roughly $327,600 in annual revenue tied to products governments are now targeting. Here’s the barn math — and the phone call that splits two futures.
Executive Summary: Roughly a third of a 400‑cow Wisconsin herd’s annual milk revenue — about 16,800 cwt worth ~$327,600 at $19.50/cwt — is likely tied to ultra‑processed products that California has already started pushing out of schools, and Canada now tags with front‑of‑pack warning labels. This article shows how AB 1264, a federal warning‑label bill, and Health Canada’s new symbols quietly put pressure on flavoured milks, processed cheese, and dairy ingredients that many processors rely on for 25–40% of their throughput. Using a 400‑cow freestall as the example, it walks the barn math: if that exposed volume takes a $1.50–$2.50/cwt hit over the next decade, you’re looking at $25,000–$42,000/year off the milk check with the same cows and the same parlor. It contrasts how that risk lands in a deregulated U.S. FMMO system versus Ontario’s supply‑managed pool, and why geography changes your levers but not the direction of travel. You’ll get a concrete 30/90/365‑day playbook: the three questions to ask your processor now, how to map your own “UPF exposure” line item, and where breeding (A2/A2, κ‑casein BB, mastitis resistance, components) fits if you want more of your milk flowing into cheese, yogurt, and clean‑label programs instead of the policy blast radius. If you don’t know what percentage of your volume ends up in the ultra‑processed ladder — and what a $2/cwt squeeze on that slice does to your debt‑service coverage — this is the one market piece you actually can’t afford to skip.
California just defined “ultra‑processed food” in statute. A federal warning‑label bill is in the House. And your processor probably can’t tell you how much of your milk ends up in the products they’re targeting.
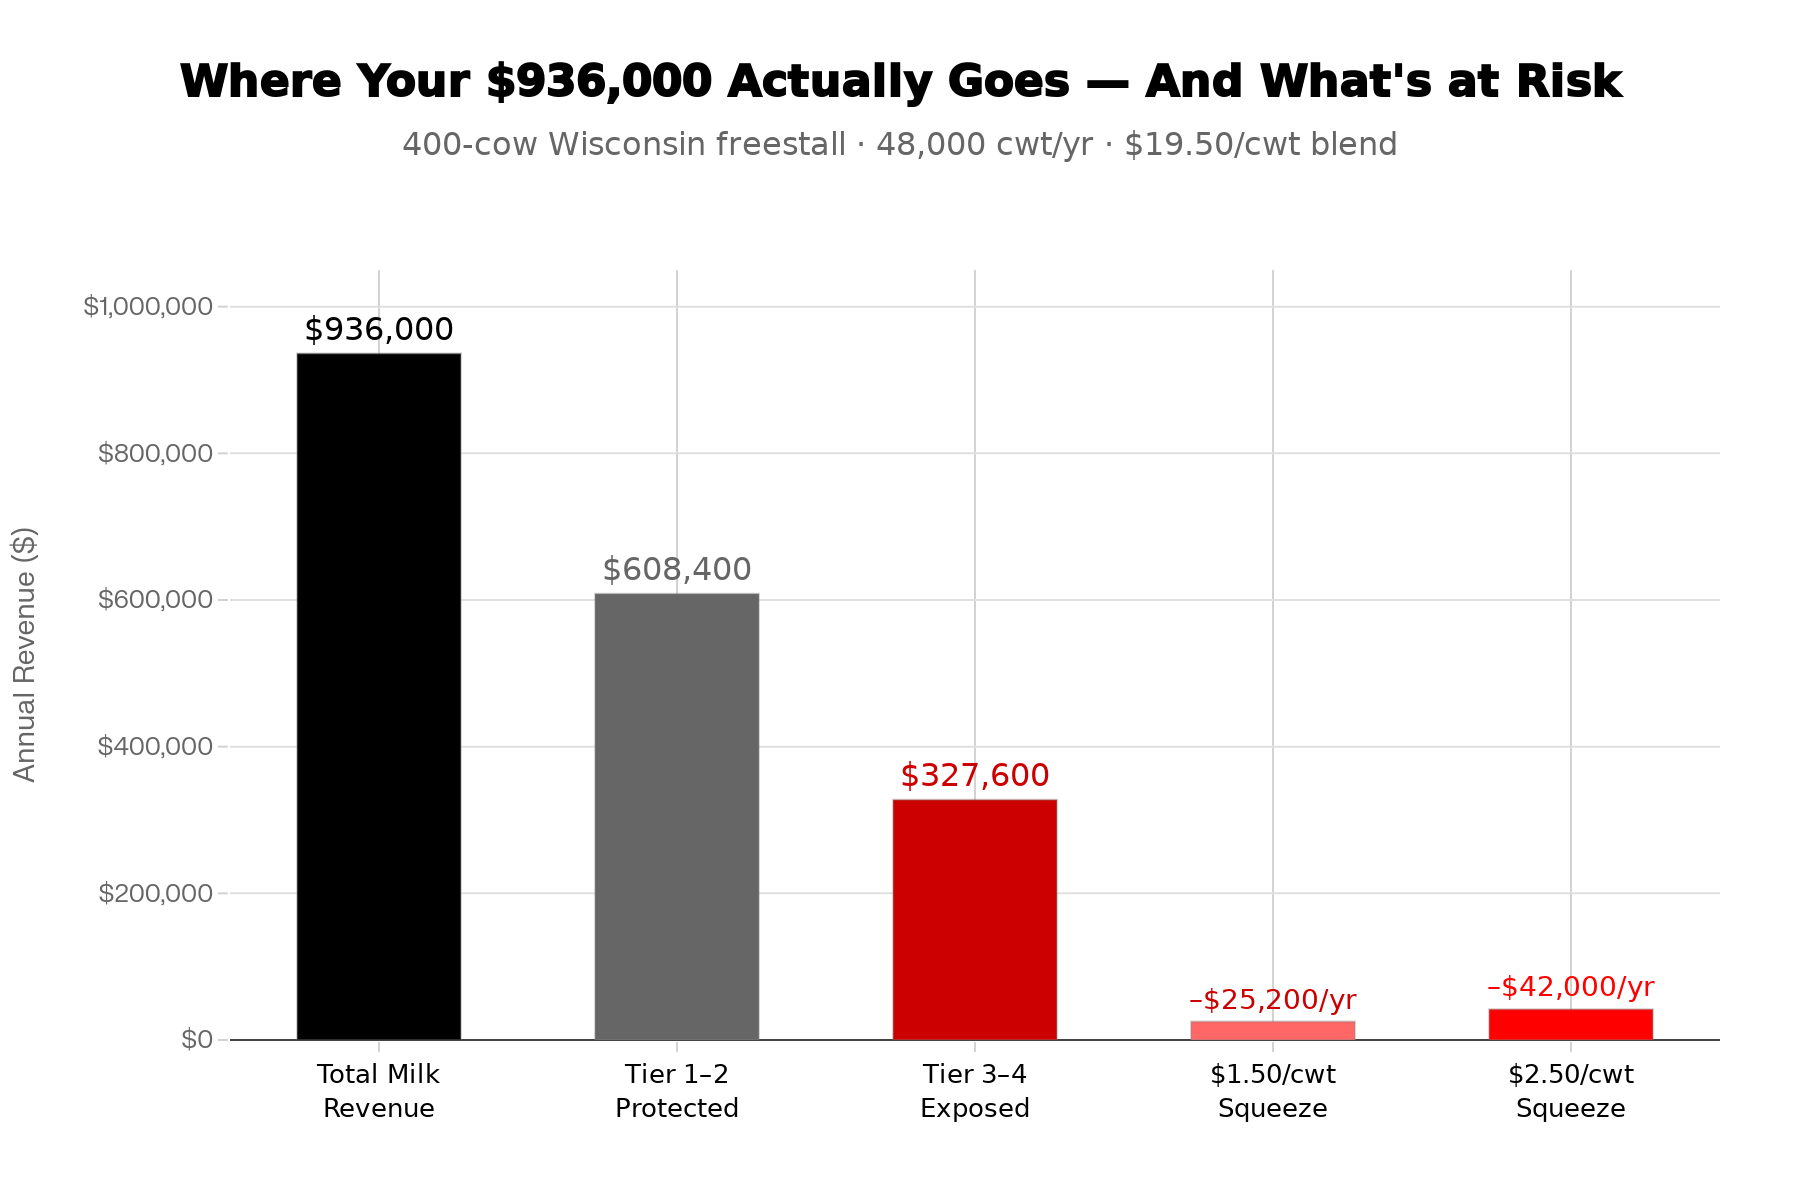
Take a 400‑cow freestall in southwest Wisconsin shipping about 120 cwt per cow per year. That’s 48,000 cwt annually. Wisconsin’s October 2025 all‑milk price sat at $19.50/cwt — not great, not catastrophic, just the kind of number that makes every line on your milk check matter. Now ask a question nobody’s putting on co‑op agendas: how much of that volume flows through your plant into flavored school milk, processed cheese slices, shelf‑stable puddings, and frozen‑meal ingredients?
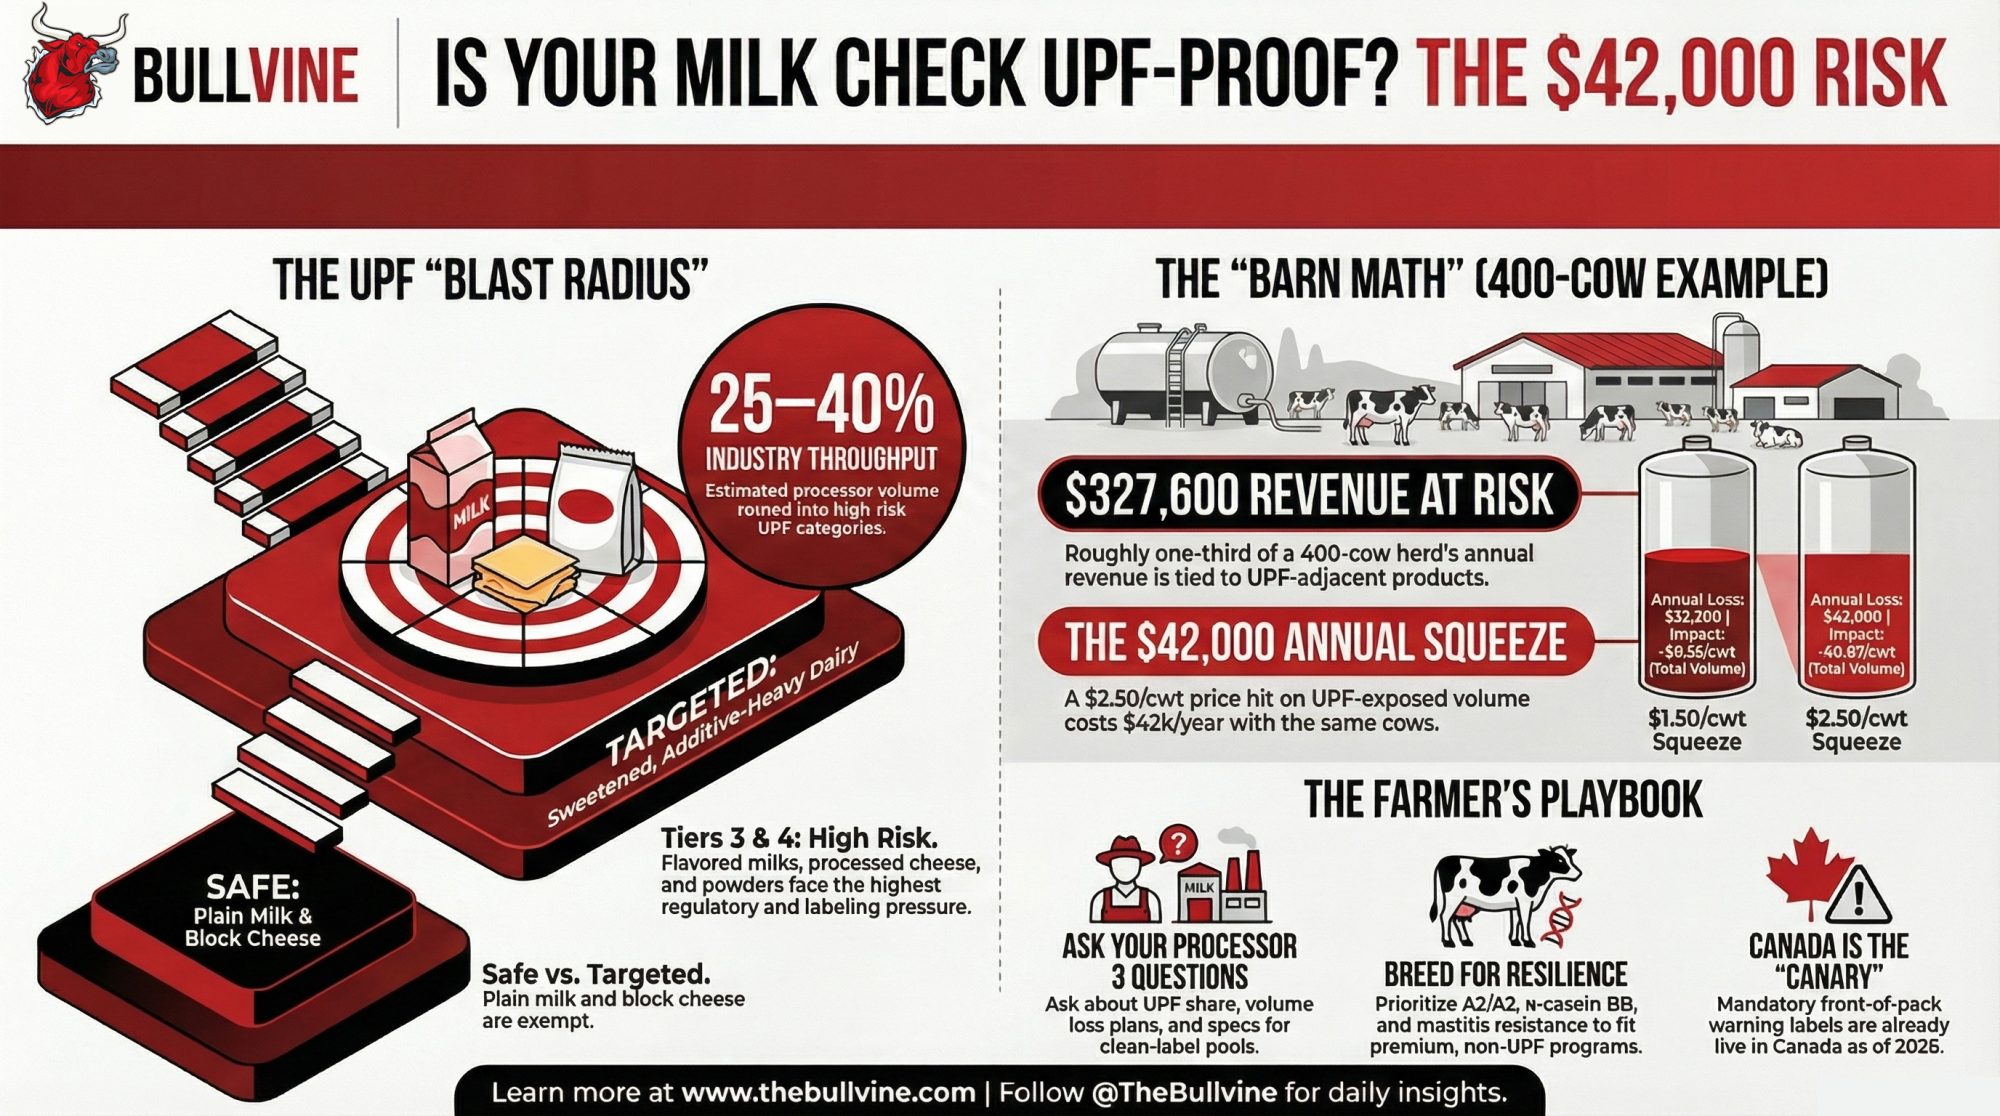
If roughly a third of your processor’s output lands in those ultra‑processed or UPF‑adjacent categories — and for many plants, 25–40% is a reasonable working range — then about 16,800 cwt of your annual production is tied to the part of the dairy case that legislators, public‑health researchers, and front‑of‑pack labeling agencies are now actively trying to shrink. At $19.50/cwt, that’s roughly $327,600 riding on product categories that just got a bullseye painted on them.
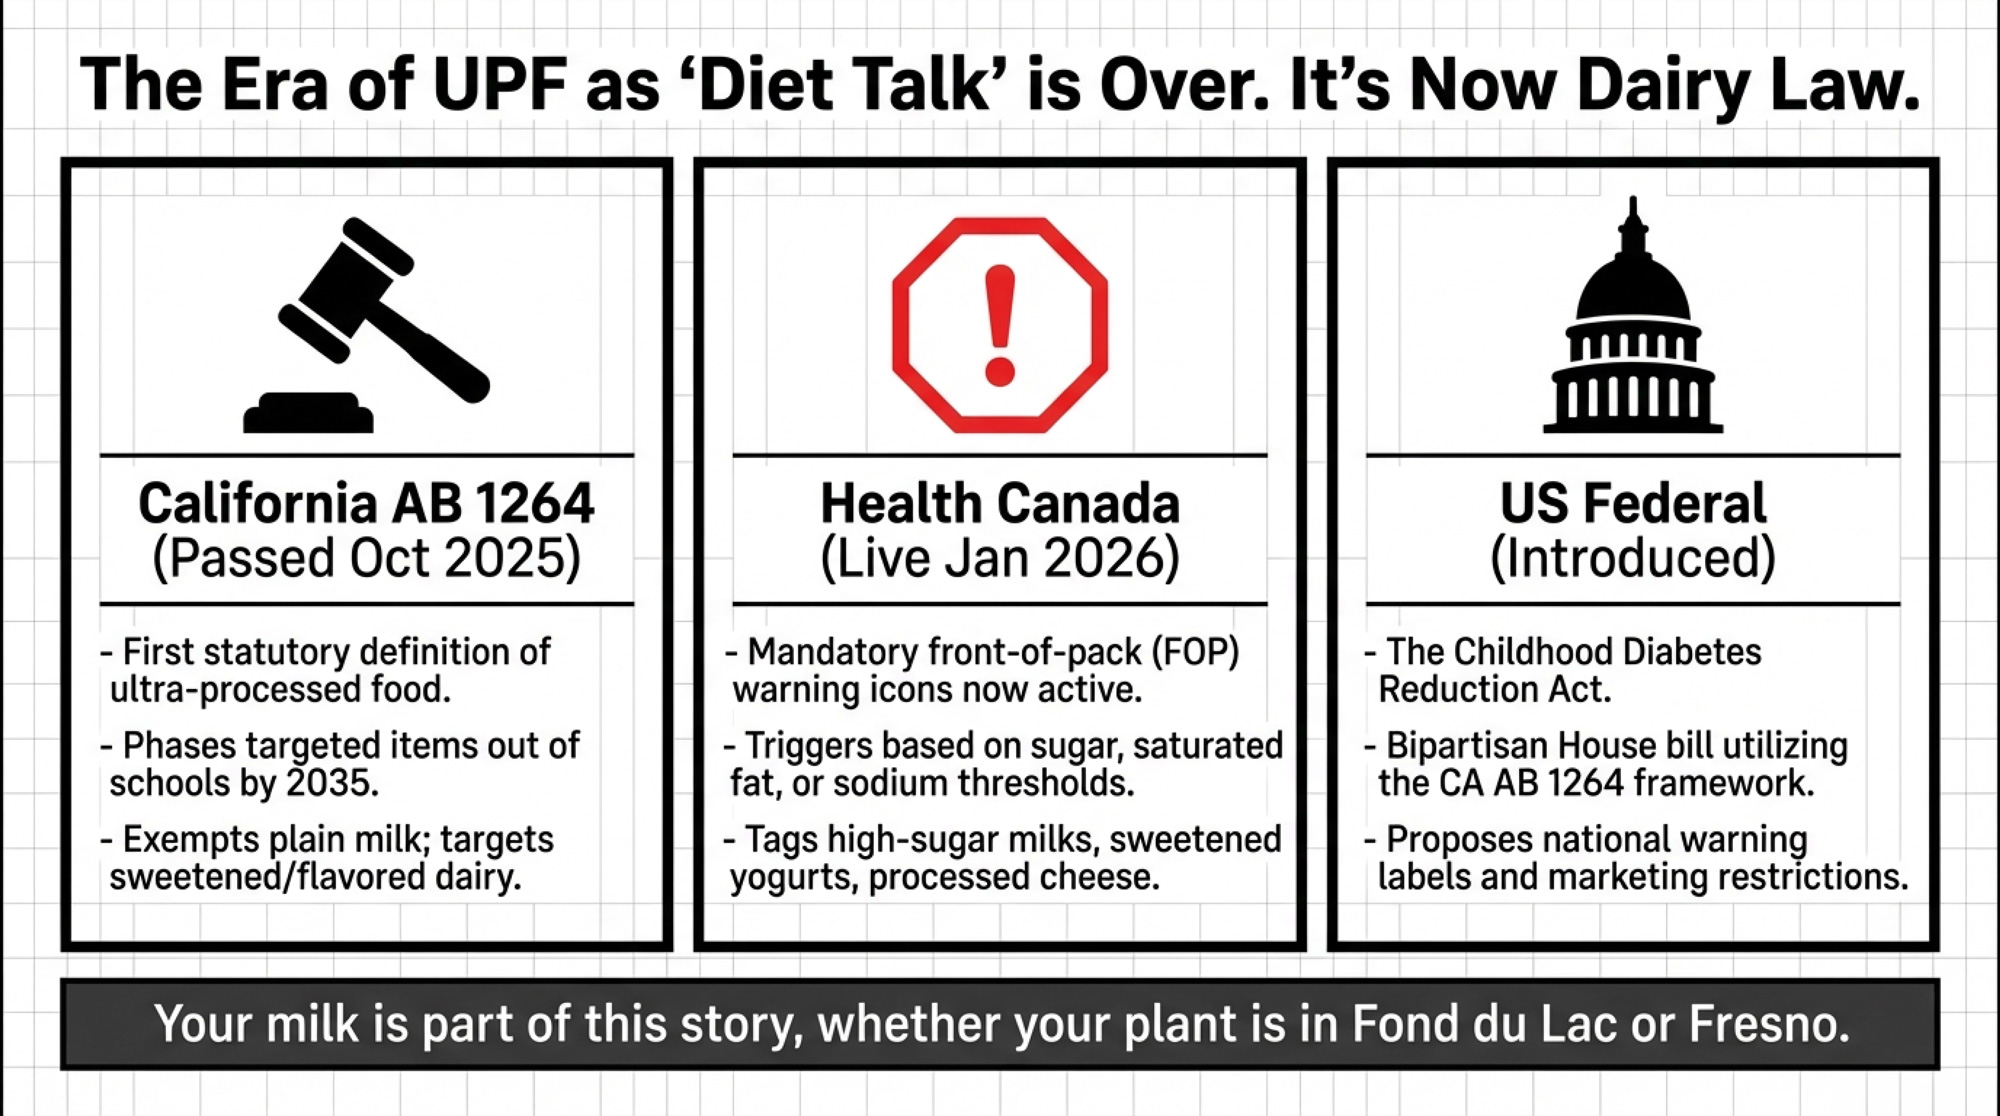
When Ultra‑Processed Moved From Diet Talk to Dairy Law
Three things happened in quick succession in late 2025, and together they changed what “ultra‑processed” means for your milk check.
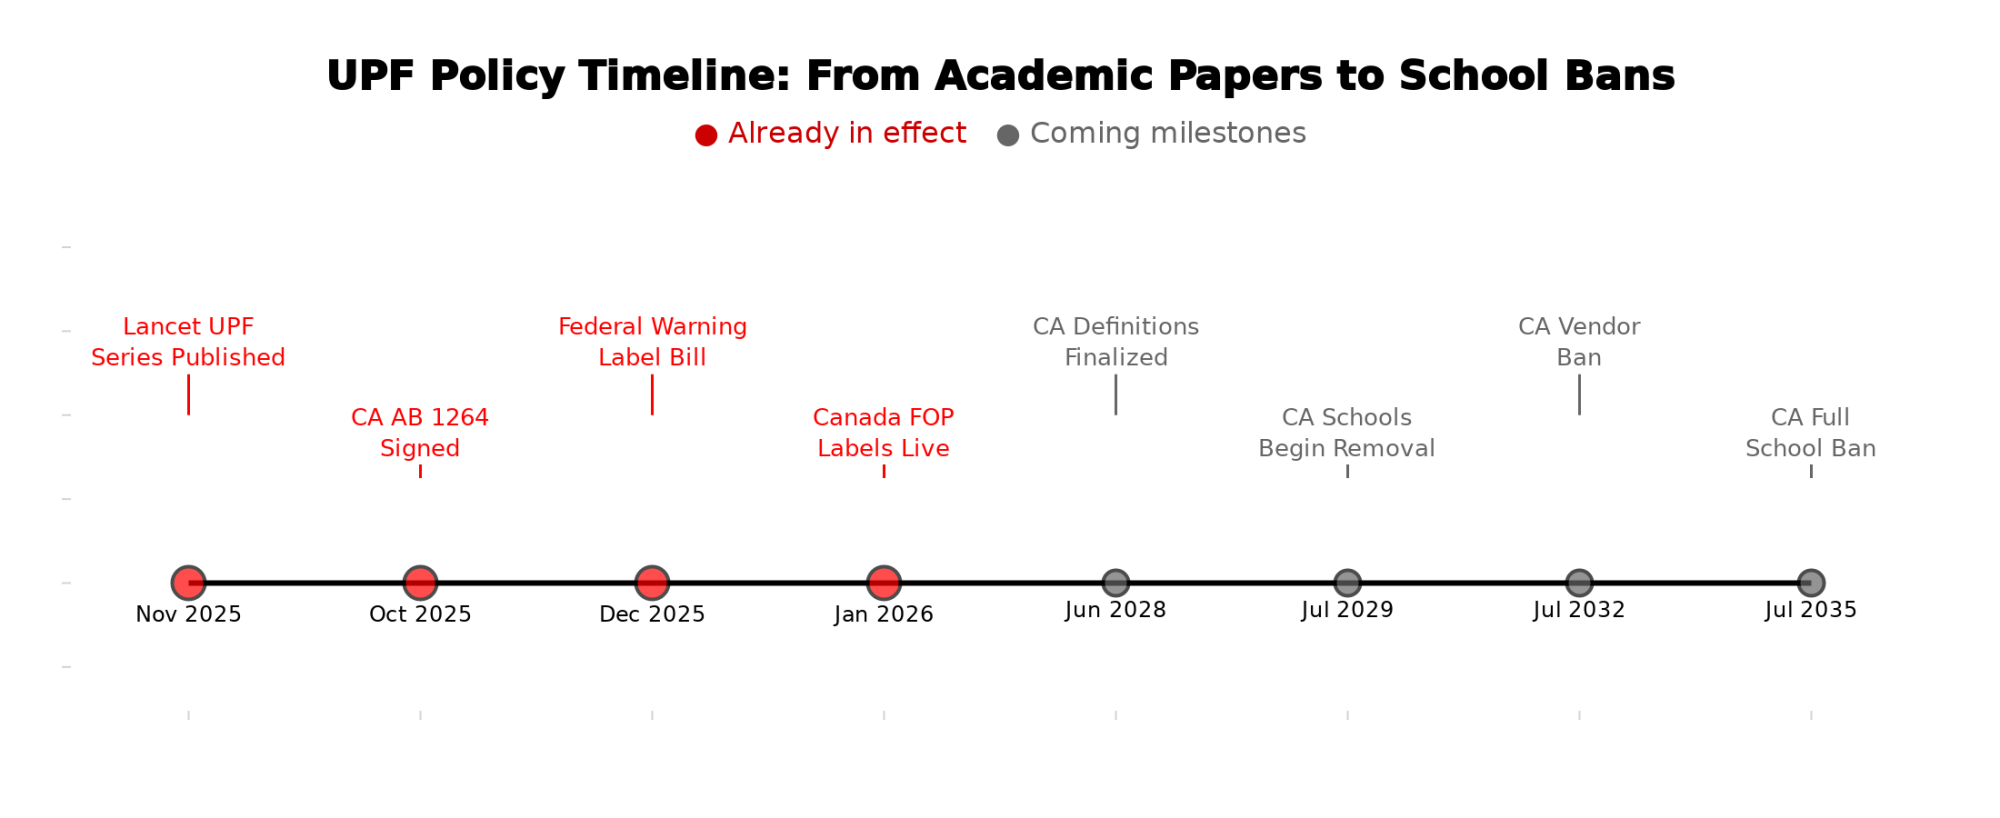
In November 2025, The Lancet published a three‑paper series arguing that the ultra‑processed food business model — long ingredient lists, industrial additives, products you can’t reproduce in a home kitchen — is structurally tied to higher risks of obesity, type 2 diabetes, and cardiovascular disease across multiple large cohort studies. The authors didn’t stop at dietary advice. They called for tobacco‑style policy: excise taxes, front‑of‑pack warning labels, marketing restrictions on children, and a shift in agricultural subsidies away from ultra‑processed supply chains.
California moved first. On October 8, 2025, Governor Newsom signed AB 1264, the Real Food, Healthy Kids Act — the first law anywhere to write a statutory definition of “ultra‑processed food” and begin phasing it out of school meals. The California Department of Public Health must finalize detailed definitions of “ultraprocessed foods of concern” by June 1, 2028. From there, the timeline tightens: vendor reporting starts February 1, 2028; schools begin removing targeted products by July 1, 2029; vendors can no longer offer them to schools after July 1, 2032; and schools can no longer serve or sell them by July 1, 2035. Plain pasteurized milk is explicitly exempt. Sweetened, flavored, and additive‑heavy dairy products are not.
Two months later, Representatives Don Beyer (D‑VA), Mike Lawler (R‑NY), and Scott Peters (D‑CA) introduced the Childhood Diabetes Reduction Act — a bipartisan House bill that would slap health warning labels on ultra‑processed foods nationally and restrict their marketing to children. The bill may or may not pass. But the definitional framework from AB 1264 is already being used as a template.
And north of the border, Canada didn’t wait. Health Canada’s mandatory front‑of‑pack nutrition symbols — warning icons on products exceeding thresholds for sugars, saturated fat, or sodium — took effect January 1, 2026. They don’t use the phrase “ultra‑processed,” but they tag many of the same dairy products: high‑sugar flavored milks, sweetened yogurts, processed cheese with elevated sodium.
Same direction. Three different tools. Your milk is part of this story, whether your plant is in Fond du Lac or Fresno.
The Four‑Tier Ladder: Where Does Your Milk End Up?
Forget the academic food‑classification debates. Here’s a practical way to think about where your milk lands after it leaves the bulk tank — and how much regulatory heat each destination carries.
| Tier | Product Examples (Dairy) | Processing Distance | Regulatory Pressure |
| Tier 1 – Minimally processed | Fluid milk, block cheddar, butter, plain yogurt | Short ingredient lists; limited processing | Lowest — exempt from AB 1264; generally outside FOP warnings |
| Tier 2 – Culinary processed | Shredded cheese, plain ice cream, cream, basic sour cream | Clearly dairy; modest added ingredients | Moderate — some trigger FOP sugar/fat/sodium icons but aren’t the primary UPF policy target |
| Tier 3 – UPF‑adjacent | Flavoured school milks, cheese powders, processed cheese slices, high‑sugar drinkable yogurts | Longer ingredient lists; stabilizers, flavours, colours | High — many fit AB 1264’s “ultraprocessed foods of concern” and Health Canada FOP warning profiles |
| Tier 4 – Core ultra‑processed | Frozen pizzas, frozen entrées, snack foods where dairy is one of many ingredients | Dairy as a small part of complex products | Highest — direct target of school‑meal bans, proposed warning‑label bills, and potential future taxes |
Policy pressure starts at Tier 4 and walks down the ladder. Your exposure isn’t how many cows you milk or what your components look like. It’s how much of your flow ends up in Tier 3 and 4 after it leaves the farm.
For many cheese‑and‑powder‑focused Midwest plants, a working estimate of 25–40% of total intake going into Tier 3–4 products is reasonable, though it varies significantly by plant and market. That’s not a hard statistic — it’s a range based on typical product mixes in mature dairy markets. The exact number at your processor is a question you should be asking, not a figure you should be guessing.
What Does UPF Risk Actually Cost a Wisconsin 400‑Cow Dairy?
Here’s the math. Plug in your own numbers where yours differ.
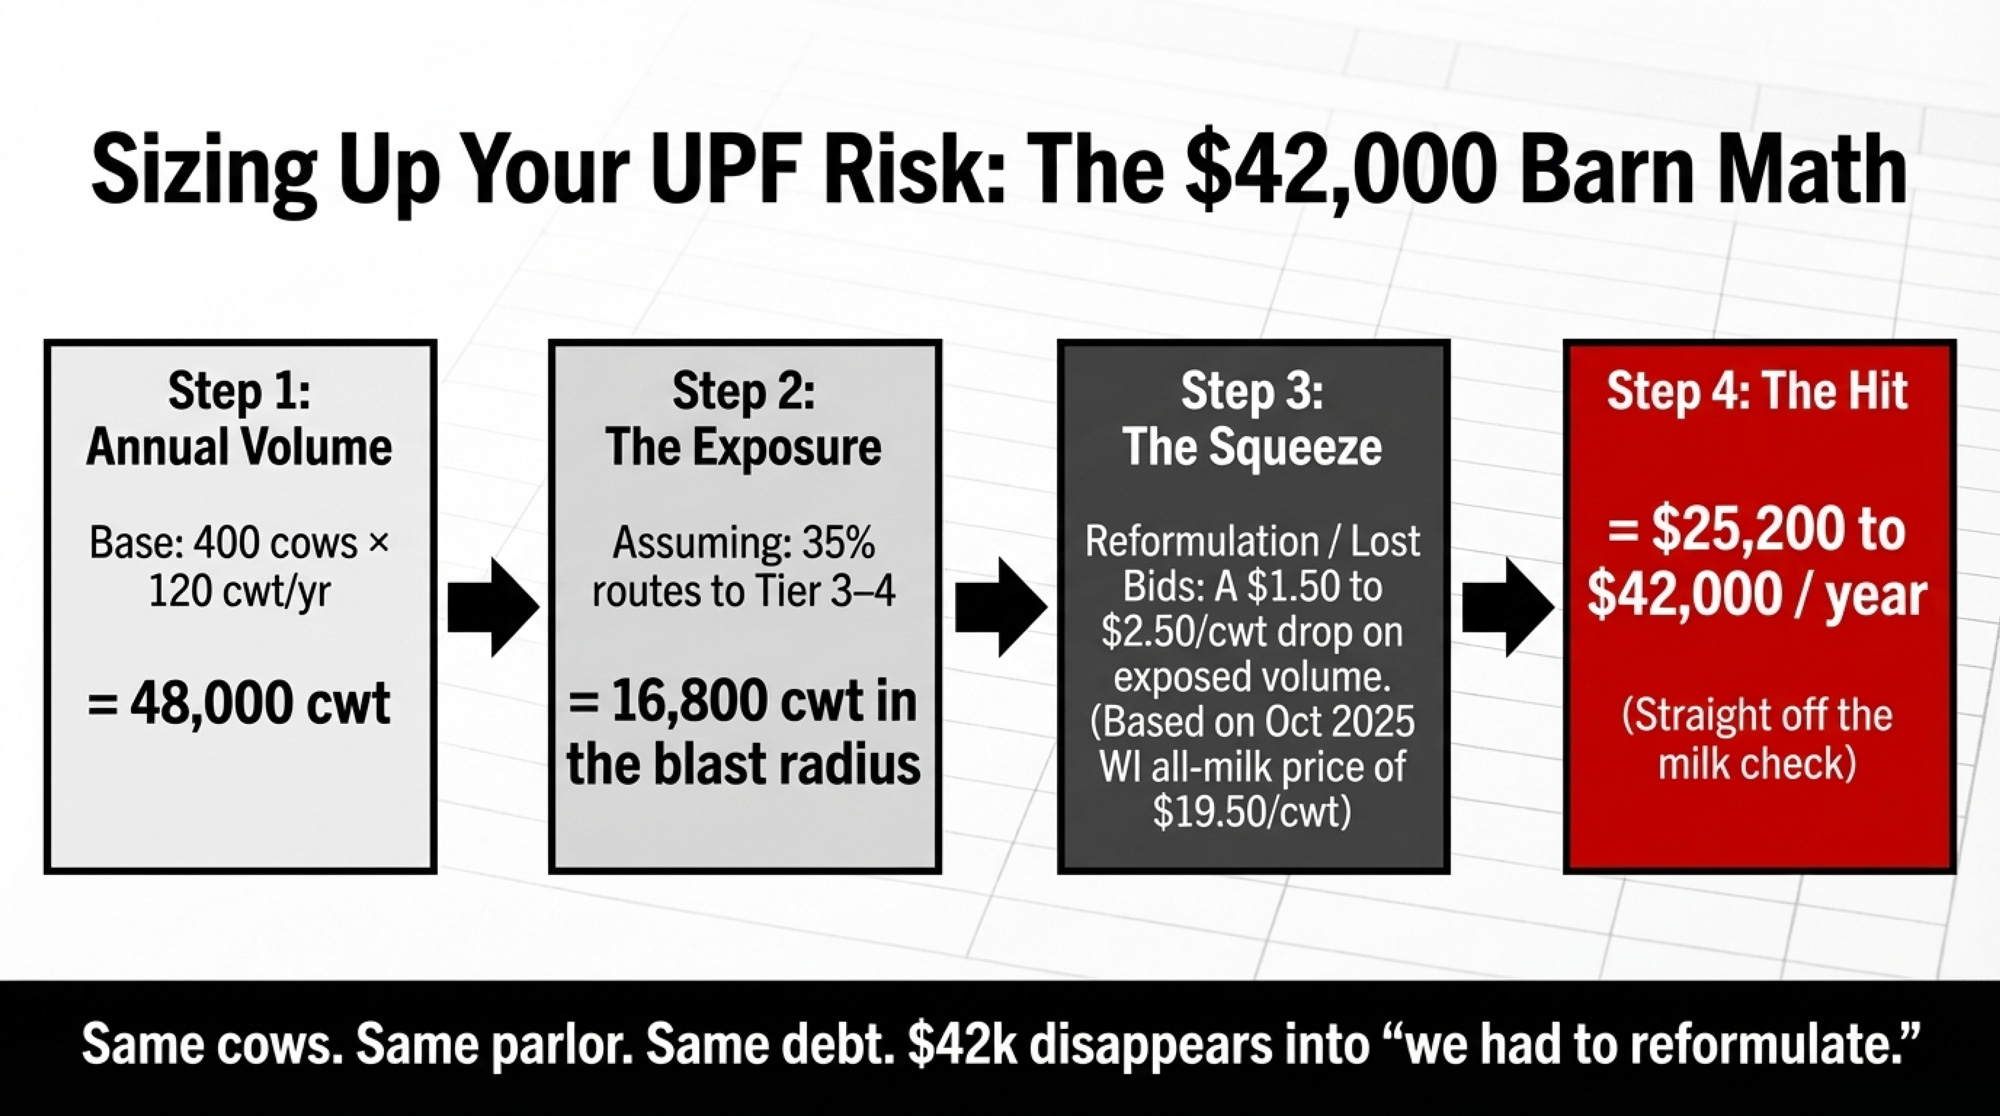
Step 1 — Annual volume 400 cows × 120 cwt/cow/year = 48,000 cwt
Step 2 — Exposed volume. If roughly 35% of your plant’s output routes through Tier 3–4 categories: 48,000 cwt × 35% = 16,800 cwt in the blast radius
Step 3 — Price context Wisconsin’s October 2025 all‑milk price: $19.50/cwt. U.S. Class III for October 2025: $16.91/cwt. By March 2026, Class III had slid to $16.16/cwt.
For the 400‑cow Wisconsin herd at $19.50/cwt:
- Total annual milk revenue: 48,000 × $19.50 = $936,000
- Revenue attached to Tier 3–4 products: 16,800 × $19.50 = $327,600
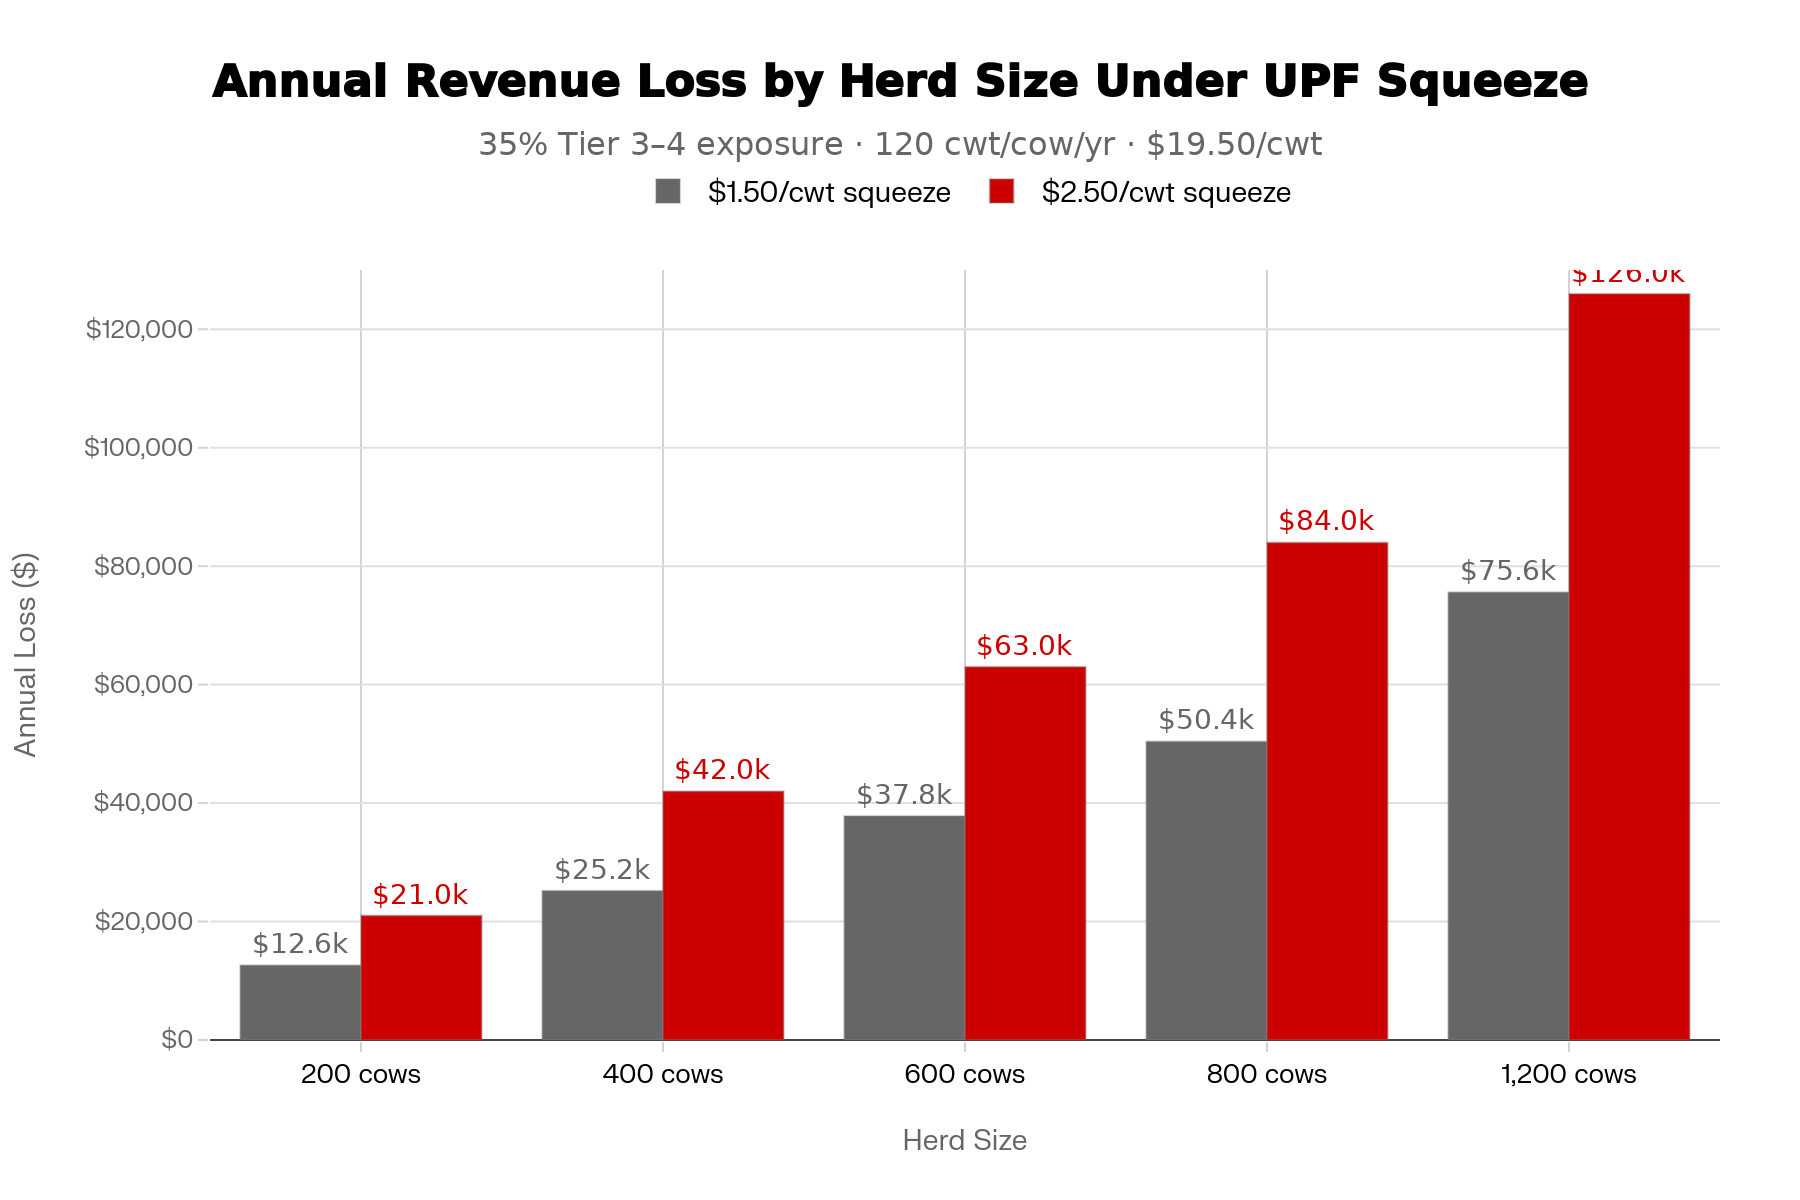
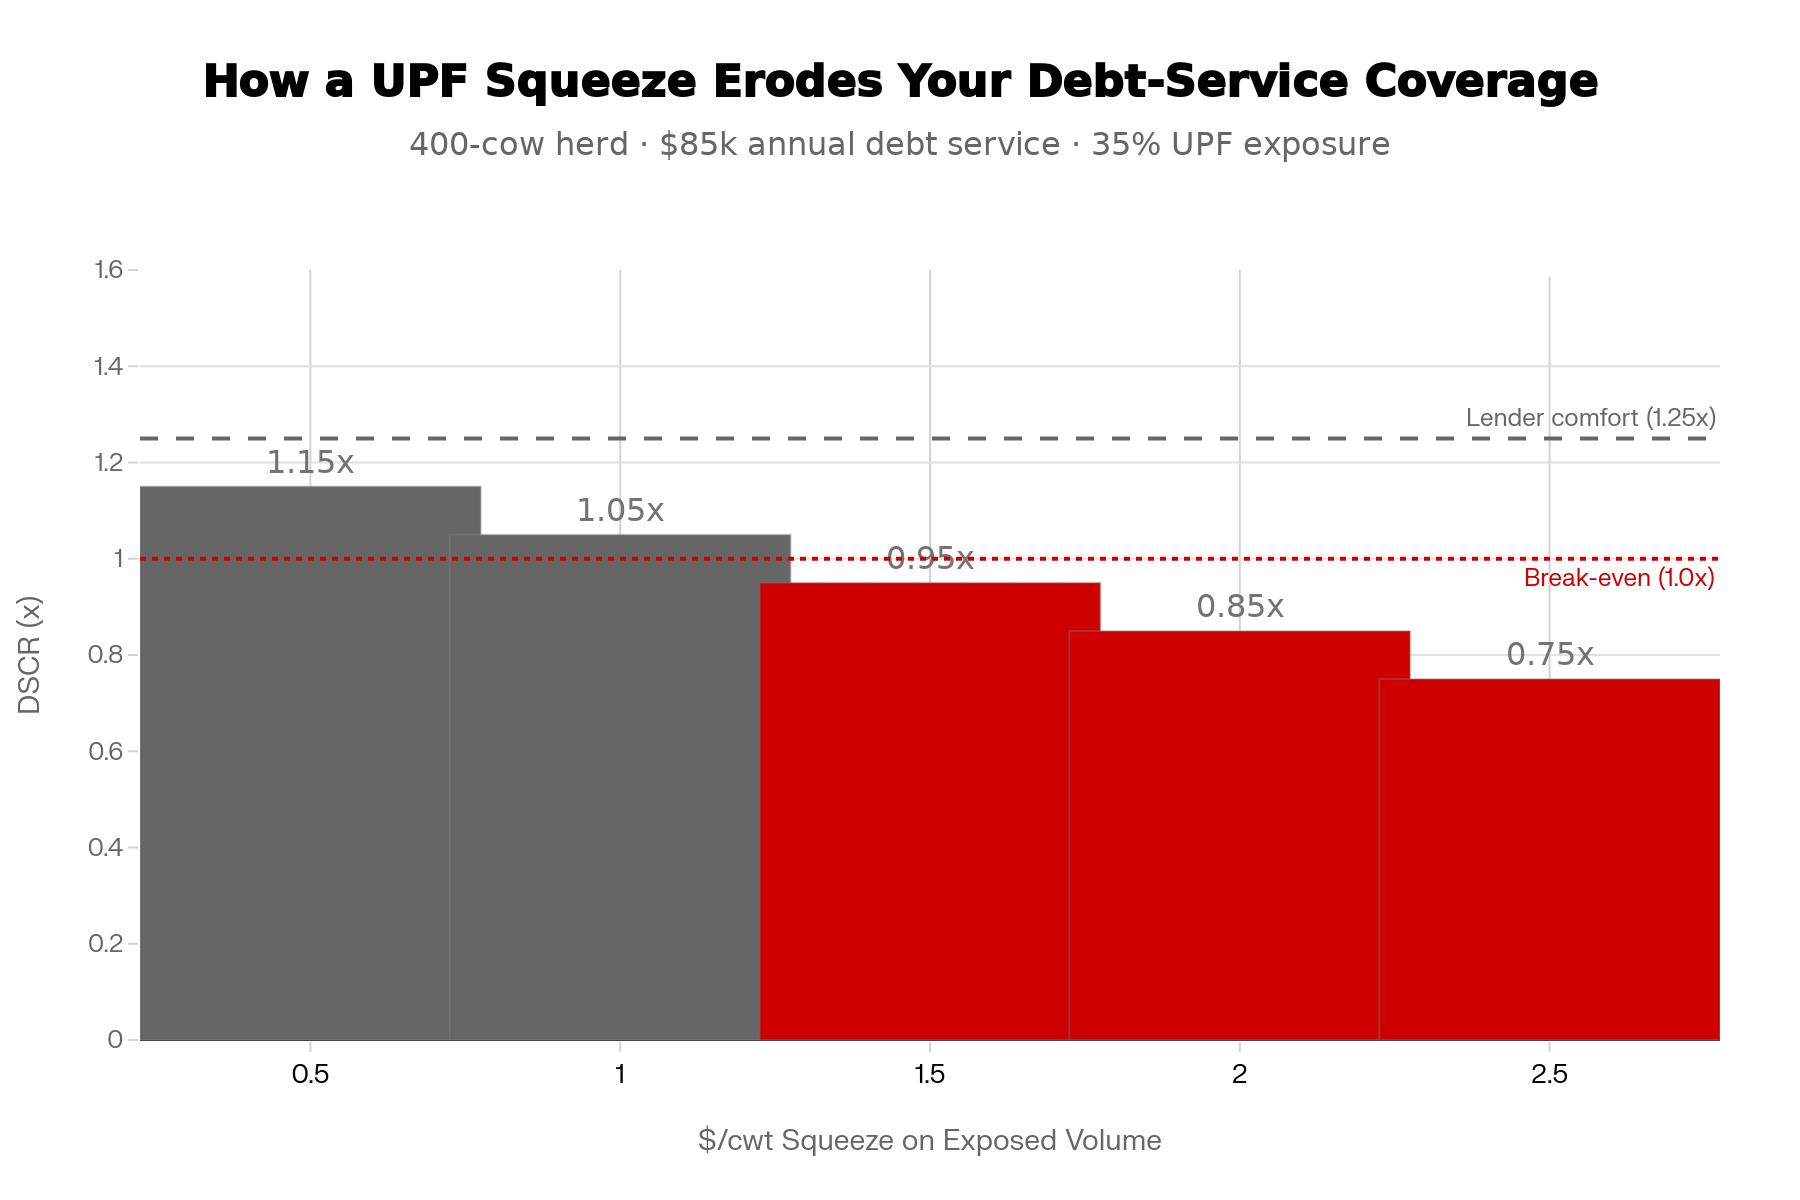
Step 4 — The squeeze scenario. If UPF pressure — school‑meal rules, warning labels, reformulation, buyer shifts — quietly shaves $1.50/cwt off the value of that exposed volume over the next several years: 16,800 × $1.50 = $25,200/year off your milk check.
If the squeeze lands closer to $2.50/cwt: 16,800 × $2.50 = $42,000/year
That’s $42,000 disappearing into “we had to reformulate,” “school‑milk bids are down,” and “our Class III utilization shifted” — with the same cows, same parlor, same debt service.
For Canadian readers: The math structure is identical. Swap in your October 2025 Ontario gross blend of roughly $42 CAD/cwt (95.46 $/hL per DFO’s October 2025 report ) and the exposed‑volume dollar amounts change, but the exposure percentage and the logic don’t. At the CAD blend, your 400‑cow total is closer to $2,016,000 CAD — and the $2.50/cwt squeeze still costs $42,000 CAD on 16,800 exposed cwt.
Meanwhile, North of the Border: What Supply Management Does — and Doesn’t — Protect
Ontario producers inside the P5 pooling system live in a different structural reality. You can’t easily pick up your quota and ship it to another plant next week. The P5 agreement spreads production and revenues across Ontario, Quebec, and the Atlantic provinces. That structure can spread pain and slow adjustment when specific product categories get squeezed. But it doesn’t erase the underlying economics. If the pool has to absorb lower returns on Tier 3–4 products, that drag still shows up in the blend.
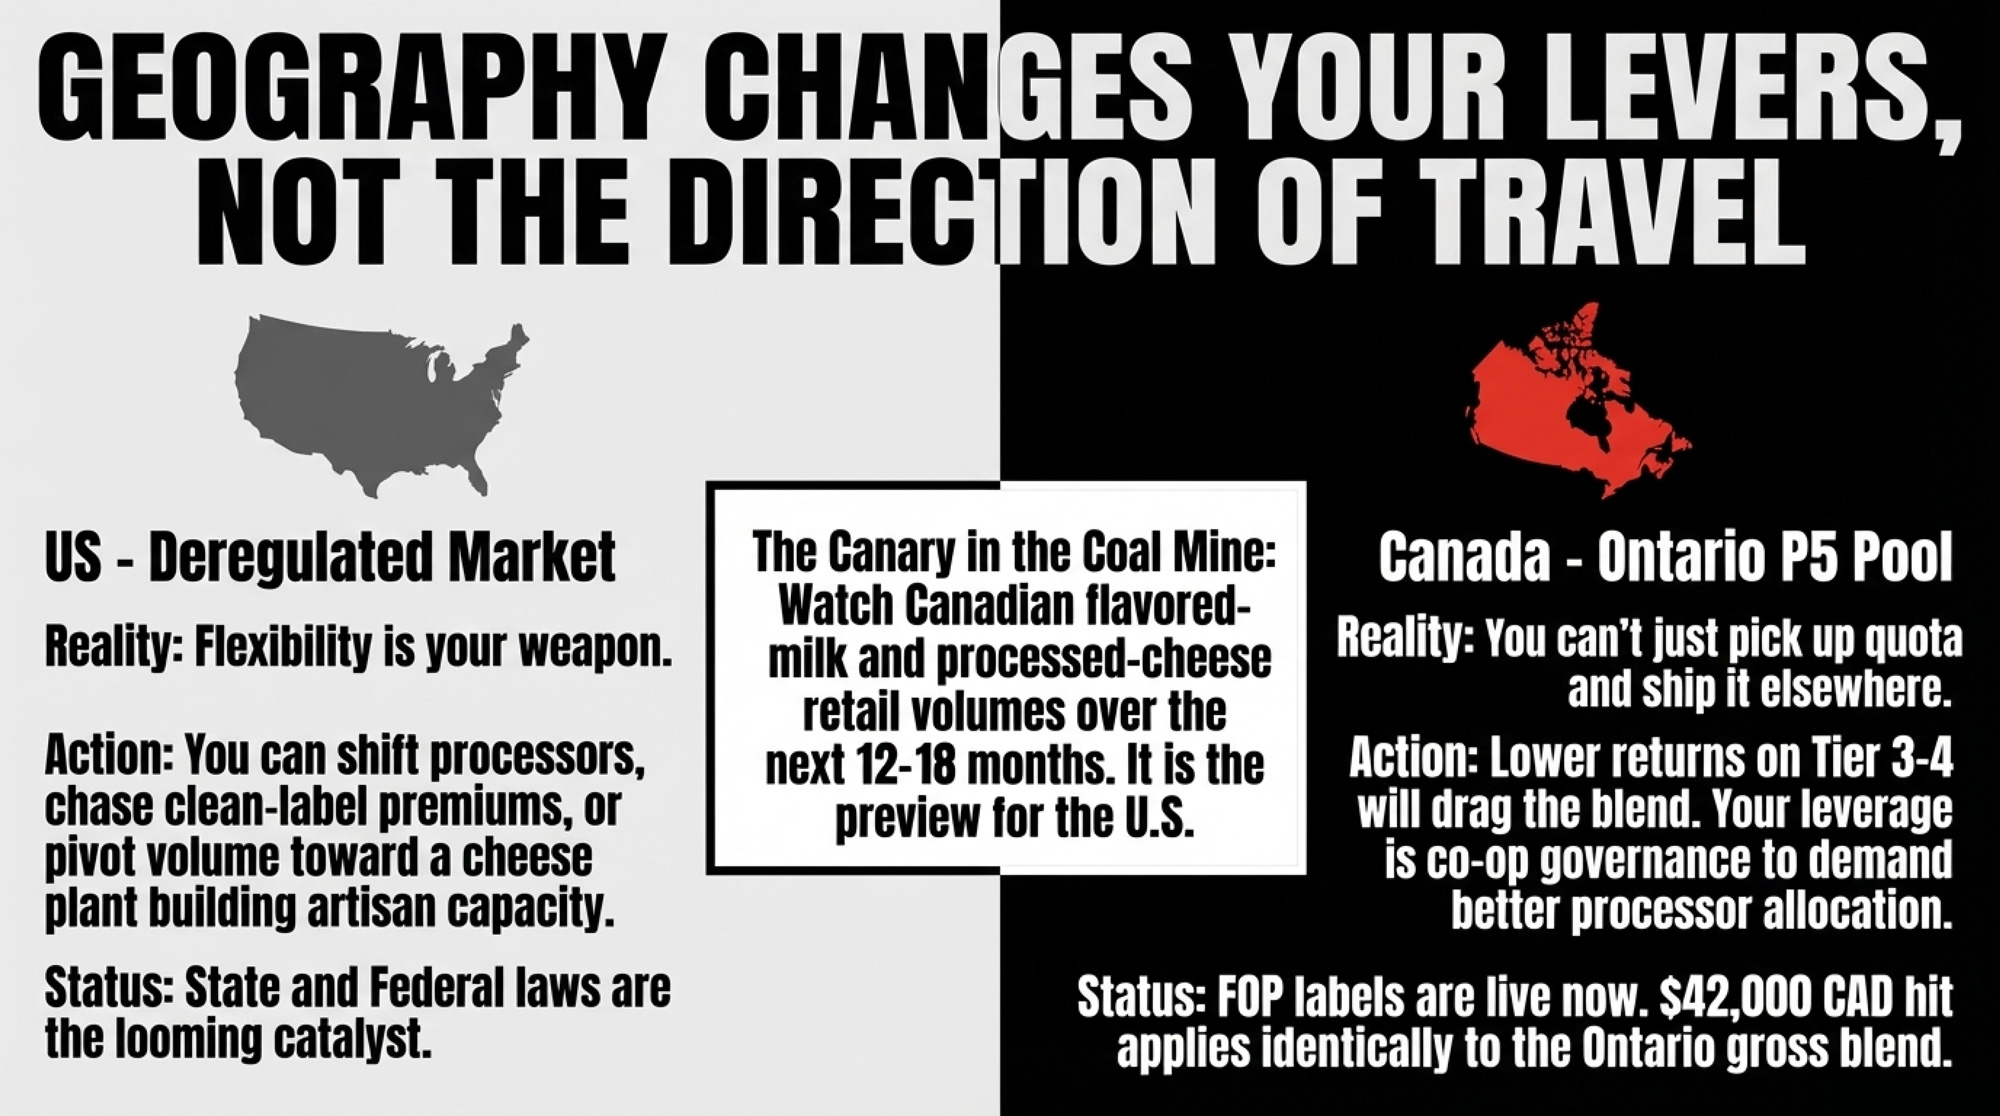
Canada’s front‑of‑pack labels are already live — not proposed, not in committee, live since January 1, 2026. That makes the Canadian market a leading indicator for U.S. producers. Watch what happens to flavored-milk volumes and processed‑cheese positioning in Canadian retail over the next 12–18 months. If those categories soften measurably under FOP labeling, the same dynamic will play out stateside once AB 1264’s school rules and any federal labeling take hold.
The key difference: a Wisconsin producer has more flexibility to shift processors, chase premiums, or pivot volume toward a cheese plant that’s building clean‑label capacity. An Ontario producer’s leverage comes through co‑op governance, producer meetings, and making their milk attractive enough on paper that the processor inside the system channels it toward the more resilient product lines. Different levers. Same direction.
| Wisconsin (U.S. FMMO) | Ontario (P5 Supply Mgmt) | |
| Pricing System | Deregulated; classified pricing via FMMO image.jpg | Supply-managed P5 pool across 5 provinces |
| Oct 2025 Blend | $19.50 USD/cwt image.jpg | ~$42 CAD/cwt ($95.46/hL) image.jpg |
| 400-Cow Revenue | ~$936,000 USD/yr | ~$2,016,000 CAD/yr |
| UPF Squeeze at $2.50/cwt | –$42,000 USD/yr | –$42,000 CAD/yr |
| UPF Labels Status | Proposed (federal bill in House) | Live since Jan 1, 2026 image.jpg |
| Producer Flexibility | Can switch processors, chase premiums | Locked to P5 pool; leverage via governance |
| Best Lever | Move volume to clean-label plants | Push co-op strategy through producer meetings |
| Why It Matters | You have options — but only if you’ve mapped them | Pool absorbs pain slowly, but drag still shows in blend |
The Phone Call That Splits Two Futures
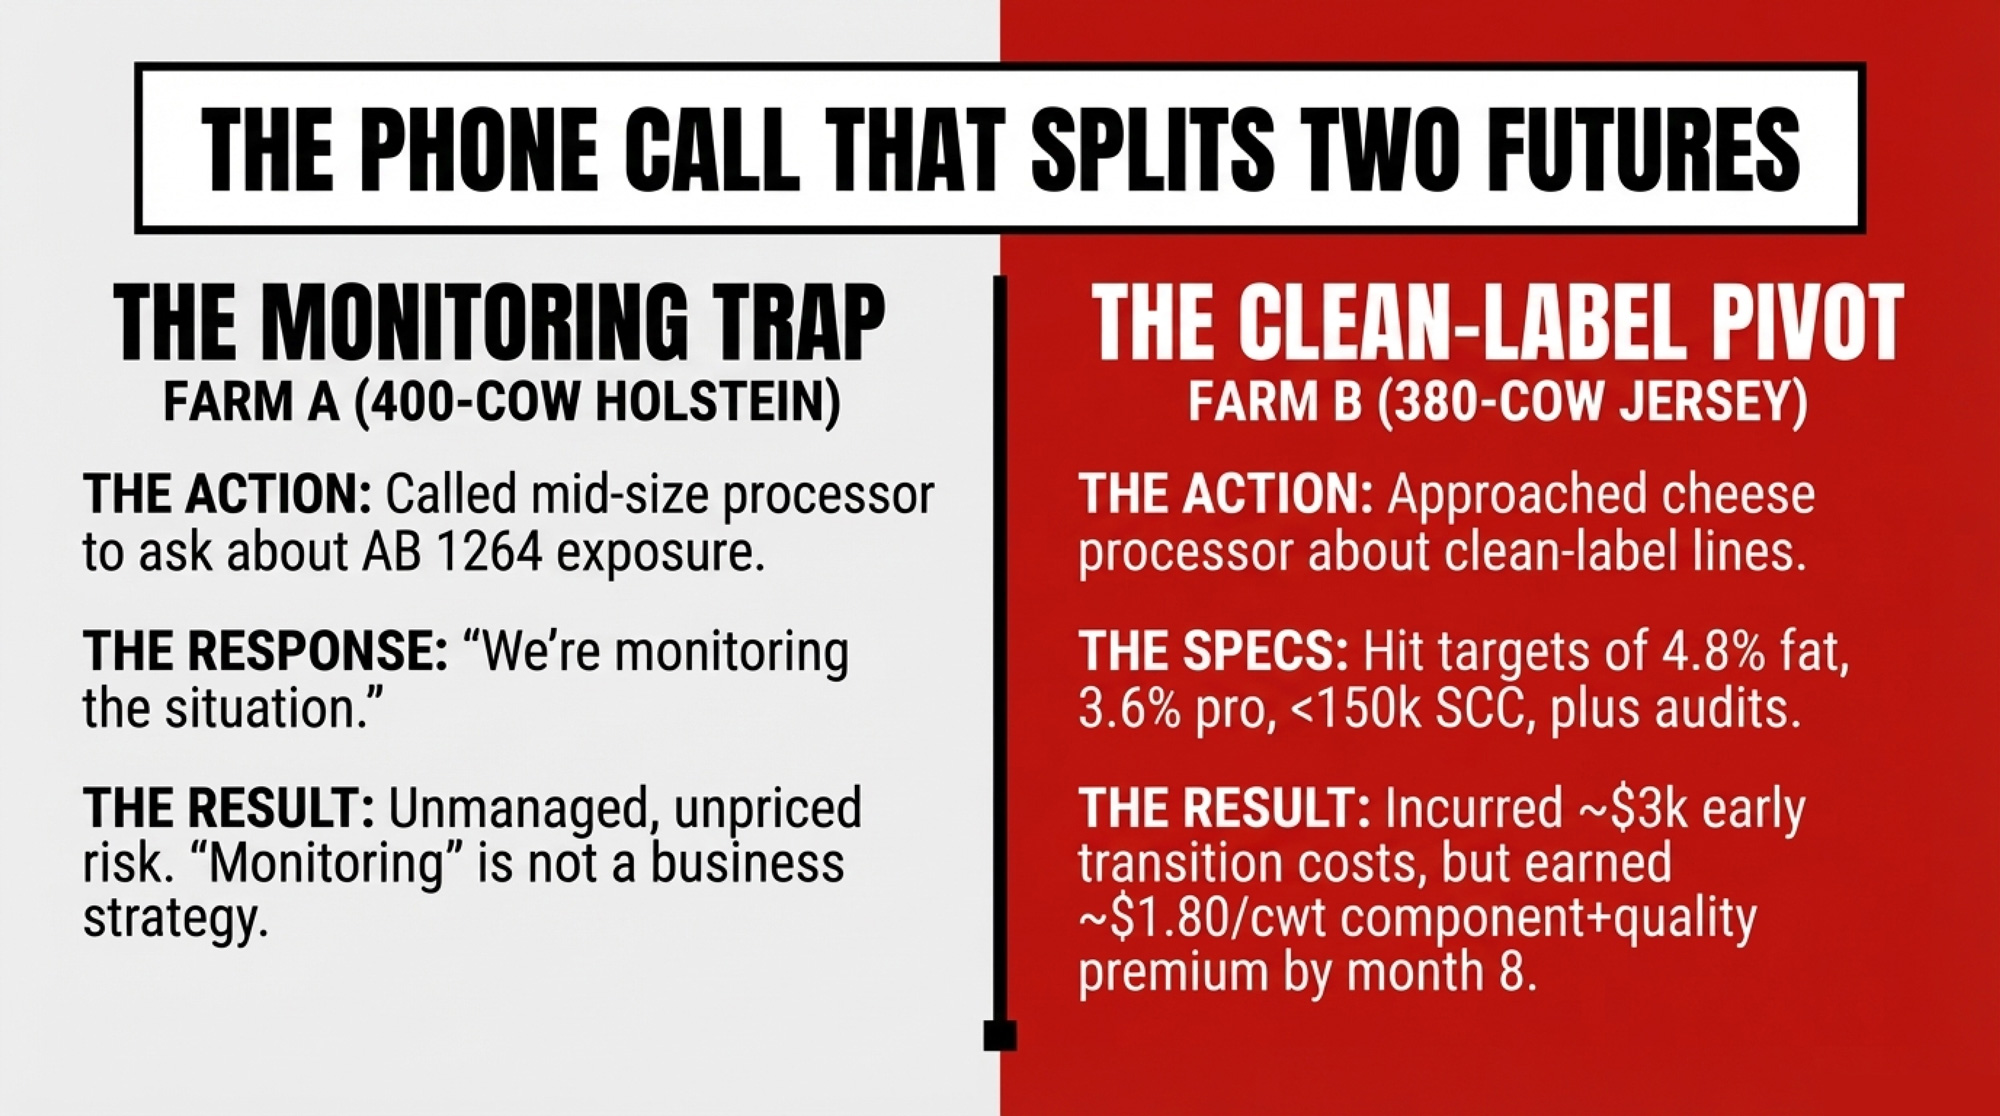
One Wisconsin producer with 400 Holsteins finally made the call in early 2026. Not to chat about the weather. They called with a script:
“What percentage of our plant’s output currently goes into products that would be classified as ultra‑processed under AB 1264 — flavored school milks, processed cheese, cheese powders, frozen‑meal dairy ingredients? And what’s the plan if those categories take a 10–20% volume or margin hit over the next decade?”
The answer was polite but vague: “We’re monitoring the situation.”
That’s a perfectly normal answer from a mid‑size Midwest processor in spring 2026. But “monitoring” isn’t a strategy. And the producer who asked the question is now ahead of every neighbor who didn’t — because they’ve started mapping their own exposure instead of assuming someone else has it covered.
A second scenario: a 380‑cow Jersey operation reached out to a cheese‑focused processor about their growing artisan and clean‑label lines. The question was simpler — what specs would it take to be part of that program? The processor had concrete targets: butterfat above 4.8%, protein above 3.6%, bulk tank SCC consistently under 150,000, willingness to participate in farm‑story marketing, and on‑farm audits. These specs reflect the kind of quality thresholds several premium cheese and yogurt programs use today, though they aren’t universal or guaranteed.
In this composite example, the early transition incurred roughly $3,000 in quality penalties and additional vetting and consulting work over the first four months. By around month eight, the herd was consistently hitting specs and earning approximately a $1.80/cwt component‑plus‑quality premium across their volume. Not a promise. A realistic sketch of how early costs and later payback can look when a herd leans into a program like this.
Same policy environment. Two different calls. Two different trajectories.
Breeding for the Post‑UPF Era
If a quarter to a third of your milk check feeds the ultra‑processed ladder, genetics is one of the few levers you can pull now that actually changes your risk profile five years out.
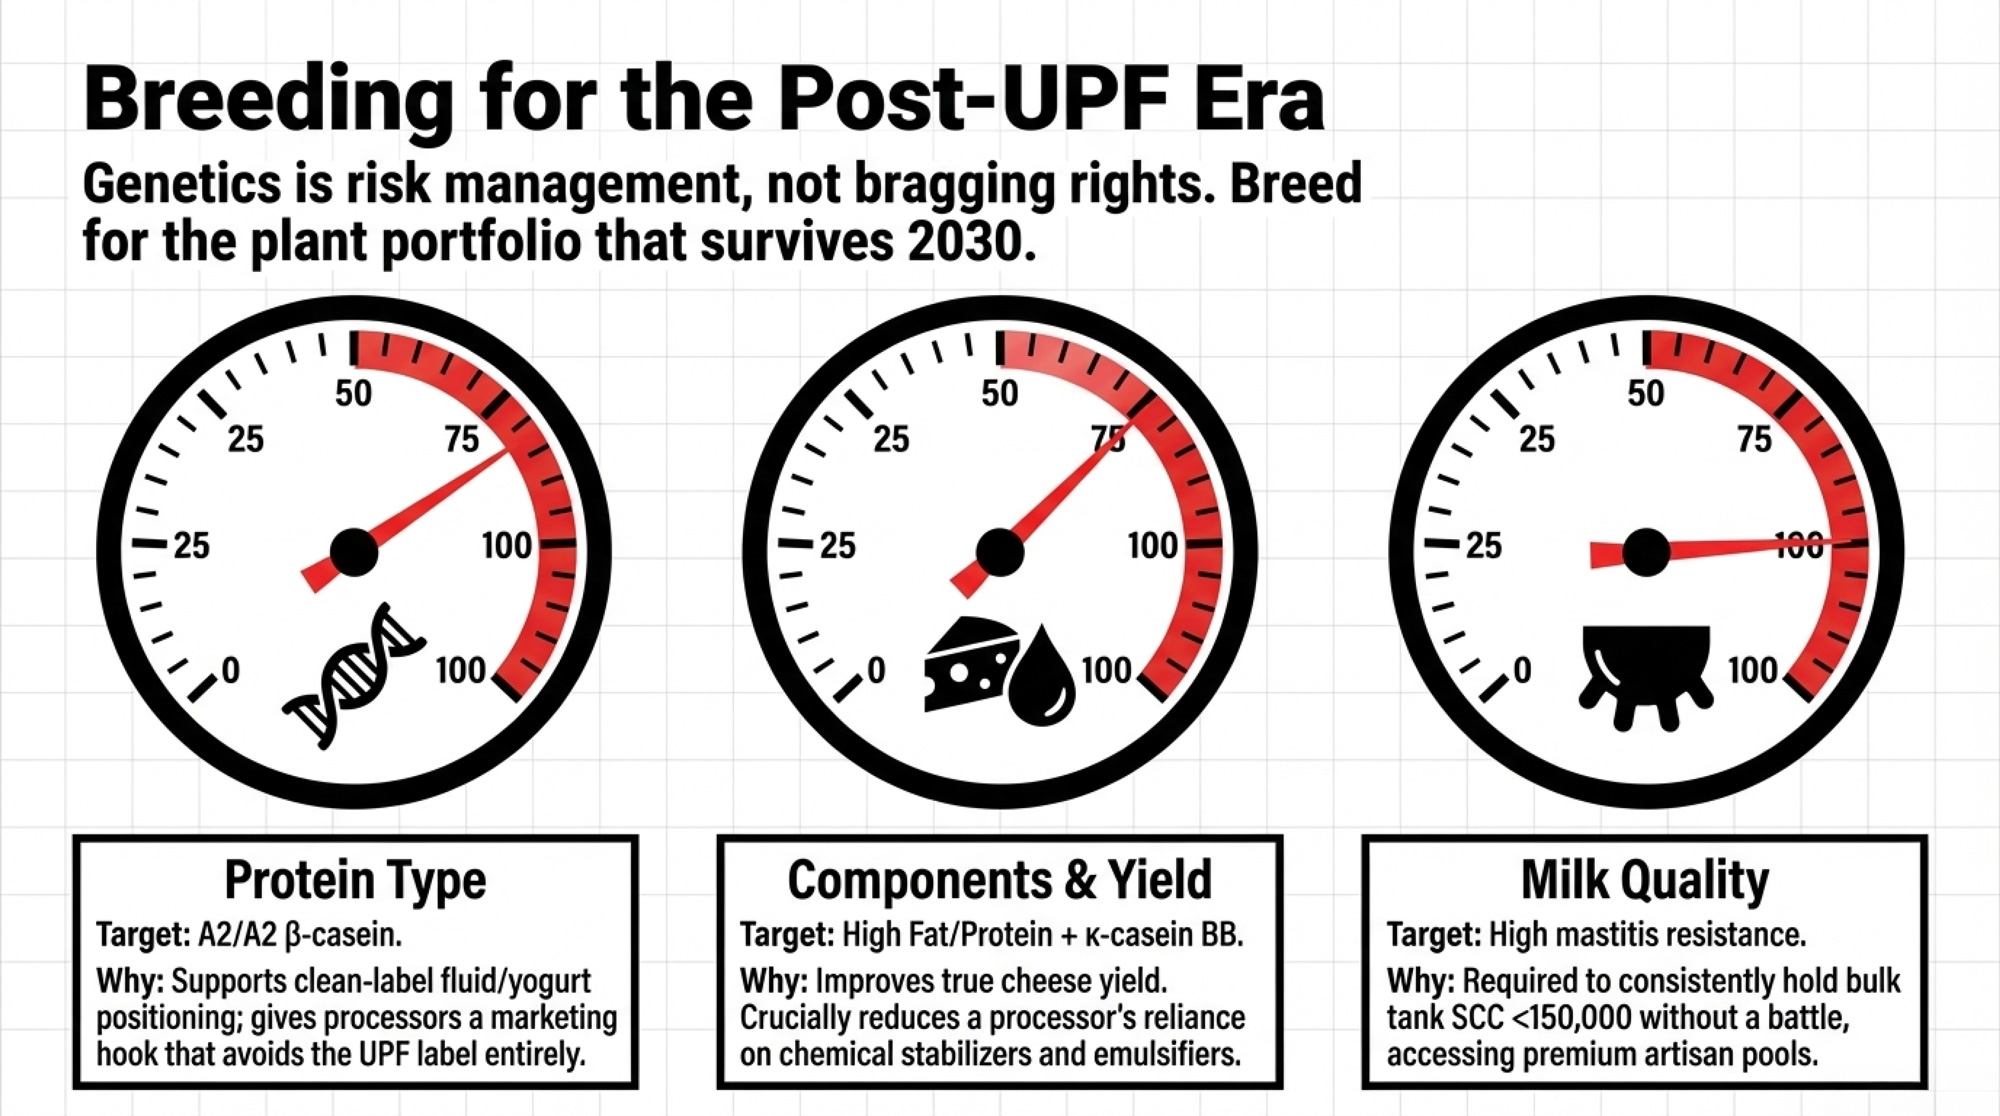
Clean‑label and minimally processed dairy brands tend to look for three things at the cow level:
- Components and cheese yield. Strong butterfat and protein, plus favorable κ‑casein variants — especially κ‑casein BB — improve true cheese yield and reduce a processor’s reliance on stabilizers and emulsifiers.
- Protein type. A growing number of fluid milk and yogurt brands are built around A2/A2 β‑casein, which supports clean‑label positioning and gives processors a marketing hook that avoids the UPF label.
- Udder health and milk quality. Genetics for mastitis resistance, lower somatic cell score, and sound udder conformation make it easier to hold under 150,000 SCC without a constant battle.
For the 400‑cow herd watching UPF categories take heat, that means weighting A2/A2, κ‑casein BB, and health traits harder in your young‑stock plan so that by the early 2030s, more of your parlor is suited for cheese, yogurt, and “real food” brands. You’re not breeding for today’s product mix. You’re breeding for whichever part of your plant’s portfolio still looks safe and profitable a decade from now.
The Playbook: How to Move Before the Window Closes
You don’t need to build a creamery or upend your breeding program overnight. But you do need to treat UPF exposure like a real line item in your risk management.
In the Next 30 Days
- Call your processor or co‑op field rep and ask three questions:
- “Roughly what share of our plant’s output goes into products that would qualify as ultra‑processed under AB 1264 or trigger Canada’s front‑of‑pack warnings?”
- “What’s the plan if those categories lose 10–20% of volume or margin over the next decade?”
- “Which product lines are clearly outside that blast radius — artisan cheeses, plain yogurts, fluid brands — and what specs would we need to hit to be part of those pools?”
- Build a one‑page risk map. What percentage of your annual volume likely ends up in Tier 3–4? At your current blend, what does a $1.50 or $2.50/cwt squeeze on that volume actually cost you per year? Write it down. The number is either small enough to stop worrying or big enough to start planning.
In the Next 90 Days
- Audit your quality and components. Is your 12‑month average SCC consistently below 150,000, or bouncing above 200,000? How do your butterfat and protein stack up against what clean‑label cheese or yogurt specs typically call for?
- Talk to your genetics advisor. How many of your current and planned service sires are A2/A2 with κ‑casein BB and strong mastitis resistance? What would it take to have 60–70% of your young stock from that profile within 3–5 years?
In the Next 12 Months
- Bring UPF exposure into your lender conversation. If your effective blend on exposed volume drops by $1.50–$2.50/cwt over the next 3–5 years, what does that do to your debt‑service coverage ratio and your capital plans?
- Stress‑test your processor relationship. If your co‑op or plant is heavily weighted toward Tier 3–4 products and doesn’t have a clear diversification plan, that’s a business risk on top of a policy risk. In a deregulated market, you have the option to move. Know what that option looks like before you need it.
What This Means for Your Operation
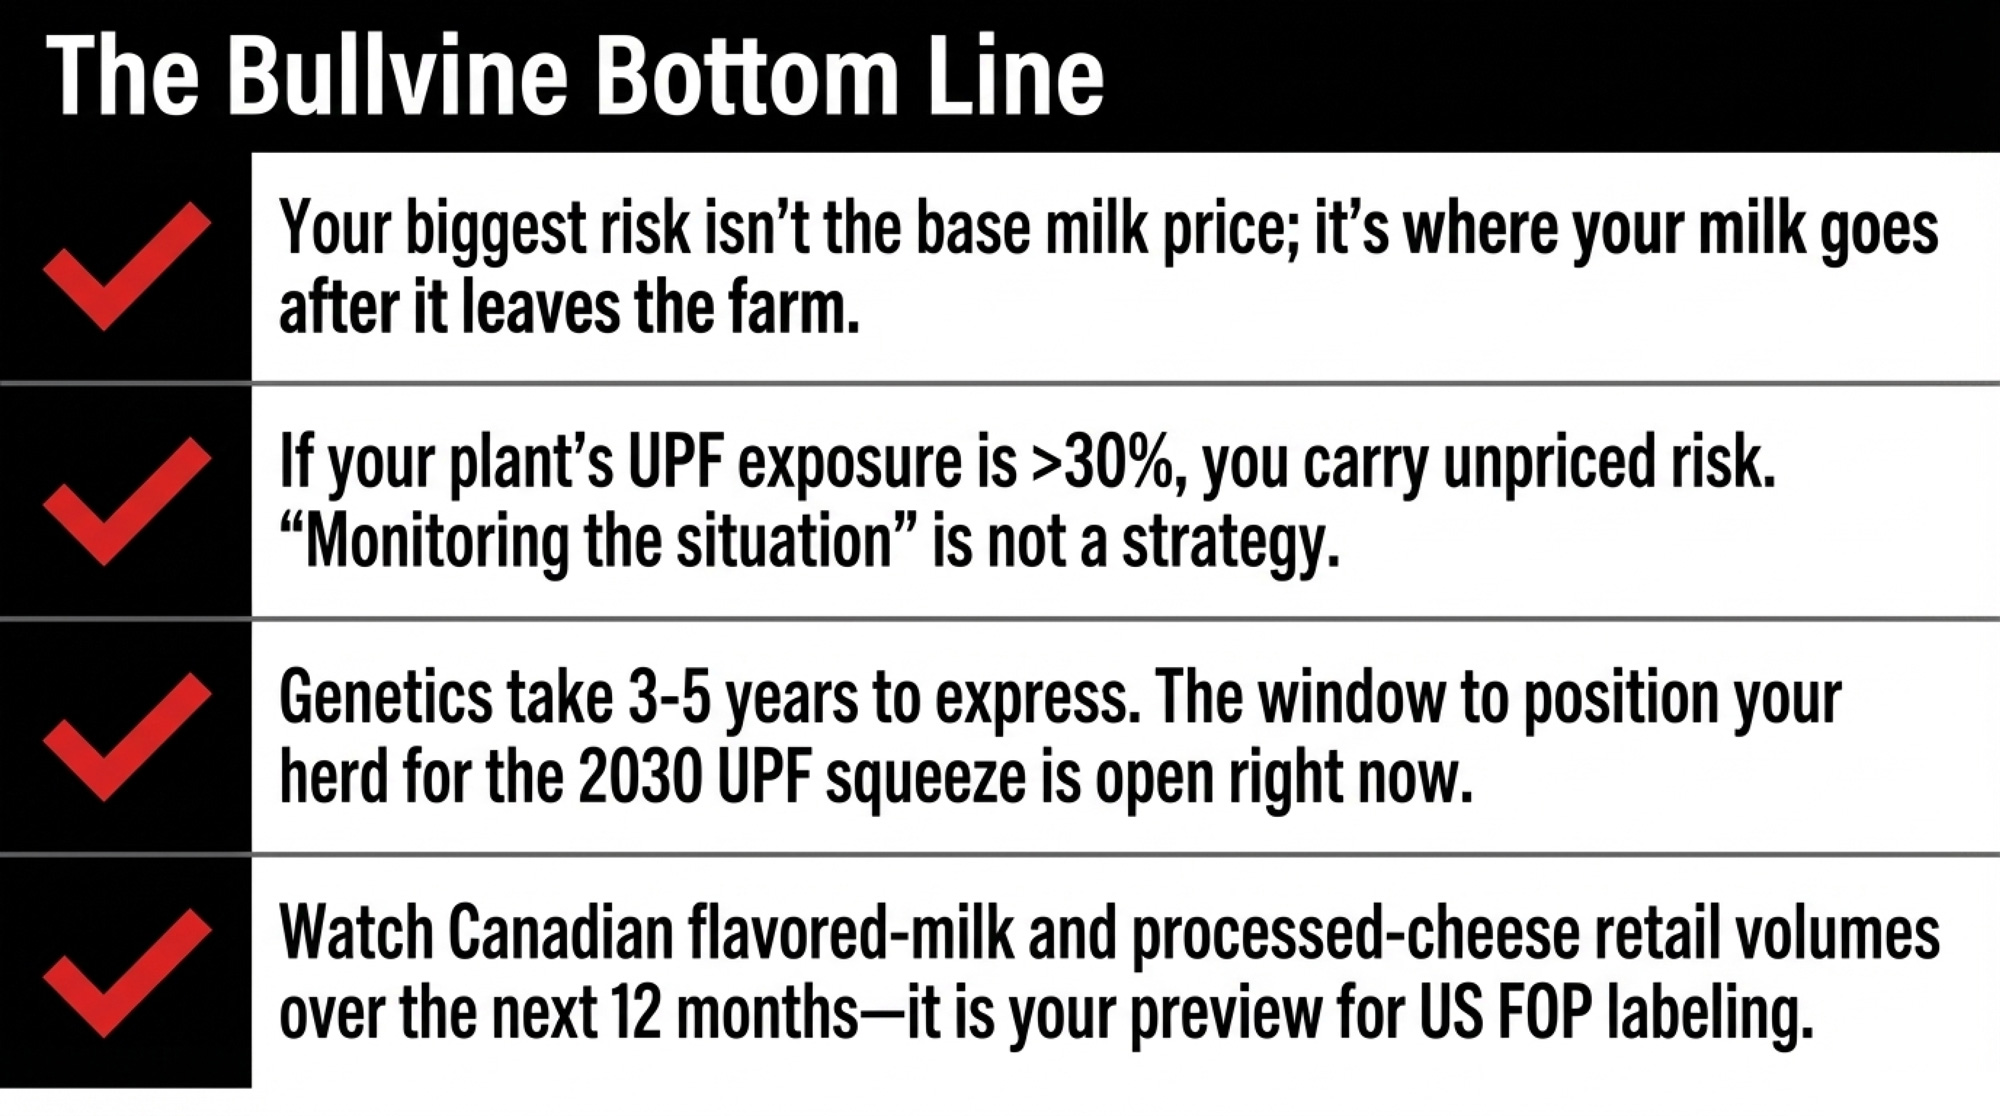
- Your biggest risk isn’t the milk price. It’s where your milk goes after it leaves the farm. If 30–40% of your processor’s output sits in categories that legislators, labeling agencies, and researchers are actively targeting, your milk check carries exposure you’re not pricing in.
- $42,000/year isn’t a scary number — it’s arithmetic. 400 cows, 35% exposure, $2.50/cwt squeeze. Run the same formula with your herd size, your blend, and your best guess at your plant’s UPF share. The formula is the point, not the specific result.
- “We’re monitoring the situation” is not a plan. If your processor can’t tell you their UPF exposure and their strategy for it, assume nobody is managing this risk on your behalf.
- Genetics is risk management now, not just breeding‑proof bragging. A2/A2, κ‑casein BB, mastitis resistance, and component levels aren’t premiums you chase — they’re the traits that keep your milk relevant to the product lines most likely to survive UPF pressure.
- Canada is the canary. Front‑of‑pack warnings are already mandatory there. Watch flavored-milk and processed‑cheese volumes in Canadian retail over the next 12 months. That’s your preview.
Key Takeaways
- If your estimated UPF‑exposed share is above 30–35%, you’re in a genuine risk band that warrants deeper planning. Not doomsday. A signal to stop assuming someone else is on top of it.
- In a deregulated U.S. market, you can switch plants — but only if you’ve already mapped your options.Inside Canadian supply management, you can’t switch easily, but you can shape your co‑op’s strategy through governance. Either way, the window for proactive positioning is now, not after the squeeze shows up on your check.
- The 30‑day action is the phone call. Ask your processor the three questions in this article. If the answer is vague, that’s your answer.
- A simple formula — cows × cwt/cow × exposed % × $/cwt squeeze — tells you more about your next five years than any argument over the NOVA classification system. You don’t have to love the policy to count its impact.
The Bottom Line
Pull your last three milk checks. Look at every deduction and utilization line. Ask yourself: how much of this revenue depends on products that California just banned from schools and Ottawa just tagged with a warning label? If the answer makes you uncomfortable, good. That discomfort is worth about $42,000 a year in planning you haven’t started yet.
Complete references and supporting documentation are available upon request by contacting the editorial team at editor@thebullvine.com.
Learn More
- 51 Sick Babies, 55 Organic Farms, One Powder Plant: What the ByHeart Botulism Outbreak Means for Your Dairy Contracts and Supply-Chain Risk – Exposes the hidden liability in your milk contract and delivers a 30-day plan to secure your business against recalls. Gain the upper hand in negotiations and ensure a single supply-chain failure doesn’t drain your equity.
- The $19 Milk Trap: How 2026 Prices Quietly Drain a 400‑Cow Dairy’s Equity – Breaks down the brutal math of 2026 price forecasts and arms you with the structural positioning needed to survive. Reveals how to close a $250,000 margin gap by aligning your output with long-term market realities.
- Protein Power Play: How Dairy Can Dominate The GLP-1 Revolution – Reveals the seismic shift from “fat-first” to “protein-driven” breeding as consumer habits change overnight. Strategy to pivot your genetics now, ensuring your herd meets the 40% growth spike in high-protein, clean-label categories.
 The Sunday Read Dairy Professionals Don’t Skip.
 The Sunday Read Dairy Professionals Don’t Skip.
Every week, thousands of producers, breeders, and industry insiders open Bullvine Weekly for genetics insights, market shifts, and profit strategies they won’t find anywhere else. One email. Five minutes. Smarter decisions all week.
