


$11 billion in new processing capacity. A protein-hungry consumer base. And an 18-month breeding window that will shape your milk check through 2030.
Executive Summary: The protein line on your milk check is about to matter more—and your next 18 months of breeding decisions will determine whether your herd is positioned to benefit. GLP-1 weight-loss medications now reach 15.5 million Americans, with clinical guidance steering patients toward protein-dense dairy like Greek yogurt and cottage cheese. Processors have responded by locking in $11 billion in new cheese and cultured capacity across 19 states, scheduled to come online by 2028. University of Minnesota research shows many Holstein herds already carry significant A2 and favorable kappa-casein genetics without active selection, and genomic testing at $30-50 per head makes it practical to know where you stand. The timeline is clear: calves from 2026 matings will hit peak production just as this new capacity reaches full stride. Whether you’re scaling for growth, navigating mid-career capital decisions, or planning a clean exit, the protein opportunity is real, and the window to position for it is now.

Healthcare analysts tracking GLP-1 medications like Ozempic, Wegovy, and Mounjaro are projecting that this class of drugs could grow from about 64.42 billion dollars in annual sales in 2025 to roughly 170.75 billion by 2033—around 13 percent growth per year, according to MarketsandMarkets’ latest global forecast. And that number may have more to say about your protein line than any milk market report you’ve read this year.
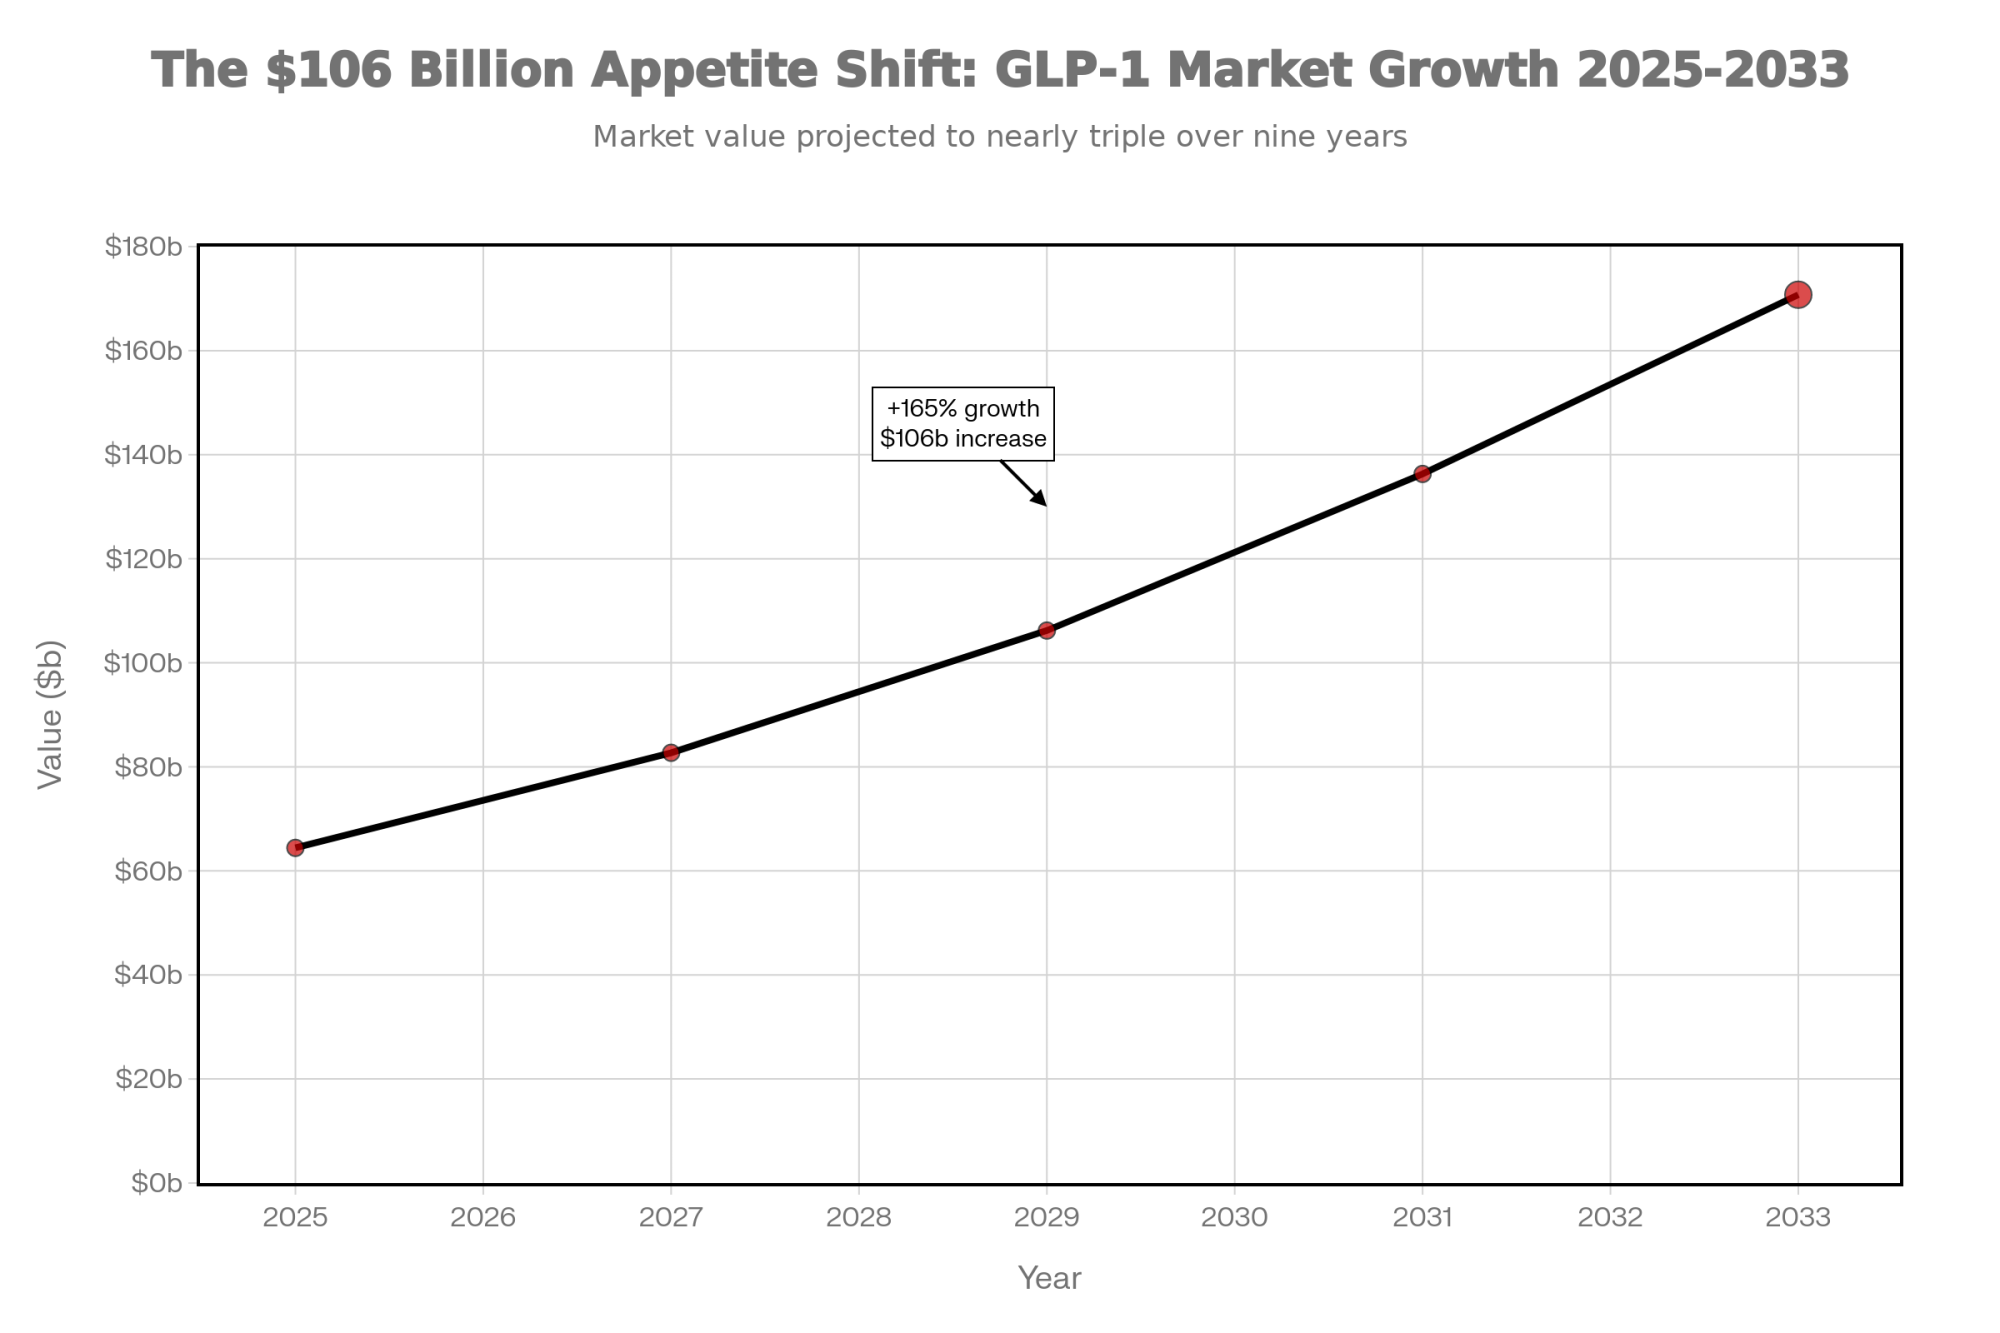
Here’s what’s interesting: analysts have been telling food and agriculture reporters that a market that big doesn’t just change what’s in the pharmacy aisle. It spills over into what people put in their carts and on their plates, because these drugs influence appetite, satiety, and what doctors and dietitians tell patients to look for in the grocery store.
And that’s where our dairy conversation really starts to get interesting over coffee.
Why Protein Seems to Be Doing More of the Work
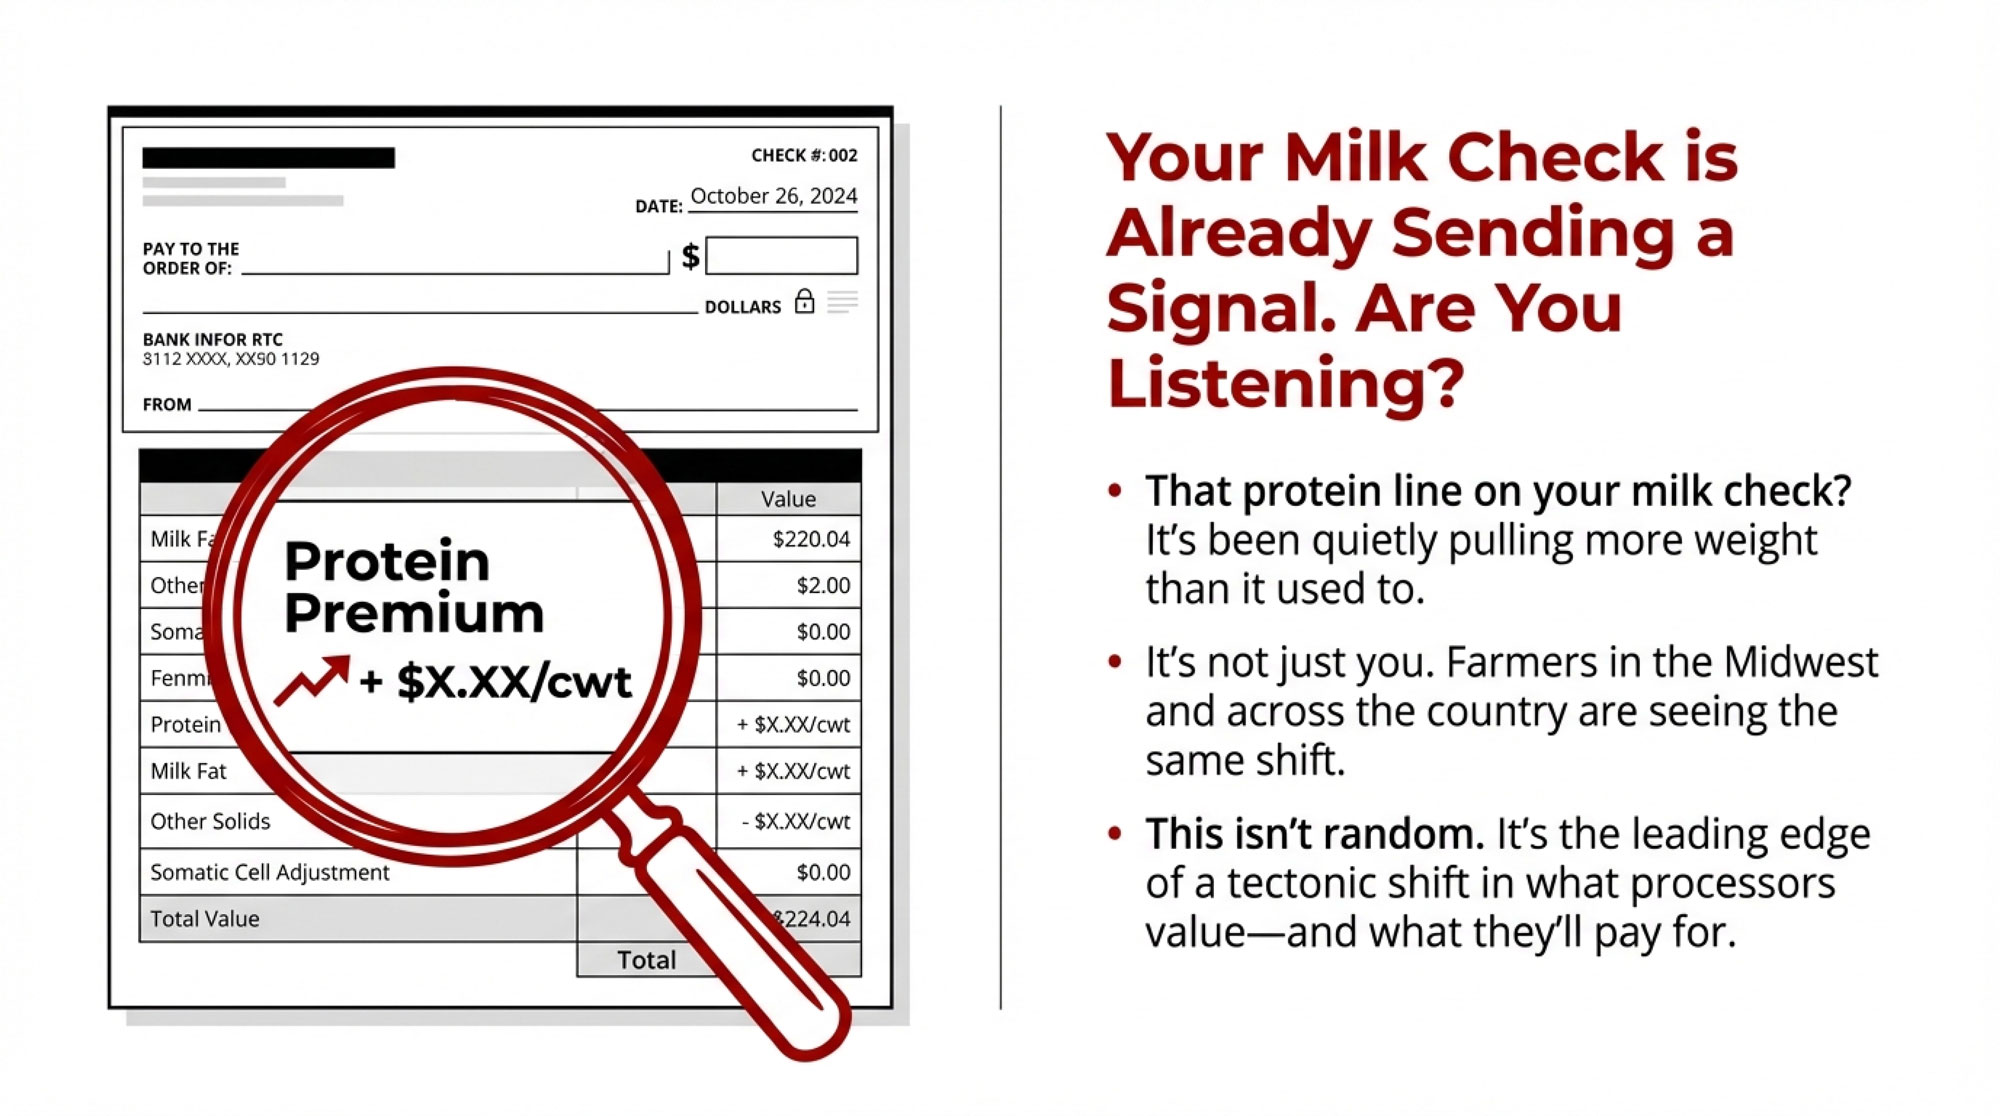
Not long ago, I was at a winter meeting in Wisconsin and a producer leaned over between sessions and said, “You know, I’m starting to see protein doing more of the heavy lifting on my milk check than it used to. It’s not huge yet, but it’s moving.” In a lot of Midwest herds, when folks actually line up a few years of milk cheques, they see the same thing—the protein line quietly pulling a bit more weight relative to butterfat performance than it used to.
If you look north of the border, the Canadian Dairy Commission has adjusted support prices and farm-gate returns to reflect rising feed and operating costs, and those decisions feed into the detailed component-based payment formulas that provincial boards publish. When you study those formulas in Ontario or across Western Canada, you can see that protein and other non-fat solids account for a substantial share of the value, especially in classes tied to cheese and yogurt.
On the U.S. side, federal order component pricing and plant pay schedules in cheese-oriented markets show the same general pattern: butterfat still matters a lot, but protein has become more important as plants capture value from cheese, powders, and high-protein ingredients.
The thing that jumps out to me is that this shift at the pay-stub level isn’t happening in isolation. If you step back and connect a few dots—the GLP-1 story, a growing stack of gut-health research around yogurt and fermented dairy, and more than 11 billion dollars in new processing investments that IDFA says are already locked in—you start to see a pretty coherent picture pointing toward solids, and especially protein.
That’s why I keep coming back to this simple idea: the bulls you pick over the next 18 months are a direct bet on what your milk check looks like in 2029.
GLP-1: The Drug Class Turning Up the Volume on Protein
Looking at this trend, we’ve got to spend a little time on GLP-1 drugs, even though they can feel a long way from the parlor.
Peer-reviewed clinical reviews published in PubMed-indexed journals describe how these medications mimic incretin hormones and work on several fronts: they reduce appetite, slow gastric emptying, improve insulin secretion, and lead to substantial weight loss in people with type 2 diabetes and obesity when used as prescribed.
What the clinical literature also shows—and this is where it becomes relevant for us—is that rapid weight loss can involve loss of lean mass if patients don’t maintain adequate protein intake and engage in some resistance activity. That’s why many clinicians now emphasize maintaining a solid protein intake, or even increasing it, when patients start GLP-1 therapies.
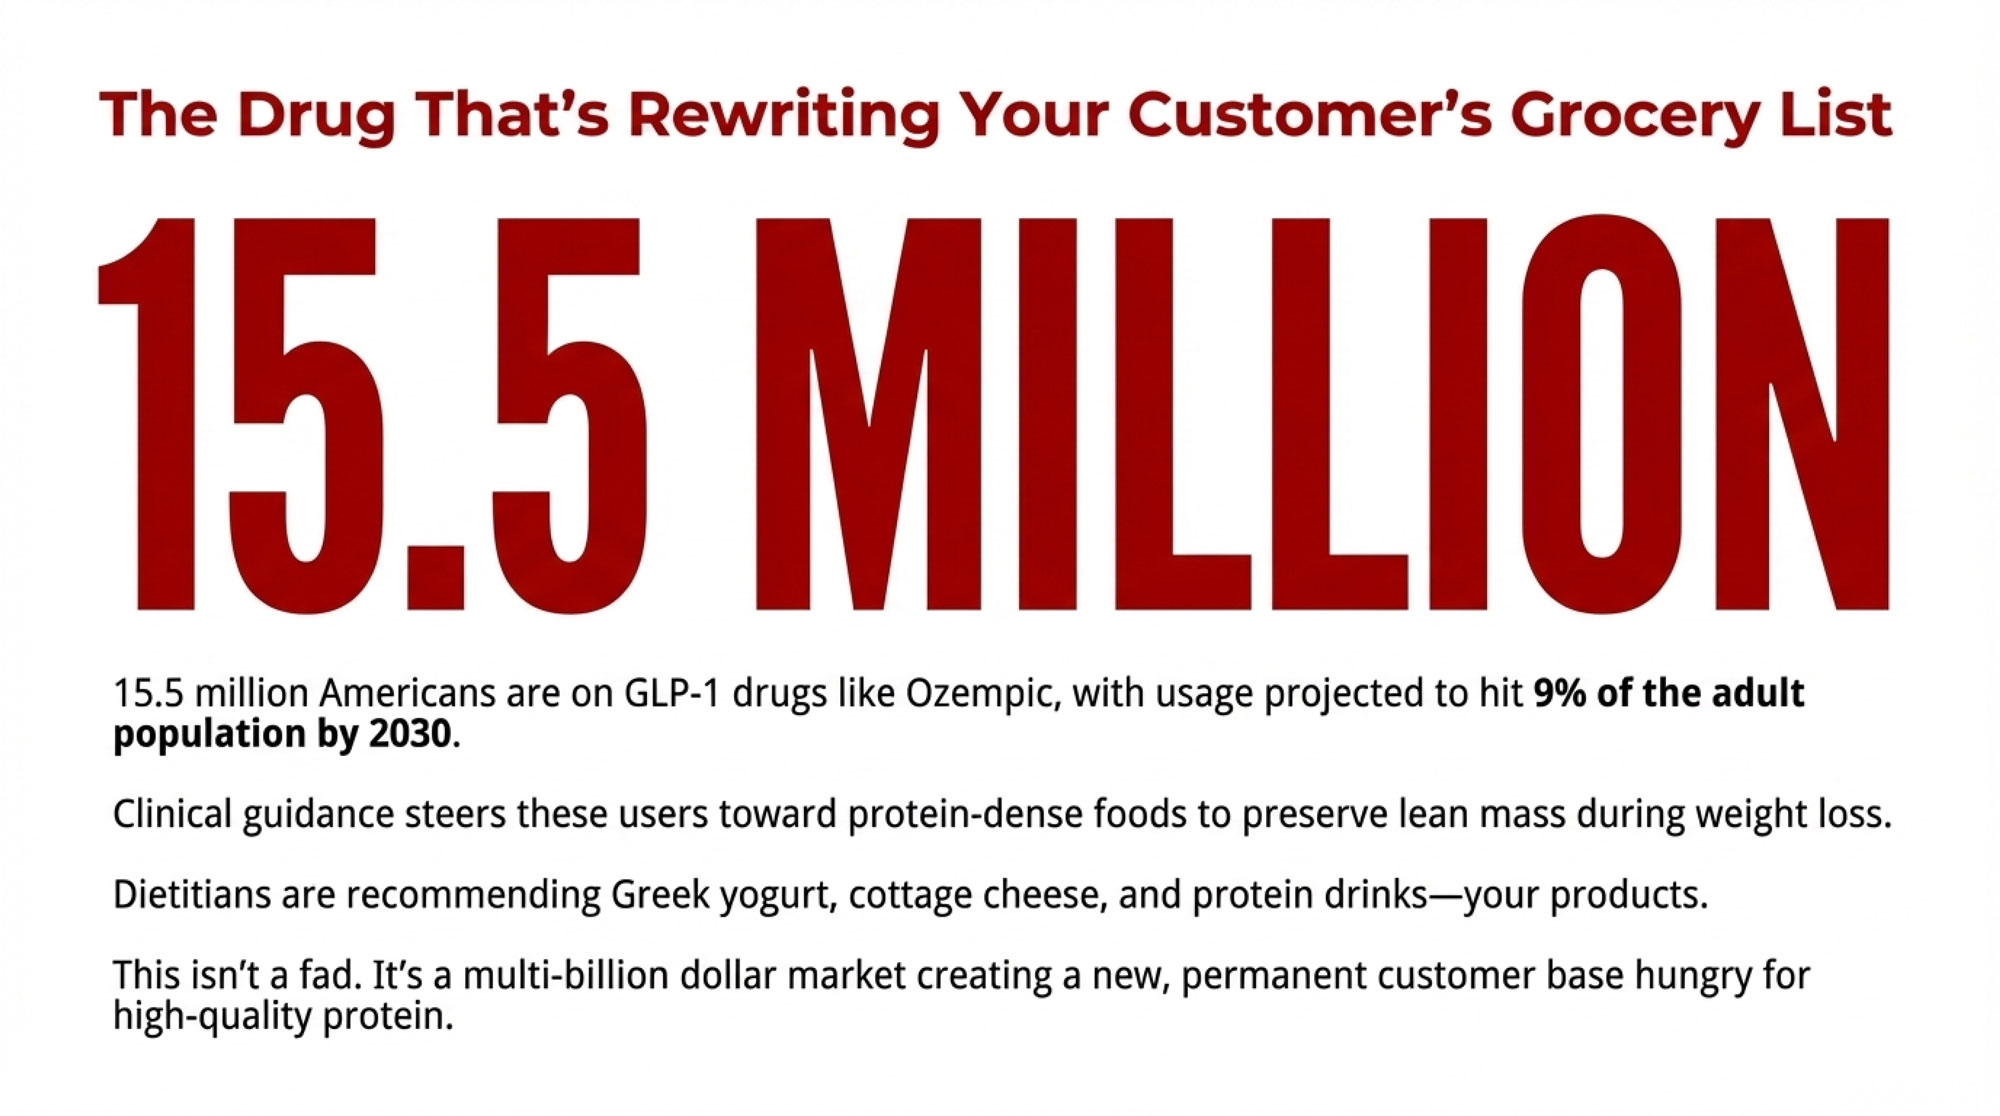
Dairy-focused outlets have begun connecting that clinical guidance to what’s happening in the dairy case. Analysis that combined polling and retail data showed that around 15.5 million U.S. adults were using GLP-1 injectables as of 2023, with adoption expected to reach roughly 9% of the adult population by 2030. Those users reported cutting daily calories by about 20 percent—roughly 800 kilocalories—while shifting away from high-sugar products toward lean proteins.
Registered dietitians explained that they often recommend Greek yogurt, dairy-based protein drinks, and cottage cheese to patients on GLP-1s because these foods deliver convenient, high-quality protein and align with satiety- and gut-friendly patterns supported by the clinical literature.
Now, it’s worth saying out loud that not every GLP-1 user suddenly becomes a model high-protein eater. Real-world adherence, side effects, out-of-pocket costs, and insurance coverage limits all affect how many people stay on these medications and how they actually use them.
But when you put tens of billions of dollars in current GLP-1 sales together with a well-publicized forecast that the market could more than double, and you pair that with a consistent medical message—”eat less overall, but don’t short yourself on protein”—it’s not surprising that food companies and retailers are re-examining their high-protein offerings.
If your cows are producing the milk that ends up in those products, that’s a signal worth keeping in mind the next time you’re standing in front of the semen tank.
Gut Health, Fermented Dairy, and the Slow Burn That’s Paying Off
At the same time, yogurt and fermented dairy have been building their own steady momentum, well before GLP-1 became a household word.
Large prospective nutrition cohorts, such as the Nurses’ Health Study and the Health Professionals Follow-up Study, have tracked people’s diets and health outcomes for decades. Analyses of those cohorts published in journals like the American Journal of Clinical Nutrition have repeatedly found that higher yogurt consumption is associated with a lower risk of type 2 diabetes, even after adjusting for body mass index, smoking, and physical activity.
Umbrella reviews that pool data from multiple observational studies have reached similar conclusions, reporting that yogurt intake tends to align with modestly lower diabetes risk and somewhat better cardiometabolic profiles overall.
On the intervention side, randomized controlled trials have tested yogurt enriched with prebiotic fibers, such as inulin and konjac glucomannan, in adults with type 2 diabetes. Over a few weeks to months, those enriched yogurts improved insulin sensitivity, fasting glucose levels, lipid profiles, and, sometimes, inflammatory markers compared with control products.
Reviews of fermented dairy and the gut microbiome describe how specific cultures and fermentation processes can shift gut bacteria toward profiles that appear beneficial for metabolic and digestive health.
So what do shoppers do with all that? Market research shows that consumers consistently rank yogurt, kefir, and other cultured dairy products among the foods they see as “good for their gut,” and sales data indicate these categories have grown into multi-billion-dollar markets with high single-digit or better growth in many recent years.
Put that together with the GLP-1 protein push, and you can see why there’s so much interest in milk that shows up with consistent protein and butterfat performance, not just volume.
What Jumps Out: The 11-Billion-Dollar Vote for Components
One of the clearest signals in all of this isn’t in survey data at all; it’s in concrete and stainless.
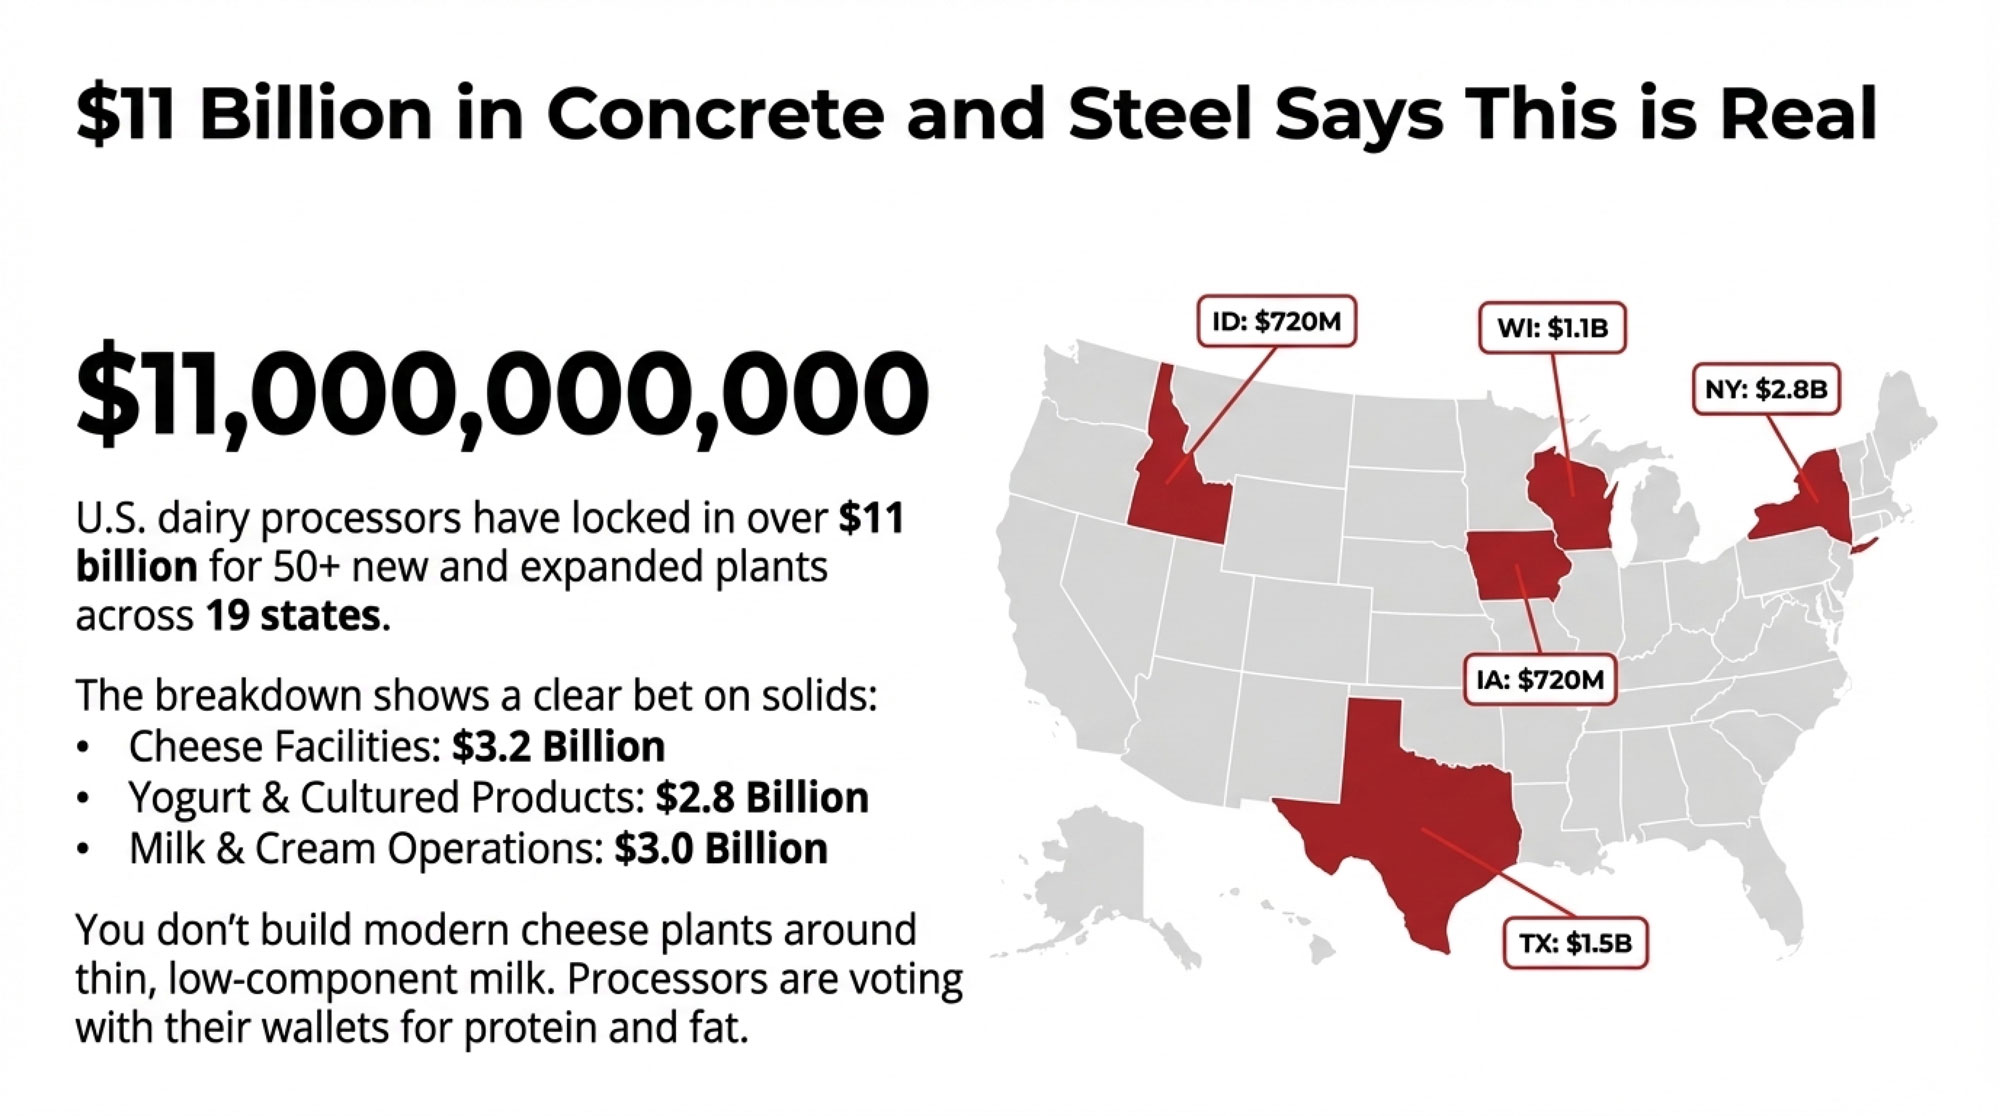
In October 2025, IDFA kicked off Manufacturing Month by highlighting that U.S. dairy processors are investing more than 11 billion dollars in new and expanded processing capacity across 19 states, spread across more than 50 individual building projects scheduled between 2025 and early 2028.
IDFA president and CEO Michael Dykes, D.V.M., has said this reflects a “growth mindset” among processors who expect U.S. milk production to rise by about 15 billion pounds by the end of the decade and want to be ready to turn that milk into higher-value products rather than dumping it into lower-value uses.

When you look at the breakdown, cheese facilities are attracting about $ 3.2 billion. Milk and cream operations account for nearly 3 billion, while yogurt and cultured products draw another 2.8 billion.
By state, New York is slated to receive about 2.8 billion in projects, Texas roughly 1.5 billion, Wisconsin around 1.1 billion, and Idaho and Iowa about 720 million each, making those states some of the biggest beneficiaries of this capex wave.
In New York, those projects layer onto a milk shed already producing roughly 16 billion pounds of milk per year, according to USDA NASS data. Texas has climbed into the top three milk-producing states, anchored by large dry lot systems in the Panhandle and High Plains. Wisconsin continues to deepen its role as a cheese and whey hub, while Idaho and Iowa are adding cheese and powder capacity that fits their existing dairy and feed bases.
You can see where this is going: when processors put that kind of money into cheese vats, separators, and dryers, they’re voting for solids. You don’t design a modern cheese plant or whey protein line around thin, low-component milk. You design it around protein and fat. That doesn’t mean volume suddenly doesn’t matter—but it does change what kind of volume they value most.

The Genetics: You Might Be Closer Than You Think
Now, at this point, somebody usually asks, “Okay, but how far behind am I really?”
Here’s where the data is a bit more encouraging than a lot of folks expect.
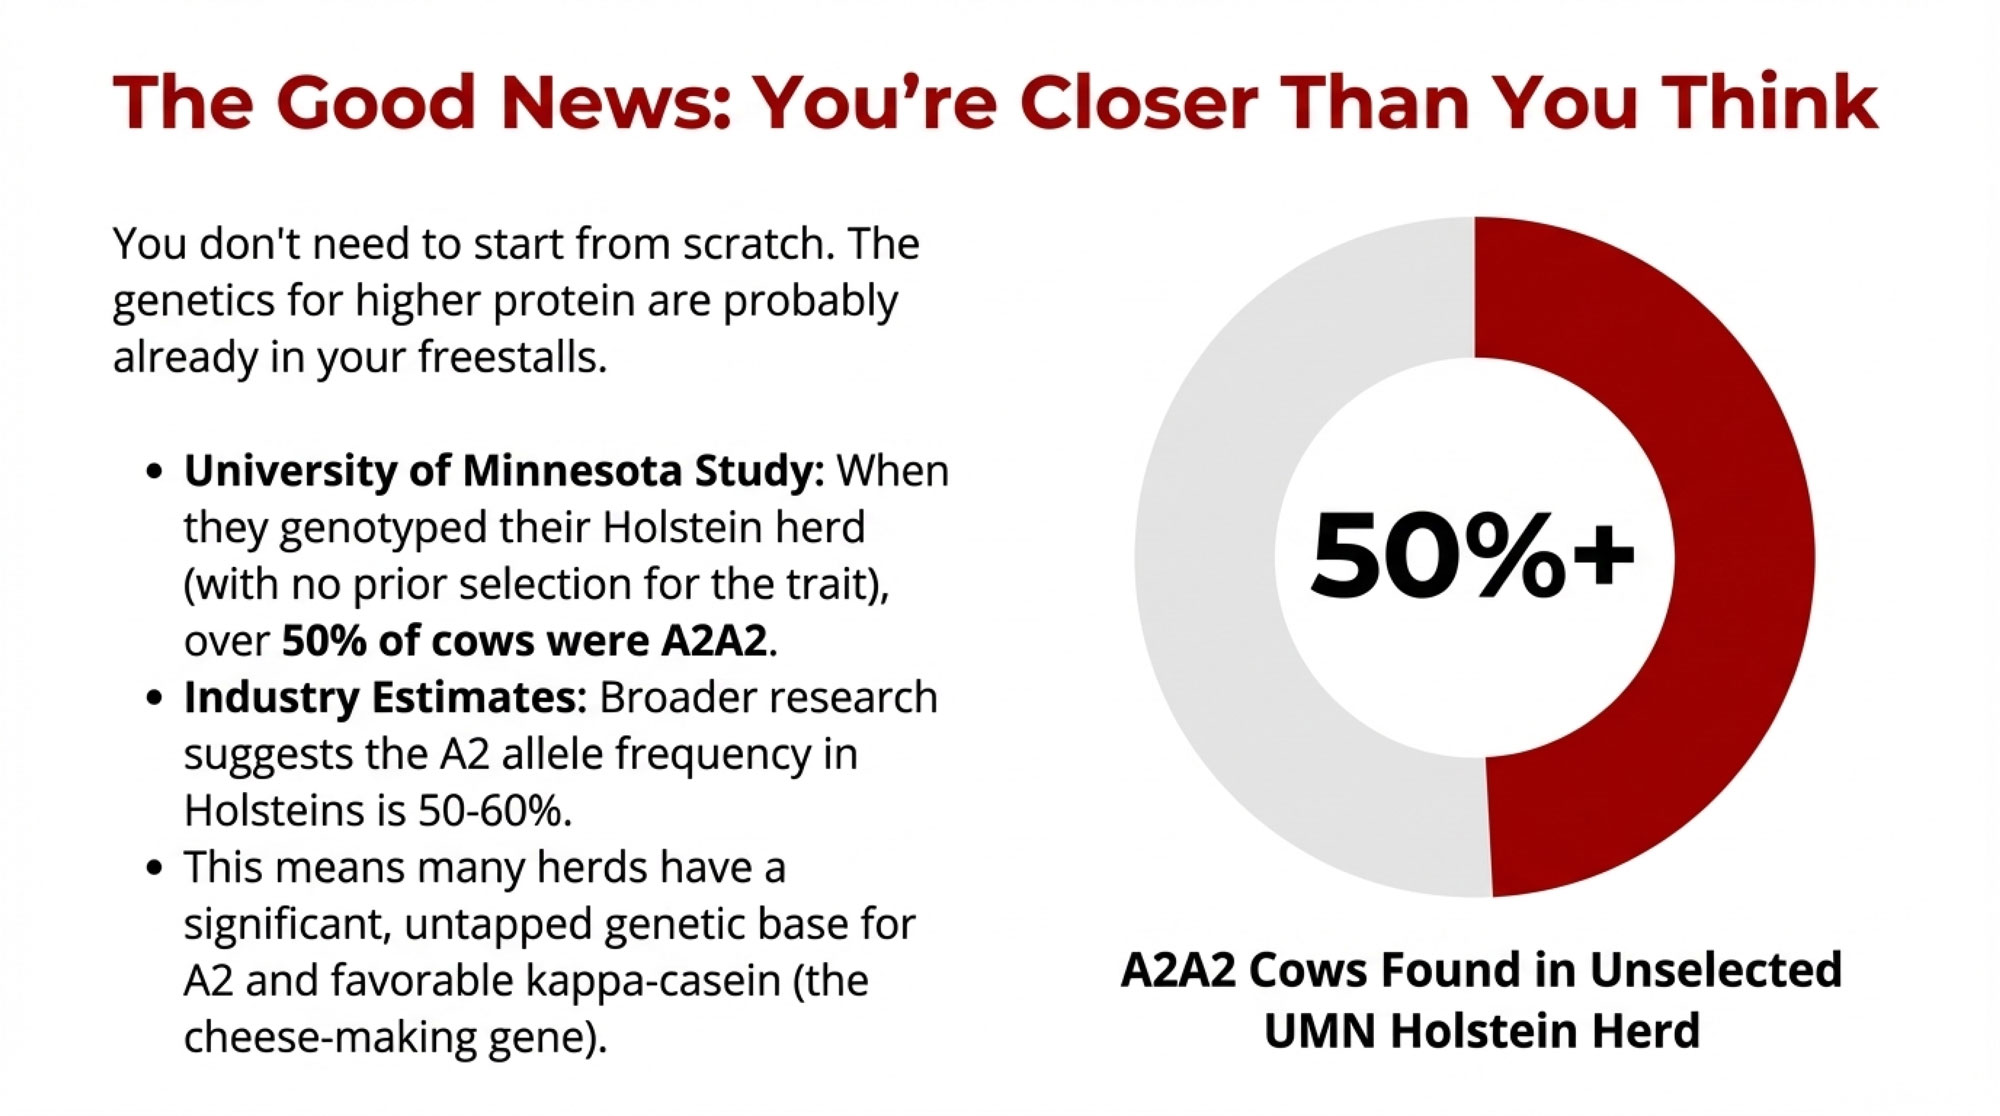
When the University of Minnesota genotyped its entire research herd in 2019, more than 50 percent of the Holstein cows turned out to be A2A2 for beta-casein, even though the herd hadn’t been selected for that trait. A separate 1964 Holstein genetic line in the same project had only 26 percent A2A2, showing how selection can shift things over time, and their crossbred cows and heifers ranged from 36 to 50 percent A2A2.
| Herd Type / Population | Selection Pressure for A2? | A2A2 Frequency (%) | Key Insight |
|---|---|---|---|
| UMN Holstein Research Herd (2019) | None | 50% | Half the herd was A2A2 without trying |
| UMN 1964 Genetic Line | None (frozen 1964 genetics) | 26% | Shows effect of modern selection drift |
| General Holstein Population (est.) | Minimal to moderate | ~33% | Roughly 1 in 3 Holsteins could be A2A2 |
| Jersey / Guernsey / Brown Swiss | Low to moderate | 70%+ | Heritage breeds carry higher baseline |
| UMN Holstein-Jersey Crosses | None (F1 crosses) | 36-50% | Crossbreeding can accelerate A2 shift |
Broader genetic research published in peer-reviewed animal science journals suggests the A2 allele frequency in Holsteins runs somewhere in the 50 to 60 percent range, which mathematically implies that roughly a third of Holsteins in general might be A2A2, with the rest mostly A1/A2.
Jersey, Guernsey, Normande, and Brown Swiss populations tend to carry higher A2 frequencies—often 70 percent or more in Swiss breeds and even higher in some heritage populations.
Now, that doesn’t mean every commercial Holstein herd is sitting at UMN-level A2A2 percentages. Actual numbers vary with sire usage and the age of sire lines. But the university data and industry allele estimates suggest that many herds probably have more A2 genetics—and more favorable kappa-casein genotypes—walking around than you’d guess just by looking at cows in the freestalls.
Over the past 10 to 15 years, genomic testing has really changed how we can use that information. Modern genomic panels routinely report beta-casein type, kappa-casein genotype, predicted transmitting abilities for fat and protein yield and percentages, and indices for health, fertility, and even feed efficiency.

In practical terms, most commercial genomic panels used on heifers and cows today cost between $ 30 and $ 50 per head, depending on the panel and the volume of samples. Holstein Canada’s 2024 fee schedule shows base animal testing at $ 33, which aligns with what extension budgets and on-farm case studies report.
AI catalogs from major studs show that A2A2, high-component, favorable kappa-casein bulls often carry a small price premium over more “average” Holstein sires, but still sit within what most breeding programs can handle.
This suggests that for many herds, this isn’t a “start from scratch” situation. It’s more a case of figuring out what you already have and then nudging your breeding decisions in a direction that lines up with where the plants and the people seem to be going.
A Wisconsin Coffee Shop Scenario
Let’s ground this with a scenario that’ll feel familiar to a lot of Midwest producers.
Say you’re running 450 Holstein cows in south-central Wisconsin. You’re milking in a double-12. You’ve got sand-bedded freestalls, respectable butterfat performance, and good enough fresh-cow management in the transition period that you don’t dread opening the DHI packet. At the same time, your stall bases and manure system are over 20 years old, and every January you catch yourself wondering which piece of steel or concrete is going to cause trouble this year.
If you look at UW-Extension summaries and USDA cost-of-production data for similar-sized freestall herds in Wisconsin, total economic breakevens often fall in the mid- to high-teens per hundredweight, once you account for hired labor and realistic debt service. Let’s say your true breakeven is around 17 dollars. A lot of Wisconsin operations would recognize that as a believable number when they work through their own books.
You’re 48. Your daughter is finishing a dairy science degree and wants to come back, but she wants to see a path that looks like building a business for the next 15 to 20 years, not just hanging onto tired infrastructure.
In that position, here’s the kind of path I’ve seen work in real herds:
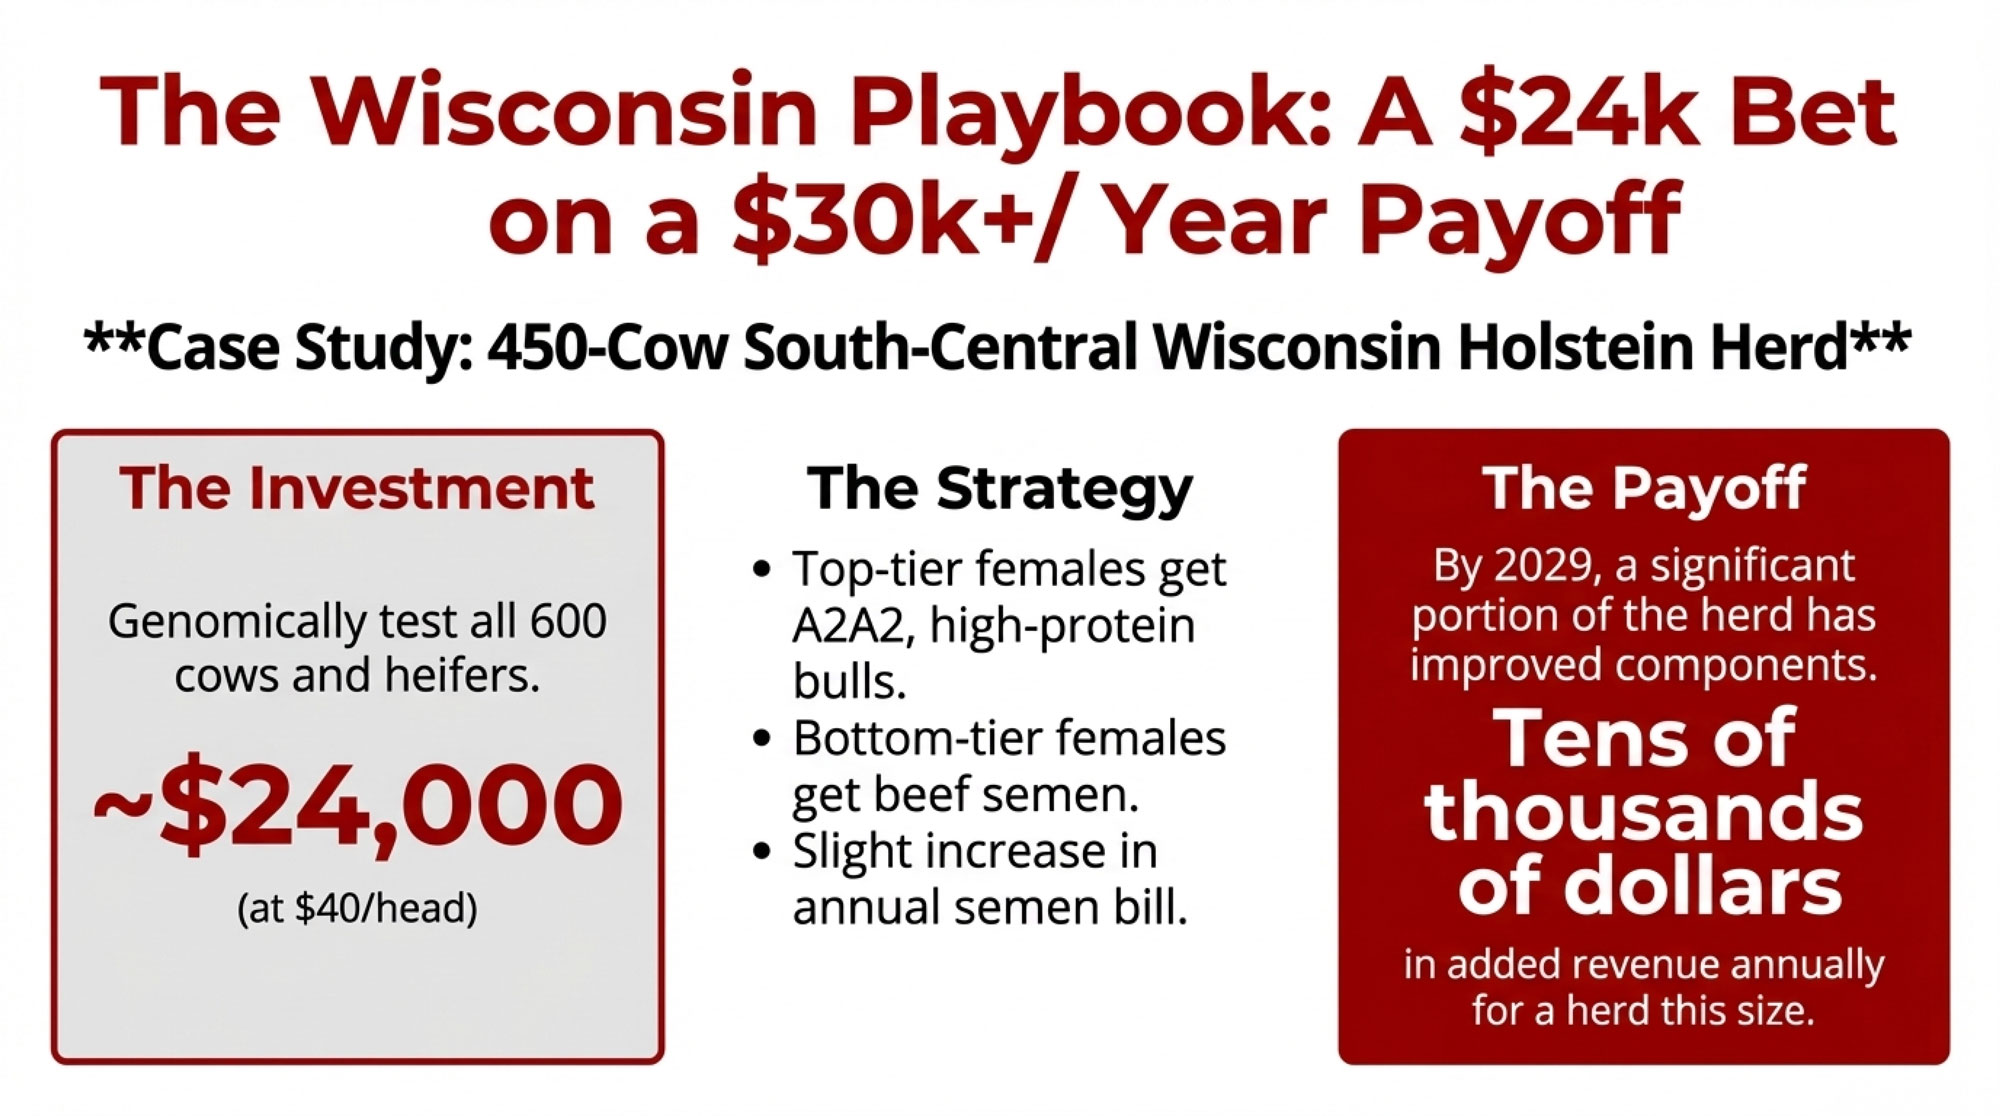
- You decide to test all milking cows and heifers genomically. At roughly 40 dollars a head and 600 head total, that’s about 24,000 dollars—a noticeable check to write, but still a fraction of any major building project.
- The results come back and, like UMN, you discover a decent chunk of your Holsteins are A2A2 and that a meaningful fraction carry kappa-casein genotypes that cheese makers like.
- You sit down with your genetics advisor and draw up a simple plan: the top tier of heifers and cows on components and health get bred to A2A2, high-protein, favorable kappa-casein bulls; the bottom tier gets beef semen. Your overall semen bill goes up a bit—maybe a thousand or two a year—but you stop multiplying the genetics that hold back components and cow health.
| Investment Item | Cost / Value | Timeline | Notes |
|---|---|---|---|
| Genomic Testing (600 head) | $24,000 | One-time upfront | Tests all cows + heifers; identifies A2, kappa-casein, component PTAs |
| Premium A2/High-Component Semen | +$1,500-$2,000/year | Ongoing | Small incremental cost vs. standard Holstein semen |
| Total First-Year Investment | ~$26,000 | Year 1 | One-time test + first year of premium semen |
| Milk Production (450-cow herd) | 20-22 million lbs/year | Baseline | Typical for well-managed Midwest freestall herd |
| Component Value Improvement (conservative scenario) | +$0.15-$0.25 per cwt | Years 3-5+ | Even modest protein % gains + favorable casein = higher pay |
| Annual Return (conservative) | $15,000-$30,000+/year | Ongoing after calves freshen | Based on 20M lbs at $0.15-0.25/cwt improvement |
| Simple Payback Period | <2 years | — | $26K investment / $15-30K annual return |
| 10-Year Net Benefit (conservative) | $120,000-$270,000 | Years 1-10 | Assumes modest component gains hold across herd lifecycle |
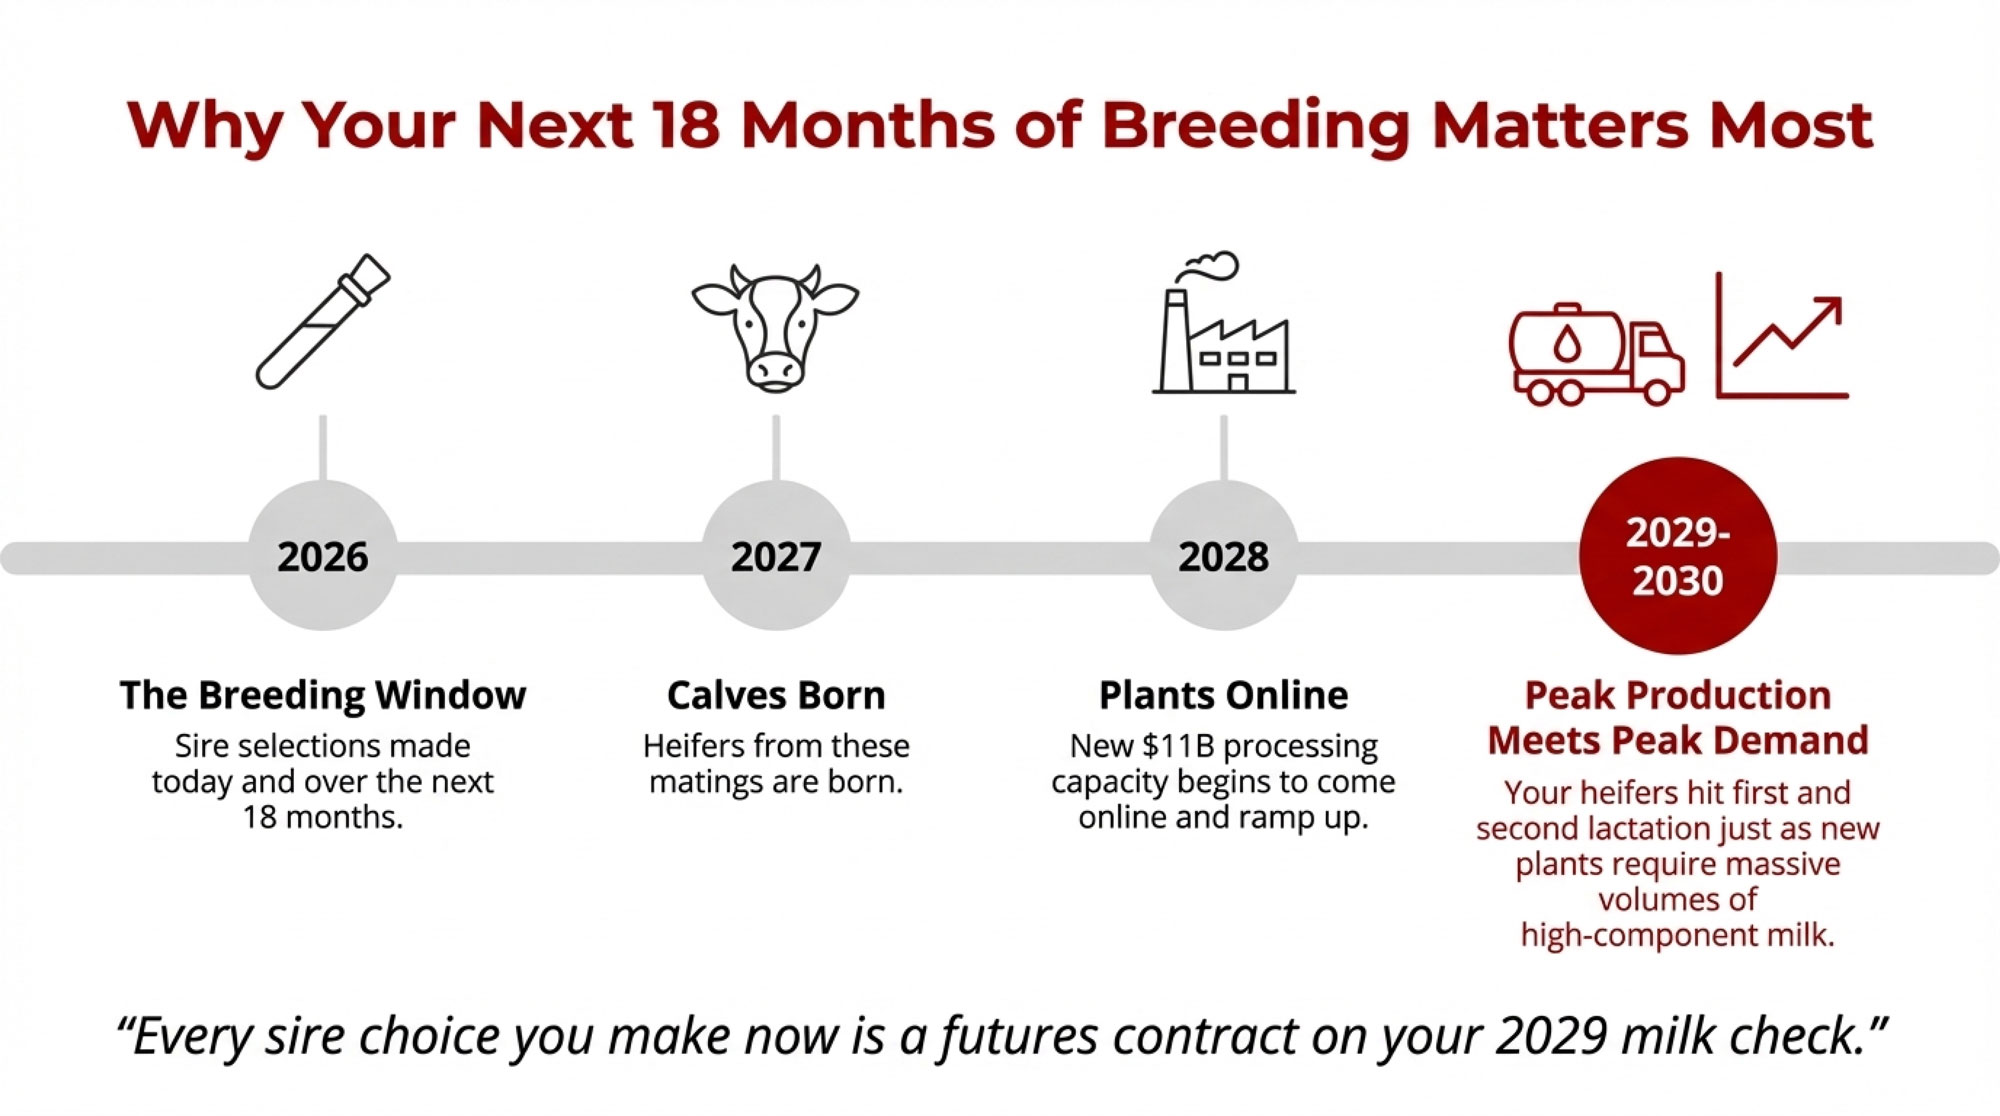
On the calendar, calves from those matings in 2026 are born through early 2027. Those heifers freshen in your parlor in 2028. By 2029-2030, a big slice of your herd is in second lactation with more consistent protein percentages and solid butterfat performance, as long as your nutrition and cow comfort keep pace.
A 450-cow herd milking well could easily be shipping on the order of 20 to 22 million pounds of milk a year. In some component pay systems used by cheese-oriented plants, even a small improvement in how protein is valued—a couple of cents per pound of protein, depending on the exact formula—can turn into tens of thousands of dollars a year for a herd that size when you run real solids and volume numbers through actual federal order and plant pay schedules.
Nobody can guarantee exactly what your protein line will look like in 2030. Pay formulas and markets change. But when the cost side of the strategy is a one-time genomic investment and a modest ongoing semen premium, and the upside sits in that “tens of thousands per year” range in a world that’s clearly leaning into protein-dense dairy, you can see why more producers are at least sharpening their pencils.
Western Dry Lot Systems: When Components Become “Exported Water”
Now, slide that coffee mug over to a friend running 3,000 cows in a dry lot system in the Texas Panhandle or eastern New Mexico, and the conversation sounds a little different. The underlying theme is the same, though.
In those systems, water and purchased feed are usually the top two headaches.
U.S. Geological Survey data on the Ogallala Aquifer shows that in heavily irrigated parts of western Kansas and the Texas High Plains, groundwater levels have dropped significantly over the past several decades—in some areas, declines of 50 to 70 feet or more in the most heavily pumped townships. USDA Climate Hubs data shows similar patterns in Texas and Oklahoma. That’s a long-term structural issue, not just a “bad year.”
Climate and hydrology work on the Colorado River basin tells a similar story. Multiple research studies and federal data confirm that since about 2000, average river flows have been roughly 20 percent below the 20th-century average. The Nature Conservancy, Colorado State University researchers, and coverage in High Country News all point to reduced snowpack and higher temperatures—a “hot drought” pattern that’s likely to persist under current climate projections.
At the same time, USDA hay market reports and Western extension bulletins regularly show Supreme and Premium alfalfa in states like California, Arizona, Idaho, and New Mexico, bringing noticeably higher prices per ton than comparable hay in Wisconsin or Minnesota, reflecting irrigation costs and freight.
Delivered costs for corn and other concentrates are also higher when you’re far from the Corn Belt, something our previous coverage has been highlighting in its pieces on regional profitability and the “processing gap” between where milk is produced and where it’s processed.
So in that context, when Western producers talk about components, they’re often thinking less about a formal protein premium line on the cheque and more in terms of “How many pounds of fat and protein can I ship for each unit of water I’m legally and affordably pumping and each ton of feed I’m buying?”
That’s what people really mean when they talk about components as a way of “exporting water.” You’re not literally putting your irrigation water in the tanker, but the more solids you produce per acre-inch of water and per ton of dry matter, the more value you’re effectively moving off the farm with each load of milk.
In practical terms, that’s where genomic selection for traits like protein percentage, feed efficiency, and health, paired with sharp ration work and solid fresh cow management during the transition period, becomes a survival tool rather than just a nice genetics project.
Why the Next 18 Months Matter More Than They Seem
If you lay all this out on a simple timeline, you can see why a lot of conversations keep circling around an “18-month window.”
From breeding to first calving is about nine months of gestation. Then you’ve got a couple of months for the heifer to get through the transition period and settle in, and at least one full lactation before you really know who she is in terms of components, health, and fertility. Realistically, it takes several years of consistently breeding in a chosen direction before that genetic shift really shows up in the bulk tank.
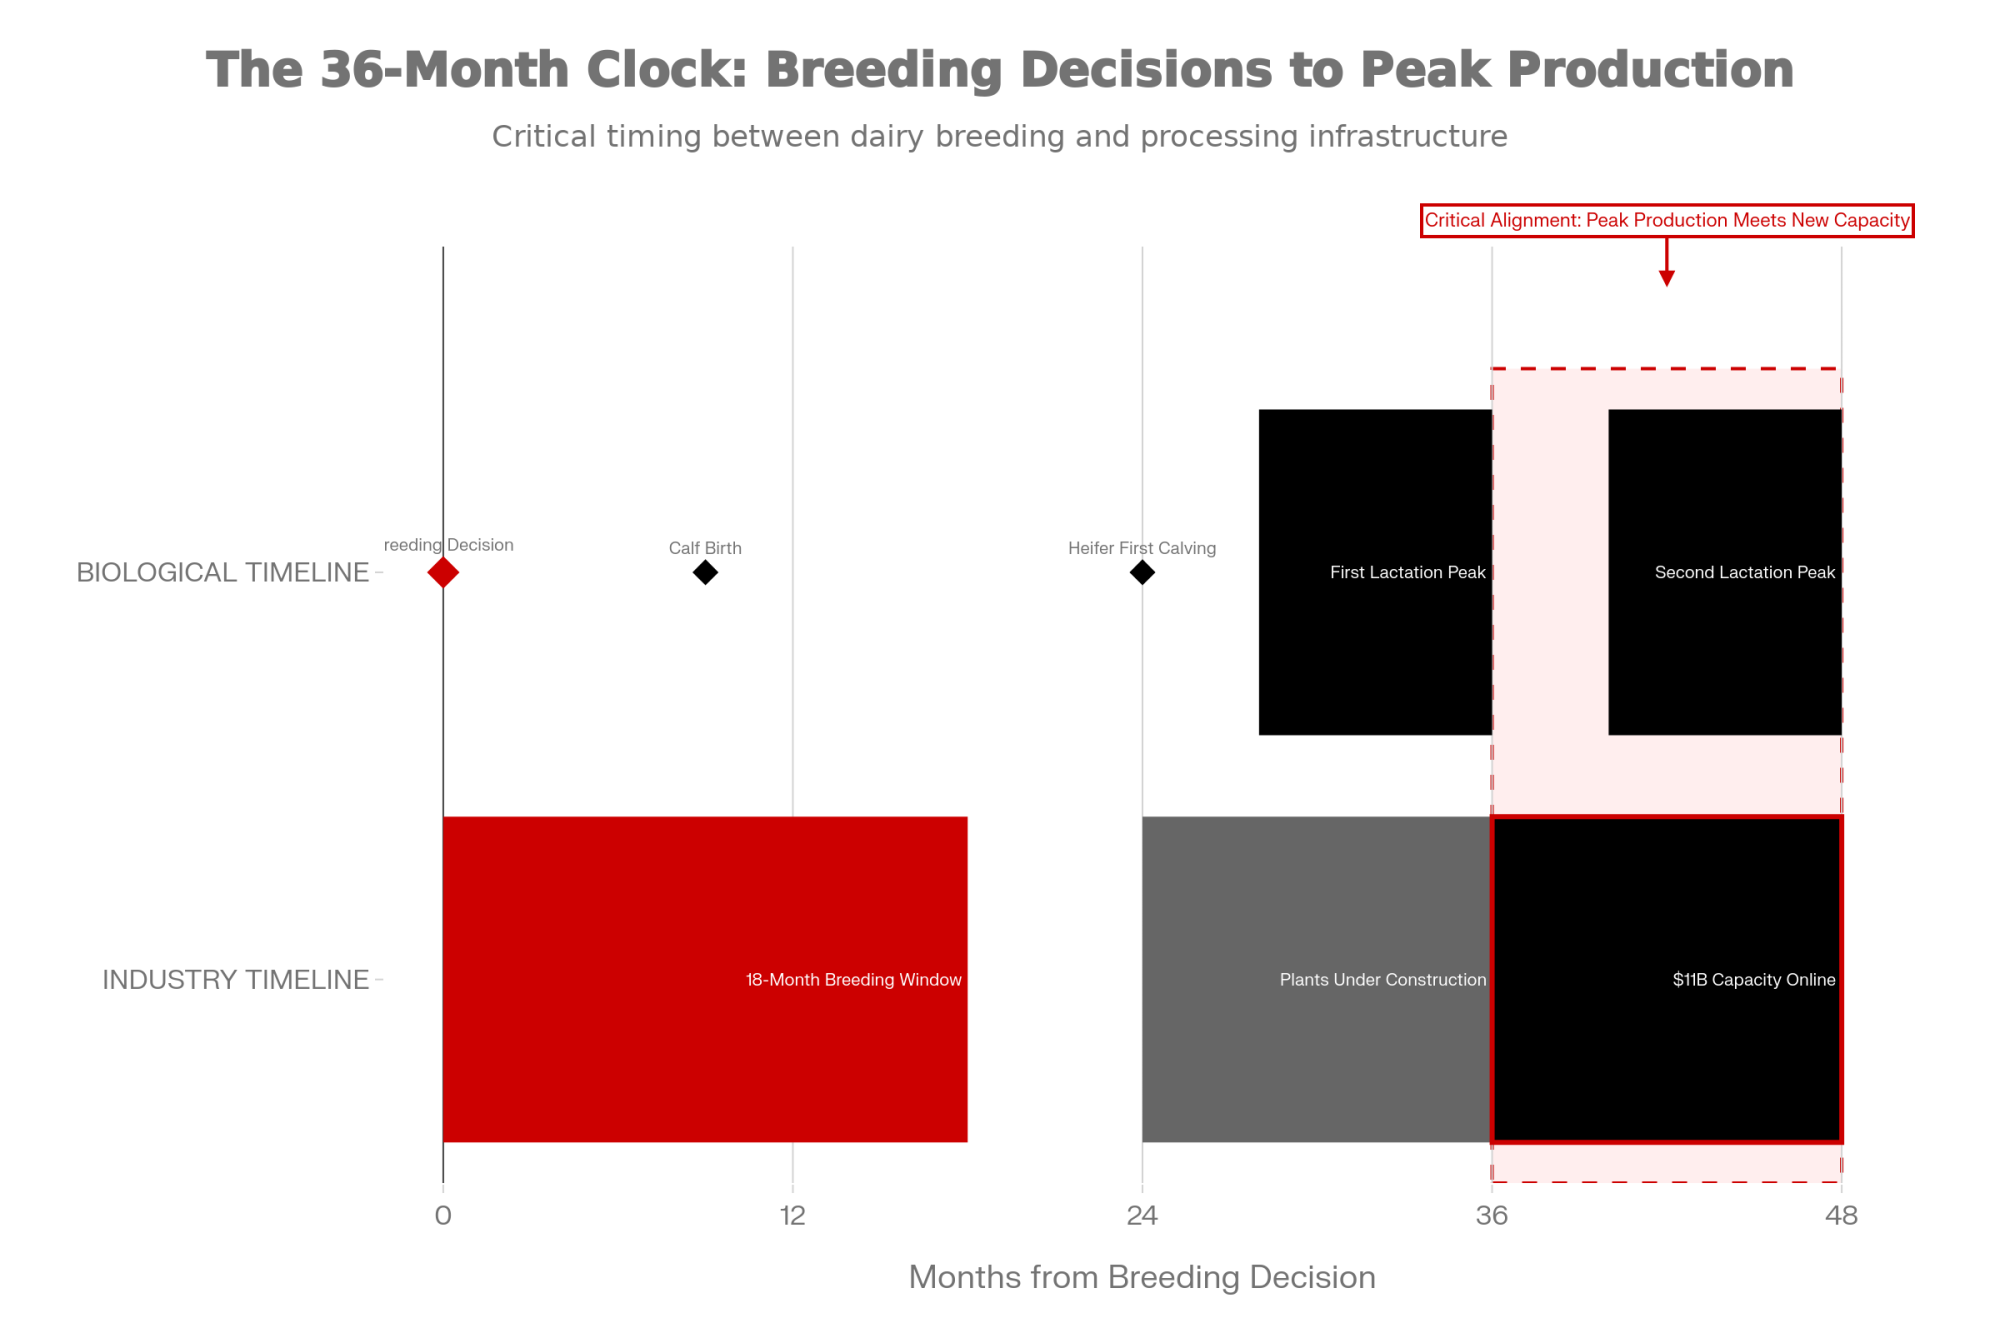
On the processing side, most of the projects in that 11-billion-dollar wave are slated to start up between now and the end of the decade. If they stay roughly on schedule, the new cheese, yogurt, and ingredient plants will be running full out right when the calves you breed in the next 18 months are in their first and second lactations.
GLP-1 use and gut health awareness aren’t expected to disappear over that same period, either, based on current clinical and market outlooks.
So, whether you think about it this way or not, every sire selection you make today is a kind of futures contract on your 2029 milk check. You’re deciding how much of your herd, three to five years from now, will be built mainly for volume, and how much will be built for components that match the products and markets your milk will flow into.
Talking With Your Processor: Three Questions Worth Asking
I’ve noticed that the farms that navigate this best aren’t just tweaking genetics in a vacuum; they’re also having better conversations with the folks who cut the checks.
If you pick up the phone or catch your field rep in the yard, three simple questions can open up a lot:
- First: “Looking at the new plants we’re building into, how do you expect protein and butterfat to be valued over the next five to ten years compared to today?”
- Second: “Are there specific quality or composition targets—like protein percentage, A2 status, or other specs—that you expect to reward more as these projects come online?”
- Third: “Based on your data, where does my herd stand today on components and quality relative to your overall supplier base?”
Processors and co-ops often have more visibility into future product mix than we do from the farm side. Asking these questions doesn’t mean you’ll get a perfect forecast—nobody has that—but it can help you decide how aggressively to steer your genetics, nutrition, and fresh cow management toward components.
And honestly, that’s the kind of conversation that separates the farms steering the bus from the ones just along for the ride.
Different Farms, Different Plays—And That’s Okay
As many of us have seen over the years, there’s never just one “right” answer that fits every farm.

If you’re a younger operator—say under 45—with a competitive cost of production and a realistic plan to be milking for another 15 to 20 years, this protein-heavy future probably looks more like an opportunity than a threat. Genomic testing a meaningful share of your herd, tightening sire selection around protein, butterfat, and casein while still protecting fertility and cow health, and working with your nutritionist to support solids as well as volume, are all moves that research and extension work suggest can pay back over a longer time horizon.
If you’re in that mid-career zone—mid-40s to mid-50s—and staring at a parlor, freestalls, or manure setup that’s near the end of its useful life, your decisions get more complicated. Industry data shows robotic milking units typically ranging from 150,000 to 230,000 dollars per unit, and full conversions for 400- to 600-cow herds can easily clear a million dollars once buildings and support systems are included. Payback estimates often fall in the seven- to ten-year range, depending on actual labor savings, component shifts, and day-to-day management.
In that situation, what a lot of mid-career producers are doing is leaning first on lower-capital levers: improving genetics for components and health, tightening fresh cow management in the transition period, putting serious effort into forage quality and consistency, and, where appropriate, using tools like Dairy Margin Coverage or private revenue protection to soften some of the income swings while they make those improvements.
If you’re closer to retirement and there’s no clear successor ready to step in, the smartest move may be different again. USDA and land-grant land value reports show that farm real estate in good dairy regions—especially around the Great Lakes—has held value well and, in many cases, has increased substantially over the past 15 years. In some strong dairy counties, values have doubled or more.
In that context, it often makes sense for someone in their late 50s or 60s to focus on maintaining cow health and respectable components, avoid taking on major new debts that won’t realistically be paid off during their working years, and keep the place clean and marketable so they can sell or rent out on their own terms when the time feels right.
None of these paths is “better” in every situation. They’re just different ways of responding to the same set of signals, depending on where you and your family are in your own story.
A Note for Canadian Producers
For those of you milking under quota north of the border, the component picture plays out a little differently—but the underlying direction is similar.
Canadian Dairy Commission support prices and provincial board formulas have always valued butterfat heavily, and that hasn’t changed. But the rising importance of protein in cheese yields and in high-protein consumer products is shaping how milk classes are structured and valued.
If you’re considering A2 or kappa-casein genetics, the economics work a bit differently under quota than under U.S. federal orders, but the potential for premium marketing channels—particularly for fluid A2 milk and specialty cheese—is growing in Canada too.
Reports show that in early 2025 that Minnesota dairy farmers are increasingly interested in A2 milk, and that interest is mirrored across the border as Canadian processors explore differentiated product lines.
The strategic question is similar: know your herd’s genetic profile, understand where your processor is headed, and make breeding decisions that line up with both.
The Long Game: Water, Land, and Where Dairy Stands
Before we drain the coffee pot, it’s worth zooming out one last time and thinking about the long game.
Those water trends I mentioned earlier—the Ogallala declines, the Colorado “hot drought”—are already forcing Western agriculture, including dairies, to adjust cropping patterns, scale back irrigated acres, and in some cases rethink long-term viability.
| Region | Primary Water Source | Status / Trend | Long-Term Outlook | Strategic Implication |
|---|---|---|---|---|
| Texas / Kansas / Oklahoma High Plains | Ogallala Aquifer | -50 to -70 feet in heavily pumped areas since 2000 | Continued decline; fossil water | Risk: Rising costs, limited expansion, potential exit |
| Southwest / Colorado River Basin | Colorado River | -20% avg. flow since 2000; persistent “hot drought” | Likely permanent reduction per climate models | Risk: Competing demands, regulatory limits on ag water |
| Great Lakes Region (WI, MI, NY, PA, OH) | Great Lakes + groundwater | Stable; 20% of global fresh surface water; renewable | Secure; regulated but abundant | Opportunity: Water-secure base for high-component dairy |
| Northeast / Upper Midwest (MN, IA) | Surface + renewable groundwater | Generally stable; localized stress in some areas | Secure to moderately secure | Opportunity: Can support expansion near processing hubs |
| Idaho / Pacific Northwest | Snake River, Columbia Basin | Moderate stress; dependent on snowpack trends | Variable; snowpack declines a concern | Mixed: Secure short-term; watch long-term snowpack |
Meanwhile, regions around the Great Lakes and much of the Northeast, while facing their own regulatory and environmental pressures, sit over comparatively robust and renewable water supplies.
In outlook meetings and trade coverage, economists from places like UW-Madison and the Food and Agricultural Policy Research Institute have pointed out that, over the long term, water-secure regions in the mid-section and upper Midwest are likely to remain very competitive bases for high-value, component-dense dairy production, especially as water limits and climate volatility tighten elsewhere.
So when you put all of this together—GLP-1 nudging people toward higher-protein diets, gut-health research backing fermented dairy, processors pouring billions into cheese and cultured capacity, herd genetics already carrying more A2 and kappa-casein variation than many of us realized, and export demand for high-protein powders and cheeses continuing to grow in markets like Asia and the Middle East—it’s not surprising that so many barn-office and meeting-hall conversations keep circling back to components.
Key Takeaways for Your Farm
If you like things boiled down, here are a few questions and actions worth mulling over in the next 18 months:
- Know your genetics: Do you actually know your herd’s A2, kappa-casein, and component profile, or are you guessing? A targeted genomic test can answer that.
- Align sires with where plants are going: Are you picking bulls that match the protein-heavy, cheese-and-cultured future your local plants are investing in?
- Talk to your buyer: Have you asked your processor how they expect to value protein and fat over the next five to ten years, and how your herd stacks up today?
- Match strategy to stage: Given your age, equity, and family plans, are you better off leaning into growth, tightening the current system, or focusing on a clean exit with strong land value?
The Bottom Line
If we were actually sitting at your kitchen table, I wouldn’t pretend there’s an easy, one-size-fits-all answer.
What I’ve seen, watching a lot of different farms, is that the ones that come through big shifts like this in the best shape aren’t always the biggest or the fanciest. They’re the ones that stay curious, pay attention to where the science and the money are pointing, and then make a handful of well-timed, thoughtful decisions instead of either doing nothing or trying to change everything at once.
When you lay the GLP-1 billions, the 11-billion-processor bet, and your own protein line side by side, it’s hard to argue that this is just another passing fad. The genetics are already in your pens, at least to some degree. The concrete is being poured at the plants. The health trends aren’t evaporating next week.
The real question is how you want to position your herd—and your milk check—for the chapter that’s already starting to unfold.
Complete references and supporting documentation are available upon request by contacting the editorial team at editor@thebullvine.com.
Learn More
- The $38,000 Question: Why Components Beat Volume in Dairy’s New Reality – Arms you with the hard math to stop chasing litres and start harvesting cheques. This operational breakdown reveals how a mere 0.1% protein gain delivers $38,000 in annual revenue for a typical 500-cow herd.
- 2025 Dairy Year in Review: Ten Forces That Redefined Who’s Positioned to Thrive Through 2028 – Exposes the structural shifts—from the $11 billion processing wave to the deepening heifer shortage—that are rewriting the industry’s playbook. Use these insights to secure your operation’s competitive footing over the next three critical years.
- Genetic Correlations Upended: Why Sticking with Old Breeding Indices Could Cost Your Dairy $486 Per Cow– Breaks down the massive 2025 genetic reset that found a $486 profit gap hidden in modern breeding indices. It delivers the strategy to align your herd with the newest benchmarks for feed efficiency and component value.
 The Sunday Read Dairy Professionals Don’t Skip.
 The Sunday Read Dairy Professionals Don’t Skip.
Every week, thousands of producers, breeders, and industry insiders open Bullvine Weekly for genetics insights, market shifts, and profit strategies they won’t find anywhere else. One email. Five minutes. Smarter decisions all week.


