


Your agronomist and nutritionist both wrote good plans. The problem is nobody checked if they match.
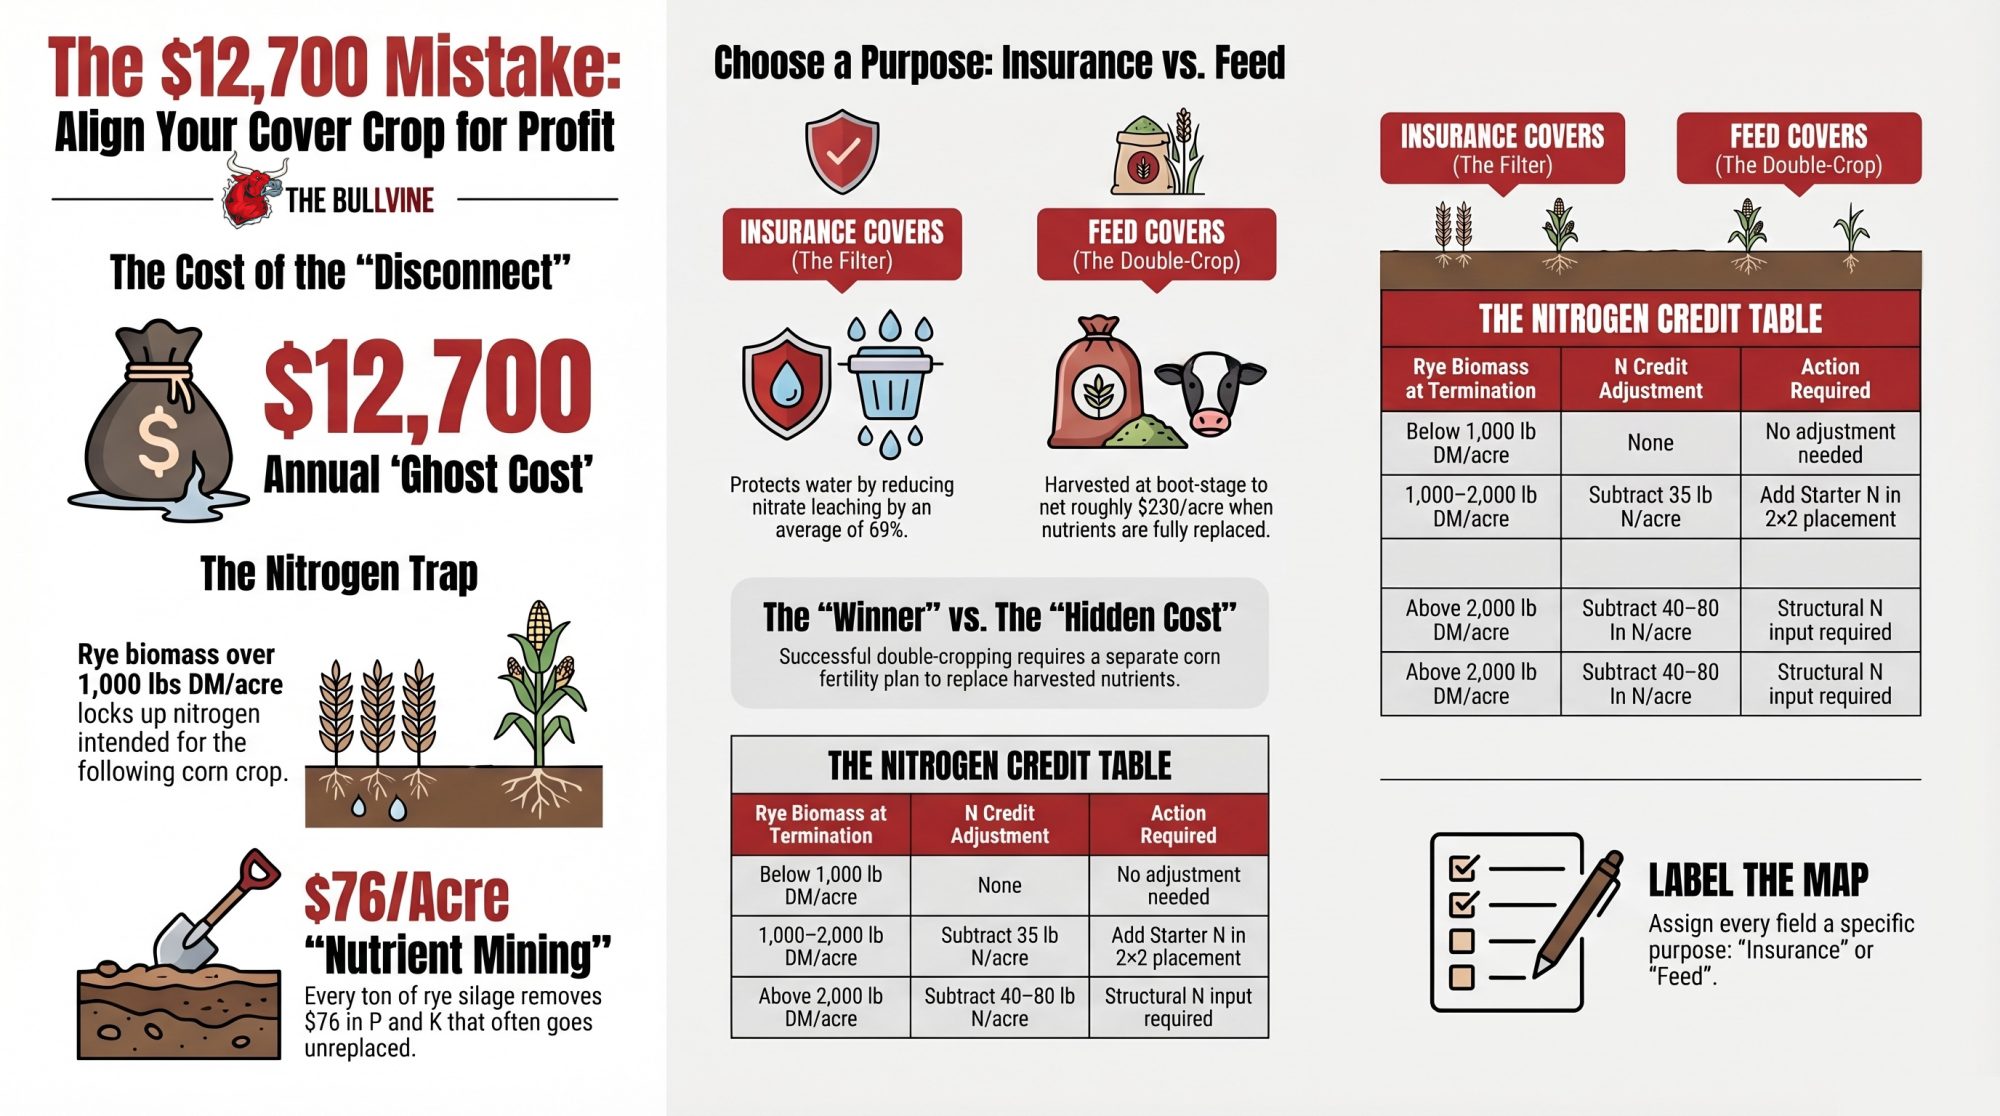
Executive Summary: On a 500-acre Midwest dairy running cover crops and fall manure, the disconnect between the agronomist’s fertility plan and the nutritionist’s forage targets costs at least $12,700 a year — and almost nobody’s budgeting for it. The core problem isn’t the manure or the rye; it’s that no one’s deciding field by field whether the cover crop is there for water protection or for feed. Those two jobs demand different nitrogen strategies: UW-Madison data shows that once rye biomass tops 1,000 lb DM/acre at termination, you need to subtract 35 lb N/acre from your manure credit and bridge it with starter — roughly $25.55/acre at spring 2026 urea prices. On harvested double-crop acres, the math gets worse: every ton of rye silage strips about $76 in P and K off the field, and if that’s not a separate replacement line in the corn plan, you’re mining soil fertility and booking it as feed margin. The difference between a double-crop system netting $230/acre and one quietly bleeding $7,600/year in unreplaced nutrients is one column on your field map — purpose — and one meeting your agronomist and nutritionist should’ve had last February.
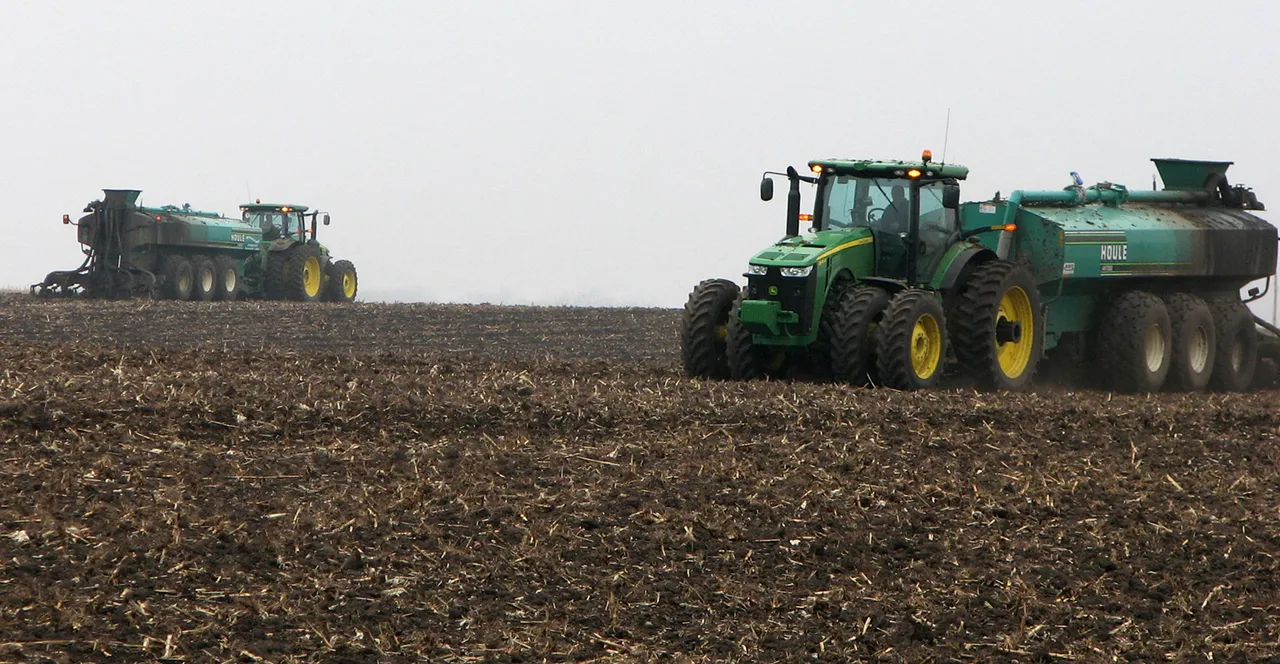
Picture a kitchen table in February on a Midwest dairy running cover crops and fall manure. Feed program printouts are stacked on one side, coffee rings and all. The agronomist’s nutrient-management binder sits on the other side. A field map is thumbtacked to the wall behind the pot. On a 500‑acre family dairy, those two stacks of paper rarely end up in the same conversation.
The agronomist built a corn silage fertility plan assuming a certain manure nitrogen credit. The nutritionist designed a ration around forage quality targets. Both plans are solid on their own — but if nobody connects them through the cover crop, the field‑level economics quietly fall apart. And the cover crop ties those two plans together? It often got planted because someone recommended it, without anyone deciding what it was actually there to do. That gap costs $10,000 to $20,000 a year on an operation this size — and the verified floor, once you run the math with spring 2026 fertilizer prices, is $12,700.
The fix doesn’t require new iron or a bigger pit. It starts with a question nobody’s asking, field by field: What is this cover crop actually here to do?
Is That Cover Crop Insurance – or Feed?
On most dairies using cover crops, those acres are quietly serving two completely different jobs. Sometimes across the operation. Sometimes on the same field. Rarely with that job written down.
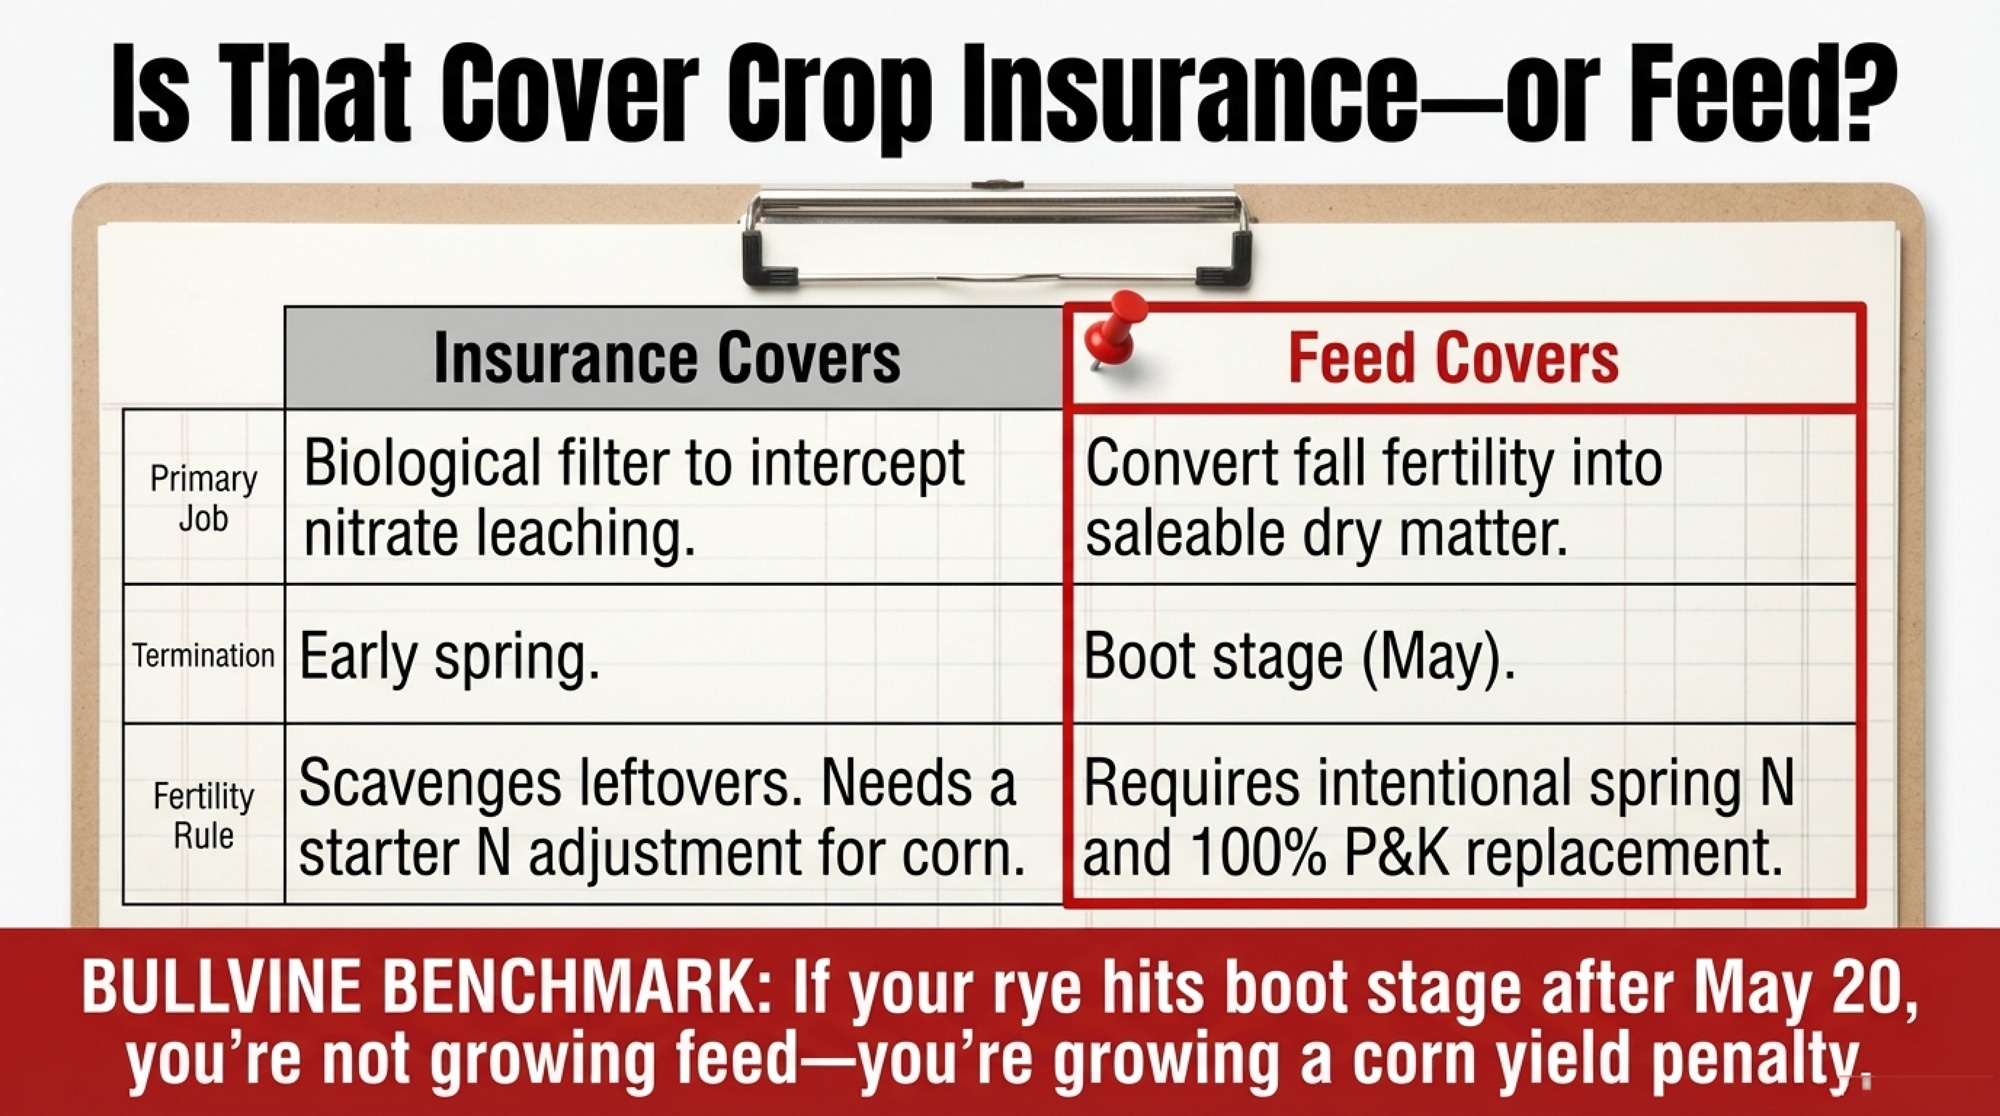
Insurance covers are biological filters. They intercept nitrate before it hits tile lines or surface water. A 41‑article global meta‑analysis found cover crops reduced nitrate leaching by an average of 69% compared to fallow ground, mostly in temperate row‑crop systems (Thapa et al., Global Change Biology, 2022). In Minnesota, a spring‑terminated cereal rye cover at the Waseca Southern Research and Outreach Center cut nitrate concentration and flow‑adjusted loss in tile drainage by about 70% in 2017, with smaller reductions (roughly 20–30%) in years when fall establishment was weaker.
Feed covers do something completely different. They convert fall‑applied fertility into saleable dry matter — tonnage you can put in front of cows. UMass double‑cropping work from 2014–2018 documented 2 to 4 extra tons DM per acre in spring while capturing 60+ lb N per acre. At Ohio State’s North Central Research Station in Fremont, Jason Hartschuh’s 2024–2025 nitrogen‑rate trial showed that boot‑stage rye yield jumped when spring N exceeded fall rates — and that 60 lb/acre of spring N was needed to maximize crude protein regardless of what went on in the fall(Buckeye Dairy News, March 2026).
Hartschuh’s team also ran the feed economics. High‑quality rye harvested at flag leaf emergence returned $9.80/cwt of milk in income over feed cost. Average rye at late boot slipped to $9.20/cwt. Headed‑out rye fell to $8.50/cwt — a $1.30/cwt spread from harvest timing alone (OSU analysis, 2019).
Neither job is wrong. The problem is when every acre is managed the same way.
Bullvine Benchmark: If your rye hits boot stage after May 20, you’re not growing feed — you’re growing a corn yield penalty.
Where Does the Money Actually Leak?
Think about a typical fall‑manure system. Manure goes on in September or October. Nitrogen starts transforming in the soil. Winter arrives. Then spring — often wet, tile lines running. The following corn crop won’t meaningfully use that nitrogen until late May or June. Long exposure window.
A living cover crop changes the equation by pulling nitrate as it forms, converting soluble nitrogen into plant tissue that water can’t carry away. But here’s the trade‑off nobody should sugarcoat: the cover crop isn’t scavenging leftovers; it’s locking up the groceries meant for the corn.
At roughly 1,000 lb of rye dry matter per acre, UW‑Madison work shows the cover can trap up to 25 lb of potentially leachable N. Push biomass past 2,000 lb, and the nitrogen tied up in plant tissue climbs toward 40 lb or more. Terminate late or grow heavy, and that N won’t be sitting there in the soil when corn needs it most.
Hartschuh put it bluntly in March 2026 Buckeye Dairy News: “When spring and fall total nitrogen applied is less than 100 lb/acre, our research showed that the forage removed more nitrogen than was applied.” The forage ate more than the field was fed. That’s the nutrient removal side of the ledger that disappears when nobody declares which job the field is doing.
The Nitrogen Credit Table You Should Print
Here’s where you turn that concept into a simple rule you can actually use.
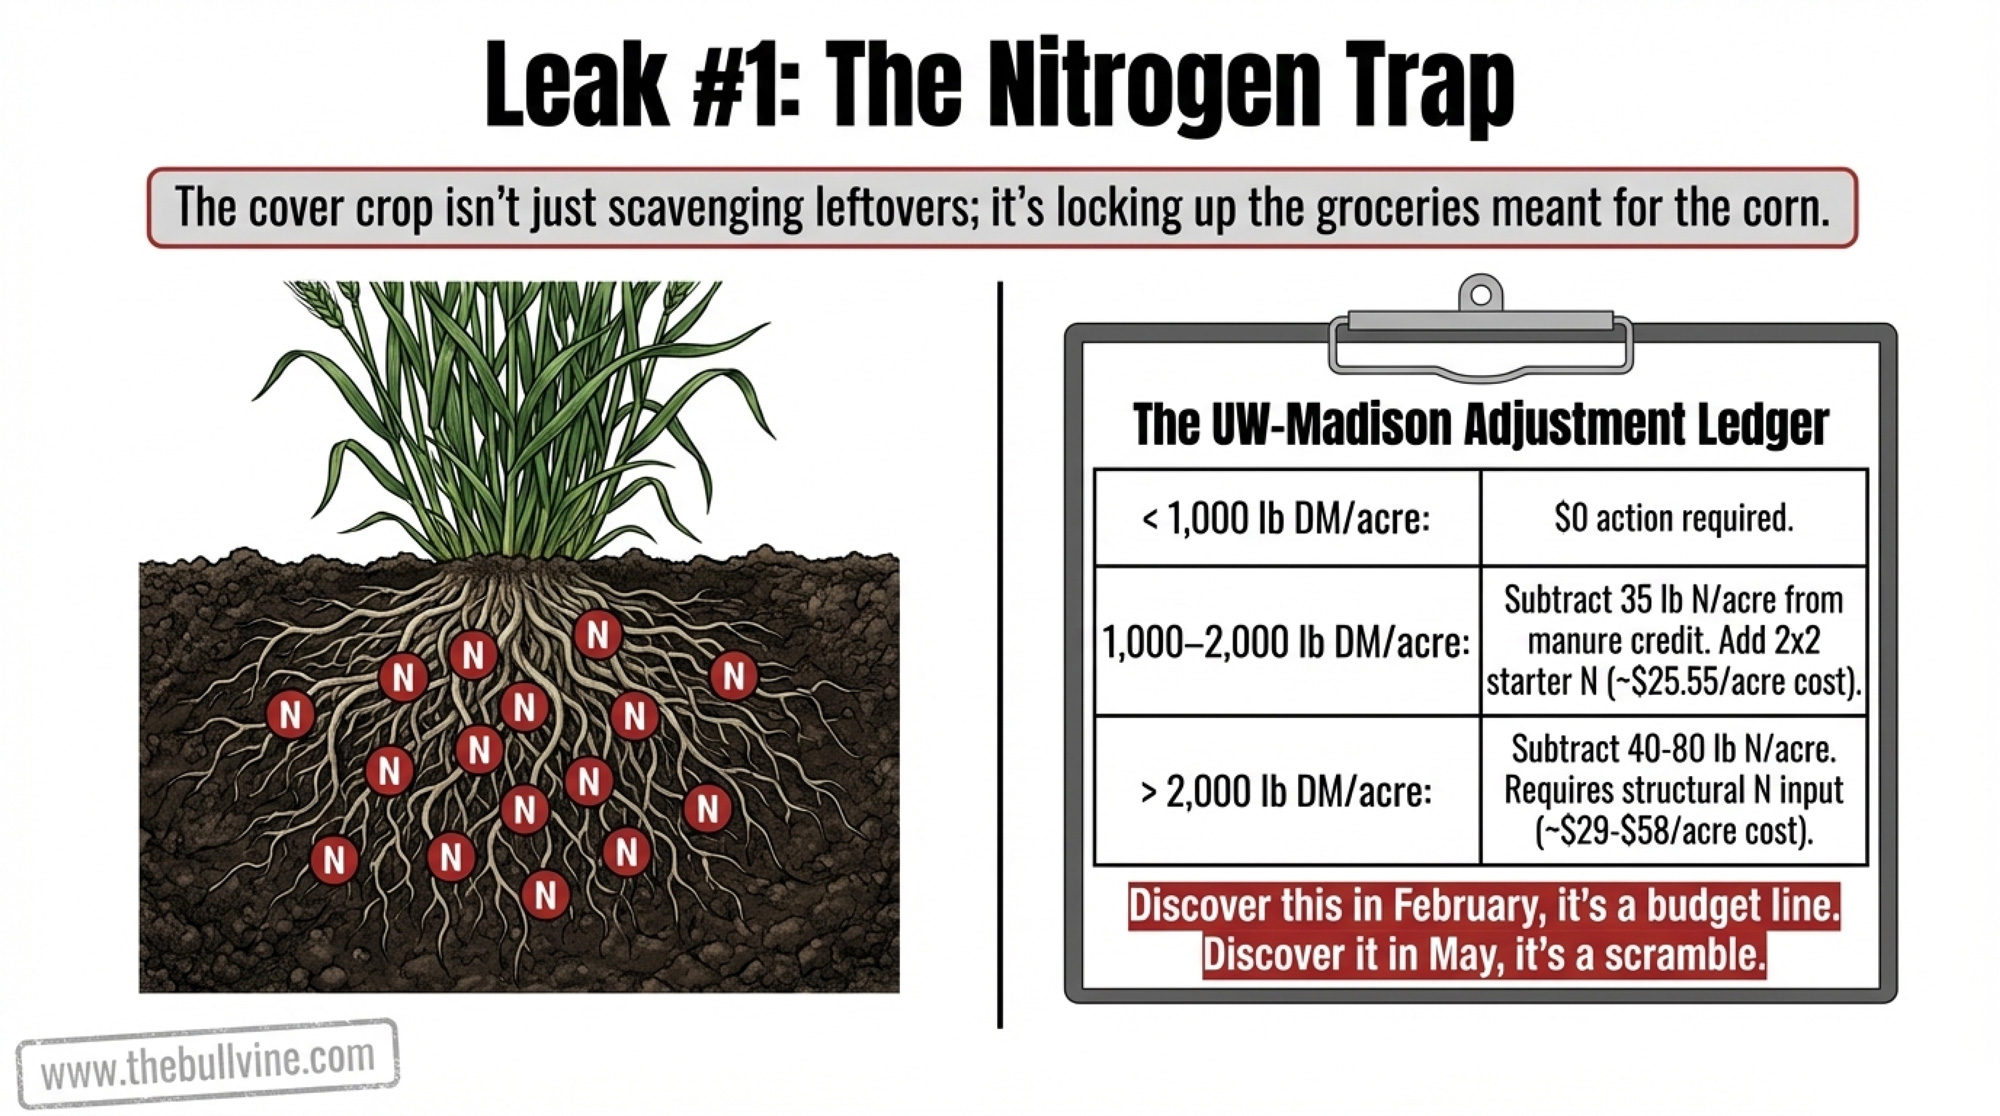
UW‑Madison’s A4178 Extension guide (updated March 2026) lays out a biomass‑based framework for adjusting manure N credits behind rye. At the same time, DTN’s March 2026 retail summary put urea over $600/ton, which works out to about $0.73/lb of actual N.
Put those together, and you get a very printable table:
| Rye Biomass at Termination | N Credit Adjustment | Action Required | Cost at $0.73/lb N |
| Below 1,000 lb DM/acre | None | No adjustment to manure N credit | $0/acre |
| 1,000–2,000 lb DM/acre | Subtract 35 lb N/acre from manure credit | Starter N in 2×2 placement | ~$25.55/acre |
| Above 2,000 lb DM/acre(approaching flag leaf) | Subtract 40–80 lb N/acre depending on manure rate | Structural N input — starter alone may not bridge the gap | $29–$58/acre |
You’re not adding a second full fertility program. You’re admitting that the cover crop sequestered some of the nitrogen the manure was supposed to deliver — and budgeting to make up the difference. Planned in February, that’s just another line in the fertilizer column. Discovered in May, it’s a scramble.
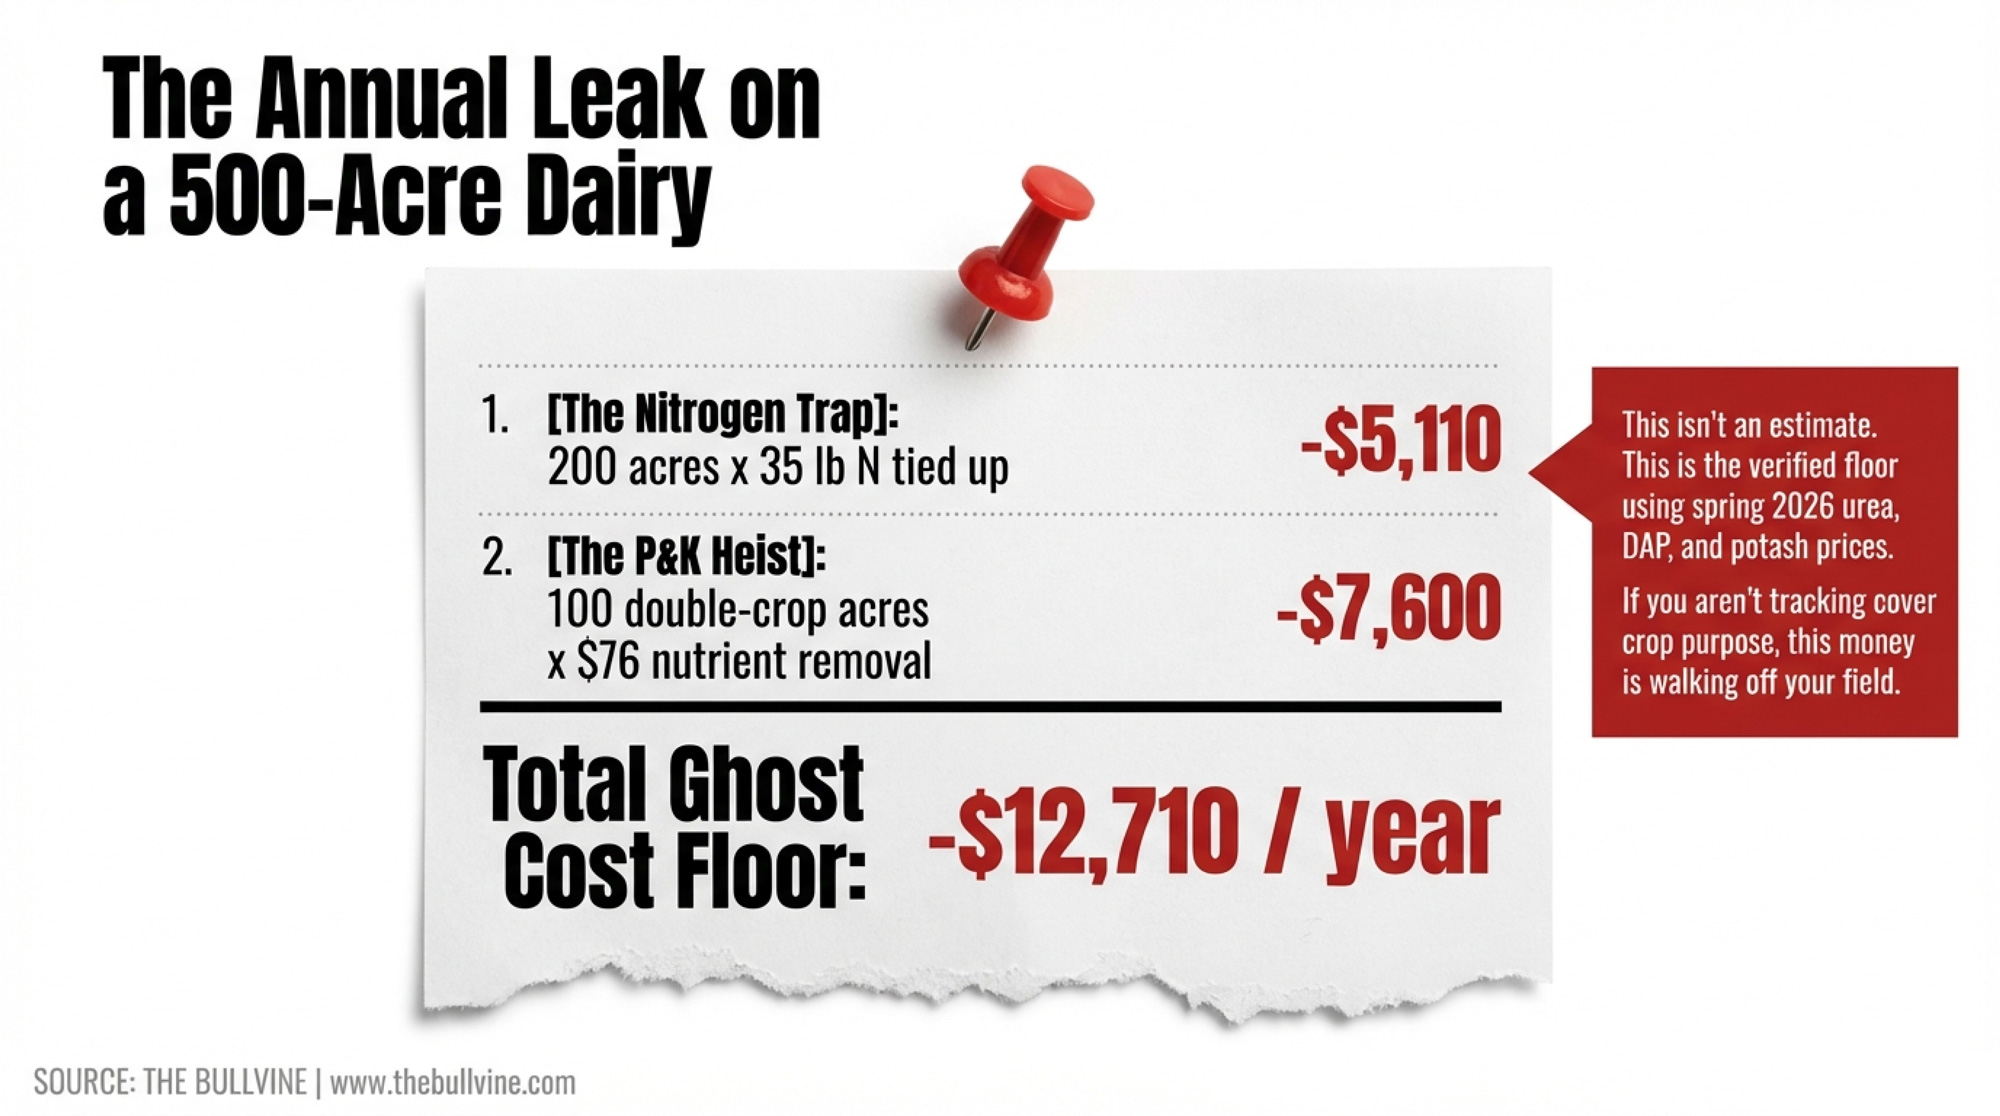
Across 200 “insurance” acres sitting in the 1,000–2,000 lb DM bracket:
35 lb N × $0.73 × 200 acres = $5,110.
That’s the first chunk of the $12,700.
Why Manure Alone Won’t Replace What the Rye Removed
Now look at the P and K, those double‑crop acres are hauling away.
OSCIA’s Crop Advances trials in Ontario (2014–2015) measured boot‑stage rye fertilized with 60 lb N, removing 26.5 lb P₂O₅ and 126.3 lb K₂O per acre. DTN’s February 2026 retail prices pegged DAP at $851/ton and potash at $487/ton. On a nutrient basis, that’s about $0.93/lb of P₂O₅ and $0.41/lb of K₂O. Multiply by the OSCIA removal rates, and you land at roughly $76/acre in P and K, leaving the field in the feed wagon.
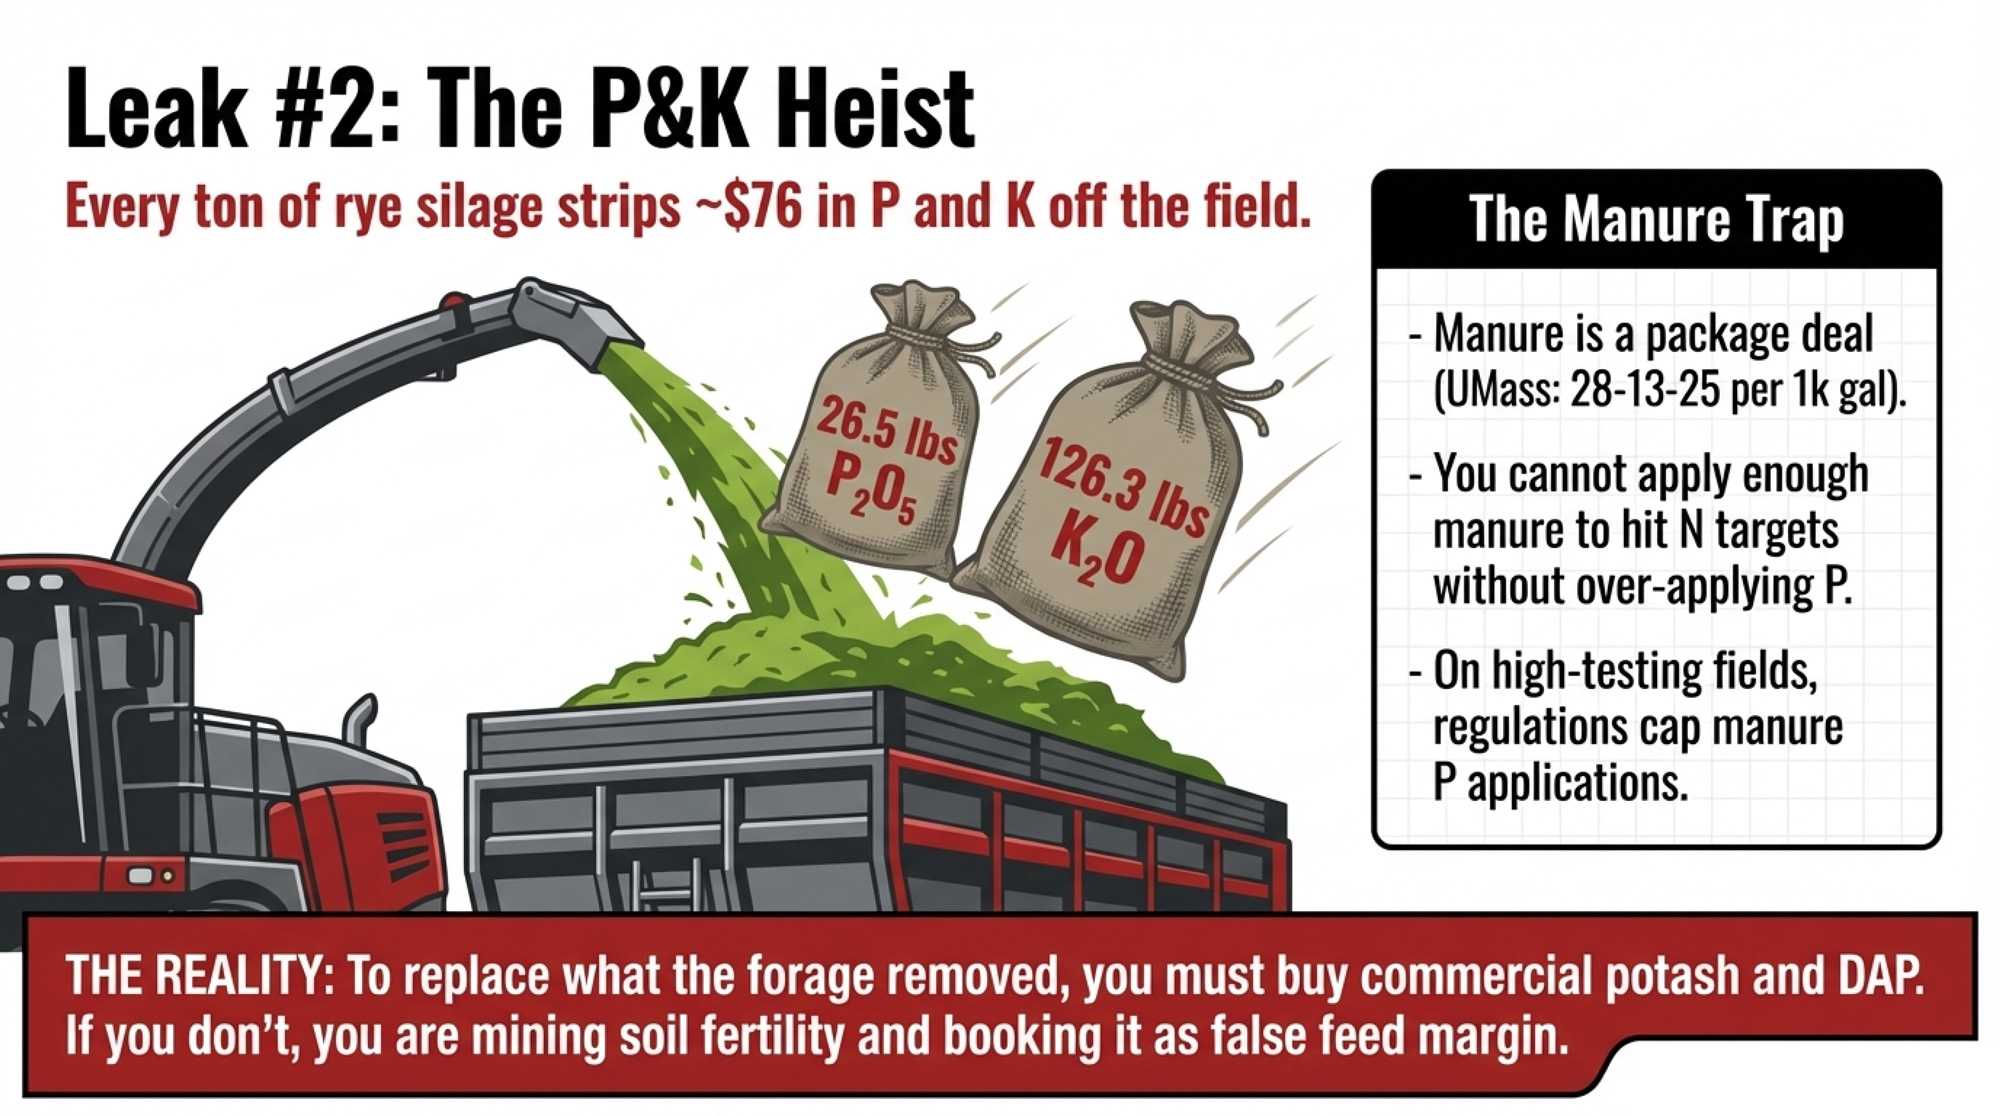
Here’s the catch: manure is a package deal. You don’t get to order N, P, and K separately.
UMass Extension puts liquid dairy manure around 28 lb N, 13 lb P₂O₅, and 25 lb K₂O per 1,000 gallons. Apply enough to hit your N target, and you’re stuck with whatever P and K ratio the cows produce. On many long‑term manured fields, soil test P is already high enough that you’re bumping into regulatory limits.
Manitoba’s nutrient management rules, for example, cap manure P application at 2× crop removal when Olsen P is between 60 and 120 ppm, at 1× removal between 120 and 180 ppm, and prohibit P application above 180 ppm. Ontario and several Midwest states have similar P‑based caps on high‑testing fields. In those situations, more manure isn’t on the table. To replace what the rye forage removed, you’re buying potash and sometimes DAP.
Across 100 double‑crop acres at $76 each: $7,600.
Add that to the $5,110 starter N line, and you’ve hit $12,710, which we’ll call the $12,700 ghost-cost floor. That’s before you factor in nitrogen slipping through tiles on low‑risk ground that never needed fall manure in the first place.
Bullvine Benchmark: If your double‑crop fields and your straight‑corn fields have the same fertility plan, someone’s getting robbed. Check which one.
When Does Double‑Cropping Rye Silage Actually Pay?
Same farm. Same 100‑acre block. Three different management stories.
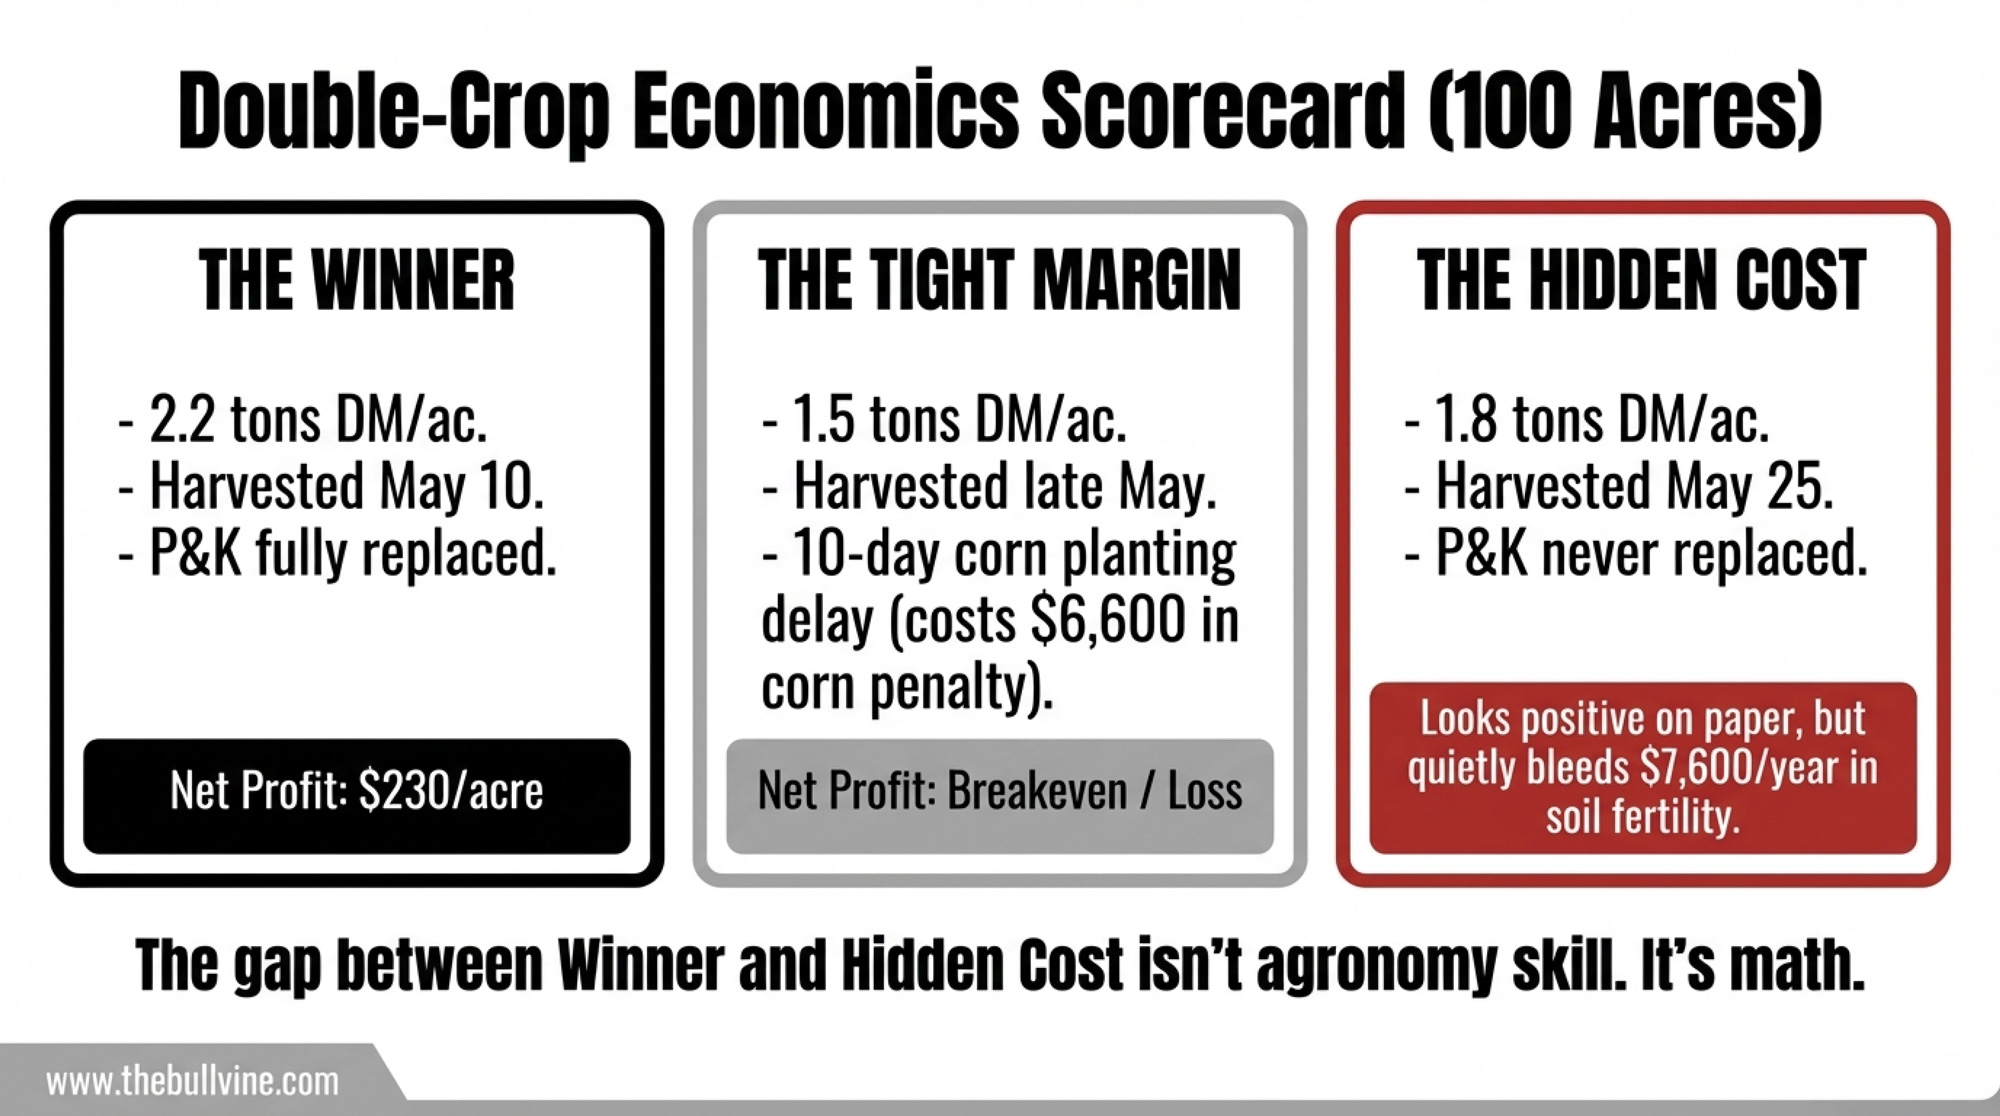
Version 1: The Winner — $230/acre net
Rye yields 2.2 tons DM per acre. It’s seeded on time and catches fall moisture. Harvest hits the boot stage by about May 10–15. Corn goes in by May 18. P and K removal gets fully replaced in the corn fertility plan.
- Revenue: 2.2 t DM × $180/t × 100 acres = $39,600 (adjust $180 to your local feed market; that’s the sensitivity lever).
- Costs: seed $25/acre + harvest/chop/pack $65 + P&K replacement $76 = $166/acre × 100 = $16,600.
- Net: $230/acre.
Cornell partial budgets for similar systems (2015 inputs) put cover crop forage production costs at $94–$118 per ton DM — a floor that’s higher now but still a useful benchmark. In this version, double‑cropping is clearly paying its way.
Version 2: The Tight Margin — Breakeven to loss
Now cut that rye yield to 1.5 tons DM/acre. Cold fall. Late seeding. So‑so stand. You throw 75 lb of spring N at it to try to rescue tonnage. Harvest slides to late May. Corn doesn’t go in until May 28.
UW‑Madison planting date work (Joe Lauer’s long‑term trials) pins corn grain yield loss at about 0.3% per day in early May, rising to roughly 1% per day after mid‑May. Extension agronomists commonly use a similar curve for silage tonnage. Even if you cut that in half to stay conservative, a 10‑day delay on an 8 t DM/acre silage field still costs:
8 t × 0.5% × 10 days = 0.4 t DM/acre.
At $165/t for corn silage, that’s 0.4 × 165 × 100 acres = $6,600 in corn penalty.
Once you add that to the rye economics, this version at best breaks even and at worst runs red. The farm harvested forage. The pencil says it barely mattered.
Version 3: The Hidden Cost — $7,600/year walking off the field
Same 100 acres. Rye yields 1.8 t DM/acre. Corn is planted around May 25. The P and K removed by the forage — that $76/acre — never gets replaced. Those fields get the same corn fertility plan as the terminated‑cover fields across the road.
On paper, the double‑crop looks profitable. The P and K line in the budget doesn’t move. But $7,600 in fertility value is leaving the field every year. By year three, soil test P starts slipping on ground that was comfortably high a decade ago. OSCIA’s Crop Advances team warned about exactly this: when you harvest rye as forage, you have to treat nutrient replacement as part of the economic calculation, not an afterthought.
The gap between Winner and Hidden Cost isn’t an agronomy skill. It’s whether anybody ran the nutrient removal numbers before they locked in the corn fertility plan.
Which Fields Should You Stop Trying to Harvest?
When rye looks good, it’s tempting to turn every acre into feed. That’s rarely the smartest play.
Realistically, on most dairies, maybe a third to two‑fifths of cover crop acres can reliably carry a double‑crop program without squeezing corn planting date or compaction risk too hard. The rest are better off in the insurance column — especially high‑risk fields for runoff or leaching.
Here’s a simple filter:
- Can this field reliably deliver 1.5+ t DM/acre without pushing corn planting past May 20? If not, it belongs in the insurance column.
- Heavy, tile‑drained clays that are slow to dry in spring? Those are prime insurance acres.
- Fields with slopes above 3% or close to tile outlets or surface water? Insurance — non‑negotiable.
- Land that always ends up last in the silage harvest queue or where covers don’t get seeded until October? Insurance. Weak establishment won’t support reliable feed tonnage.
The only thing you’re adding to the map your agronomist already has is one more column: Purpose.
| Dimension | 🛡️ Insurance Acres | 🌾 Feed / Double-Crop Acres |
|---|---|---|
| Primary goal | N interception, water protection | Saleable dry matter tonnage |
| Biomass target | <1,000 lb DM/acre | 1,500–2,500+ lb DM/acre |
| Seeding rate | Normal fall rate | Higher rate for stand density |
| Spring N | Pre-budgeted starter (35 lb N/ac) | 60+ lb N/ac for CP and yield |
| Termination | Early spring kill before boot | Boot-to-flag-leaf harvest window |
| Corn planting | On schedule, no delay | Must be in by May 20 or field reverts |
| Fertility plan | Standard corn silage plan | Separate plan with P&K replacement ($76/ac) |
| Risk profile | Tile-drained clays, slopes >3%, near water | Well-drained, flat, early-drying fields |
| If it fails | N still captured; low downside | Corn delay penalty + unreplaced nutrients |
Insurance fields get normal fall seeding rates, earlier spring termination, and a pre‑budgeted starter N line behind heavier biomass. Feed fields get higher seeding rates, intentional fall fertility, a May harvest window circled on the calendar, and a separate corn silage fertility plan that replaces every pound of P and K the forage pulled off.
Same species. Same drill. Same manure tanker. Different marching orders for different dirt.
Can Spring Manure Shrink the Risk Window — Without Wrecking the Soil?
Spring manure makes agronomic sense on more acres than most pits and schedules allow. Nitrogen availability at or near the incorporation site can approach 100%, compared with 60–70% for unincorporated fall-surface applications. On flat, well‑drained ground with low leaching risk, there’s not a strong agronomic argument for fall.
But the constraint isn’t just calendar. It’s compaction.
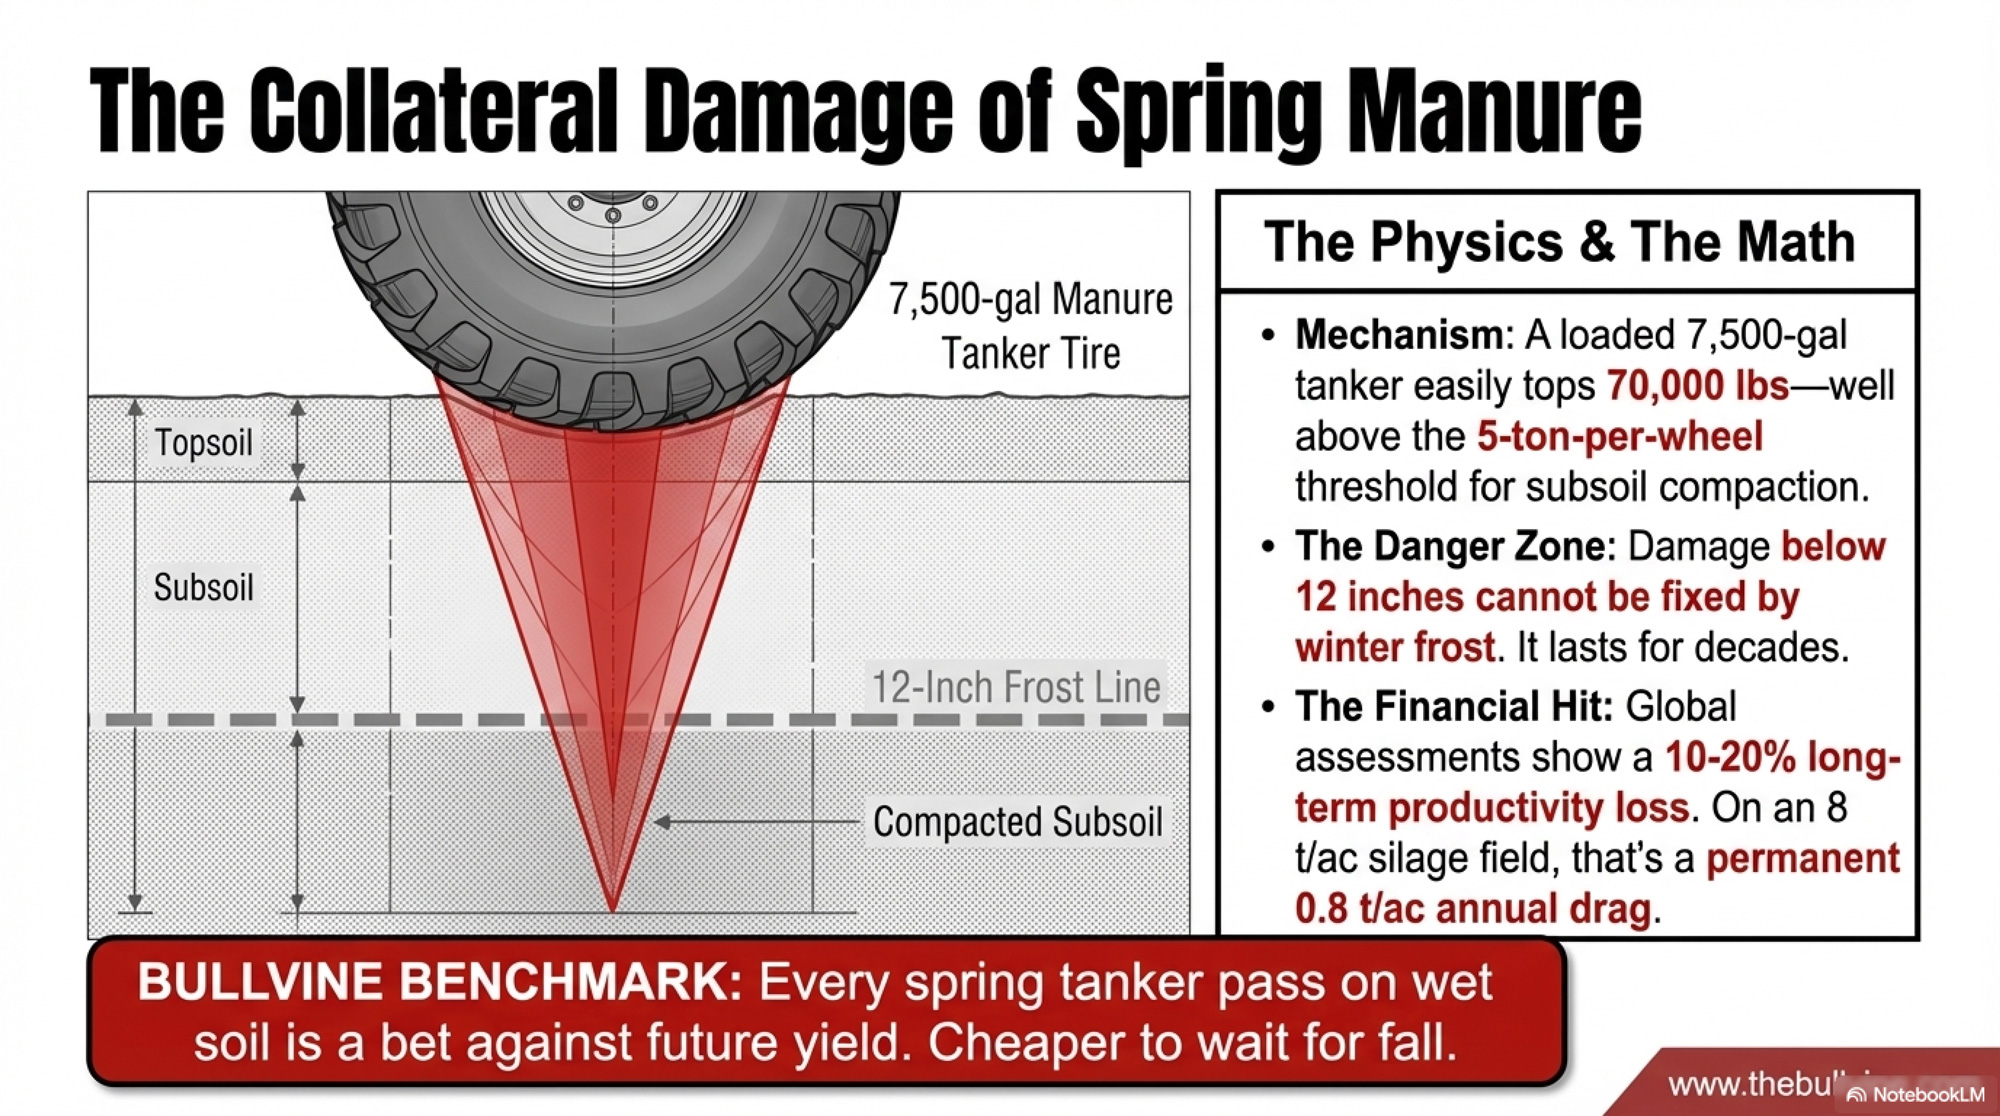
A loaded 7,500‑gallon tanker easily tops 70,000 lb. Even with duals, you’re well above the 5‑ton‑per‑wheel thresholdthat Matthias Stettler of Bern University of Applied Sciences flags as the line where subsoil compaction starts — damage below 12 inches that “can be felt for decades” because frost doesn’t reach that deep. A 2022 global assessment in PNAS (Keller et al.) pegs long‑term productivity losses from soil compaction at 10–20% for major crops in mechanized systems. On an 8 t DM/acre corn silage field, even a 10% drag is 0.8 t/acre — every year.
The realistic spring application window in the upper Midwest and Ontario is maybe 10–21 workable days between thaw and “too late for heavy iron.” Those same weeks, you’re eyeing the rye harvest and trying to start corn. Add manure to that window, and you don’t just create a scheduling headache; you set up a three‑way fight between the pit, the chopper, and the planter. When storage pressure wins, manure goes on too wet, on the wrong day, on the wrong soils.
The practical answer for most herds isn’t “flip everything to spring.” It’s picking three to five low‑risk fields you canhold back — even without more storage — and deliberately running those on spring timing for better N efficiency. That’s a realistic one‑year adjustment. A full-time switch is a multi‑year infrastructure and logistics project.
Bullvine Benchmark: Every spring tanker pass on wet soil is a bet against future yield. If you can’t wait for the field to carry the weight, it’s cheaper to wait for fall.
What This Means for Your Operation
- Can you name the purpose of every cover crop field right now? If you can’t quickly label a field “insurance” or “feed,” that’s the first leak to plug.
- Does your farm have one corn silage fertility program or two? If double‑crop and terminated‑cover fields follow the same corn fertility plan, you’re not replacing that $76/acre in P and K removal — you’re quietly mining soil tests.
- Are you budgeting starter N behind heavier rye biomass, or reacting in May? UW’s 35 lb/acre adjustment behind 1,000–2,000 lb biomass isn’t optional — it’s the cost of asking rye to protect N all winter and still feed the corn.
- When did you last compare soil tests on double‑crop vs straight‑corn fields? If the P and K gap is opening, the shortfall isn’t in the pit; it’s in the plan.
- Are you trying to force-feed production on fields that should be insured? If a field rarely hits 1.5 t DM/acre before May 20, you’re probably running Version 2 or 3, not the Winner.
- When was the last time your agronomist and nutritionist were in the same room with your field map? It’s not that either one is doing bad work — it’s that nobody’s paid to knit their plans together. If the answer is “never,” that’s the single most valuable meeting you can schedule before fall.
Key Takeaways
- If your rye biomass is over 1,000 lb DM/acre, starter N is a planned cost — not a surprise. For 1,000-2,000 lb of biomass, UW‑Madison data suggest subtracting 35 lb N/acre from your manure credit and bridging it with starter. Above 2,000 lb, that adjustment climbs to 40–80 lb N/acre.
- Every ton of rye silage is pulling about $76 in P and K out of the field at current prices. OSCIA’s 26.5 lb P₂O₅ and 126.3 lb K₂O removal at boot stage, multiplied by February 2026 fertilizer prices, is your base math. If there’s no replacement line in the corn plan for double‑crop acres, you’re cashing in soil fertility as profit.
- Double‑cropping doesn’t automatically pay. The Winner scenario nets ~$230/acre. The Tight Margin version barely breaks even after the corn delay penalty. The Hidden Cost version looks profitable on paper, while fertility quietly walks out the driveway.
First Step Monday Morning
This week
- Print your field map. Add one column: Purpose (Insurance or Feed). Assign every cover crop field — no “we’ll see” blanks.
- Pull last fall’s biomass notes, drone images, or just your best visual estimate, and mark which fields usually run below or above that 1,000 lb DM threshold at termination.
Within 14 days
- Pull the last two years of soil tests on your double‑crop fields and line them up next to your straight‑corn fields. Look specifically at P and K. If you see a downward trend only on the double‑crop ground, you’ve just found your $7,600.
- Print the nitrogen credit adjustment table and sit down with your agronomist. Agree on which biomass bracket most of your rye lands fall under and what that means for starter N on those acres.
Within 30 days
- Book the advisor meeting: agronomist, nutritionist, field map, and your best estimate of rye yields and harvest dates. The goal isn’t a perfect plan — it’s to get both people telling the same story about which acres are insured and which are feed.
- For each field in the Feed column, verify that the corn silage fertility plan includes a separate P and K replacement line if it doesn’t, add one before you decide where to put the fall manure.
Somewhere next February, there’s a kitchen‑table conversation waiting to happen. An agronomist, a nutritionist, and a field map spread between coffee cups. Two separate plans are finally becoming one. The only question is whether you pull those chairs together while the money’s still on the table — or after you’ve already watched it wash away.
Complete references and supporting documentation are available upon request by contacting the editorial team at editor@thebullvine.com.
Learn More
- Dairy Tech ROI: The Questions That Separate $50K Wins from $200K Mistakes – Exposes the hidden capital traps in automation by delivering a scale-based breakdown of technology investments. It equips you with specific breakeven thresholds for robots and activity monitors, ensuring your Monday-morning upgrades actually drive margin growth.
- More Milk, Fewer Farms, $250K at Risk: The 2026 Numbers Every Dairy Needs to Run – Reveals the brutal economic reset facing 500-cow dairies by mapping the quarter-million-dollar gap between rising output and falling prices. It breaks down the strategic positioning required to survive the “more milk, fewer farms” era through 2026.
- The Robot Revolution: Transforming Organic Dairy Farms with Smart Tech in 2025 – Breaks down the radical shift where smart sensors and computer “chefs” are redefining high-tech sustainability. It delivers a roadmap for integrating AI and robotics to slash nutrient runoff by 30% while capturing premium market positioning.
 The Sunday Read Dairy Professionals Don’t Skip.
 The Sunday Read Dairy Professionals Don’t Skip.
Every week, thousands of producers, breeders, and industry insiders open Bullvine Weekly for genetics insights, market shifts, and profit strategies they won’t find anywhere else. One email. Five minutes. Smarter decisions all week.
