


Jakob Stevens just sued Nutrien, Mosaic, CF Industries, Koch, and Yara. His math: 85% of the 2022 fertilizer spike wasn’t gas prices. It was them.
Executive Summary: Jakob Stevens sued the fertilizer giants: Nutrien, Mosaic, CF Industries, Koch, Yara, and Canpotex. Fire Creek Farms leads the class action alleging price collusion for 2021–2023. DOJ’s on it too. Texas A&M says natural gas drove 15% of the spike. The other 85% hit your 500‑cow dairy for $43,500 extra in 2022. That’s $0.35/cwt sneaking into your milk check. Test your manure this month. Recalibrate to MRTN. Time those buys right. The court might take years. Your pit’s got nitrogen now.
On March 7, 2026, New York farmer Jakob Stevens filed what may be the first class‑action lawsuit to put a number on what fertilizer price collusion costs U.S. farms. His family operation, Fire Creek Farms, is the lead plaintiff in Stevens et al v. Nutrien AG Solutions et al (No. 1:2026cv02585, U.S. District Court, Northern District of Illinois). The defendants: Nutrien AG Solutions, Mosaic Company, CF Industries, Koch Agronomic Services, Yara International, and the Canpotex export consortium. The complaint alleges their conduct pushed fertilizer prices above competitive levels during 2021–2023. All of the defendants deny wrongdoing or are expected to contest the allegations; none of these claims has been proven in court.
You don’t have to wait for a verdict to see what that window did to your own invoices.
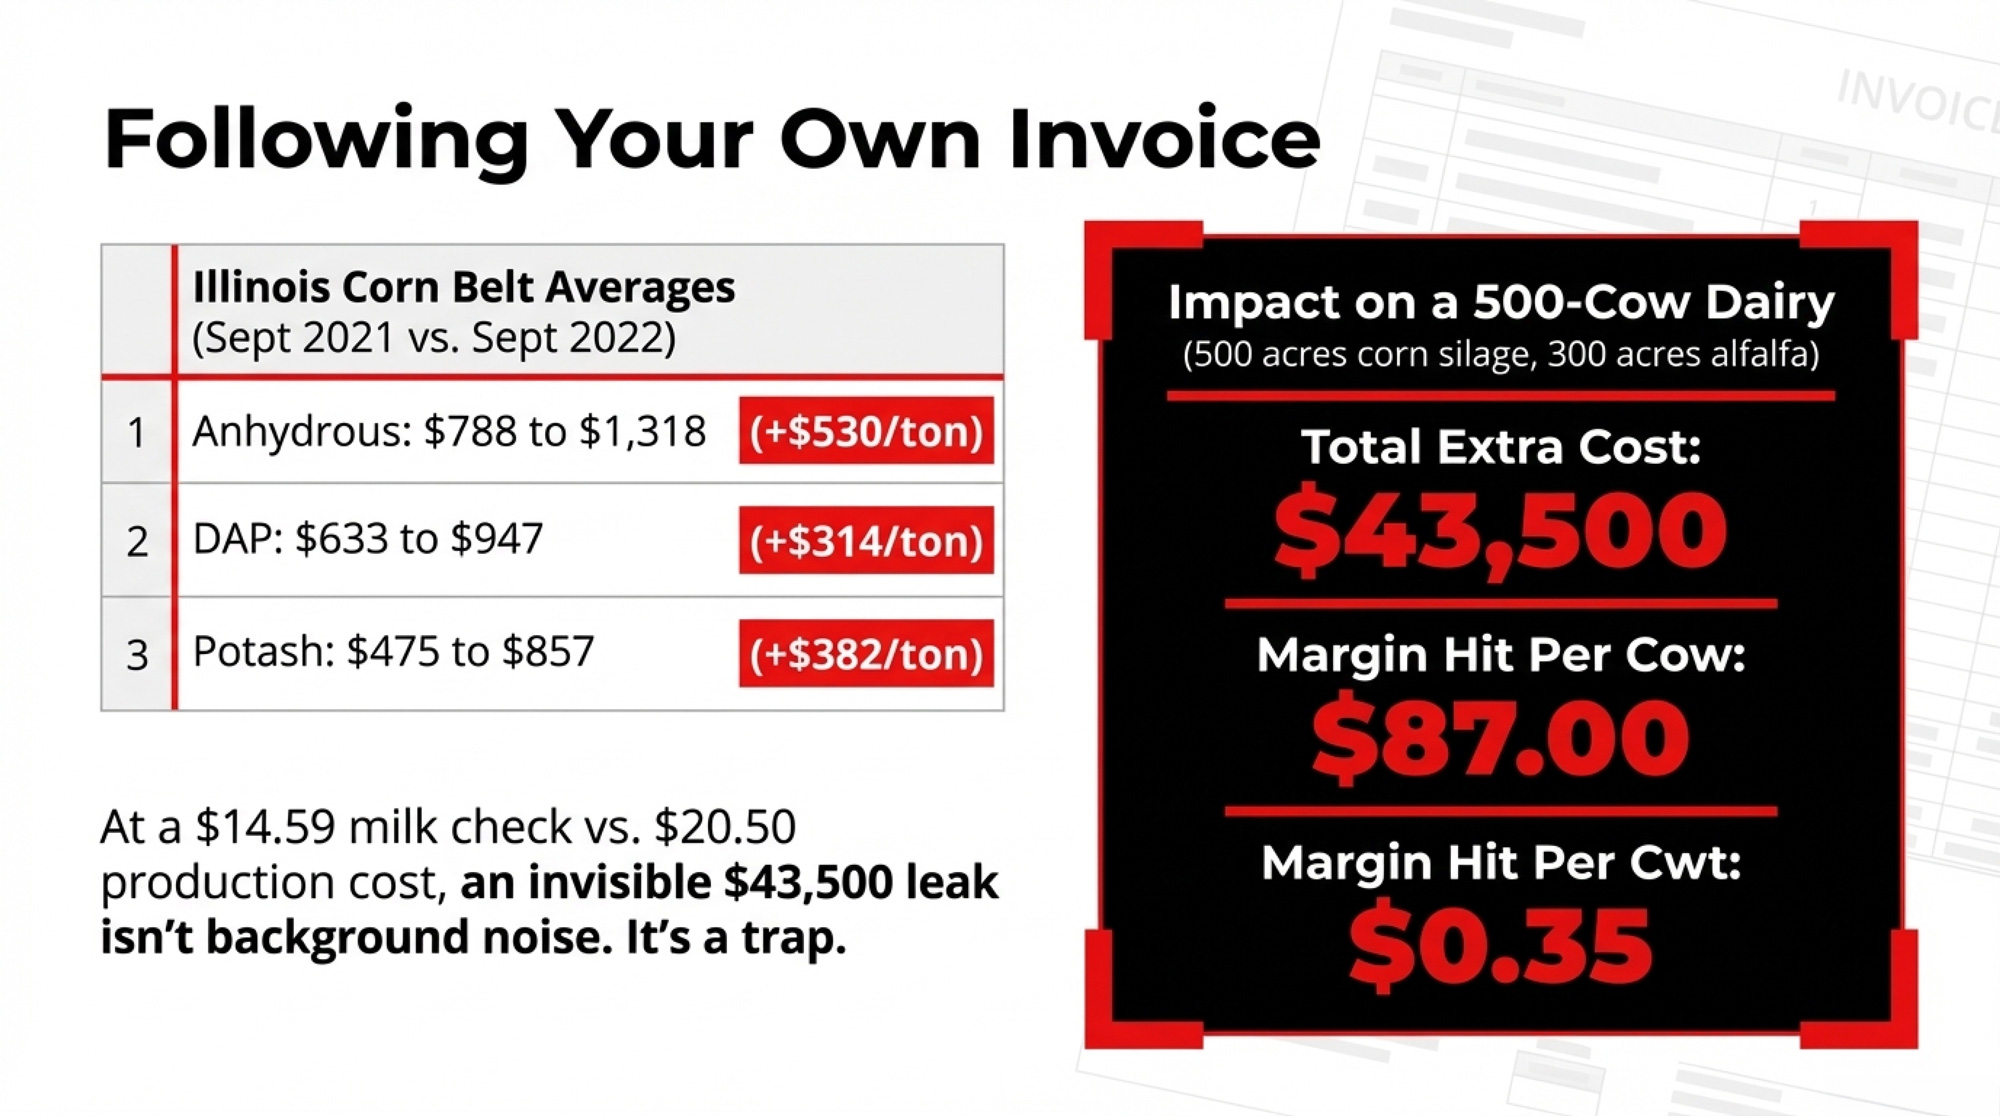
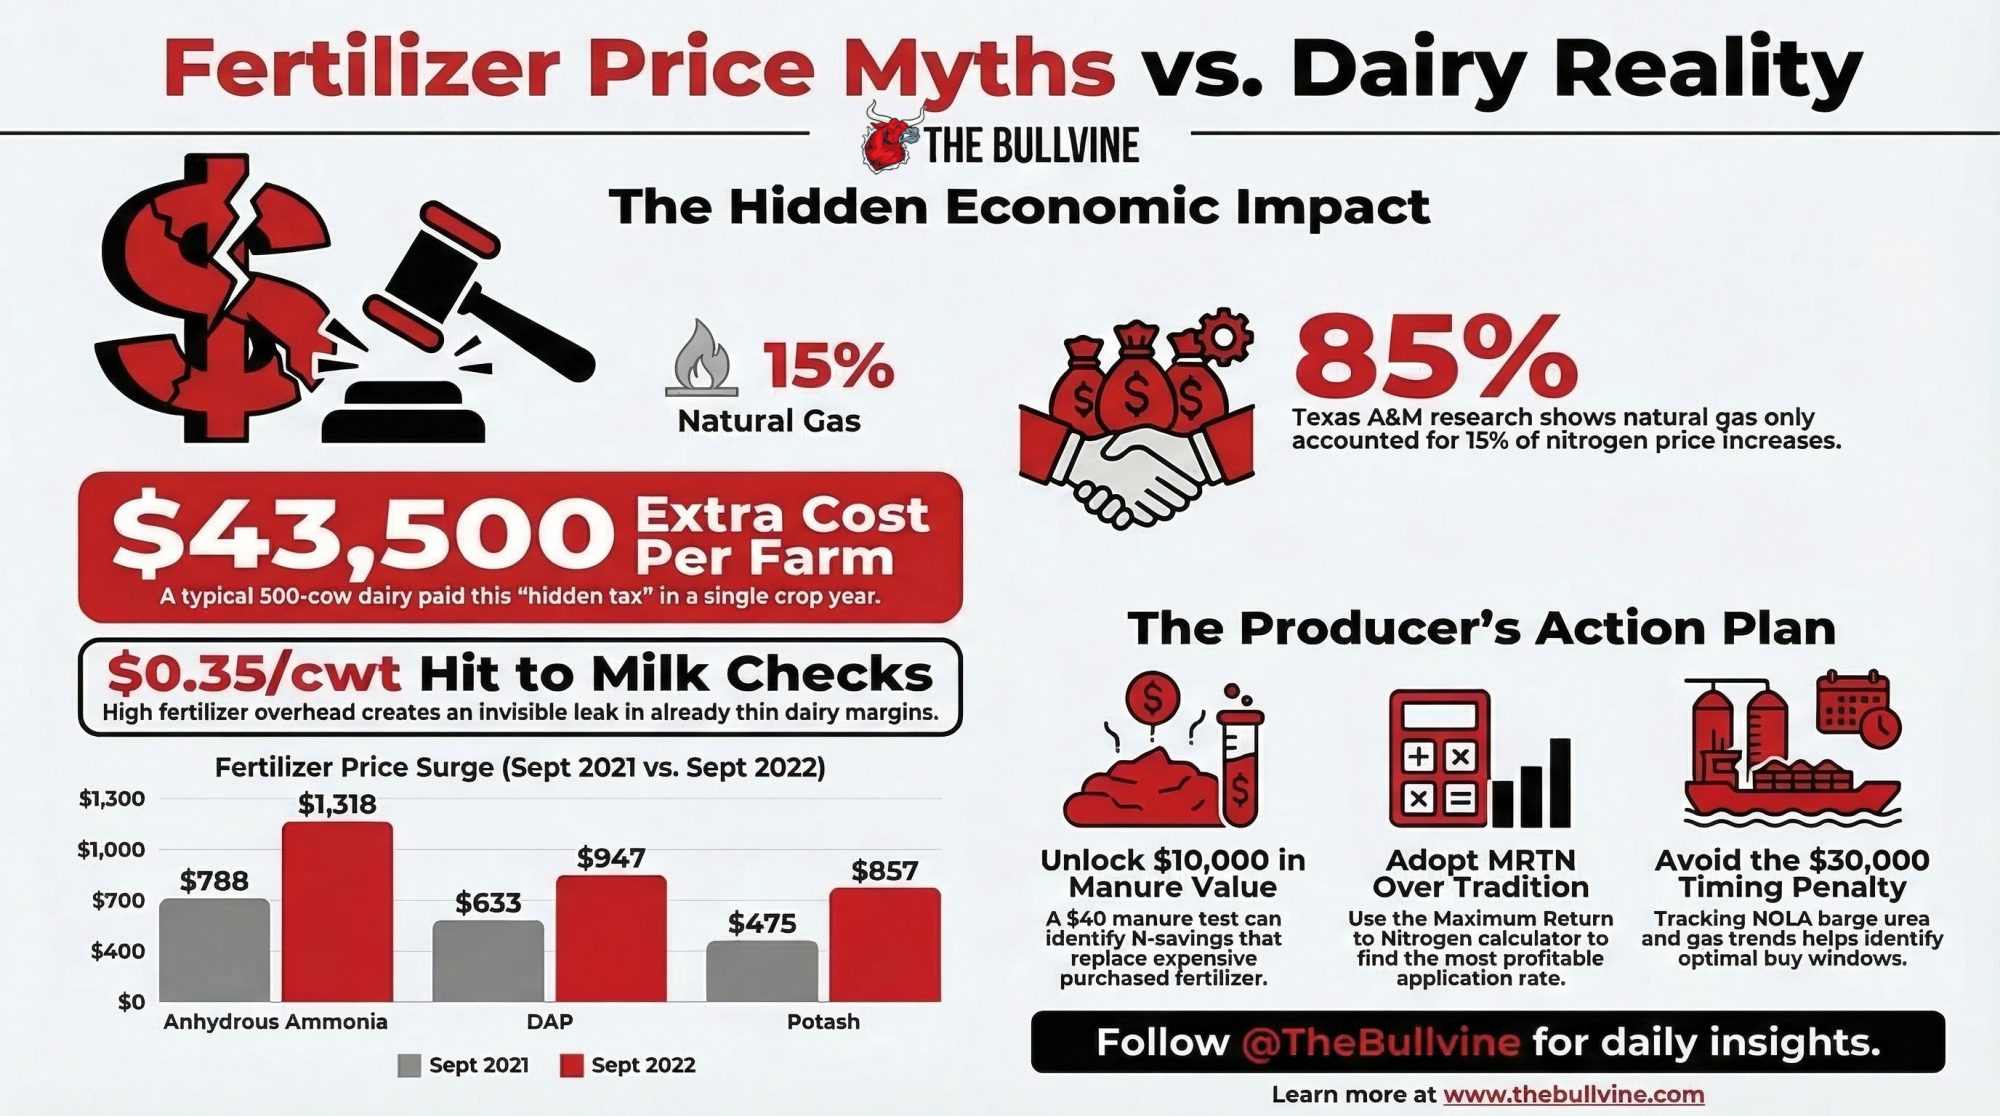
University of Illinois farmdoc economists Gary Schnitkey, Nick Paulson, and Carl Zulauf tracked what happened in real time. In September 2021, total fertilizer cost on Illinois corn ground averaged $175 per acre. Twelve months later, it was $247 per acre. That $72‑per‑acre jump, applied to a 500‑cow Midwest dairy running 500 acres of corn silage and 300 acres of alfalfa, works out to roughly $43,500 in extra fertilizer in a single crop year — before you talk about fuel, interest, or labor.
What the Companies Made — and What You Paid
Start with the scoreboard the fertilizer giants filed themselves.
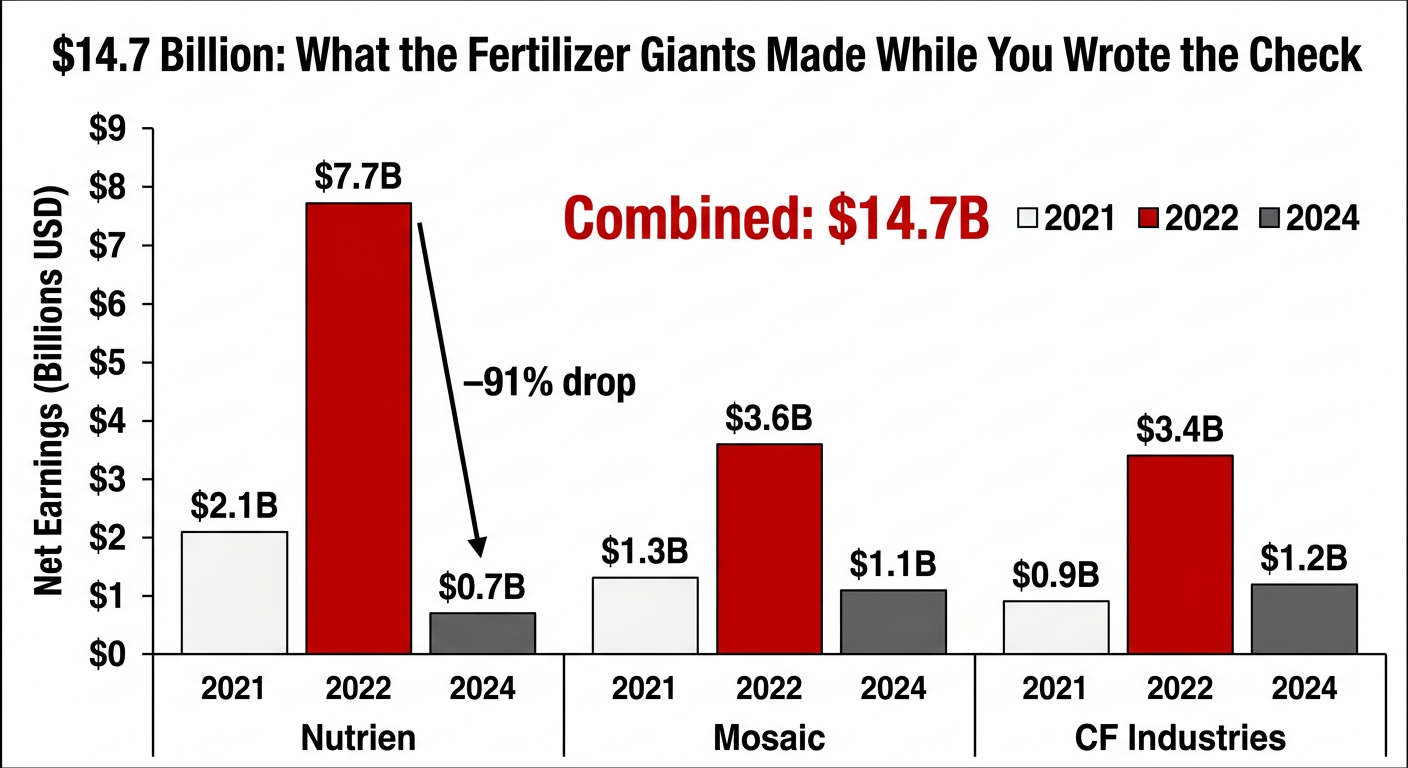
Nutrien reported $7.7 billion in net earnings in 2022. By 2024, full‑year net earnings had dropped to $700 million — still big, but less than a tenth of that peak. Mosaic booked $3.6 billion in 2022 net income, according to its year‑end SEC filing. CF Industries reported $3.35 billion in 2022 net earnings attributable to common stockholders, up from $917 million in 2021 on the same metric. Those are audited numbers, not allegations.
| Company | 2021 | 2022 | 2024 |
|---|---|---|---|
| Nutrien | $2.1 | $7.7 | $0.7 |
| Mosaic | $1.3 | $3.6 | $1.1 |
| CF Industries | $0.9 | $3.4 | $1.2 |
Now look at your side of the ledger. In Illinois — a good stand‑in for Corn Belt pricing — anhydrous ammonia averaged $788 per ton on September 23, 2021. By September 22, 2022, it was $1,318 per ton. Earlier that year, prices blew past $1,600 per ton through April before easing. The previous record, set during the 2008 commodity spike, was $1,161 per ton. That record was already history by October 2021.
Benton County, Iowa, farmer Lance Lillibridge put his own numbers on it in a Brownfield Ag News interview. “In January, I was buying anhydrous ammonia for $490 a ton,” he said, talking about 2021. “In February of this year, ammonia was $850 a ton. The price difference in corn is about 20 cents less right now than it was in 2021.” Same product. Same acres. A very different risk.
Lillibridge raises corn and Red Angus cattle near Vinton, not dairy cows, but his math is your math if you grow your own feed. “When we’re jacking up prices of fertilizer 77% on a product that’s actually in the states right now and in warehouses because of something that’s happened half a world away, that’s not right,” he told Brownfield. He’s saying out loud what a lot of people only muttered at the counter.
How Much of Your 2022 Fertilizer Bill Was “Market” — and How Much Was Margin?
You heard the explanation at the time: Russia, Ukraine, natural gas, logistics. All real. All ugly. But not the whole story.
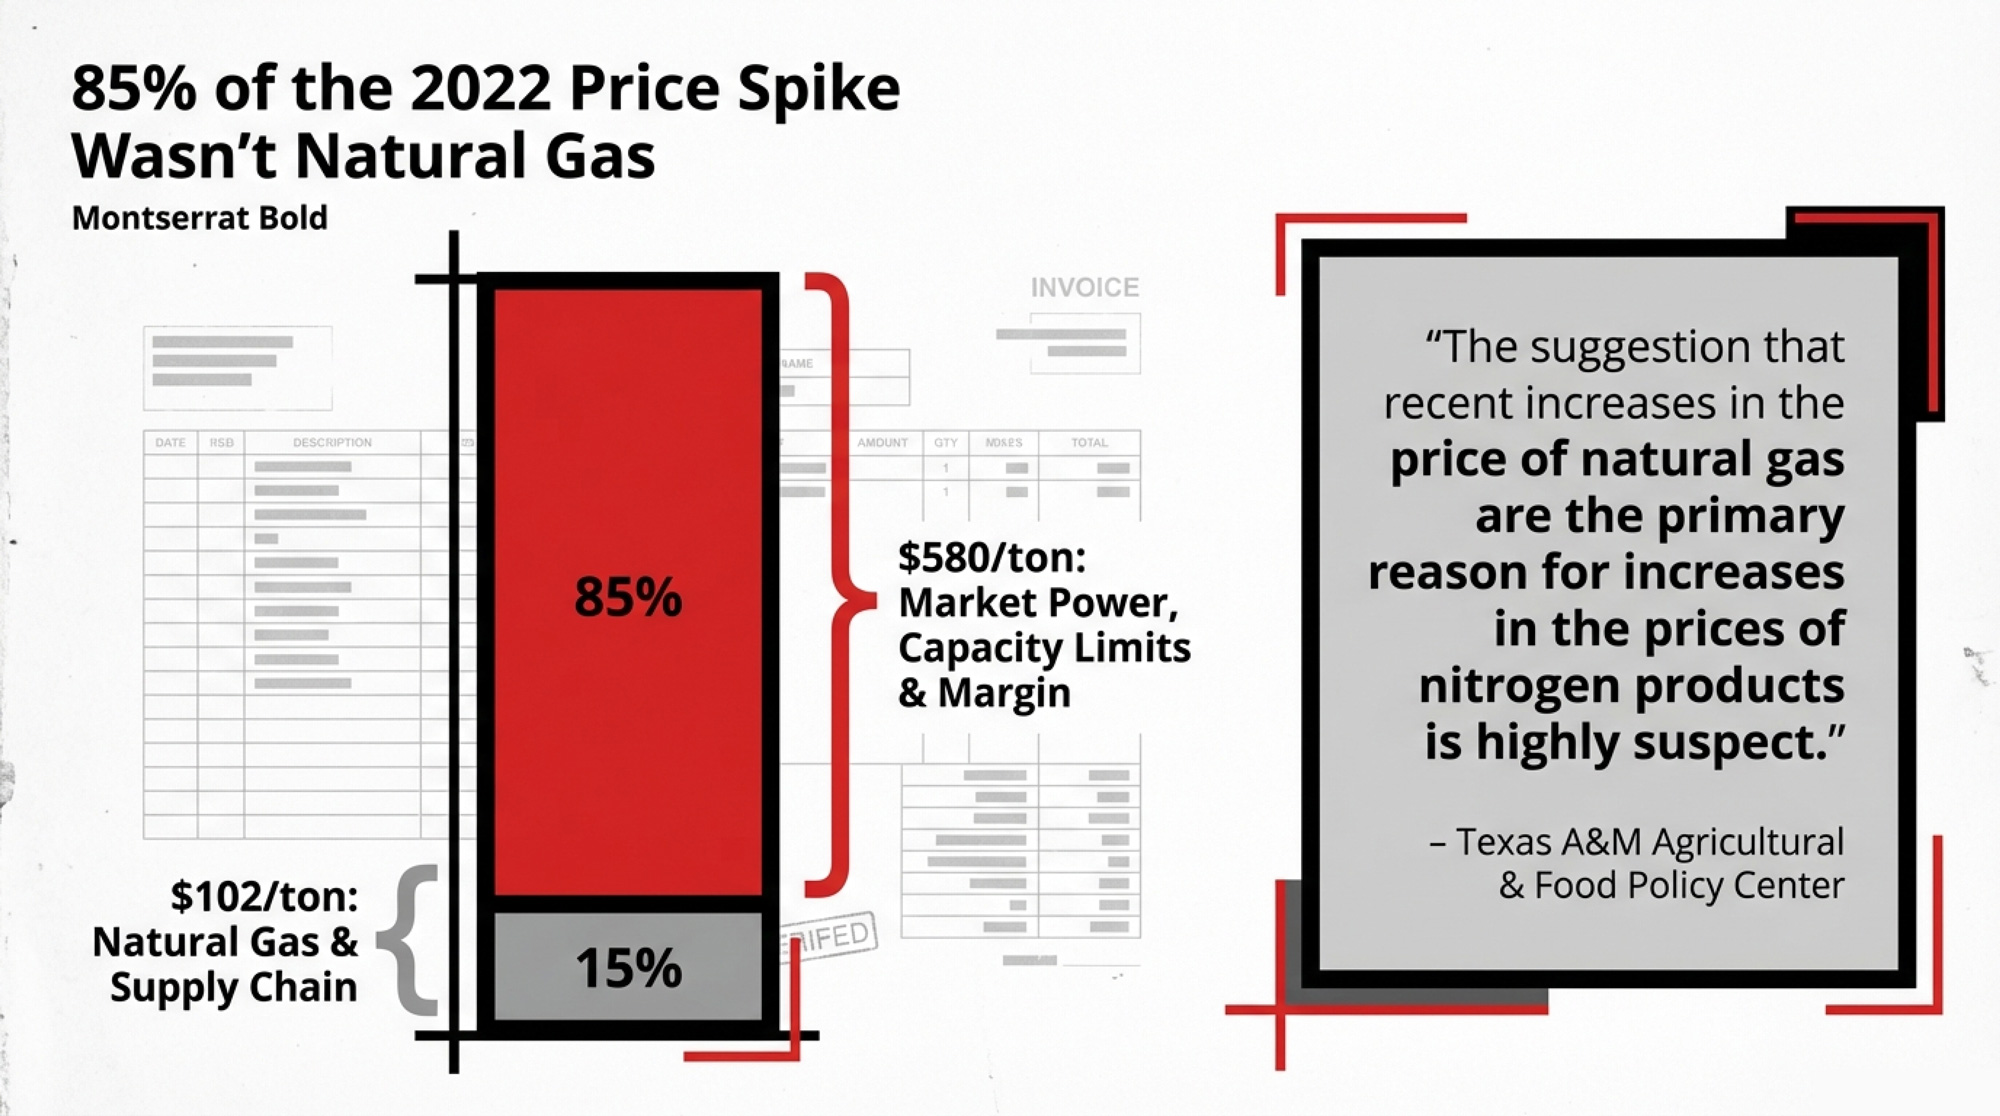
Texas A&M’s Agricultural and Food Policy Center (AFPC) took that story apart in a study commissioned by 21 state corn organizations. They tracked what portion of the anhydrous ammonia price spike from late 2020 through October 2021 could be pinned on its main input, natural gas. Their conclusion: natural gas accounted for only about 15% of the price increase.
| Month | Anhydrous Ammonia ($/ton) | Henry Hub Natural Gas ($/MMBtu) |
|---|---|---|
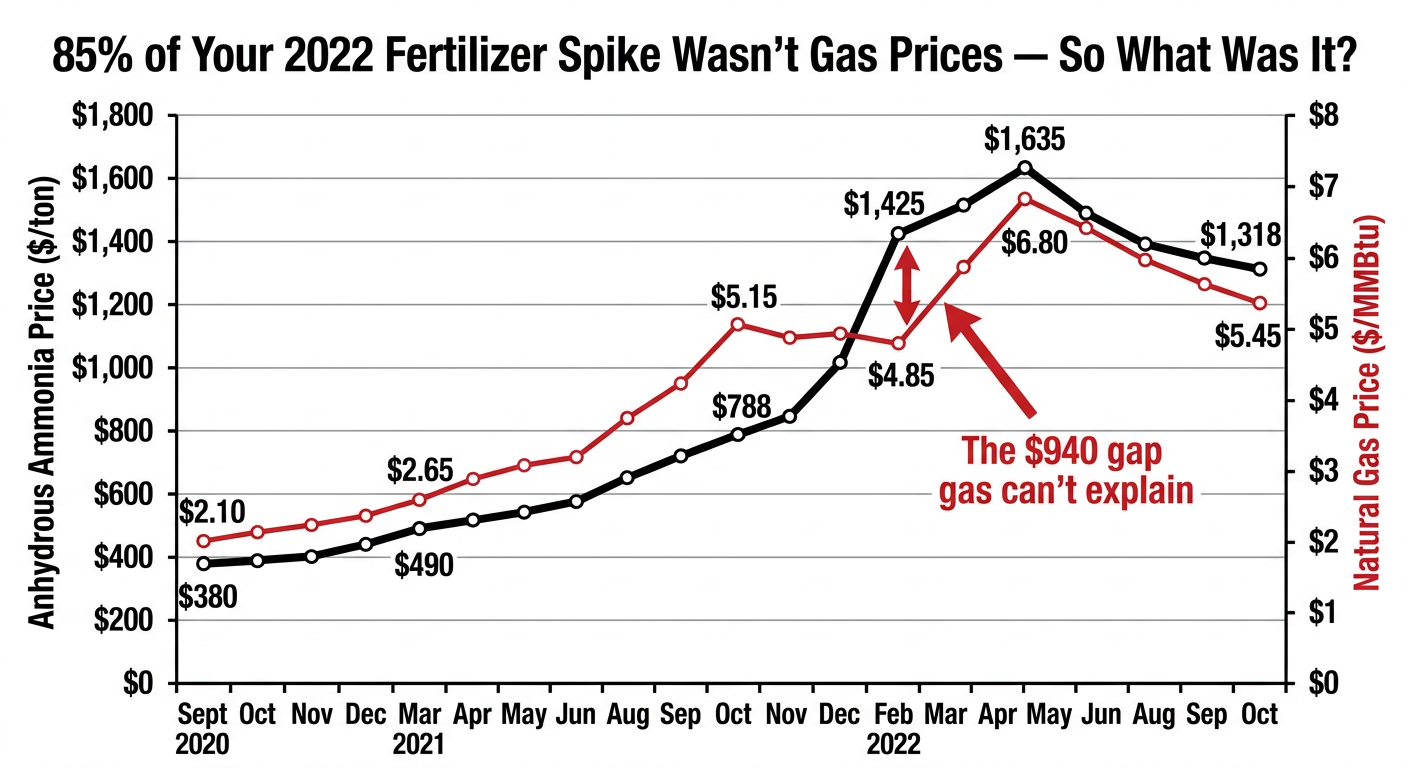
| Sep 2020 | $380 | $2.10 |
| Mar 2021 | $490 | $2.65 |
| Sep 2021 | $788 | $5.15 |
| Feb 2022 | $1,425 | $4.85 |
| Apr 2022 | $1,635 | $6.80 |
| Oct 2022 | $1,318 | $5.45 |
The total increase in anhydrous ammonia over that window was roughly $680–$688 per ton, depending on the exact date. Of that, only about $102 per ton traced back to higher natural gas costs. The remaining $580‑ish per ton — around 85% — reflected other factors: supply/demand shifts, capacity decisions, trade policies, and market power. “The suggestion that recent increases in the price of natural gas are the primary reason for increases in the prices of nitrogen products is highly suspect,” the AFPC report stated.
AFPC’s model farms saw nitrogen costs increase by $52.07 per acre. That’s not a Twitter hot take; it’s a land‑grant economist with a spreadsheet. And AFPC never said that 85% of the increase was collusion. They said natural gas explains only a small slice. In a market where a handful of firms dominate production, that disconnect is part of why farmers like the owners of Fire Creek Farms are now asking a federal judge to look harder at pricing behavior.
The Barn Math: Follow Your Own Invoice
Let’s walk through the numbers so you can run them on your own acres.
Assumptions (from farmdoc daily, September 2022):
- 500 acres of corn silage at 220 bu/acre yield potential
- 170 lbs of N per acre from anhydrous ammonia (MRTN rate)
- DAP and potash are applied at maintenance rates
- 300 acres of alfalfa receiving P‑K applications
Illinois AMS fertilizer prices:
| Input | Sept 2021 Price | Sept 2022 Price | Change |
| Anhydrous ammonia | $788/ton | $1,318/ton | +$530/ton |
| DAP | $633/ton | $947/ton | +$314/ton |
| Potash | $475/ton | $857/ton | +$382/ton |
| Corn fert/acre | $175/acre | $247/acre | +$72/acre |
On your 500‑acre corn base, that $72/acre increase is $36,000. On 300 acres of alfalfa, a reasonable maintenance P‑K program under those price swings adds roughly $4,000–$7,500, depending on soil tests and removal.
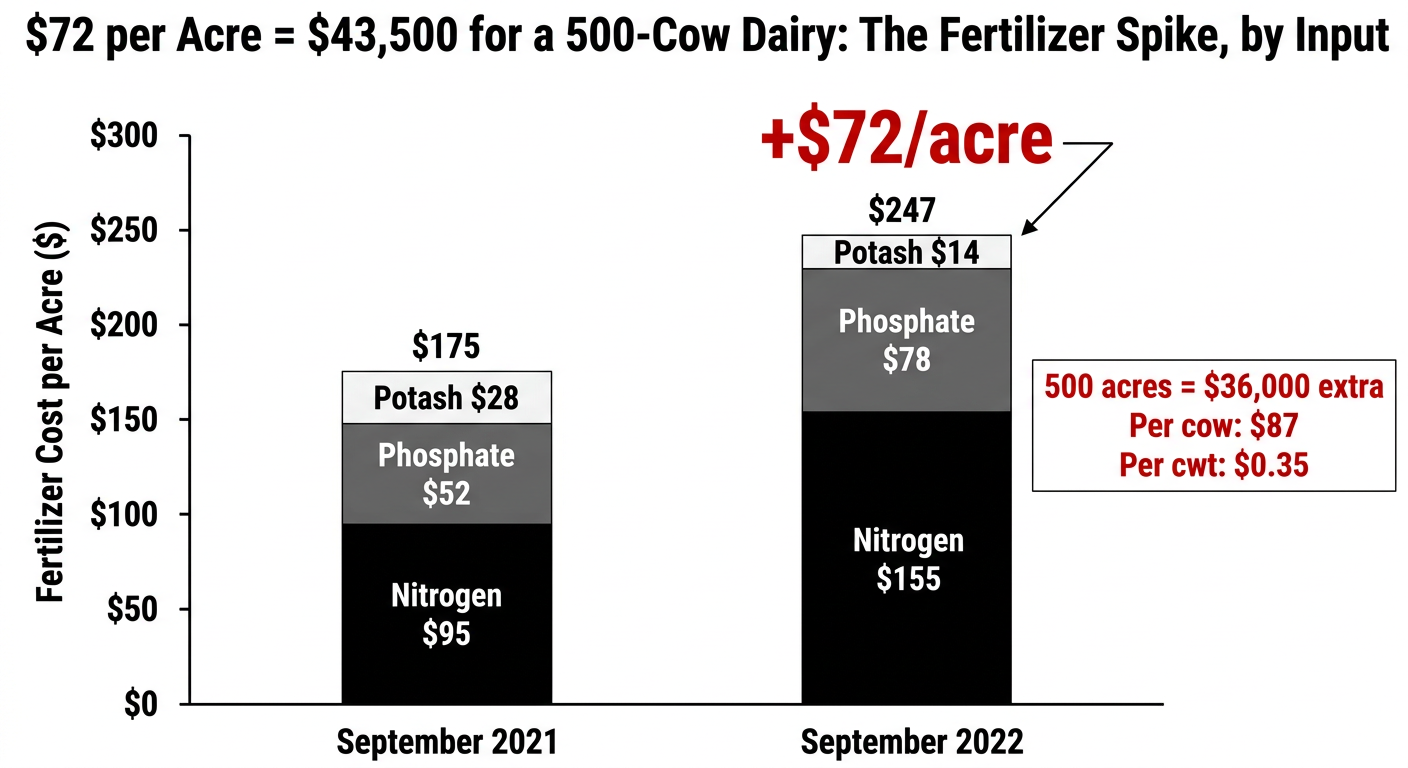
| Component | Sept 2021 ($/acre) | Sept 2022 ($/acre) |
|---|---|---|
| Nitrogen (anhydrous) | $95 | $155 |
| Phosphate (DAP) | $52 | $78 |
| Potash | $28 | $14 |
| Total | $175 | $247 |
Total: $40,000–$43,500 in extra fertilizer spend.
Break it down per cow and per cwt for a 500‑cow herd:
- 500 cows shipping roughly 68 lbs/day each will ship about 12.5 million lbs per year — that’s 125,000 cwt.
- $40,000 ÷ 500 cows = $80/cow; $43,500 ÷ 500 cows = $87/cow.
- $40,000 ÷ 125,000 cwt = $0.32/cwt; $43,500 ÷ 125,000 = $0.35/cwt.
At $0.35/cwt in additional costs, a cow producing 25,000 lbs/year is costing you $87.50 more just in fertilizer overhead — before she even hits the parlor.
Swap in your own acres, rates, and invoices, and you’ll get your number. A thirty‑five‑cent hit doesn’t sound like much until you lay it over a year where your margin is already thin. When your milk check is at $14.59, and your cost of production is over $20.50, an invisible $40,000 leak isn’t background noise. It’s a trap.
Who Really Controls Your Fertility Budget?
You’ve heard pieces of this before. When you see it all in one place, it hits different.
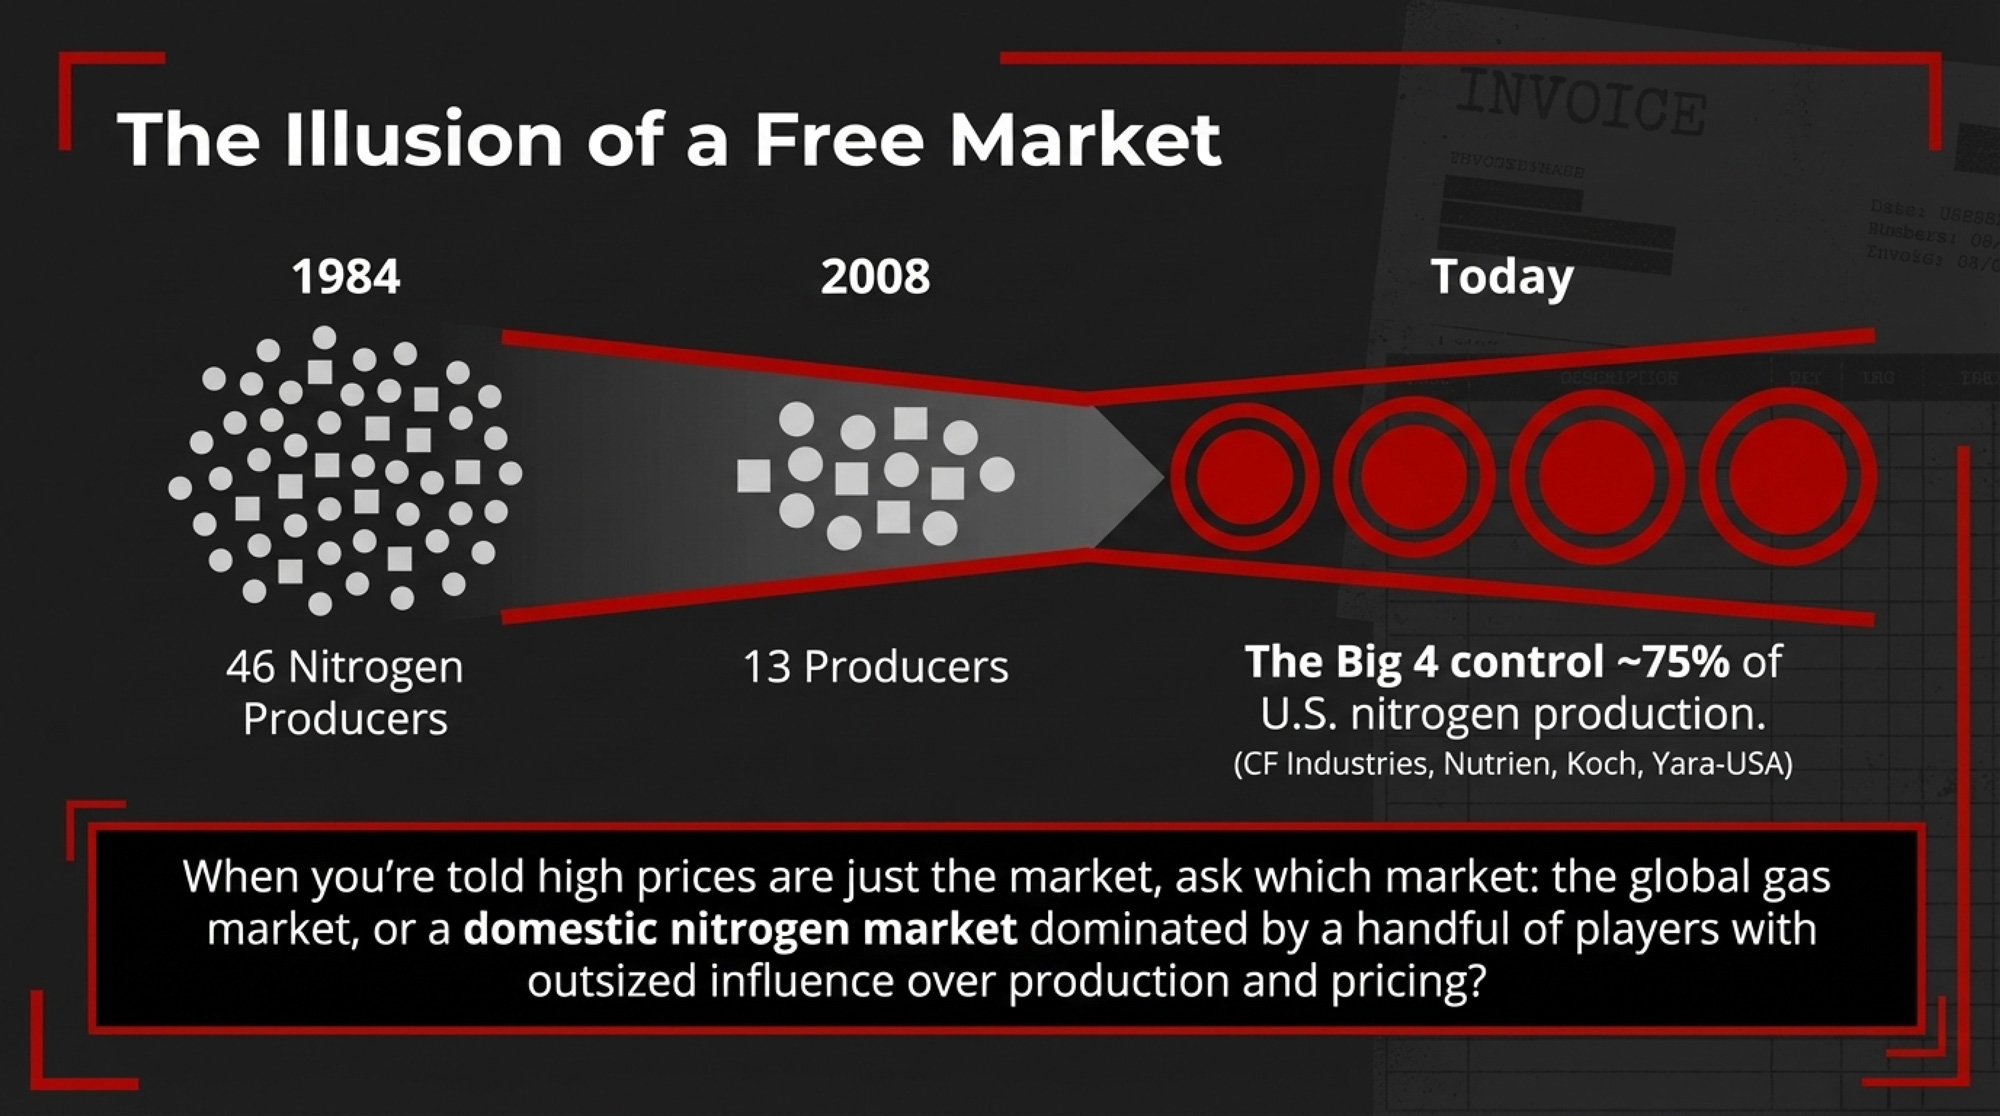
Between 1984 and 2008, the number of nitrogen‑producing firms in the U.S. fell from 46 to 13 — a 72% reduction. Over the same period, the count of active ammonia plants dropped from 59 to 22. By 2018, the four largest producers controlled about 75% of total U.S. ammonia output.
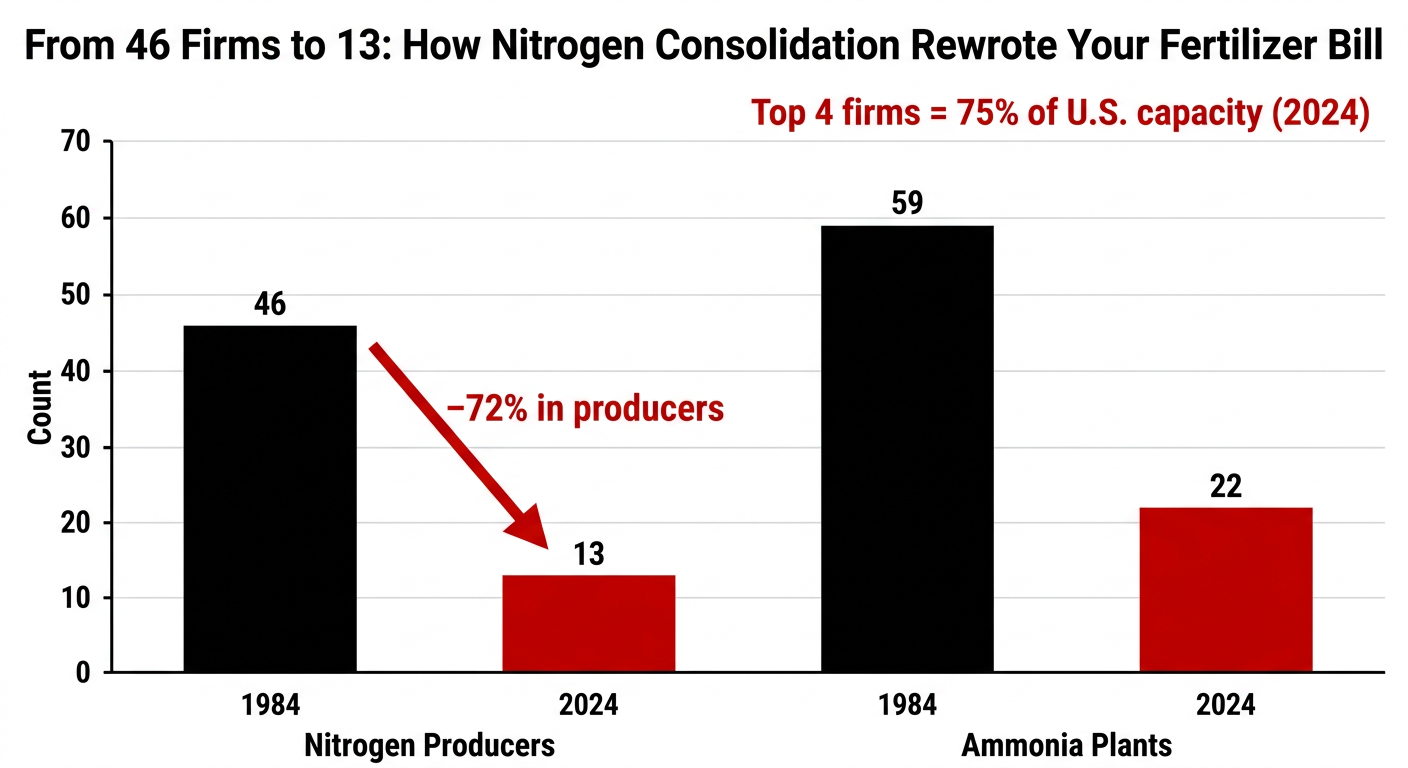
| Metric | 1984 | 2024 |
|---|---|---|
| Number of nitrogen-producing firms | 46 | 13 |
| Active ammonia plants | 59 | 22 |
CF Industries alone held 38.8% of domestic anhydrous ammonia capacity and 50.2% of UAN capacity in 2021, according to comments the American Soybean Association filed to USDA’s “Access to Fertilizer” docket. AFPC’s 2024 update put CF, Nutrien, Koch, and Yara‑USA at roughly three‑quarters of U.S. nitrogen production between them.
In potash, North American capacity is dominated by a couple of players, with Canada’s Canpotex consortium coordinating offshore sales by agreement. Mosaic petitioned for anti‑dumping duties on phosphate imports in 2020. CF filed petitions that led to preliminary anti‑dumping margins of up to 127.19% on Russian UAN and 63.08% on Trinidadian UAN in early 2022. Those cases were brought under U.S. law and upheld by trade authorities at the time.
Every one of those moves was legal. Taken together, USDA and AFPC analysts say they’ve contributed to a more concentrated market and less competitive pressure on the domestic prices farmers face. So when someone tells you your 2022 fertilizer bill was “just the market,” it’s fair to ask which market they mean — the global gas market, or a domestic nitrogen market where a small number of firms have outsized influence over how much ammonia gets produced and the price range it trades in.
If DOJ Wins, Do You Ever See a Check?
Short version: probably not in time to help your 2027 plan, and maybe not at all.
The best precedent is the potash price‑fixing litigation that’s been grinding through the same federal court in Chicago since 2008. Mosaic and Potash Corporation of Saskatchewan each paid $43.75 million, with Agrium adding $10 million, for a total of roughly $97.5 million. Russian and Belarusian producers contributed another $12.5 million. Between 3,000 and 5,000 potash buyers made up the class, mostly wholesalers and direct buyers.
Farmers who bought potash through co‑ops or retailers were “indirect purchasers.” Some recovered through separate state‑level settlements, but not much, and it took years.
And there’s another catch. Criminal antitrust fines go to the U.S. Treasury, not to you. Any direct farmer payout would come through the civil case. Antitrust damage claims typically carry a four‑year statute of limitations under Section 4B of the Clayton Act. The clock usually starts when the overcharge happens, though courts can extend it under the discovery rule or the “continuing violation” doctrine.
A lot of your biggest fertilizer checks for 2022 were written in the spring of that year. Four years from spring 2022 is spring 2026. That’s right now.
If you think your operation took an unusually large hit, talk to a U.S. lawyer who understands antitrust and class actions instead of assuming someone else’s case automatically covers you. The Stevens lawsuit and any DOJ or USDA actions are about alleged past behavior. They don’t fix your next fertilizer bill.
Here’s the turn nobody in the DOJ coverage is giving you: regardless of what any court decides, you’ve still got levers to pull on your own operation. The collusion question is interesting. But the nitrogen sitting in your manure pit right now is actionable.
Are You Getting Paid for the Nitrogen Already in Your Pit?
A 500‑cow dairy throwing off 2.5 to 3 million gallons of liquid manure a year is already sitting on a big chunk of its own nitrogen. Typical dairy slurry runs 25–35 lbs of total N per 1,000 gallons, with 40–60% of that plant‑available in year one. Spread across your corn ground, that’s roughly 50–100 lbs of plant‑available N per acre, with most herds falling in the 60–90 range.
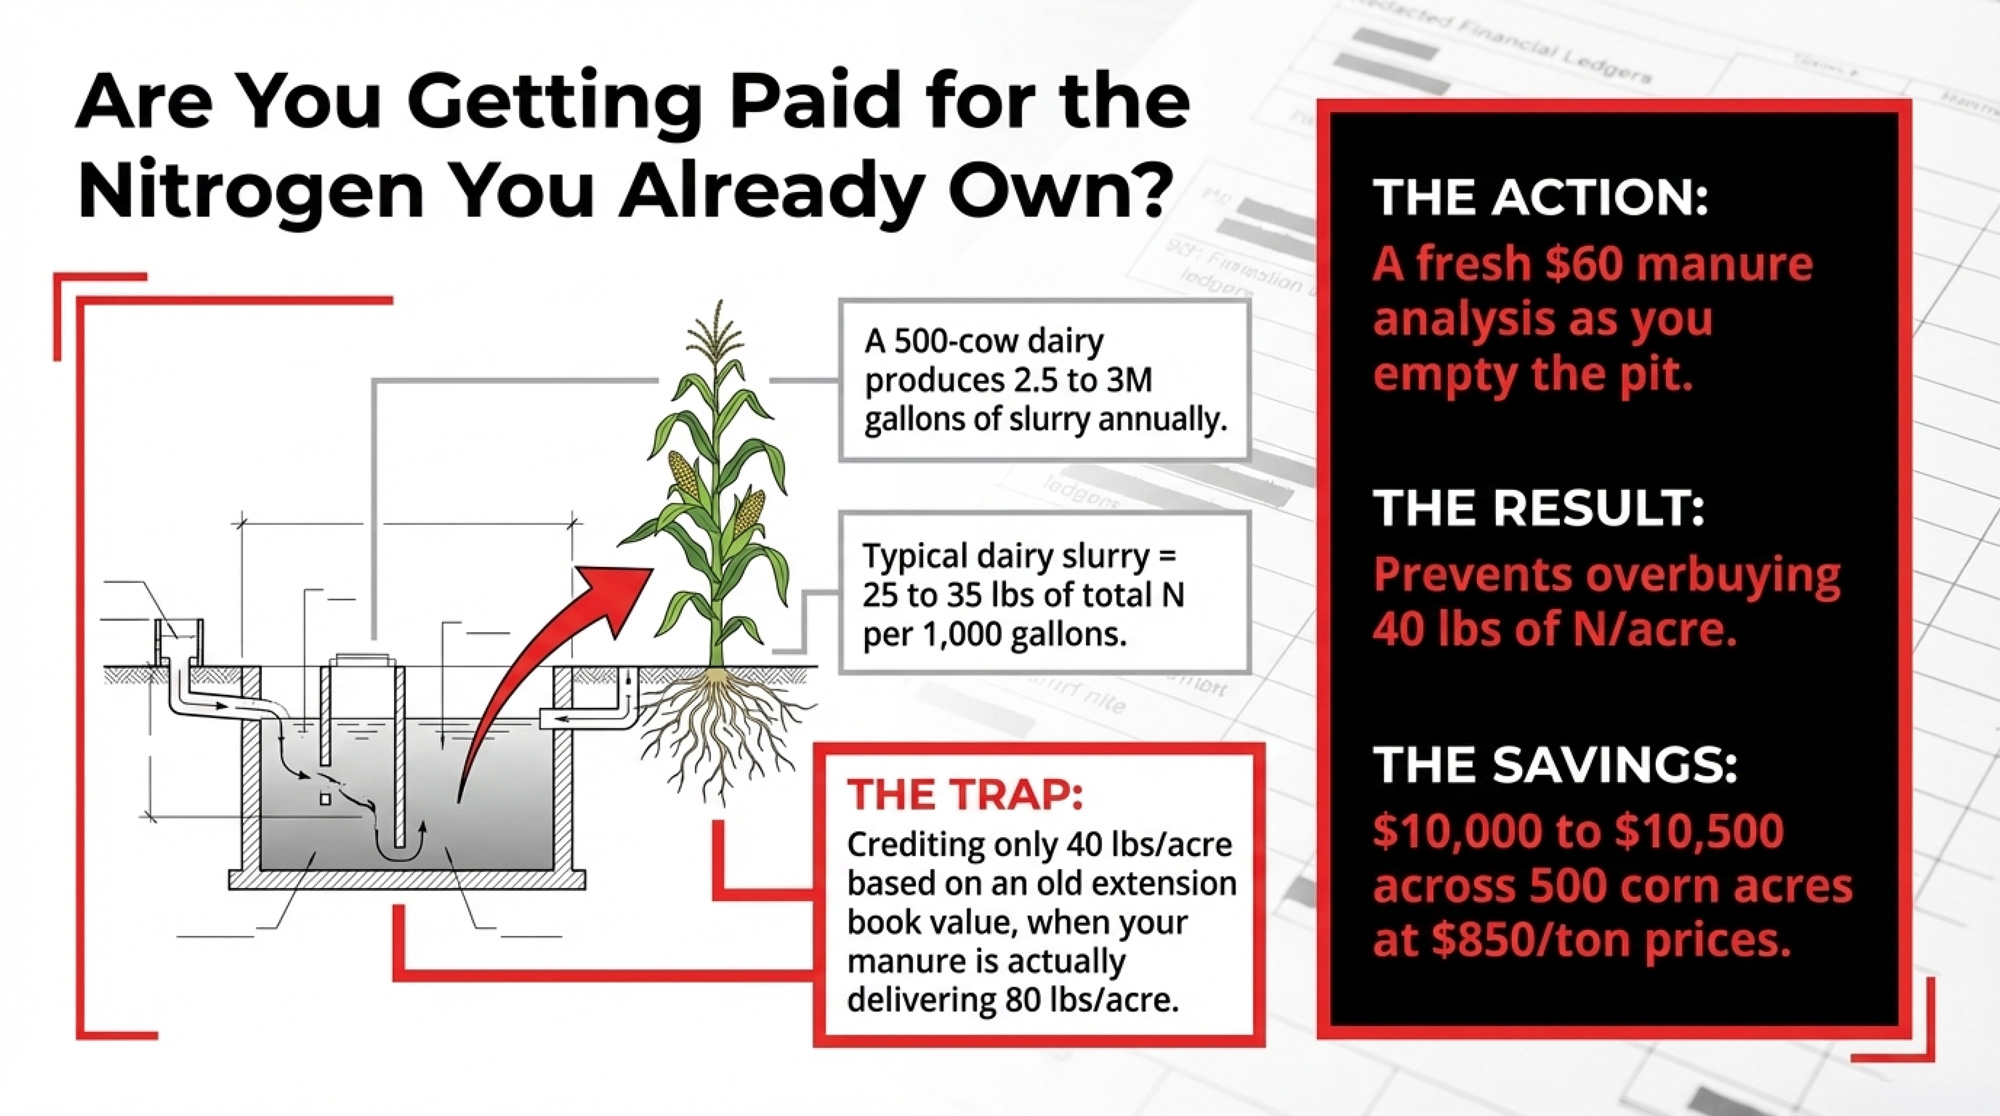
If you’re only crediting 40 lbs of N per acre for manure in your plan — off a book value from an old extension table — and your manure is actually delivering 80, you’re buying about 40 lbs of nitrogen per acre that you don’t need. At 82% N in anhydrous, that’s about 49 lbs of product per acre, or 0.024 tons. At $850/ton — roughly where Lillibridge saw prices in early 2026 — that’s $20–$21 per acre, or $10,000–$10,500 across 500 corn acres.
That’s just from bad crediting. No collusion required.
A fresh manure analysis runs $40–$60 and takes a few days. You pull a composite sample as you empty the pit, ship it to a lab, and suddenly you have real numbers to argue with — not “what the last nutritionist typed in.” We’ve already profiled farms that turned those numbers into serious savings. And if you want to see how changing timing and application method moves the nitrogen recovery needle, that’s already in the archive, too.
| Manure Management Scenario | Plant-Available N (lbs/acre) | Purchased N Needed (lbs/acre) | Fertilizer Value per Acre (at $850/ton anhydrous) | 500-Acre Savings (Annual) |
|---|---|---|---|---|
| Broadcast, no test (old plan) | 40 | 130 | — (baseline) | — |
| Broadcast, with current test | 80 | 90 | $20.80 | $10,400 |
| Injection, with current test | 120 | 50 | $41.60 | $20,800 |
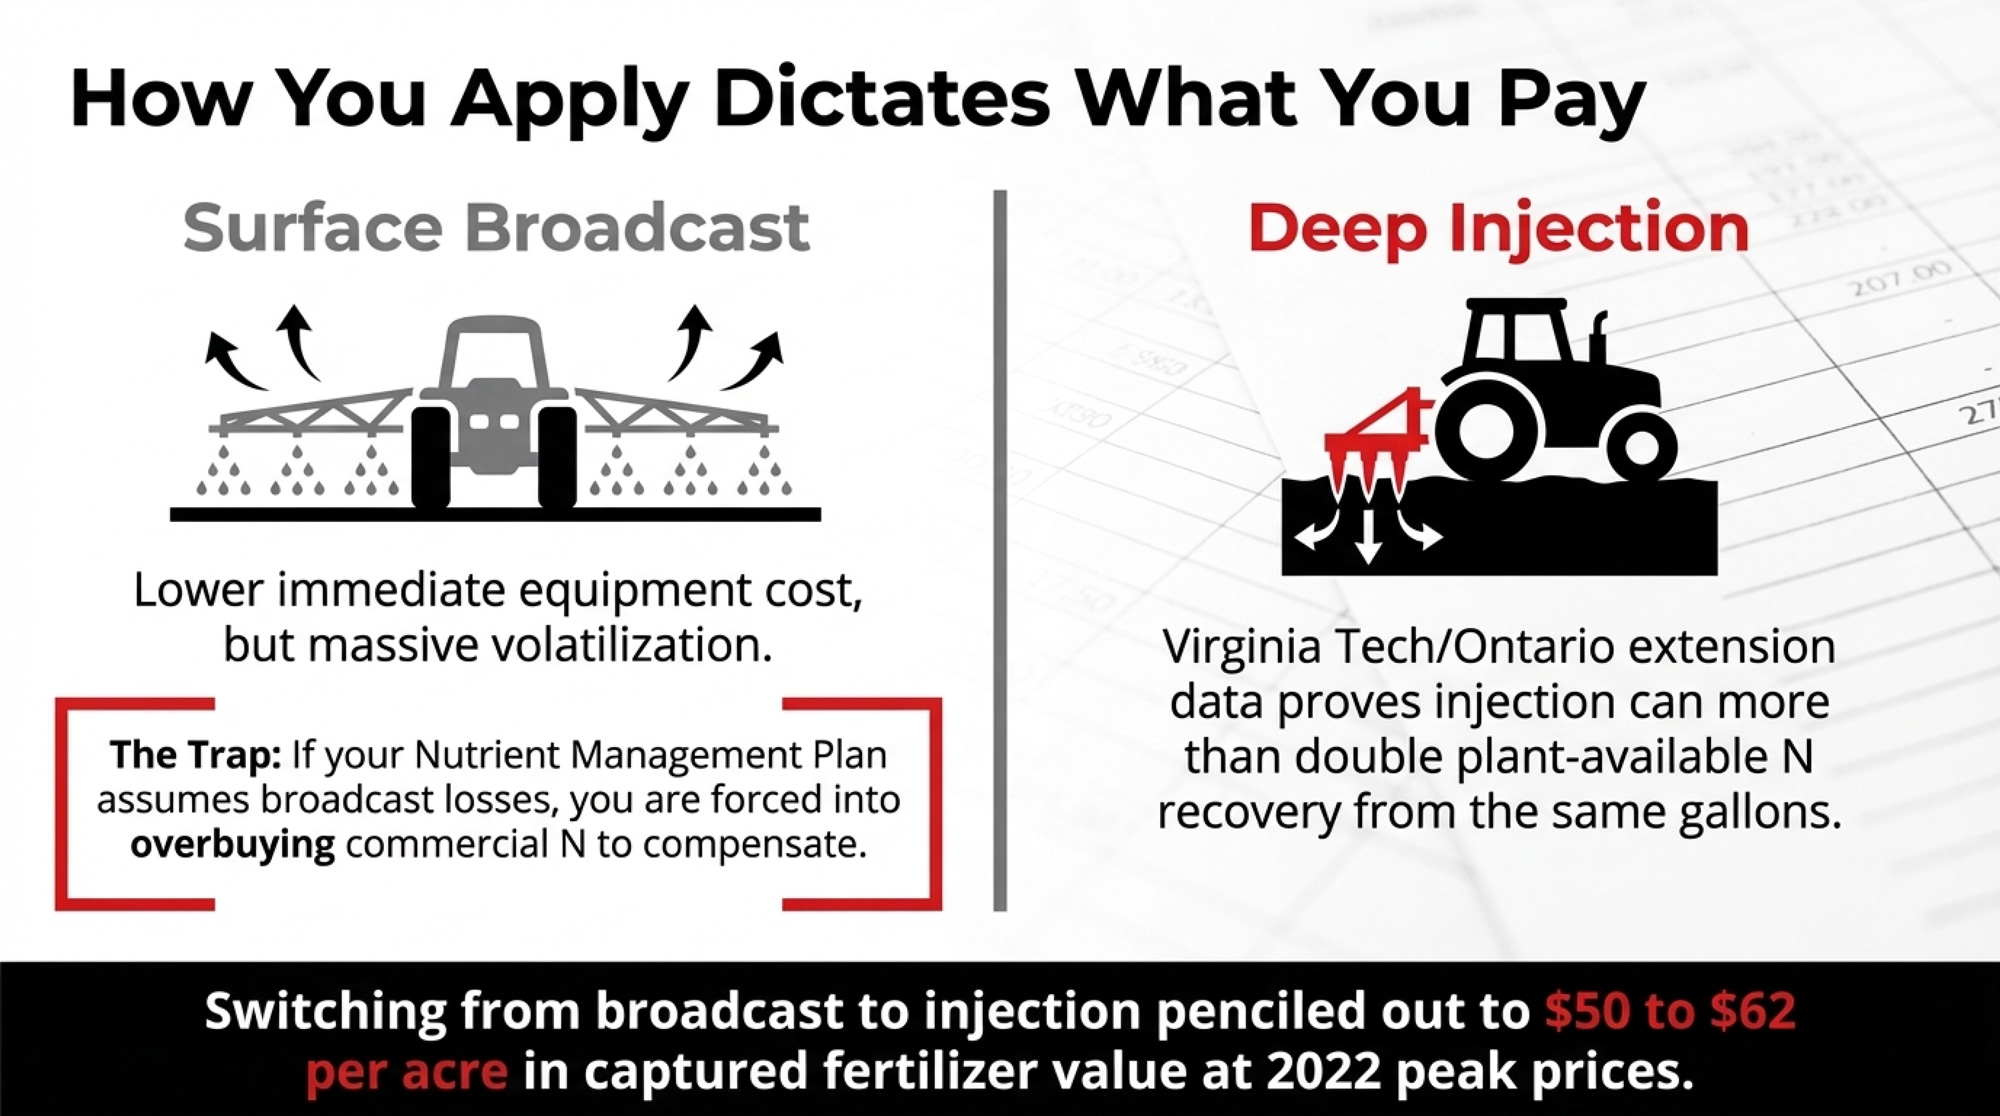
Extension work from Virginia Tech and Ontario shows that injection can more than double plant‑available nitrogen recovery compared to splash‑plate or surface broadcast on the same gallons. At the 2022 peak nitrogen prices, that extra recovery pencils out to roughly $50–$62 per acre in fertilizer value on every field where you switch from broadcasting to injection.
The key is that your Nutrient Management Plan has to catch up. If you’re injecting but your plan still assumes broadcast losses, you’re leaving money on the table twice — overbuying fertilizer and under‑documenting your stewardship.
30‑day action: Before you plant another acre, pull a current manure sample and send it to a lab. Bring the results and your last two years of fertilizer invoices to your agronomist. Ask one question: “If we assume injection on my closest corn fields and use these lab numbers, how many pounds of purchased N can we cut — and on which fields?”
What Can You Actually Change in Your Nutrient Plan Before the 2027 Crop Year?
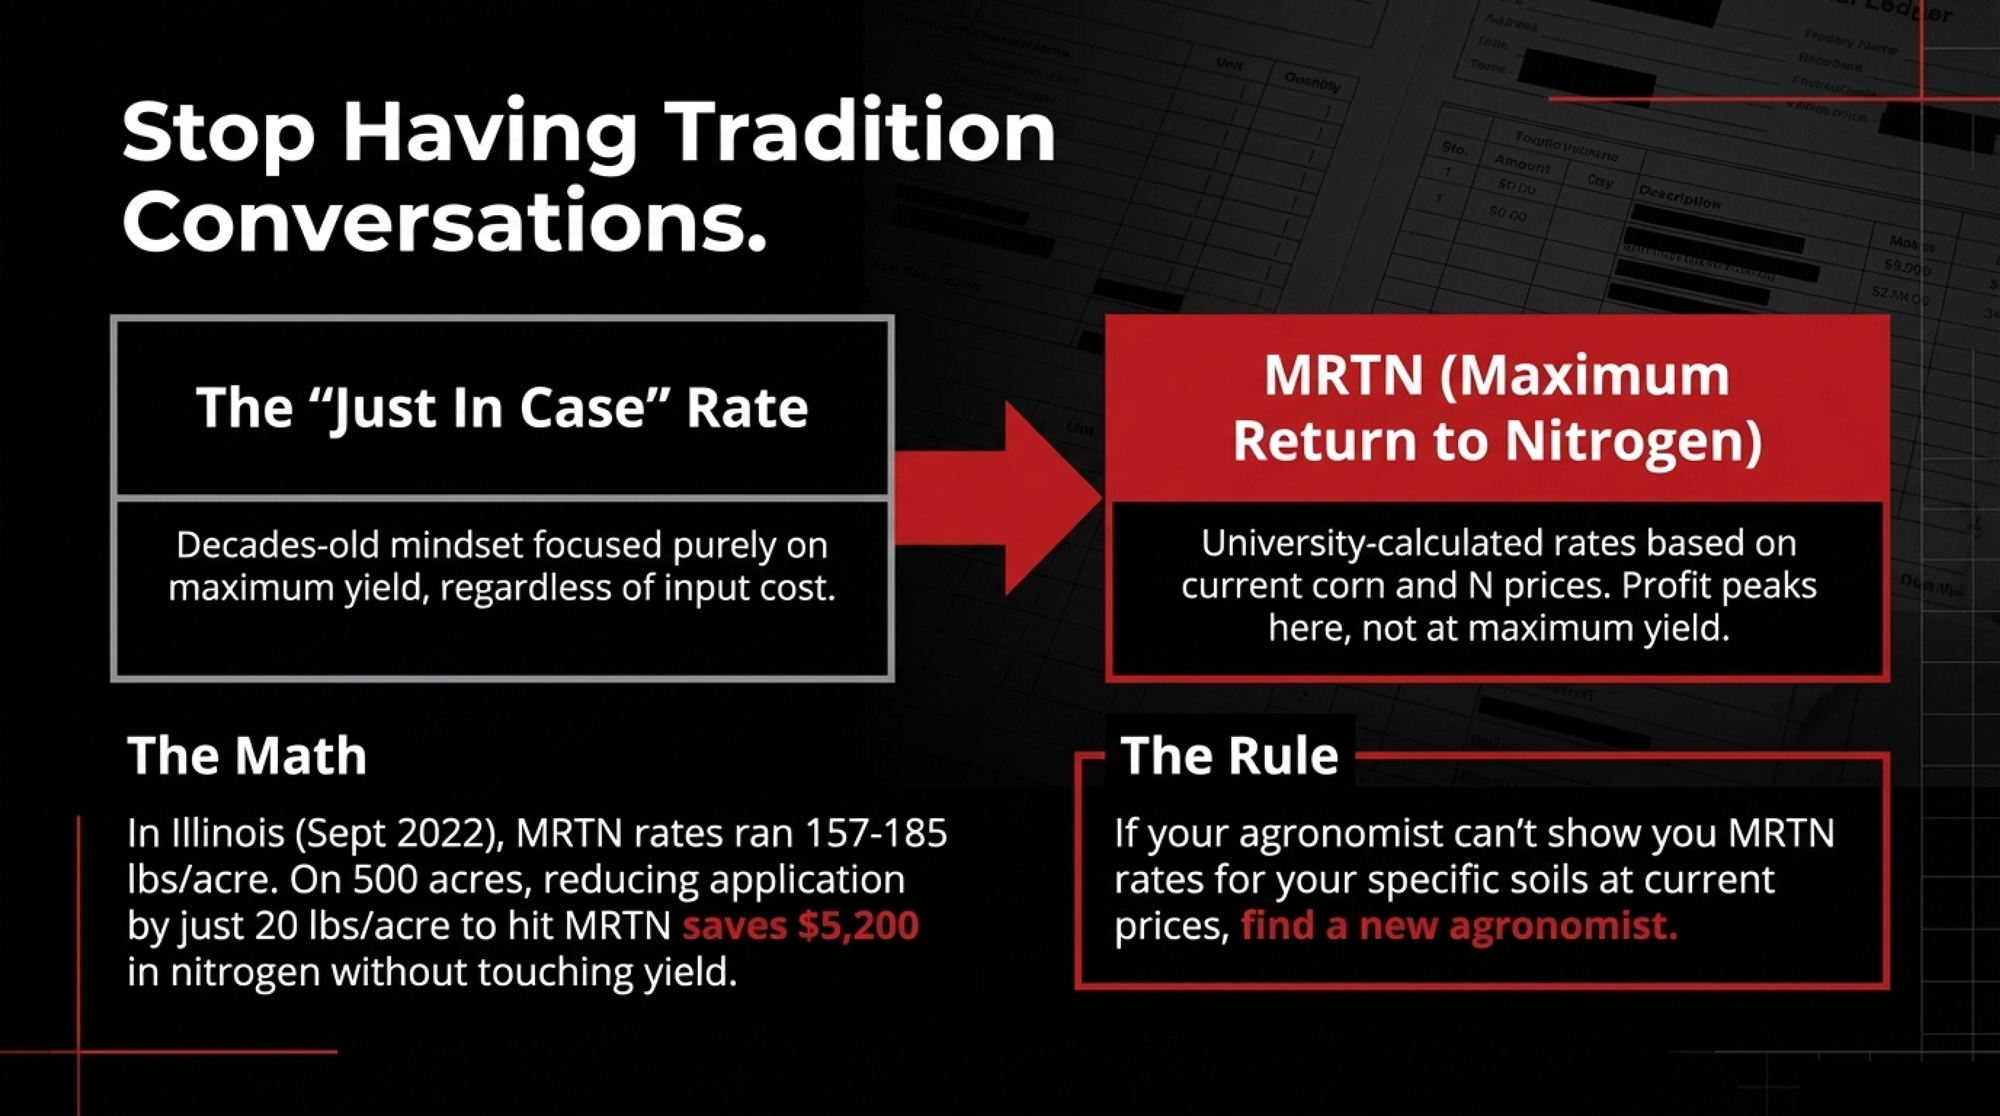
The Corn Nitrogen Rate Calculator that Schnitkey and his team helped build gives you a Maximum Return to Nitrogen (MRTN) rate for your soil region, at today’s corn and N prices. At a $5.50 corn price and $1,318 per ton anhydrous, the September 2022 Illinois conditions — MRTN rates ran from 157 lbs of N/acre in northern Illinois to 185 lbs in the south.
Farmdoc’s Precision Conservation Management data shows profit peaks right at those MRTN rates — not at the higher “just in case” rates a lot of us grew up with. Profits actually improve when you cut back to the university recommendation at current prices. On 500 acres at $850/ton ammonia, a 20‑lb/acre reduction saves roughly $5,200 in N without touching yield.
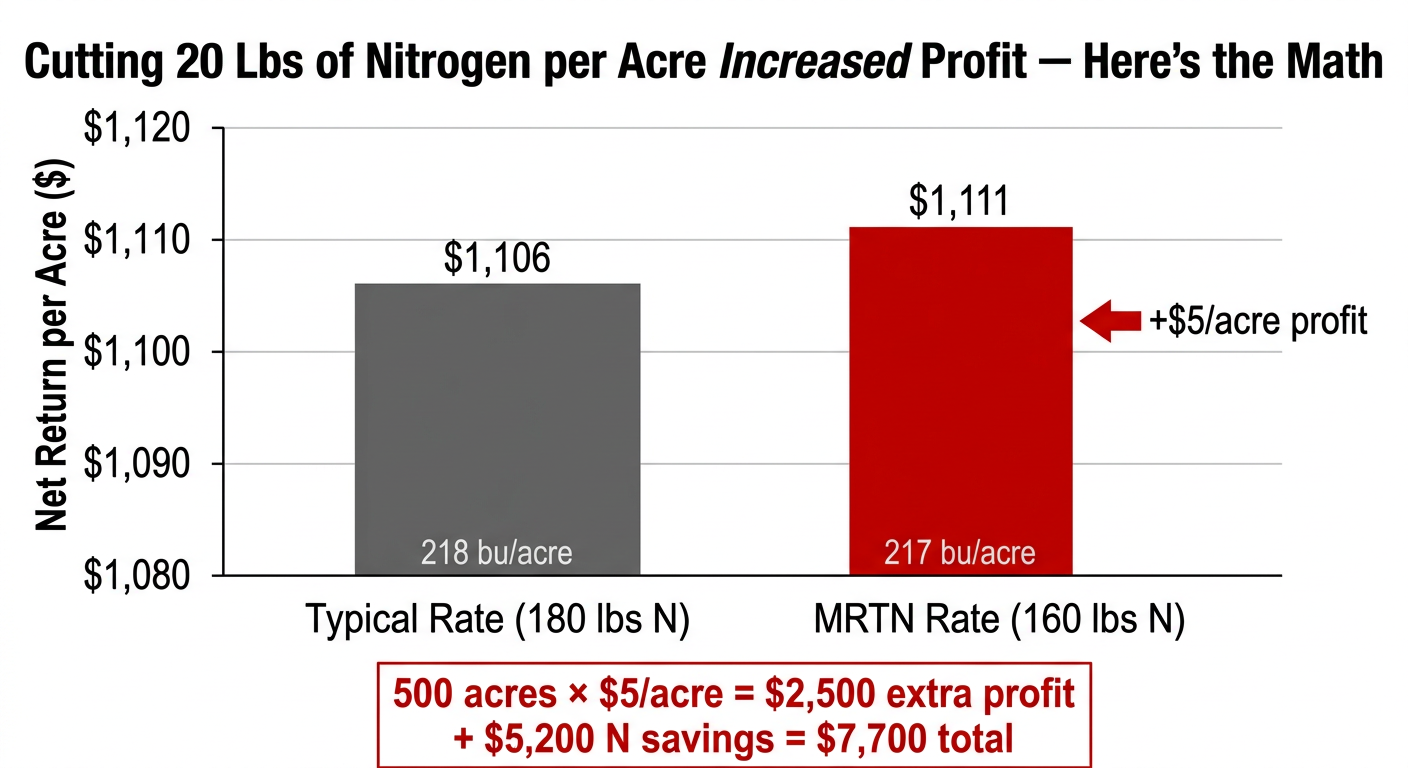
| Nitrogen Rate (lbs/acre) | Yield (bu/acre) | Gross Revenue ($/acre) | Fertilizer Cost ($/acre) | Net Return ($/acre) |
|---|---|---|---|---|
| “Typical” Rate (180 lbs) | 218 | $1,199 | $93 | $1,106 |
| MRTN Rate (160 lbs) | 217 | $1,194 | $83 | $1,111 |
But here’s the trade‑off: if you’ve got fields where yield is limited by drainage, soil type, or compaction, nitrogen isn’t the bottleneck. Cutting rates there won’t help. It’s a field‑by‑field question, not a blanket one.
90‑day action: Run the MRTN calculator for your state and soil region at current prices. Then ask your agronomist, “Why are we above this number?” If they can’t show you a clear, field‑specific reason, that’s a red flag.
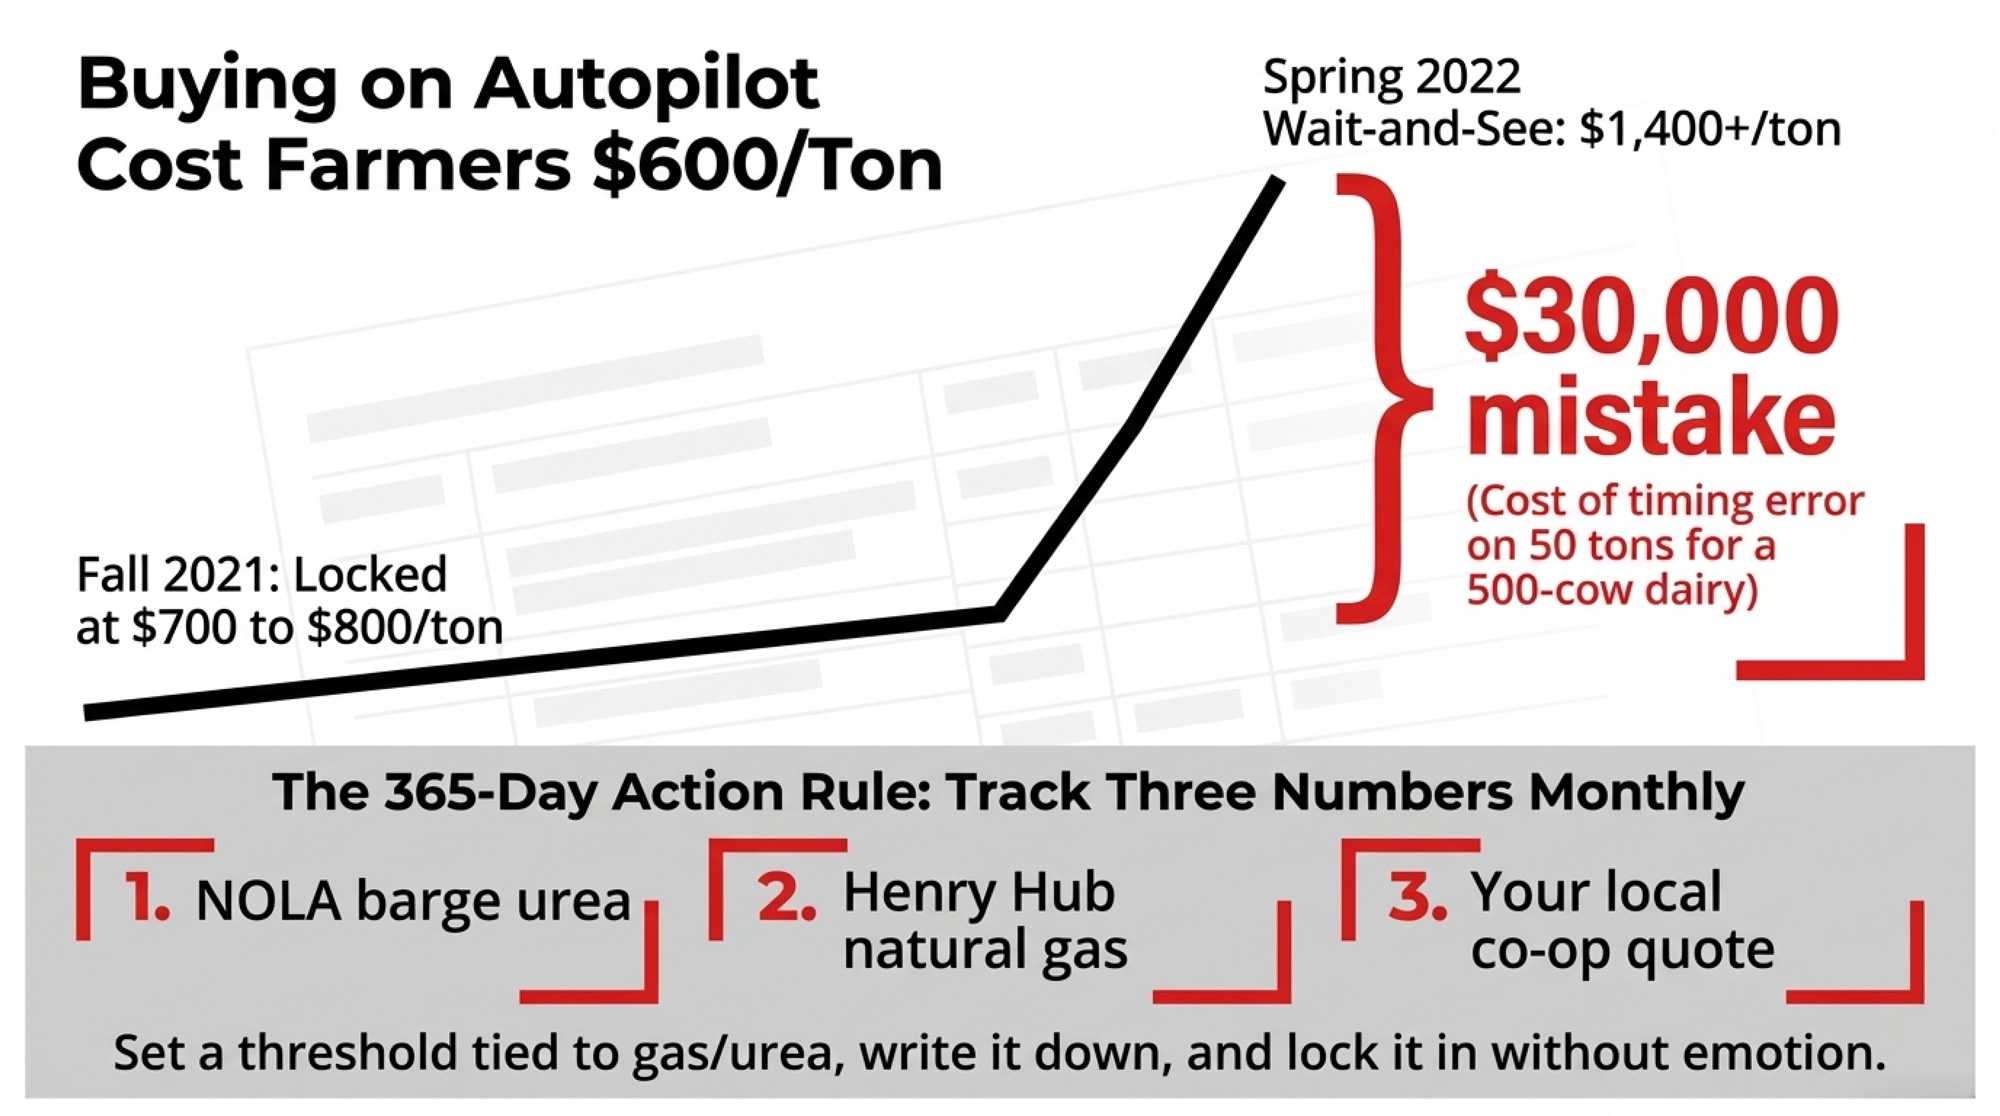
And timing matters as much as rate. Farmdoc’s price series shows farmers who locked in anhydrous in late summer or early fall 2021 paid $700–$800 per ton. Many who waited until spring 2022 wrote checks for $ 1,400+. That’s a $600/ton spread. On a 500‑cow outfit using 50 tons of product, that’s a $30,000 timing mistake.
Track three numbers once a month: NOLA barge urea, Henry Hub natural gas, and your co‑op’s current quote vs where you locked last year. When urea and gas fall back toward long‑term averages, and your local quote follows, that’s your buy window.
365‑day action: Before fall 2026, decide what percentage of your 2027 N you’re comfortable locking at a threshold tied to gas and urea. Write that threshold down. Share it with your lender and supplier so emotion isn’t driving the call.
Key Takeaways
- If your 2022 fertilizer cost per acre on corn was north of $247, you were above the Illinois state average at the peak. If you’re well above it, you owe yourself an “invoice autopsy” by field.
- If your manure analysis is older than two years — or you’ve never done one — assume you’re either under‑crediting nutrients or over‑applying somewhere. A $40–$60 test can unlock $10,000+ in annual N savings at today’s prices.
- If your agronomist can’t show you MRTN rates for your soils at current prices, you’re not having an economics conversation. You’re having a tradition conversation.
- If you haven’t looked at when you buy — only what you buy — you’re leaving timing money on the table. In 2021–2022, that timing penalty was $600 per ton for some farmers on anhydrous.
- If your 2021–2023 fertilizer documentation lives in a shoebox, you’re not ready if this class action or similar cases move forward. Courts and lenders both run on paper.
The Bottom Line
Whatever DOJ proves, and whatever happens to Nutrien, Mosaic, CF, Koch, Yara, and Canpotex in court, none of that writes the check that covers your 2027 crop. A U.S. judge might sign off on a settlement in 2030. Your lender wants to know what your fertilizer plan looks like at renewal this fall.
Before you make another purchase, ask yourself one hard question: If nitrogen jumps again — whether it’s war, weather, or something else — have you actually pulled every lever you control, or are you still just signing whatever shows up on the counter?
If you want the deeper margin modeling behind this, our breakdown of feed costs and hidden economics is the next stop. And keep an eye on The Dairy Trap Files: Input Costs — fuel and custom harvest are up next. Same pattern.
This article is based on publicly available information as of March 14, 2026, and is for general informational purposes only. It is not legal advice.
Complete references and supporting documentation are available upon request by contacting the editorial team at editor@thebullvine.com.
Learn More
- MANURE TO MONEY: How Smart Dairy Farmers Are Turning Waste into Serious Profits – Slash thousands from your input bill by viewing your pit as a high-margin asset. This guide reveals how to transform manure from a liability into liquid gold, delivering the specific ROI benchmarks needed to reclaim your margins today.
- $14.59 Milk, $20.54 Costs: The $182,850 Margin Trap Squeezing 500‑Cow Herds – Gain a clear-eyed framework for surviving the structural “deadly middle” that’s currently squeezing mid-sized herds. This report exposes the hidden market forces at play, arming you with the strategic clarity needed to protect your equity through 2027.
- Why In-Season Manure Application Will Transform Your Dairy’s Bottom Line – Capture a 10-15% yield bump by disrupting your traditional nutrient cycles with emerging application tech. This analysis delivers the methodology for precision in-season delivery, allowing you to bypass price-gouging volatility and capture maximum nitrogen efficiency.
 The Sunday Read Dairy Professionals Don’t Skip.
 The Sunday Read Dairy Professionals Don’t Skip.
Every week, thousands of producers, breeders, and industry insiders open Bullvine Weekly for genetics insights, market shifts, and profit strategies they won’t find anywhere else. One email. Five minutes. Smarter decisions all week.


