


Two good herds. Same calving nights. Same butterfat goals. Five years later, one family had $400K more equity. The gap wasn’t created in the barn—their processor’s product mix created it.
Executive Summary: U.S. cheese and butter consumption hit all-time highs in 2023, and total dairy demand reached levels not seen since 1959—a real tailwind for the industry. But USDA projects more milk coming through 2026 with all-milk prices in the low-$20s: solid for some herds, uncomfortably close to breakeven for others. What’s increasingly separating those outcomes isn’t just fresh cow management or component focus; it’s where milk actually lands after it leaves the lane—pizza cheese and specialty yogurt versus commodity powder and private-label fluid. For a 400-cow herd, a steady $1/cwt pay-price difference adds up to roughly $400,000 in equity over four years. Inside, you’ll find six questions to ask your processor, three conversations to prioritize this year, and a framework for matching your channel position with your true cost of production. In this market, knowing where your milk goes may matter as much as anything happening inside your barn.

Let me start with a scene you probably know all too well.
Two 400-cow herds. Both kinds of barns are the kinds most of us would call “good.” Cows right around that 80-pound mark. Butterfat levels the field rep is happy with. Fresh cow management through the transition period is under control. No major train wrecks in the dry cow pen. Parlors are humming along well enough that nobody’s cursing the schedule over coffee.
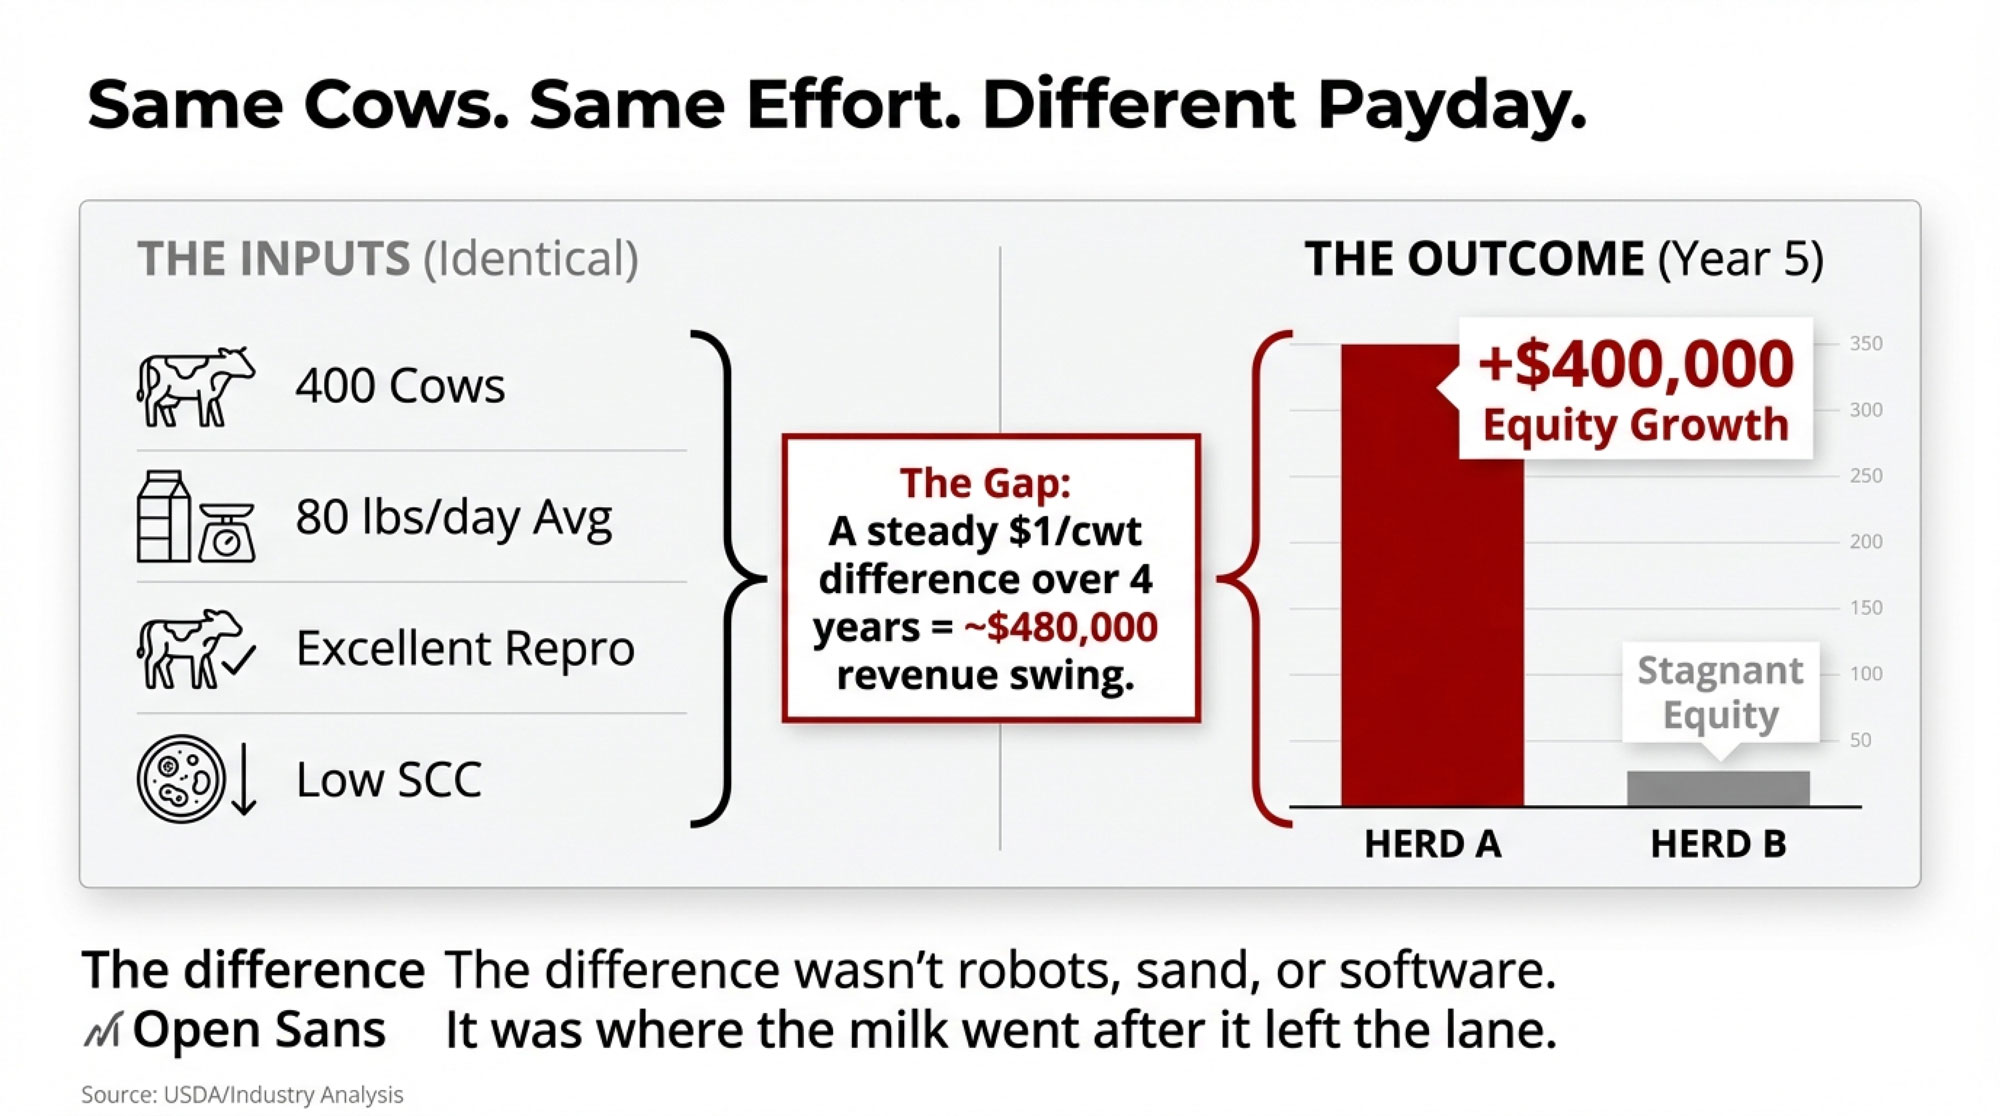
Fast-forward four or five years. One of those farms has quietly added $300,000 to $400,000 in equity. The other is wondering why, after all the nights in the maternity pen and all the feed tweaks, the balance sheet isn’t where they hoped it’d be.
The difference often isn’t robots versus parlors, or sand versus mattresses, or who’s running what ration software. What I keep seeing, in conversations with producers and in the numbers themselves, is that it comes down to a question we didn’t really ask much fifteen years ago:
Where does your milk actually go when it leaves the lane—and what is that processor doing with it?
Looking at the latest data and at where processors are spending their capital, that “where” might matter just as much as anything you’re doing inside your fences.
Strong Demand, Tight Prices: The Current Picture
Let’s start with demand, because honestly, that part of the story is more encouraging than you’d think, listening to some outside commentators.
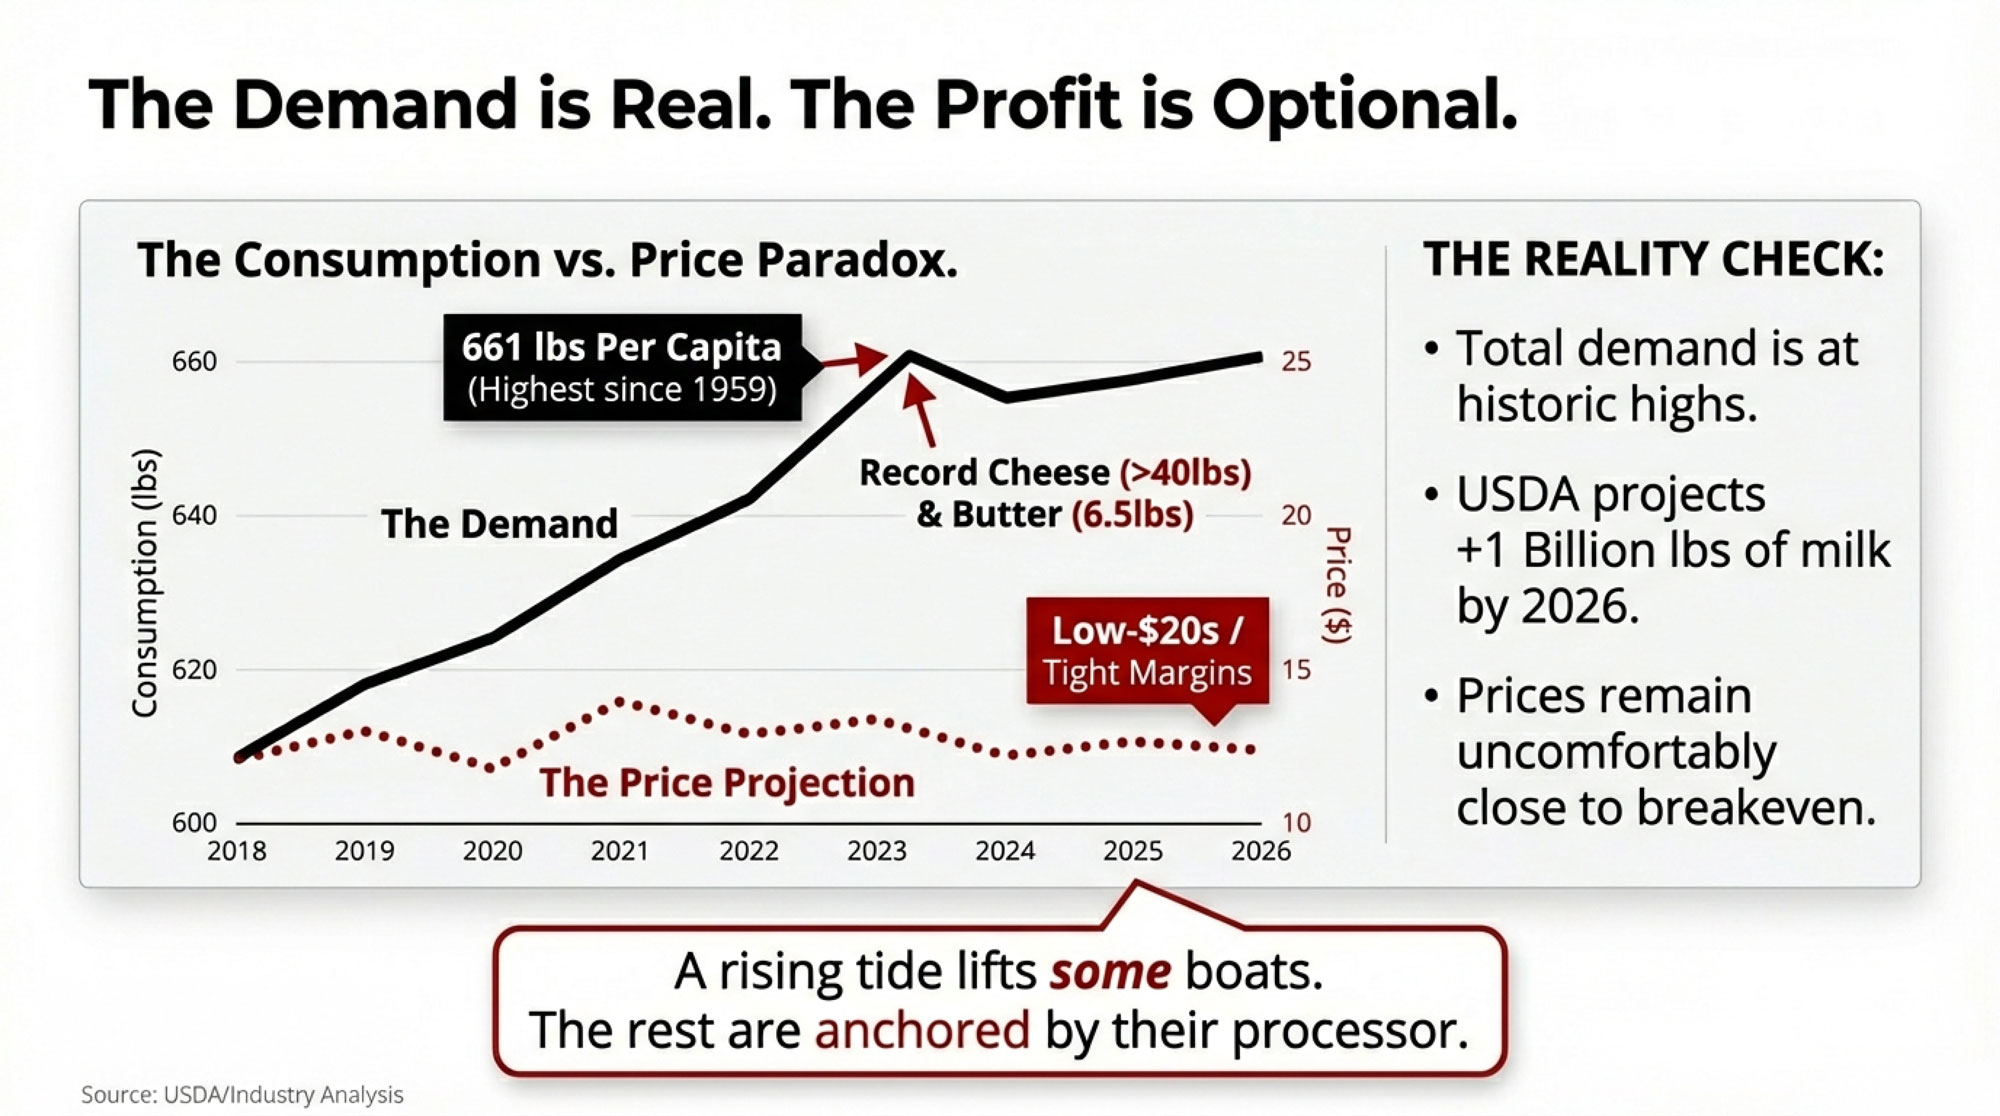
USDA’s Economic Research Service tracks how much dairy Americans eat each year on a milk-equivalent, milkfat basis. For 2023, they put per-capita dairy consumption at 661 pounds—7 pounds higher than 2022. Analysis of that dataset noted that 661 pounds ties the highest mark in the modern series and is the best level since 1959, when Americans consumed about 672 pounds on the same milkfat basis. The International Dairy Foods Association picked up on that too, using it to remind people that total U.S. dairy demand is anything but dead.
You know all the talk about cheese? The data backs it up. Using those same ERS tables, analysis shows 2023 per-capita cheese consumption at about 40.2 pounds, up from 39.9 pounds the year before and a new record. Grouping some cheeses more broadly, lands around 42.3 pounds per person. The precise number depends on how you slice the categories, but the trend line doesn’t change: Americans have never eaten more cheese than they do right now.
Butter’s right there with it. ERS data summarized by IDFA shows per-capita butter consumption at 6.5 pounds in 2023, the highest since the mid-1960s. Given where butter sat in the low-fat decades, that’s a meaningful swing back in our direction.
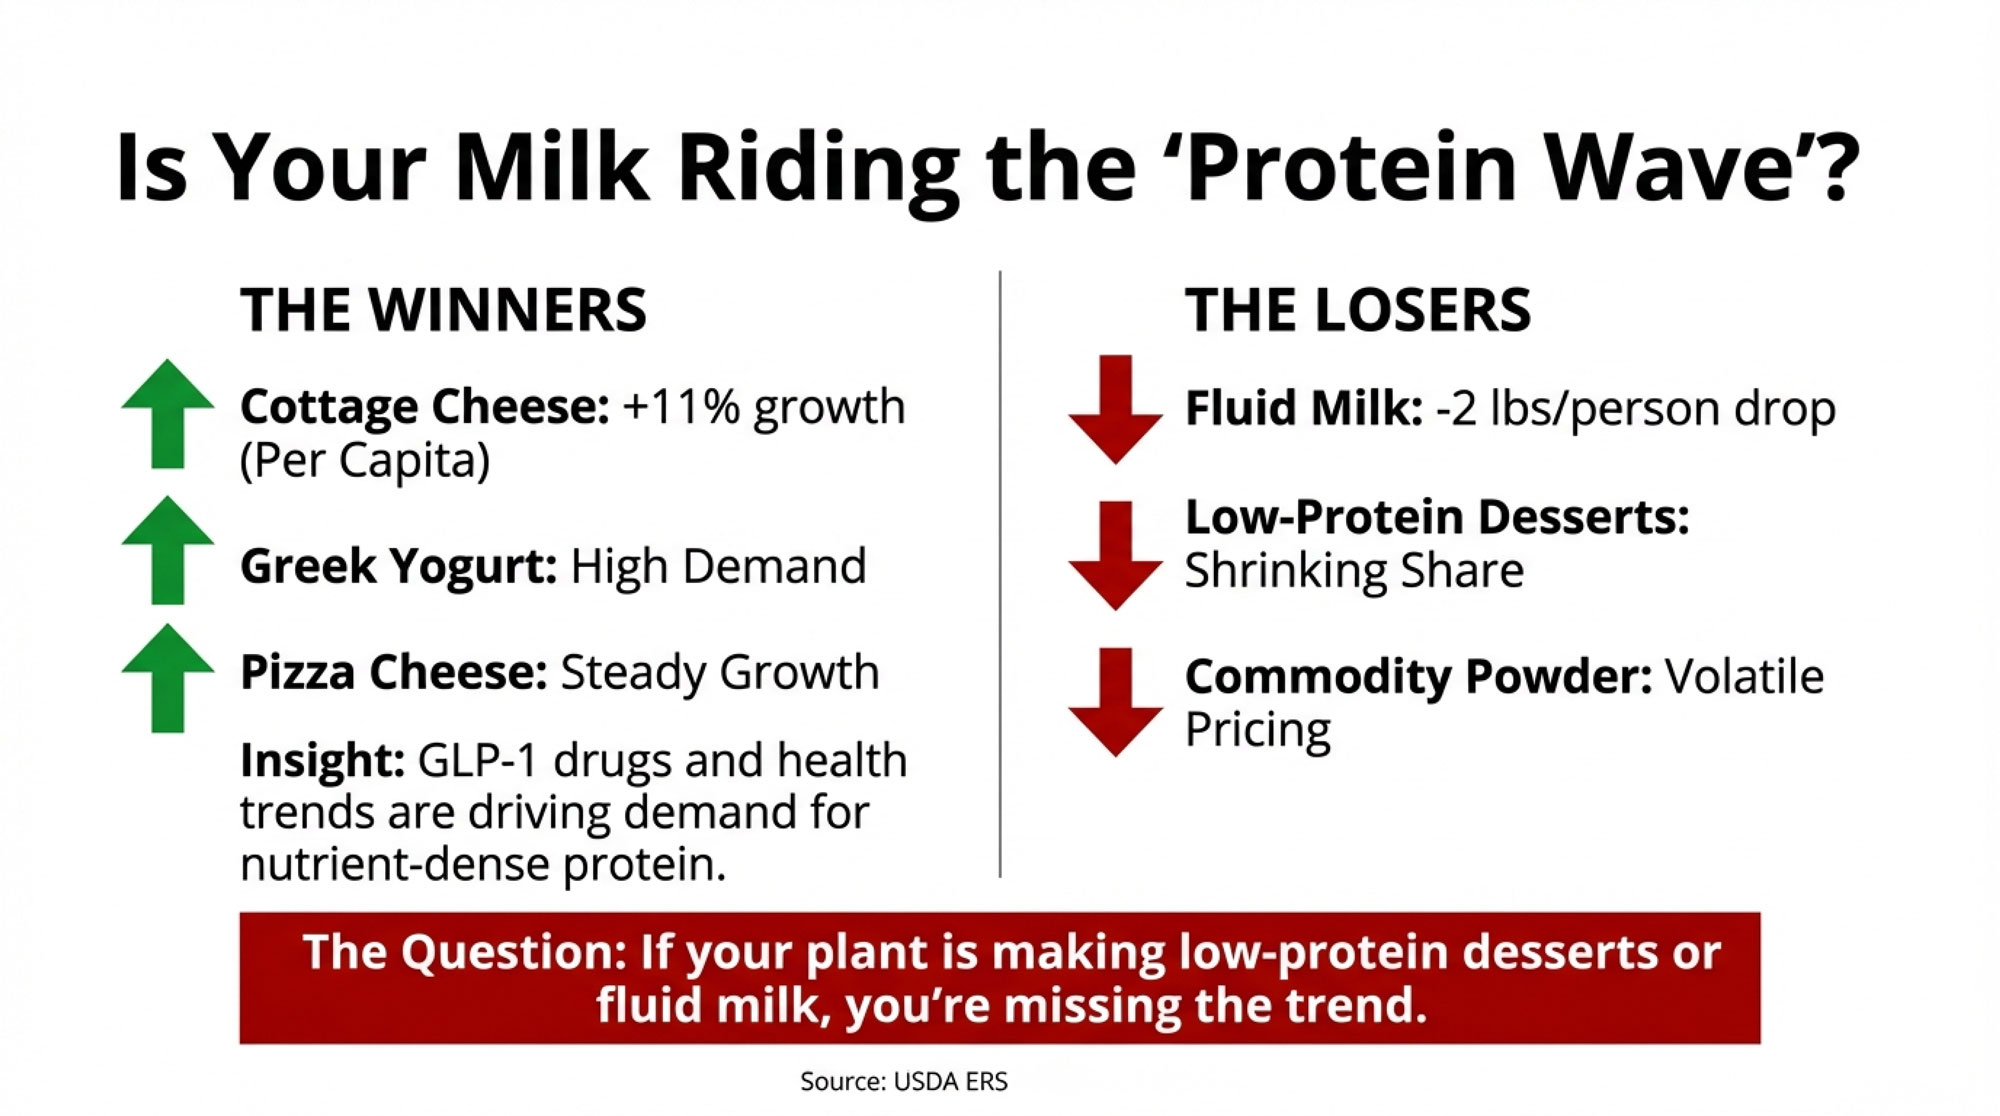
And if you zoom in further, some “old-made-new” products really jump out. Working off Circana retail data for the 52 weeks ending December 1, 2024, notes that paneer sales were up roughly a third, burrata climbed just over 30 percent, and queso quesadilla gained more than 20 percent. On top of that, ERS numbers show cottage cheese climbing from 1.9 to 2.1 pounds per person in 2023—an 11-plus percent increase. If you’ve walked a grocery dairy aisle recently, you’ve probably seen the explosion in cottage cheese brands, flavors, and single-serve packs yourself.
Fluid milk is the outlier. ERS figures show fluid milk consumption dropping to about 128 pounds per person in 2023, down from 130 the year before and well below the mid-1970s peak of around 247 pounds per person. Many Midwest and Northeast producers don’t need a chart to see that decline; they’ve watched the fluid case shrink for decades.
So, stepping back, the demand picture looks like this:
- Overall dairy consumption is at or near record levels.
- Cheese and butter are at all-time highs.
- High-protein products like cottage cheese are clearly gaining ground.
- Fluid beverage milk continues a very long, slow slide.
Now, if that were the whole story, we’d all be breathing easier. But you know it’s not.
USDA’s Livestock, Dairy, and Poultry outlooks for 2025 and 2026, summarized by Brownfield and Farm Progress, have had a consistent theme: more cows and more milk per cow. In mid-2025, Brownfield reported that USDA had bumped its 2026 milk production forecast up to about 231.3 billion pounds, nearly a billion pounds higher than the previous month’s estimate, based on herd expansion and productivity.
On price, USDA’s all-milk projections have shifted around as those production and demand expectations change. One widely cited outlook cut the 2026 all-milk price projection down to about $20.40 per hundredweight, roughly $1.50 lower than the prior version. Later in 2025, Brownfield covered another update where USDA raised that same 2026 all-milk projection to around $21.65 on improved demand assumptions. When you line up those various WASDE and LDP reports, you get a 2026 range that generally sits in the high teens to low twenties per hundredweight.
Putting it together:
- Demand is strong, especially for cheese, butter, and some high-protein products.
- USDA expects more milk on the market in 2025 and 2026.
- Price projections are workable for some herds but will feel uncomfortably tight for others, especially after debt service and family living.
That combination is exactly why it’s worth asking not just “How well are we farming?” but “Where does our milk actually land in the chain?”
Same Pound, Different Payback
You know this in your gut already: not every pound pays the same.
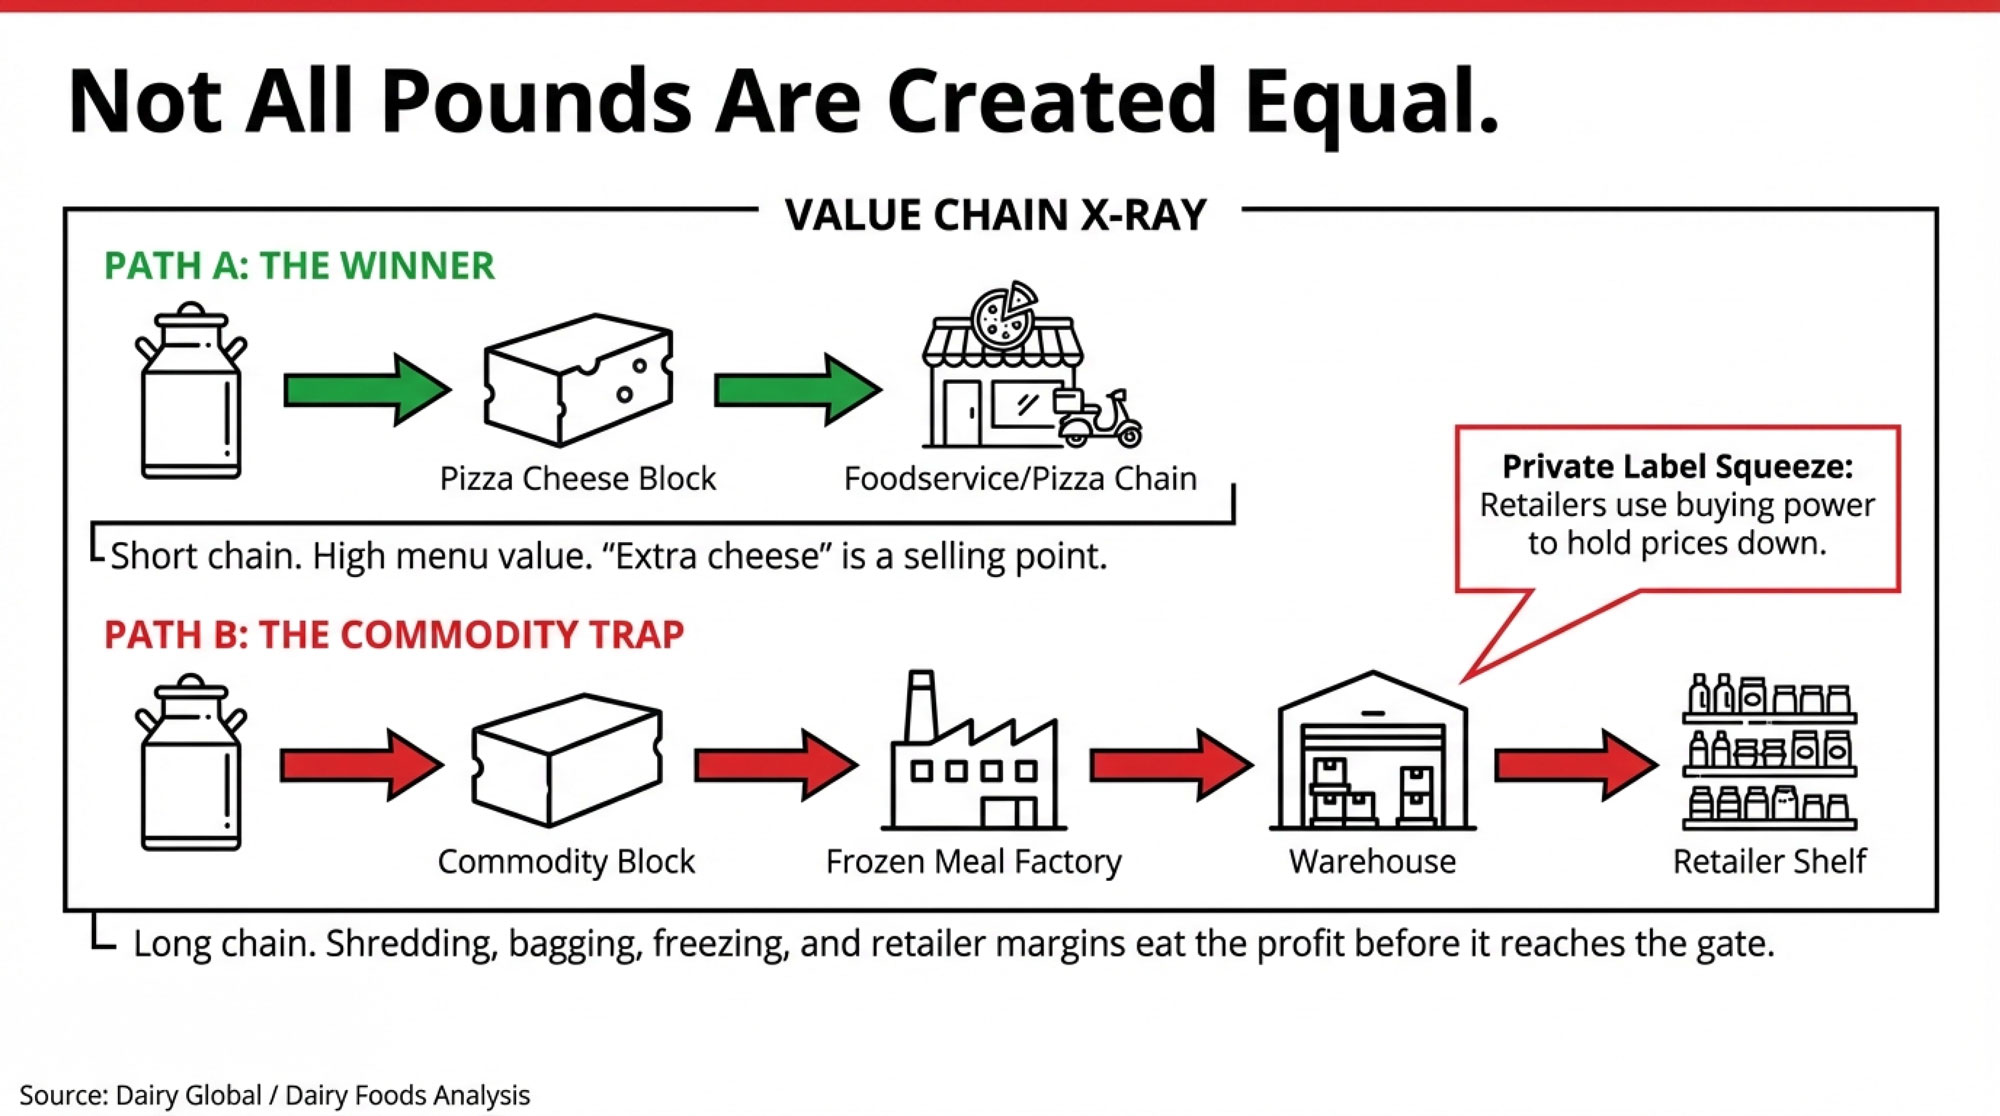
Let’s walk through two different paths for a pound of cheese.
In the first path, your milk goes into mozzarella and blends for pizza chains and other foodservice accounts. The flow looks something like this: milk leaves your bulk tank and heads to the cheese plant, the plant turns it into blocks or shreds that move to a foodservice distributor or straight into a chain’s distribution network, and those shreds end up on pizzas where “extra cheese” is part of the selling point. Margins still get taken along the way, but the chain is relatively short, and the cheese is directly tied to perceived menu value.
In the second path, that same pound of cheese ends up as a private-label shredded bag or as part of a budget frozen entrée. Milk goes to the processor, cheese is shipped to another facility that turns it into frozen meals or snack items, and those products move through a retailer’s warehouse network and onto the shelf as house brands or value-tier items. More hands in the pot. More processing steps. More packaging. More trucks and cold storage.
Industry discussions in Dairy Global and processor profiles in Dairy Foods make a few things pretty clear:
- When people cook at home, they generally don’t use as much cheese per serving as restaurants do. A pizza chain wants the cheese to be obvious in every bite; a family looking at a $6 bag of shredded cheese is often trying to make it stretch across several meals.
- Every extra step after cheese leaves the vat—shredding, blending, bagging, freezing, plus added warehousing and retailer handling—adds cost. Those costs eat into the share of the final dollar that can flow back toward the raw milk.
- Private-label fluid, commodity cheese, and butter have grown their share in many retail categories. Large retailers use their bargaining power to hold prices down, squeezing processor margins and limiting how much they can raise prices to farms without hurting themselves.
So that “pound of cheese” in USDA’s per-capita numbers might be part of a high-value pizza program, a premium specialty cheese, or a low-priced frozen meal. The consumption statistic looks the same. The payback back to your lane doesn’t.
When you put some numbers on it, the scale of that difference is hard to ignore. Take a 400-cow Holstein herd averaging around 80 pounds. That’s roughly 32,000 pounds a day—about 320 hundredweight. Over a year, you’re in the ballpark of 110,000 to 120,000 hundredweight. Data suggest that’s a realistic production level for many herds of that size. If your farm is shipping that much over four years, a consistent $1-per-hundredweight difference in pay price adds up to around $400,000 to $480,000 in gross milk revenue.
That’s the sort of gap that doesn’t just make the milk check look nicer—it shows up plain as day when you sit down with your banker and look at your equity.
| Metric | Pizza Cheese & Specialty (Growth Channel) | Powder & Commodity (Flat/Decline Channel) |
|---|---|---|
| Typical Product Focus | Mozzarella, specialty cheese, pizza chains, yogurt, high-protein beverages | Skim milk powder, bulk butter, private-label fluid, commodity cheddar |
| Annual Milk Volume (400-cow herd) | ~120,000 cwt | ~120,000 cwt |
| Base All-Milk Price (2026 USDA proj.) | $21.50/cwt | $20.50/cwt |
| Average Pay Price Premium | +$1.00/cwt | –$0 (baseline) |
| Annual Revenue Difference per Farm | +$120,000 | — |
| Processor Capital Investments (5-yr outlook) | Adding vats, new packaging lines, export infrastructure | Maintenance mode, modest efficiency upgrades |
| Product Demand Trend | ↑ Growing (cheese +record, yogurt +specialty) | ↓ Declining (powder commodity-driven, fluid secular decline) |
| Component Reward (Butterfat/Protein) | Strong premium for high solids | Minimal differentiation on components |
| Margin for Production Error | Moderate to comfortable | Thin to uncomfortable |
| 4-Year Cumulative Equity Impact | +$520,000 | +$415,000 |
Why Processors Want “Predictable” Milk
Now, let’s do something we don’t always like doing and think like a plant manager for a minute.
Retailers and restaurant chains have spent years sharpening their forecasting. There’s a lot of software and analytics behind using multi-year sales history, seasons, promotions, and so on to predict how much they’ll sell each week. That “no surprises” mindset is pretty standard now.
In conversations with co-op folks and plant managers, and in reading between the lines in trade interviews, that thinking has crept upstream into how processors view farms.
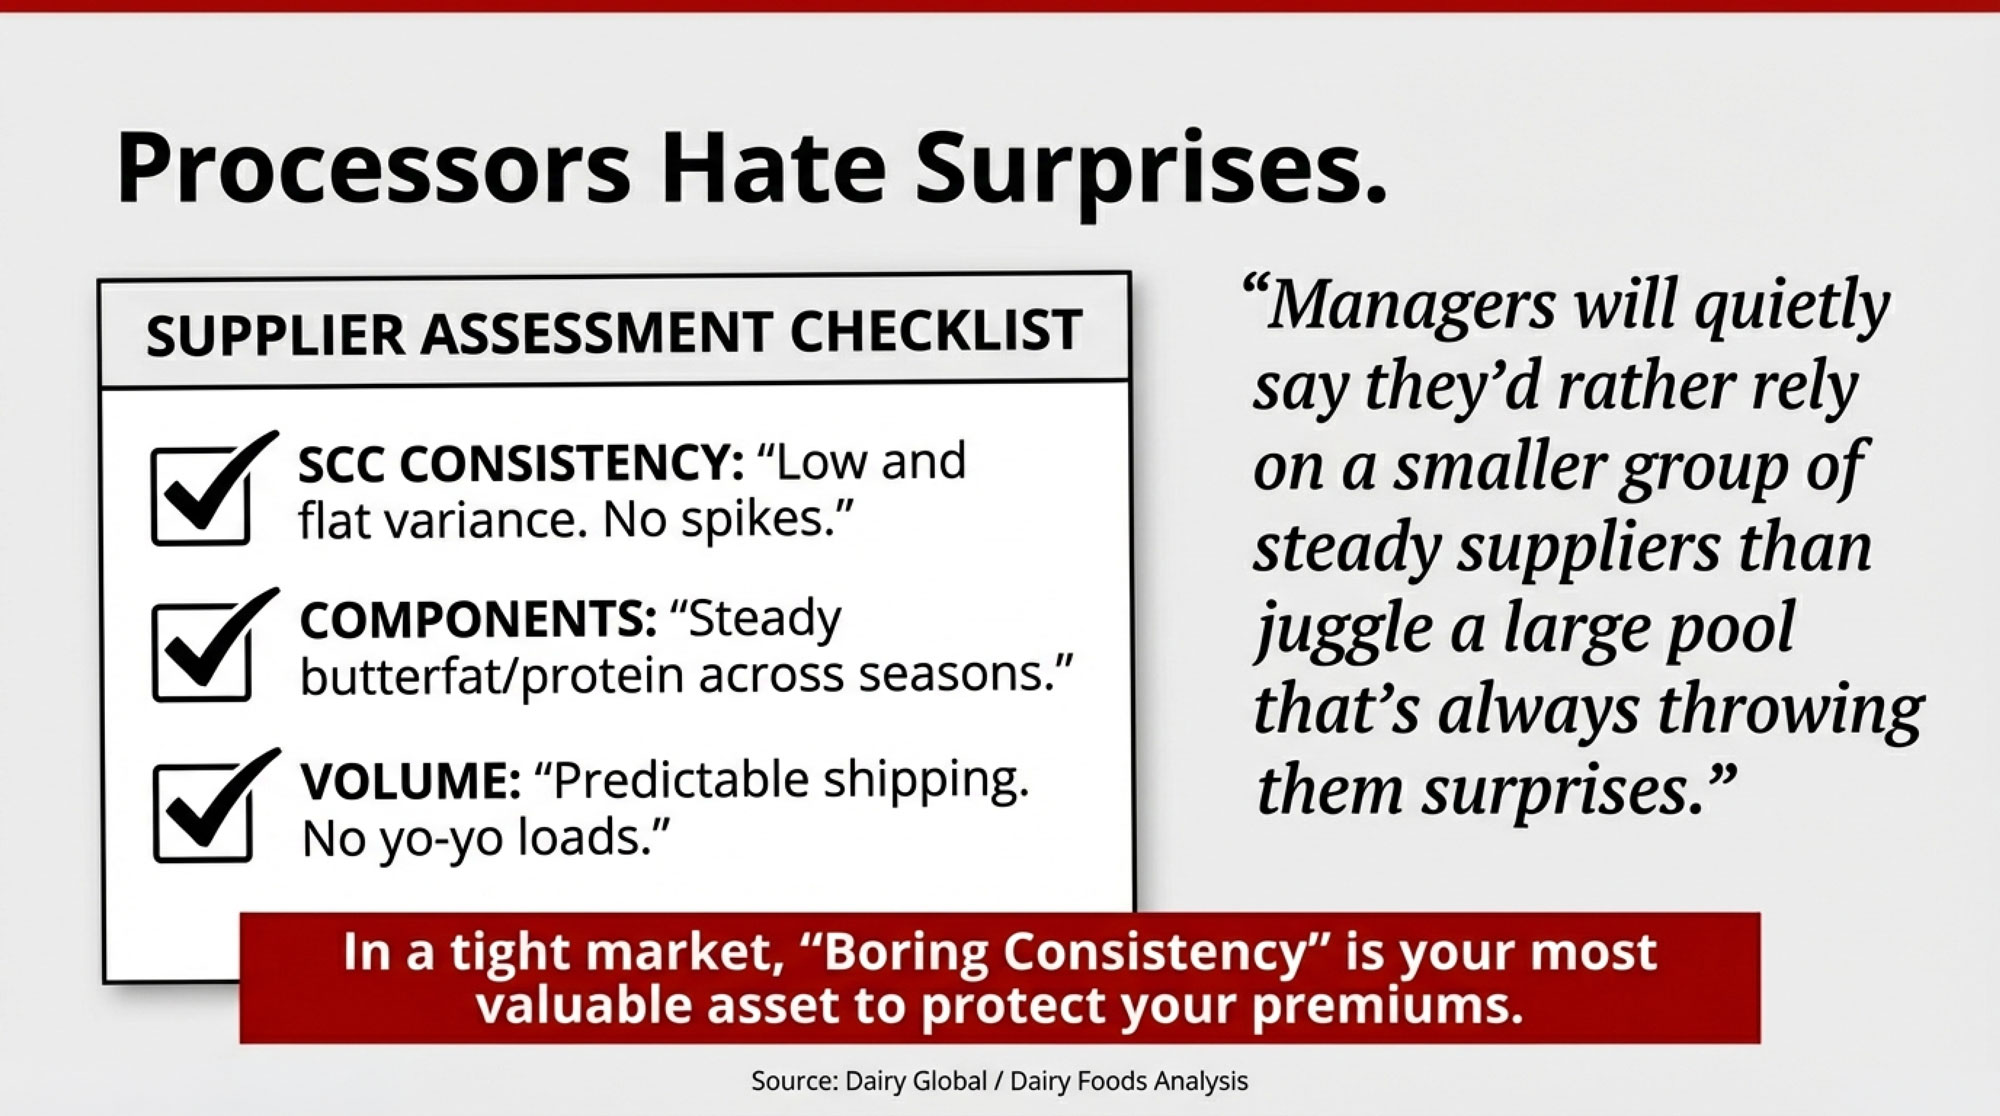
Nobody at USDA hands them a template that says, “score your suppliers like this.” But if you listen to supply-chain managers quoted in places like Dairy Foods and Feedstuffs, you hear similar patterns:
- They look at several years of volume history for each farm, not just last month’s ticket.
- They watch butterfat and protein trends across seasons, so they know who’s steady and who’s up-and-down.
- They track somatic cell and bacteria counts over time, looking at how often and how badly they spike.
- They pay attention to how wildly loads swing when the weather is ugly or when feed quality changes.
In Wisconsin operations, in New York and Ontario freestalls, and out in California and Idaho dry lot systems tied into big plants, managers will quietly say they’d rather rely heavily on a smaller group of steady suppliers than juggle a large pool that’s always throwing them surprises.
From your side of the lane, that quietly raises the value of a few things:
- Somatic cell counts that live in a narrow, low band instead of bouncing around.
- Butterfat and protein that hold reasonably steady across seasons thanks to balanced rations and good fresh cow management.
- Shipments that don’t yo-yo week to week, even when heat, mud, cold, or smoke are testing your team.
In component-based pay systems—which cover most of the U.S. and Canada—those traits can be worth even more. Plants making cheese and butter are fundamentally buying butterfat and protein. Those component pounds are exactly what generate premiums when markets are strong. Strong butterfat performance and solid protein don’t just help your check; they matter even more when your milk is going into cheese and butter plants that can turn those solids into high-value products, as opposed to fluid or powder plants where there’s less reward for components.
If you’re already strong on quality, components, and steady volume, that’s encouraging. You look like the kind of supplier plants are trying to keep and grow with.
Health Trends and High-Protein Dairy
Now let’s step briefly into something that sounds more like a doctor’s office than a dairy meeting, but it’s already shaping the dairy case: health trends, weight-loss medications, and “better-for-you” products.
There’s been a lot of buzz about GLP-1 drugs and weight management. Most of the detailed projections of how many people will use them come from medical journals and financial analysts, not from dairy economists. But there’s a clear theme in the nutrition advice around them: people taking these meds often eat fewer calories overall, and dietitians encourage them to keep their protein intake up and focus more on nutrient-dense foods.
You know where that points are.
Industry sources have noted that high-protein dairy is one of the hottest growth areas: Greek and skyr-style yogurts, high-protein spoonable and drinkable yogurts, performance-oriented dairy beverages, cottage cheese, and protein-enriched milks. When they look at scanner data, those products generally show stronger growth than a lot of traditional low-protein dairy desserts.
Cottage cheese is the poster child right now. ERS data show per-capita cottage cheese rising from 1.9 to 2.1 pounds in 2023, and analysis calls out cottage as one of the fastest-growing segments. The nutrition messaging and the dairy case are actually pulling in the same direction for once.
So nobody can honestly say, “GLP-1 will add exactly X pounds of extra dairy demand.” But the broader trend—less empty calories, more protein—is pulling in the same direction as high-protein dairy. If your milk is going into plants that specialize in those kinds of products, you’re plugged into one of the segments where nutrition advice and consumer behavior are aligning with what dairy offers.
What Farmers Are Finding Out
Most producers can rattle off their rolling herd average, butterfat levels, pregnancy rate, and cull percentage without even thinking. But if you ask, “What portion of your milk ends up as pizza cheese, specialty cheese, butter, powder, or fluid gallons?”, the answers often get a lot less precise.
In eastern Wisconsin, for example, a producer shared at a meeting that he’d long assumed most of his milk went into mozzarella and cheddar for foodservice. That was the story in his head. When he sat down with his co-op field rep and walked through their actual product and channel mix, he realized a bigger share than he’d thought was showing up as private-label fluid and commodity butter. His cows hadn’t changed. His ration hadn’t changed. But his understanding of where his milk really sat in the value chain changed overnight.
In the Northeast, a New York producer told a story almost the opposite of that. He moved from a co-op that leaned heavily on fluid and commodity American-style cheese into a plant specializing in mozzarella and Hispanic cheeses with strong export ties. Over several years, as that plant added cheese capacity and grew export business—and as he pushed harder on components and quality—he saw his average pay price improve in a meaningful way. That’s consistent with data showing Mexico alone buying roughly 392 million pounds of U.S. cheese in a recent year, accounting for about 38 percent of total U.S. cheese exports, with other Latin American and some Asian markets also growing. When your plant is tied to that kind of demand, the conversation changes.
Out West, many dry lot systems in California and Idaho, shipping primarily to powder plants, tell a different story. Their processors are heavily tied to skim milk powder and bulk butter. USDA outlooks and export analyses keep reminding us that these are critical products but are heavily commodity-driven and more volatile, with generally thinner margins than many cheese and value-added categories. For those herds, the biggest constraint often isn’t how well they manage the transition period or reproduction—it’s that their milk is structurally tied to products whose prices are set on a very competitive global market.
In Canada, supply management and quota changes alter some dynamics, but the channel question still bites. If your milk is locked into a processor focused on fluid or basic butter, and your hauling radius or quota setup limits your ability to move, your channel options can be even narrower than what some U.S. neighbors face.
Six Questions That Make the Picture Clearer
The nice thing is, you don’t need a consultant’s binder to start. A notebook and a bit of courage to ask direct questions go a long way.
Here are six questions that, in many cases, have really shifted how producers see their situation:
- “Broadly speaking, where does our milk go by channel?” Ask for rough percentages. How much of their total volume goes into foodservice, how much into retail, how much into ingredient sales, and how much into export? They already track this when they talk to the USDA and big customers. You’re just asking them to translate it into farmer terms.
- “What are the main products our milk becomes?” Try to get past “cheese and butter.” Is your milk mainly feeding fluid gallons, private-label cheddar and slices, process cheese, butter and powder, pizza cheese, yogurt, specialty cheeses? Your processor knows which buckets your milk is filling.
- “Over the last three to five years, have those product lines grown, stayed flat, or shrunk for you?” You’re listening for things like: “We’ve added vats for pizza cheese,” “specialty cheese and yogurt are where our growth is,” or “our branded fluid has been under real pressure.” That tells you whether your milk is riding an up-escalator, standing on level ground, or being pulled down.
- “Where are you investing for the next five to ten years?” The trade press has covered billions of dollars in investments in new cheese plants, dryers for higher-end powders, yogurt lines, and export packaging. Ask where your buyer is putting its own capital. Are they adding vats, building new lines, upgrading for exports, or mostly just patching roofs?
- “How is your customer base changing?” Are they picking up quick-service restaurant accounts, export cheese contracts, and health-focused retail customers—segments industry analysts call growth areas—or are they mostly trying to hold onto private-label fluid and butter slots in the face of aggressive pricing?
- “Based on quality and consistency, where would you place our farm in your supplier group?” Are you in their top third, the middle of the pack, or on the bottom rung? Many co-ops and plants maintain internal rankings based on multi-year quality, component, and volume data, even if they don’t share them with you. It’s nearly impossible to improve your position if you don’t know where you’re starting from.
What to Bring to Those Meetings
Before you sit down with your processor, your accountant, or your lender, it helps to have your own homework done. A few things to pull together:
- Last 3 years of monthly pay prices and component tests. This shows your trends and lets you compare against co-op or regional averages.
- Last 12 months of SCC and quality records. Plants are looking at your consistency, not just your best month.
- A simple cost-of-production summary with your breakeven per cwt. If you don’t know this number, your accountant or extension office can help you get there.
- Any recent processor or co-op letters outlining product/market changes. These often signal where they’re headed before they announce it publicly.
Having this in hand turns a vague conversation into a focused one.
Matching the Map With Your Own Numbers
Most dairy business consultants and land-grant economists will tell you that you really should know, at a minimum:
- Your operating margin per hundredweight—milk income minus cash operating costs, divided by hundredweight shipped.
- Your debt-to-asset ratio—total liabilities compared to the fair-market value of your assets.
- Your interest coverage—operating margin divided by annual interest expense.
- Your breakeven milk price, including family living—total costs (feed, labor, repairs, interest, depreciation) plus a realistic family draw, divided by hundredweight.
Recent dairy budgets and case-farm studies from universities like Wisconsin, Penn State, and Michigan State often show full-cost breakevens for 300- to 800-cow herds in the upper teens to low $20s per hundredweight under 2023–2025 feed, labor, and interest conditions. National statistics put many real herds in that same neighborhood once family living gets factored in.
On the revenue side, USDA’s 2025 and 2026 all-milk forecasts, as summarized LDP reports, suggest national all-milk prices in the low-$20s in 2025 and somewhere in the high-teens to low-$20s in 2026, depending on how production, exports, and domestic use unfold.
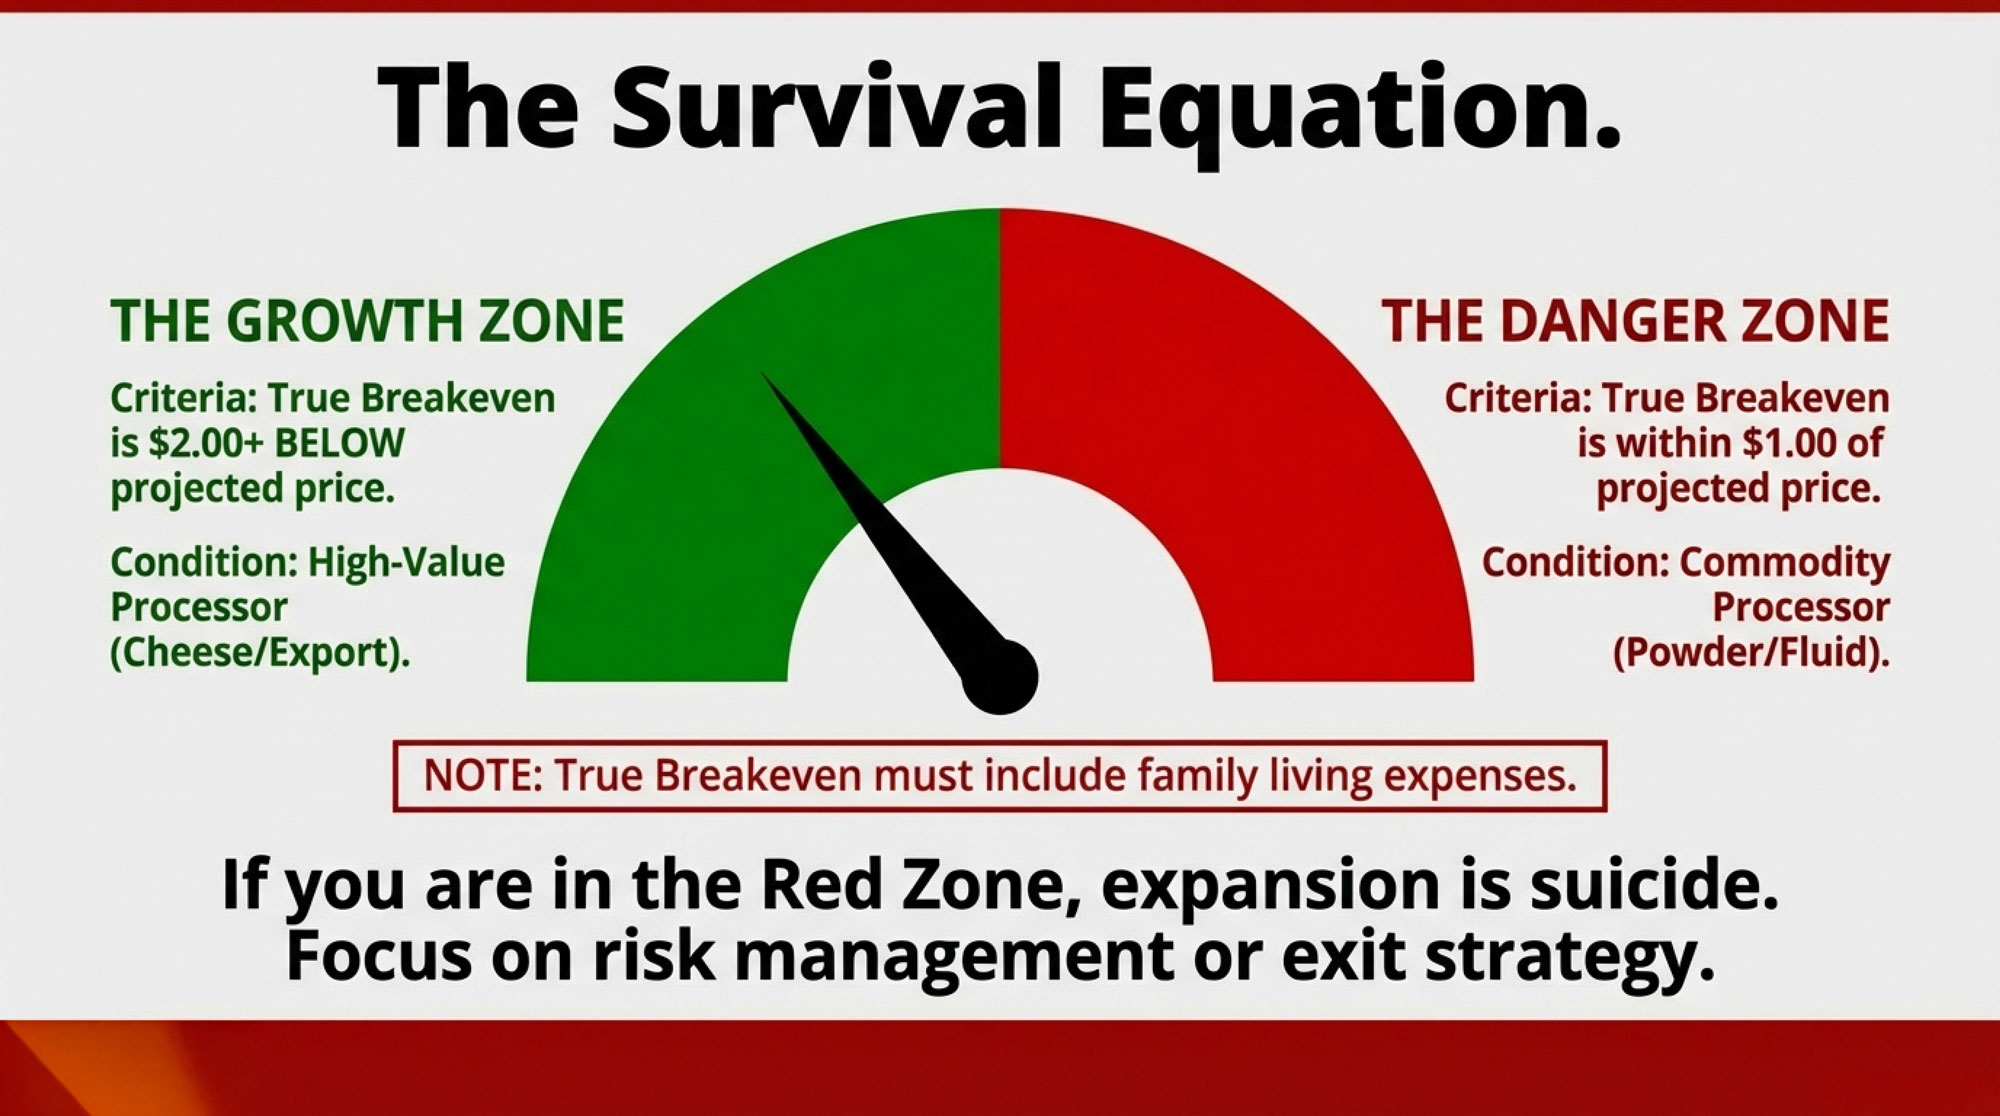
So here’s a practical rule of thumb a lot of advisors use—not as gospel, but as a conversation starter:
- If your true breakeven, including family living, is at least about $2 per hundredweight below where USDA expects all-milk prices to land, and your processor is tying your milk into growing, value-added channels like cheese, butter, yogurt, and high-protein products, then you’ve got room to talk about modest expansion or targeted upgrades.
- If your breakeven is within roughly $1 per hundredweight of those projected prices, and a big chunk of your milk is tied to low-margin, commodity-driven channels like powder and basic fluid, then your margin for error is thin, and your structural risk is high.
To put some flesh on that: a herd with a full-cost breakeven of $18/cwt, shipping into a plant that’s investing in mozzarella vats and pizza cheese programs and operating in a $21 all-milk environment, has cushion and options. A herd with a $20/cwt breakeven in a region where most of its milk goes to a powder plant and the all-milk price is expected to hover around $21, with global skim and butter driving things, is in a very different spot.
For herds in that second situation, tools like Dairy Revenue Protection or simple forward contracts can help keep that cushion intact—something worth discussing with your risk management advisor alongside your channel strategy.
Different Farms, Different Realities
One thing that comes through pretty clearly, both in the numbers and in conversations at the diner, is that not every dairy has the same realistic menu of options.
Farms Already Hooked to Growth Channels
Some of you are in a structurally favorable position.
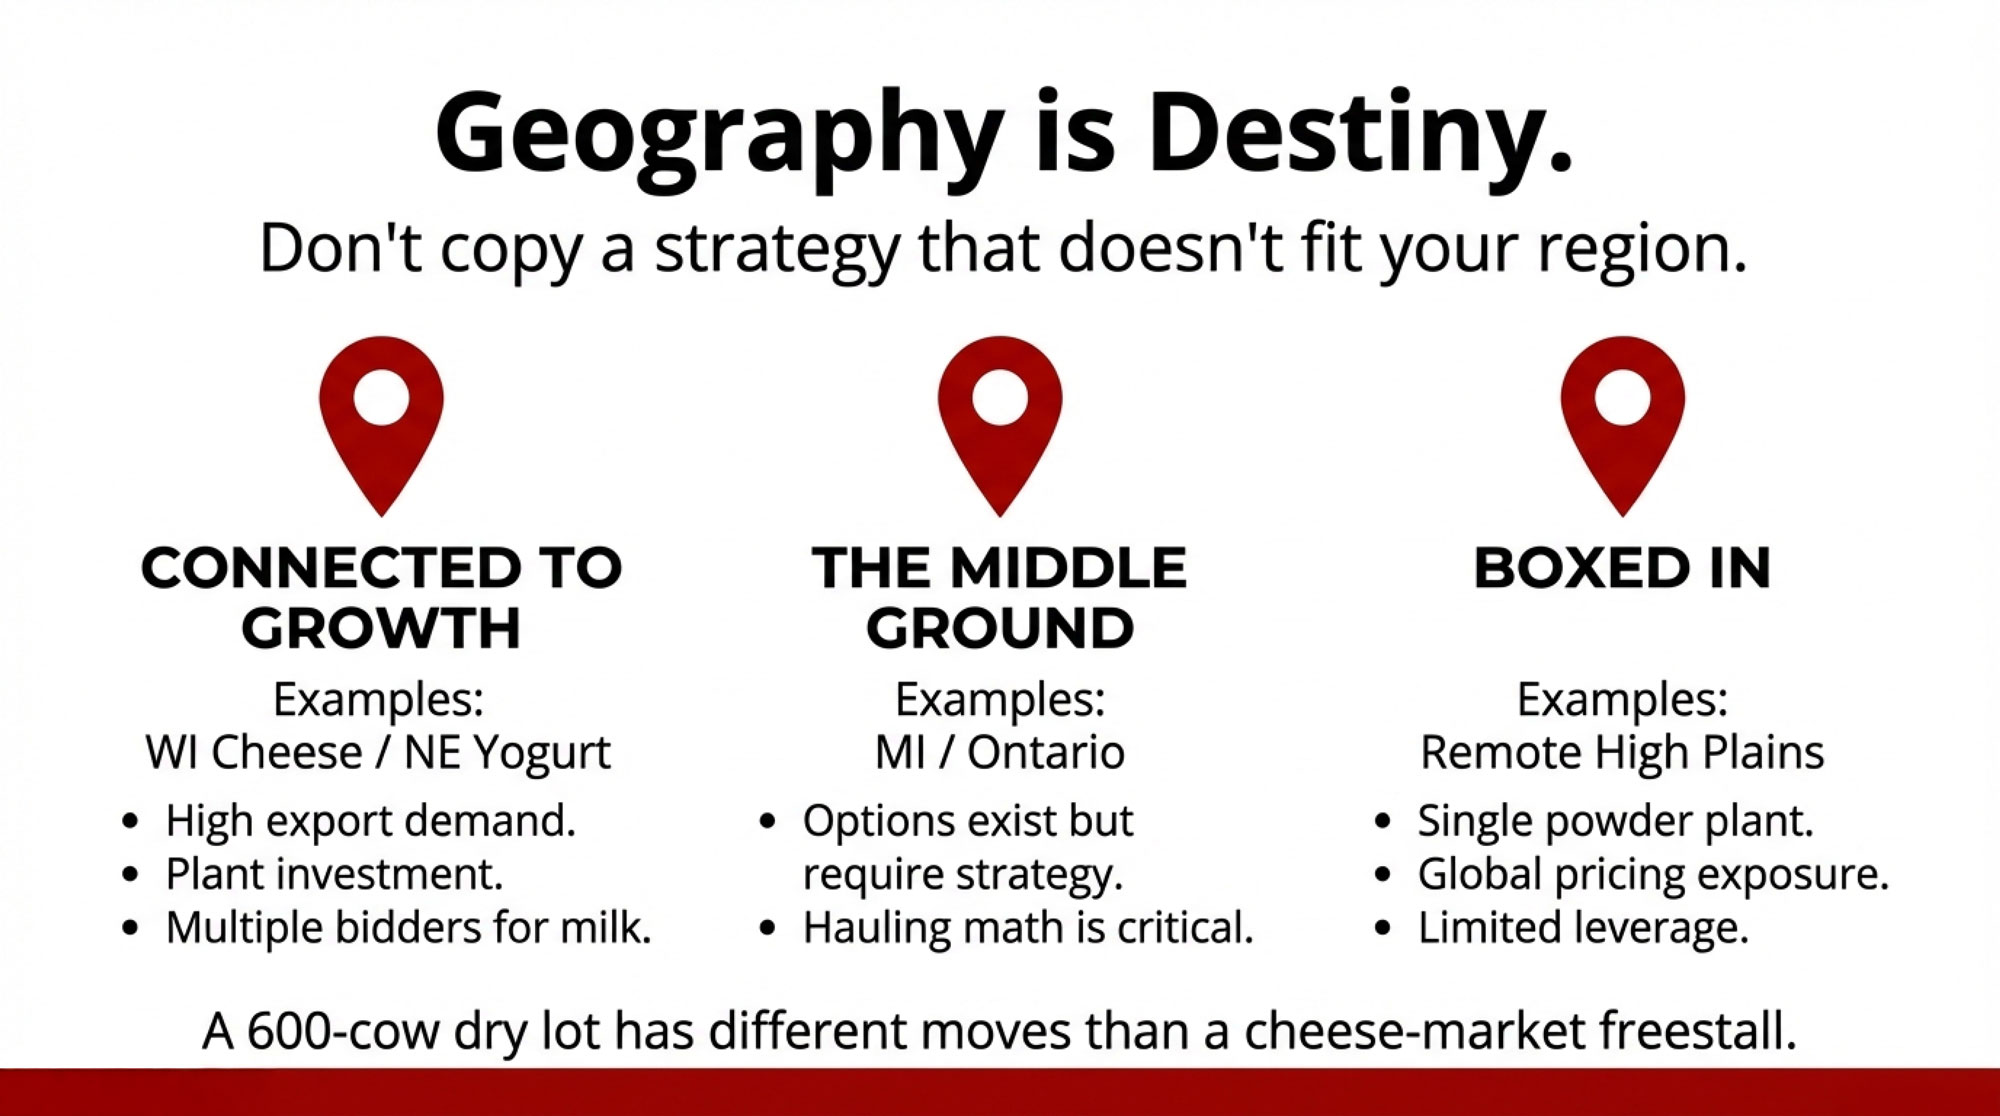
In Wisconsin operations and across parts of the Upper Midwest, that often means shipping to a plant where the core business is mozzarella and other cheeses for domestic chains and export markets. Industry data shows that Mexico alone often buys close to 40 percent of U.S. cheese exports in a given year, with other Latin American and some Asian markets also growing. That kind of cheese demand helps underwrite those plants’ investments and their appetite for milk.
In the Northeast, it might be a specialty cheese plant or a yogurt plant with strong branded products and foodservice clients. On the West Coast, maybe it’s a facility focused on high-protein dairy beverages or value-added performance nutrition powders.
If your processor is talking about adding vats, installing new lines for drinkable yogurt, signing export cheese contracts, or launching functional dairy products—and they’re telling you they want more of your milk—that’s a good sign you’re tied to channels with built-in growth.
For farms in this situation, the questions usually sound like: How do we make sure we stay in their “must-keep” supplier group by being rock-solid on quality, components, and volume? Given our breakeven and USDA’s price outlook, does a careful move from 400 to 550 cows actually improve our resilience, or does it just stretch our labor and capital too thin? Are there specific investments—cooling, feed storage, data systems—that would make our milk more valuable to this particular plant?
Farms in the Middle
Then there’s a big group of herds—across the Northeast, Michigan, and many central U.S. regions—where the answer is more like, “It depends.”
They might ship mainly to a co-op that leans hard on private-label fluid and commodity butter, have a second potential buyer that focuses on cheddar and whey for domestic retail and ingredient markets, or sit within hauling distance of a specialty cheese, organic, or yogurt plant that’s open to new suppliers under certain conditions.
For these farms, you tend to see a mix of strategies. Some do change processors when the math and channel mix make sense—hauling costs, contract terms, and the new plant’s focus all have to stack up. Others seriously consider organic, grass-fed, or other identity-preserved paths, but only where there’s a credible buyer and where the land base and finances can support the costs and risks those systems bring. Quite a few stick with their main co-op but work hard to climb into the top tier of their quality and component grids and tap into any higher-value pools or programs they can.
There isn’t a one-size-fits-all answer here. The right move depends heavily on where you are, what your numbers look like, and what your family wants the operation to be ten years from now.
Farms That Are Structurally Boxed In
And then there are herds—often in more remote High Plains areas, some western dry lot regions, or parts of Canada where quota and hauling really limit options—where the structure of the local processing base makes the decision tree much narrower.
That usually looks like one realistic plant within economical hauling distance, focused on commodities like powder, bulk butter, or low-margin fluid, with no serious plans for new dairy processing capacity in the area.
Even very well-run herds can find their futures heavily constrained by the economics of that one plant. USDA outlooks and export analysis don’t mince words: skim milk powder and bulk butter are crucial to balancing the market, but global commodity prices heavily influence them and tend to be more volatile and lower-margin than many cheeses and value-added channels.
Families in those spots end up asking some hard questions: Do we spend the next several years focusing on harvesting as much income as we can, paying down debt, and maintaining our facilities, rather than betting big on expansion? Is it time to start talking seriously about succession, sale, leasing, or other exit options while we still have enough equity and time to choose our path? Would relocating to a stronger dairy region or diversifying into other enterprises make more sense than relying solely on a constrained local dairy market?
They’re not easy conversations, but they’re a lot easier while the farm is still in a strong enough position to make choices rather than having choices made for it.

Three Conversations Worth Having This Year
So if we boil it all down to “What do we do with this?”, there are three conversations worth putting on the calendar.
A Real Sit-Down With Your Processor or Co-op
Take those six questions and ask for some uninterrupted time. You’re trying to understand where your milk actually fits in their product and channel mix, and whether they see your farm as part of their long-term growth story or as volume they can dial up or down.
If they can’t—or won’t—give you a rough breakdown of where your milk goes and what it becomes, that alone tells you something about the relationship.
A Numbers-Focused Session With Your Accountant or Business Advisor
Ask them to help you put your true breakeven milk price, including family living, down in black and white. Look at how your equity has moved over the last three to five years. Line your numbers up next to the USDA’s price forecasts and regional cost-of-production benchmarks.
Most advisors and lenders have experience with the major land-grant tools and statistics and can translate them into what they mean for your particular herd, debt load, and capital plan. If you don’t know your breakeven, this is the year to fix that.
A Candid Conversation With Your Lender
Whether that’s Farm Credit, a regional ag bank, or your local lender, they see patterns across lots of dairies and processors. It’s worth asking how they view your processor’s financial strength and long-term outlook, what they’d need to see from you—on cash flow, equity, and channel position—to be comfortable supporting a modest expansion or a significant capital project, and what a planned, orderly scale-down or exit might look like for your operation if that ever seems like the right path.
Doing nothing is a decision too. The risk is leaving it so long that the market, the plant, or the bank ends up making the decision for you.
The Bottom Line
The data tells us Americans are eating more dairy than they have in decades—especially cheese and butter—and that high-protein products like Greek yogurt and cottage cheese are gaining real traction. USDA is signaling more milk in 2025 and 2026, and all-milk prices in a range where some operations will be comfortable, while others will be uncomfortably close to breakeven.
Where your milk goes really does matter. A pound going into pizza cheese, specialty cheese, or high-protein yogurt in a growing plant is not the same as a pound going into low-margin fluid or powder in a plant that’s heavily exposed to commodity swings.
Consistency is getting more valuable. As plants lean on data and forecasting, they favor farms that deliver steady milk quality, components, and volume. Strong butterfat and protein have much more earning power in cheese and butter plants than they do when your milk ends up in products that don’t reward solids as much.
Different farms need different strategies. The best move for a 600-cow freestall twenty minutes from a mozzarella plant in Wisconsin isn’t going to be the best move for a 600-cow dry lot tied to a powder plant in a remote region.
You still control what happens inside your fences: cow comfort, fresh cow care, feed efficiency, repro, and people. That’s the foundation.
What this moment adds is one more layer we can’t afford to ignore: Do you really know where your milk goes, whether those channels are growing or shrinking, and whether you’re tied to the right processor for the next decade?
If you know your channels and you know your breakeven, you’re in a much better spot to choose your path—expansion, steady state, pivot, or exit—before the market chooses it for you.
Key Takeaways:
- Cheese and butter demand hit record highs in 2023, but USDA projects more milk through 2026 with all-milk prices in the low-$20s—the margin for error is shrinking
- What your processor does with your milk—pizza cheese or powder, specialty yogurt or private-label fluid—shapes your pay price as much as your butterfat or SCC
- A steady $1/cwt pay-price difference adds up to roughly $400,000 in equity over four years for a 400-cow herd—real money captured or left on the table
- Ask your processor directly: What products does my milk become? Are those channels growing or shrinking? Where does my farm rank among your suppliers?
- Know your breakeven, understand your channel exposure, and have candid conversations with your co-op, advisor, and lender—before the market makes decisions for you
Learn More
- The 90-Day Reckoning: What Your Milk Check Is Really Saying About 2026 – Arms you with the brutal math of 2026, delivering a 90-day action plan to stress-test your liquidity and expose the hidden margin leaks that quietly erode your equity before the lender calls.
- From 52¢ to 25¢: Where Your Milk Dollar Goes Now – And 3 Ways to Reclaim Your Share – Breaks down the structural collapse of the farmer’s share of the retail dollar and reveals three distinct strategic paths to stop being a price-taker and start capturing a larger piece of the pie.
- Lab-Grown Milk Has Arrived: The Dairy Innovation Farmers Can’t Ignore – Exposes the accelerating timeline of bioreactor-produced dairy, arming you with a survival blueprint for a market where “milk” no longer requires a cow and conventional processors face their first true existential threat.


