


Drop the afternoon milk, and you’ve just cut a calf’s ME by 50%. Jim Quigley says that’s an energy crash, not a weaning strategy.
Executive Summary: Most dairies still wean calves by age, but Jim Quigley’s work shows the rumen isn’t truly ready until a calf has consumed about 15 kg of NFC from the starter — roughly 33 pounds of fermentable carbohydrate. Many 8‑week weaning programs, especially on higher milk intakes, never reach that mark, which helps explain the post‑weaning growth checks and treatment spikes producers see. Research from Quigley, NASEM 2021, and Jim Drackley’s 2025 weaning review all point in the same direction: later, intake‑based weaning with a gradual step‑down beats abrupt, calendar‑driven protocols on biological and performance outcomes. Wagner Farms in Wisconsin built their calf program around intake targets and a 28‑day weaning step‑down and recorded zero calf losses in the year. Free tools like CalfSim and NASCalf let you model when your own calves will reach the 15 kg NFC threshold and how different feeding plans affect intake, growth, and cost. The extra 7–14 days on milk might add $30–40 per calf, but the article walks through how smoother weaning, better growth, and higher first‑lactation yield can repay that investment — and gives a 30/90/365‑day plan to test it in your own calf barn.

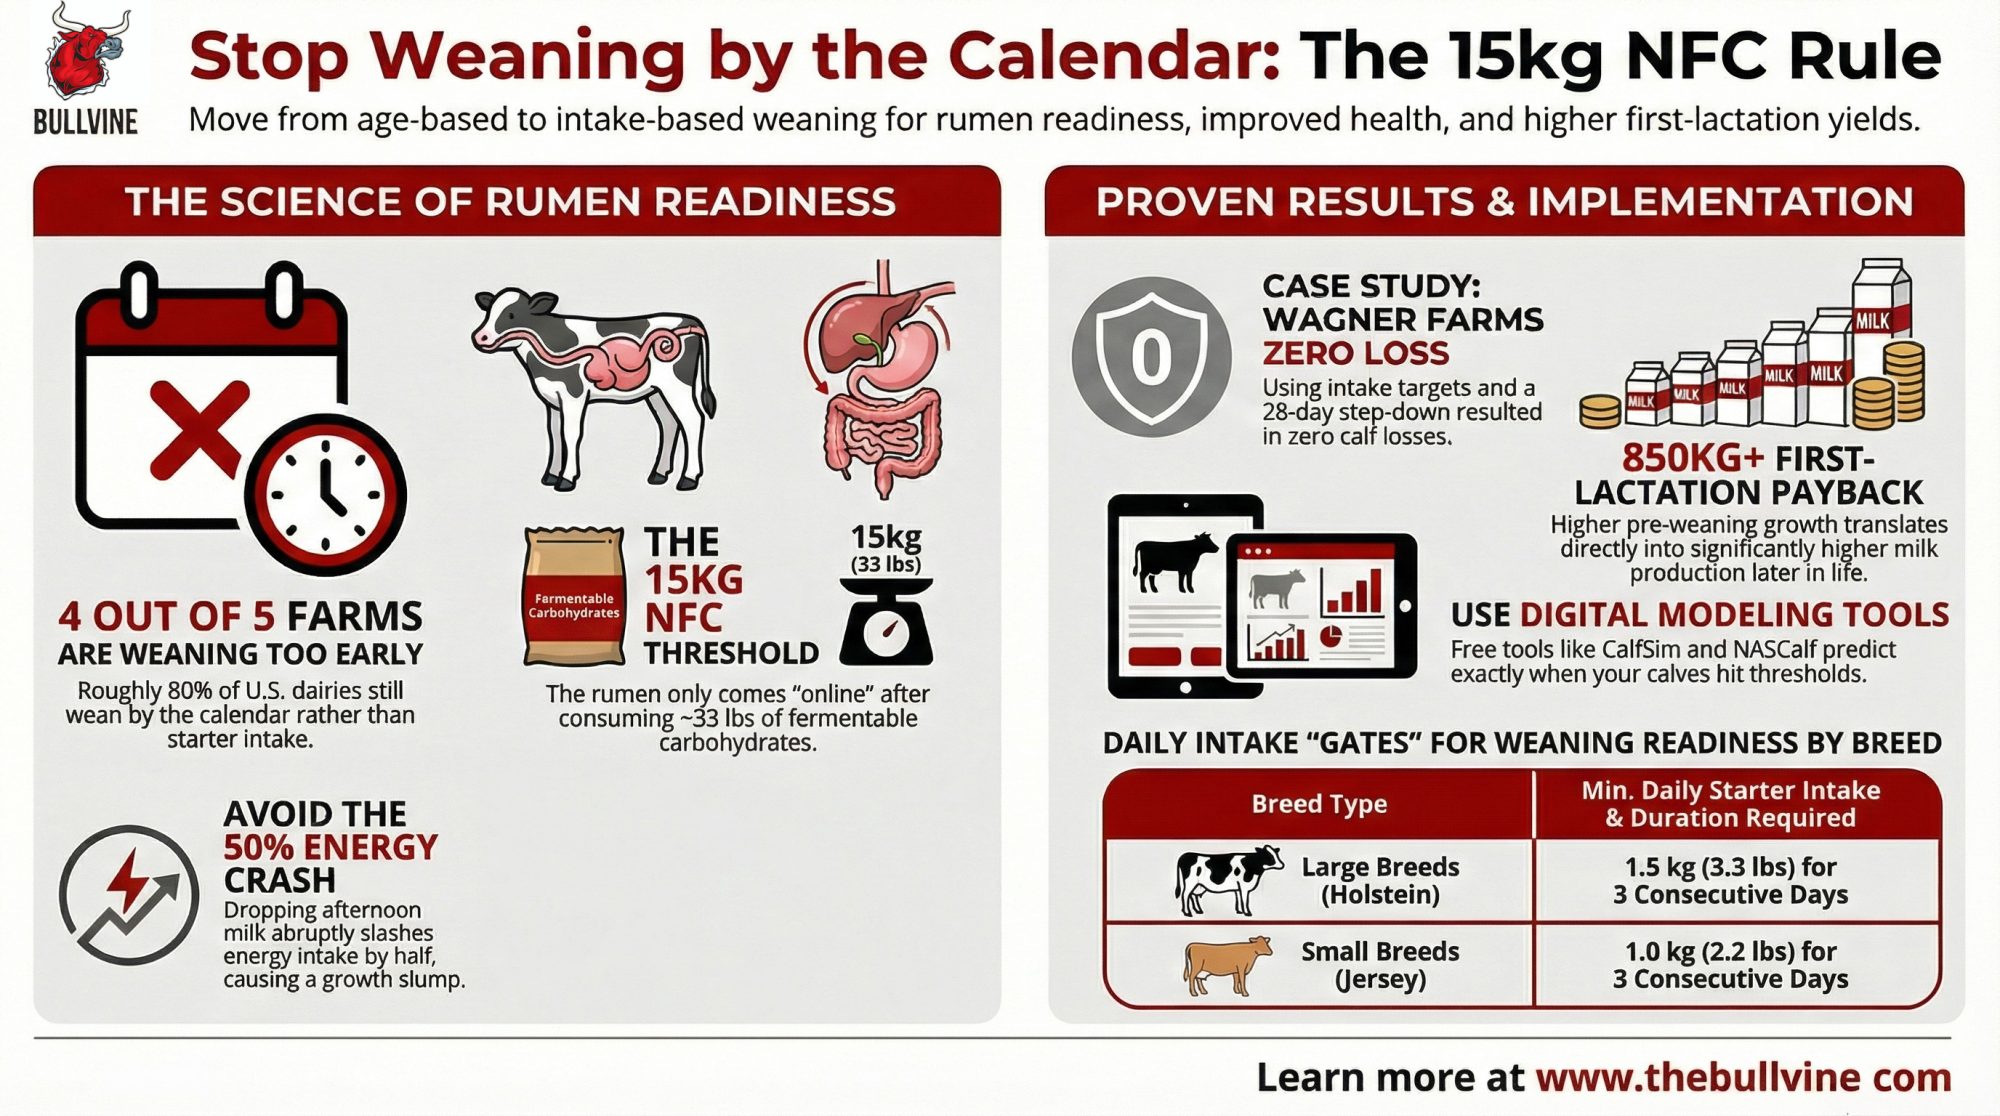
Only 21.5% of U.S. dairy farms wean calves based on starter intake rather than a fixed age. That’s the most recent national figure — USDA NAHMS Dairy 2014, now 12 years old and still the best we have. (The next NAHMS dairy study is anticipated in 2026, and anecdotal evidence suggests intake-based weaning has gained traction, but no national update exists yet.) What it means: roughly four out of five operations are pulling milk on a calendar. Jim Quigley thinks the calendar is broken.
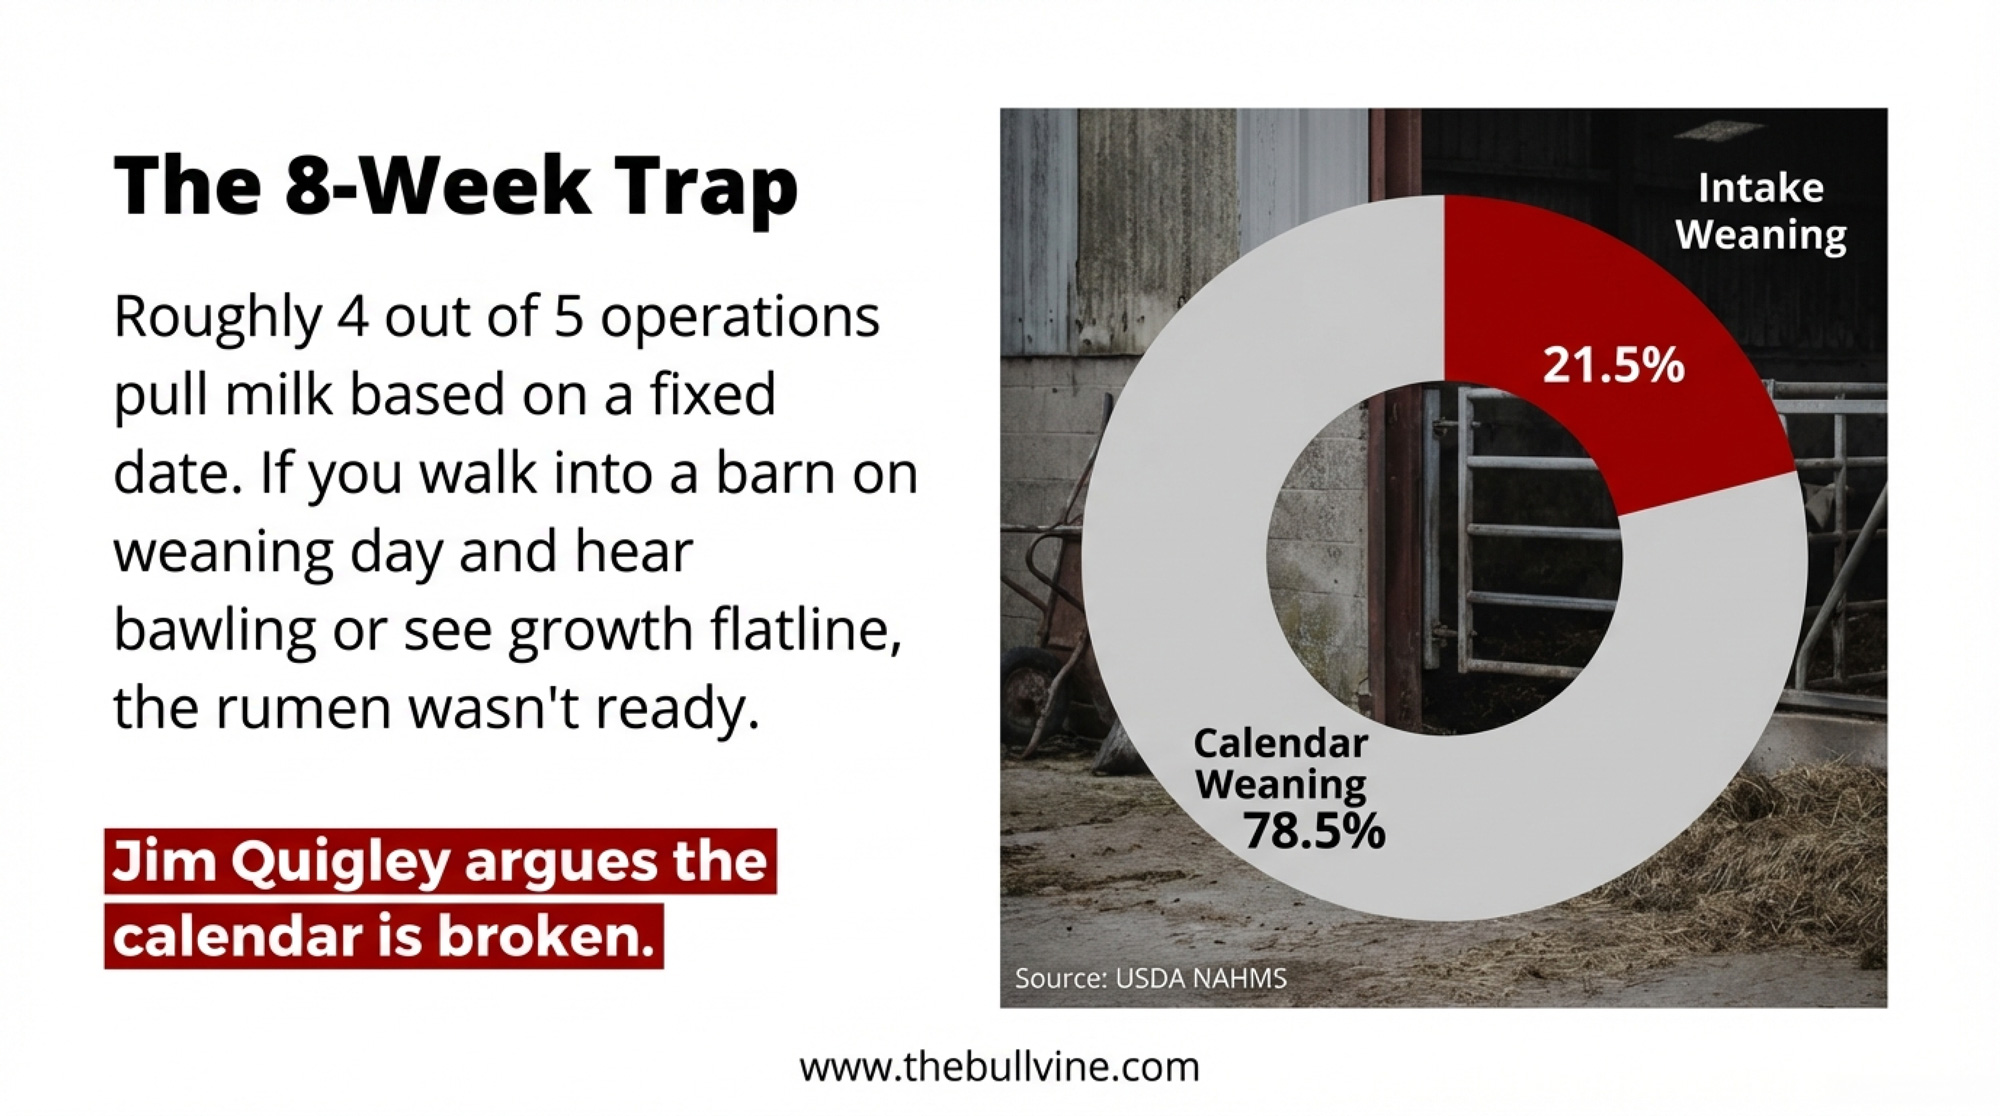
Walk into a calf barn on weaning day, and you know the result. Bawling calves, scattered starter, a handful of 8-week-olds that clearly aren’t ready. Starter intake drops. A few get pulled for treatment. Growth flatlines, then slowly recovers.
| Weaning Protocol | Typical Cumulative Starter Intake at Day 56 | Cumulative NFC Consumed | Quigley’s Readiness Threshold |
| Industry Standard (8 weeks, 6L milk/day) | 25–28 kg | 11.5–13 kg NFC | SHORT by 1.5–3.5 kg |
| Accelerated Milk (8 weeks, 10L milk/day) | 18–22 kg | 8.3–10.1 kg NFC | SHORT by 4.9–6.7 kg |
| Extended Intake-Based (9–10 weeks, 10L milk/day) | 31–34 kg | 14.3–15.7 kg NFC | ✓ Threshold met |
| Quigley’s Biological Threshold | 31 kg (55% NFC starter) | 15 kg NFC | Rumen functionally ready |
The calf nutrition researcher behind Calf Notes (calfnotes.com) has spent years arguing that weaning by intake is the only approach that lines up with what’s actually happening inside the rumen. His benchmark is specific: roughly 15 kg of cumulative non-fiber carbohydrates from the starter. That’s about 33 pounds. And on a lot of North American dairies running accelerated milk programs, his modeling suggests calves don’t cross that line until week 9 or 10.
If you’re pulling milk at week 8, you’re asking the rumen to do a job it can’t yet handle. One Wisconsin operation already proved what happens when you stop asking.
Zero Calves Lost: What Wagner Farms Proved
Wagner Farms in Oconto Falls, Wisconsin, doesn’t wean by the calendar. Profiled in Hoard’s Dairyman in 2020, the operation feeds whole milk with a milk balancer, uses paired calf housing, and weans calves based on starter intake. Laura Raatz, the farm’s calf manager, shared the approach at the Purina Leading Dairy Producers Conference.
| Protocol Element | Industry Standard (Most U.S. Dairies) | Wagner Farms (Intake-Based) |
| Weaning Trigger | Fixed age (8 weeks) | Starter intake threshold: 8 lbs/day (summer), 10 lbs/day (winter) |
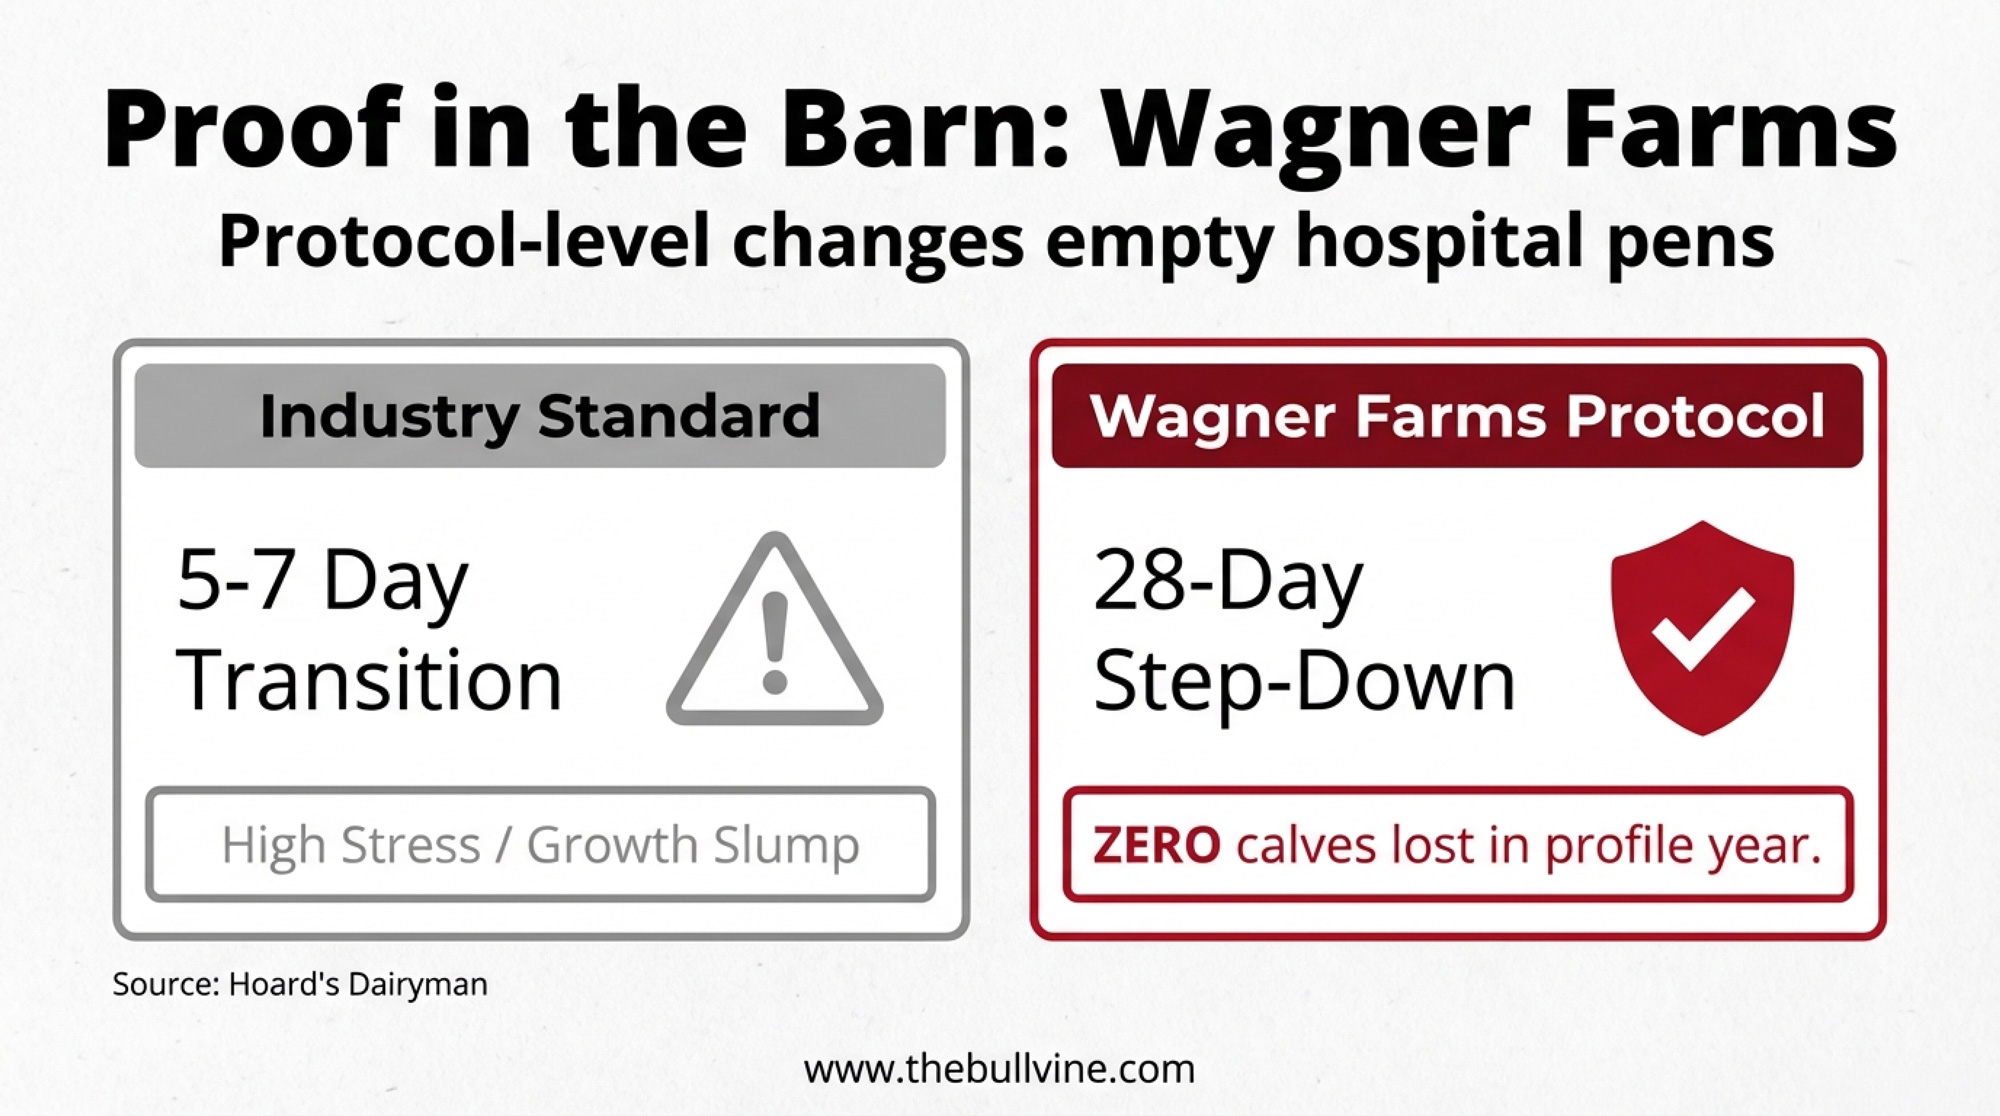
| Step-Down Duration | 5–7 days | 28 days |
| ME Reduction per Step | ~50% (drop afternoon milk) | <25% per step |
| Cumulative NFC at Weaning | 8–13 kg (typically SHORT) | ≥15 kg (threshold met) |
| Post-Weaning Treatment Rate | 10–15% (typical) | Not disclosed; zero calves lost (profile year) |
| Calf Losses (Profile Year) | 5–8% (U.S. average, USDA NAHMS) | 0% |
Their step-down stretches for a full 28 days — dramatically longer than the 5–7-day transitions common on most North American dairies. The targets are concrete: at least 8 pounds of starter per head per day in summer and 10 pounds in winter before calves finish weaning. “The more consistent the solids stay, the happier your calves will be,” Raatz told Hoard’s.
Their result for the profile year: zero calves lost.
That’s not just a health number. It’s a management statement. Wagner Farms wrapped nutrition, housing, social environment, and weaning timing into one coherent system — one where protocol-level changes empty hospital pensrather than fill them. Intake-based weaning didn’t work in isolation. It worked because the entire front end of the program was designed to get calves to eat grain early and consistently.
So what does biological readiness actually look like in numbers? That’s where Quigley’s research and Drackley’s review converge on a specific answer.
Why Higher Milk Programs Broke the 8-Week Rule
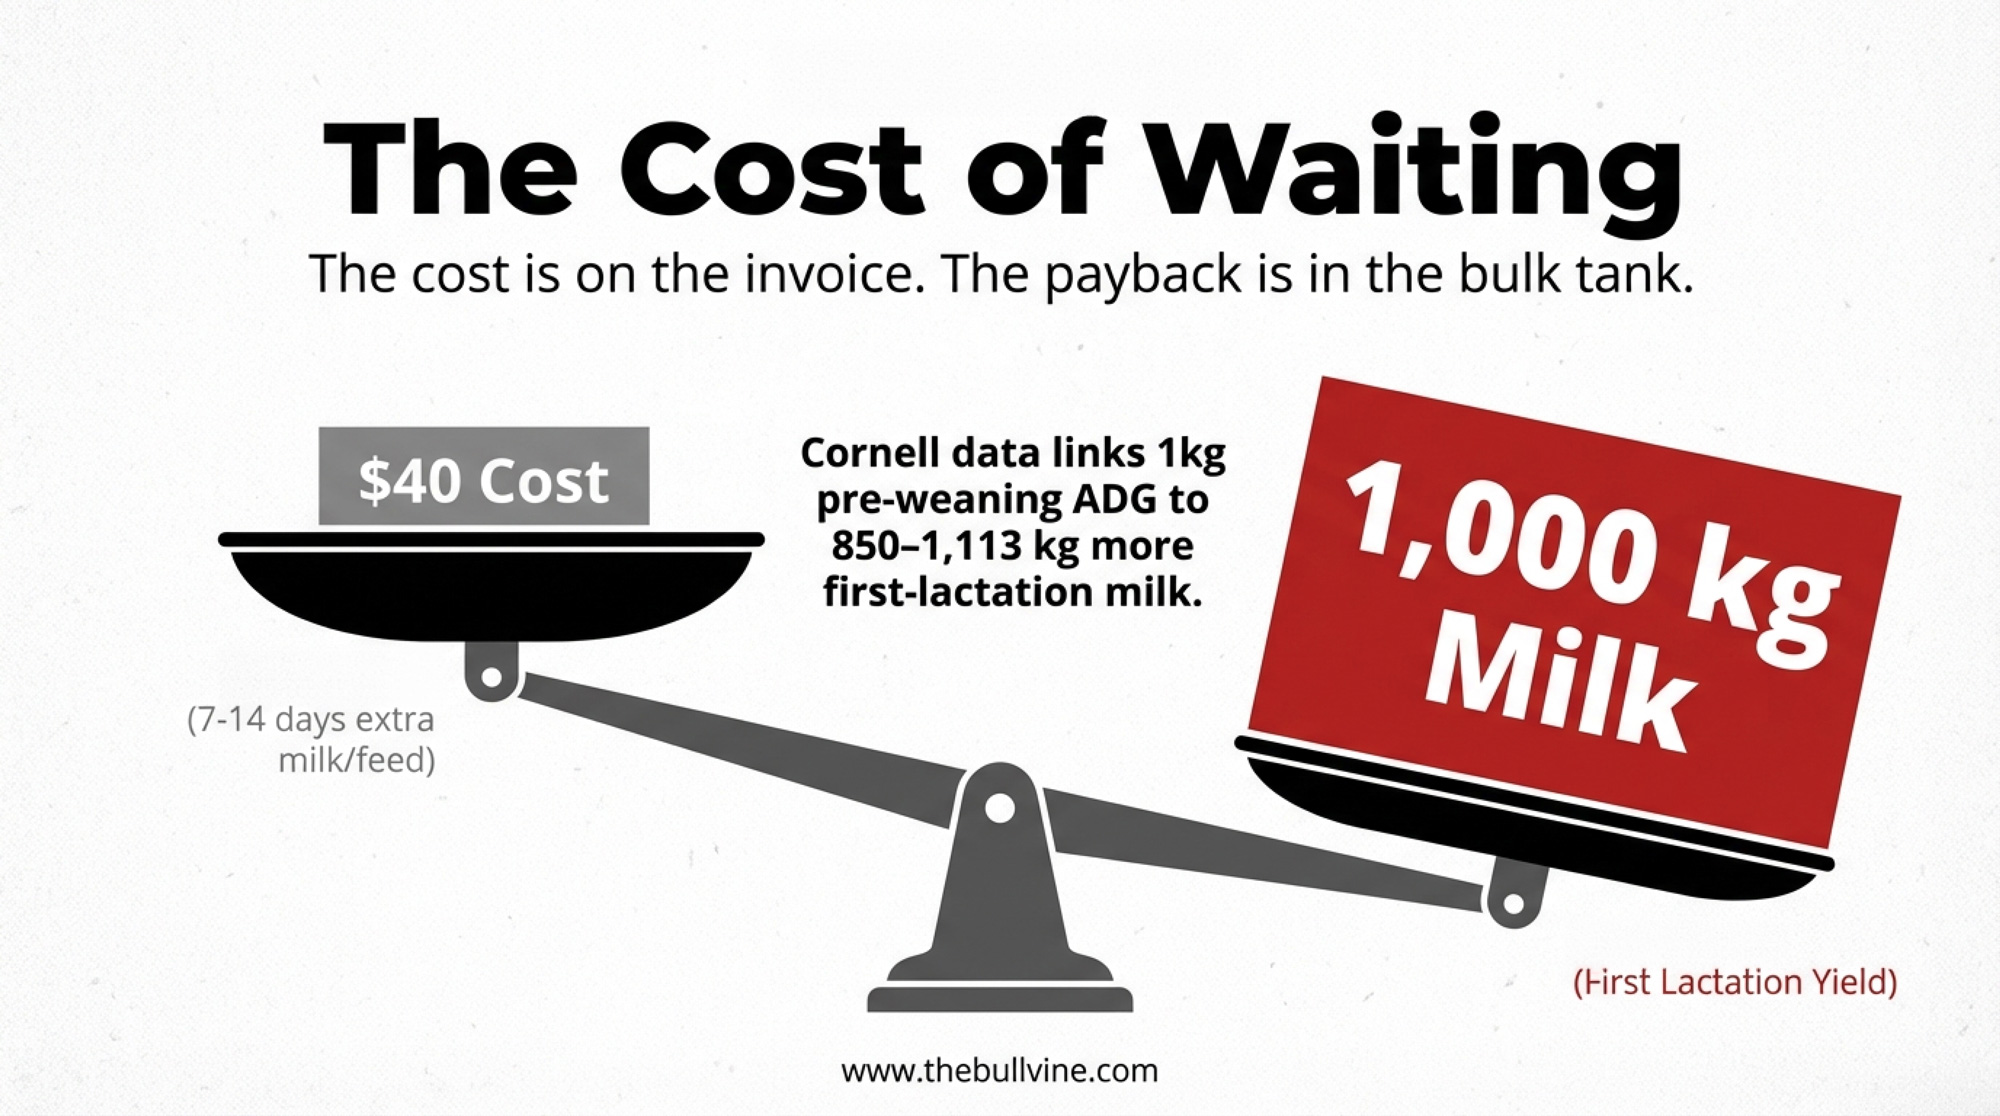
Here’s the paradox nobody planned for. Over the past decade, the industry moved hard toward feeding more milk — 8, 10, even 12 liters per day — because the data linking higher pre-weaning growth to first-lactation performance are strong. Soberon and Van Amburgh’s 2012 Journal of Dairy Science work at Cornell showed that for every 1 kg of preweaning ADG, heifers produced 850 kg more milk during first lactation in the university herd (1,244 animals) and 1,113 kg more in a commercial herd. Preweaning ADG accounted for 22% of the variation in first-lactation milk yield.
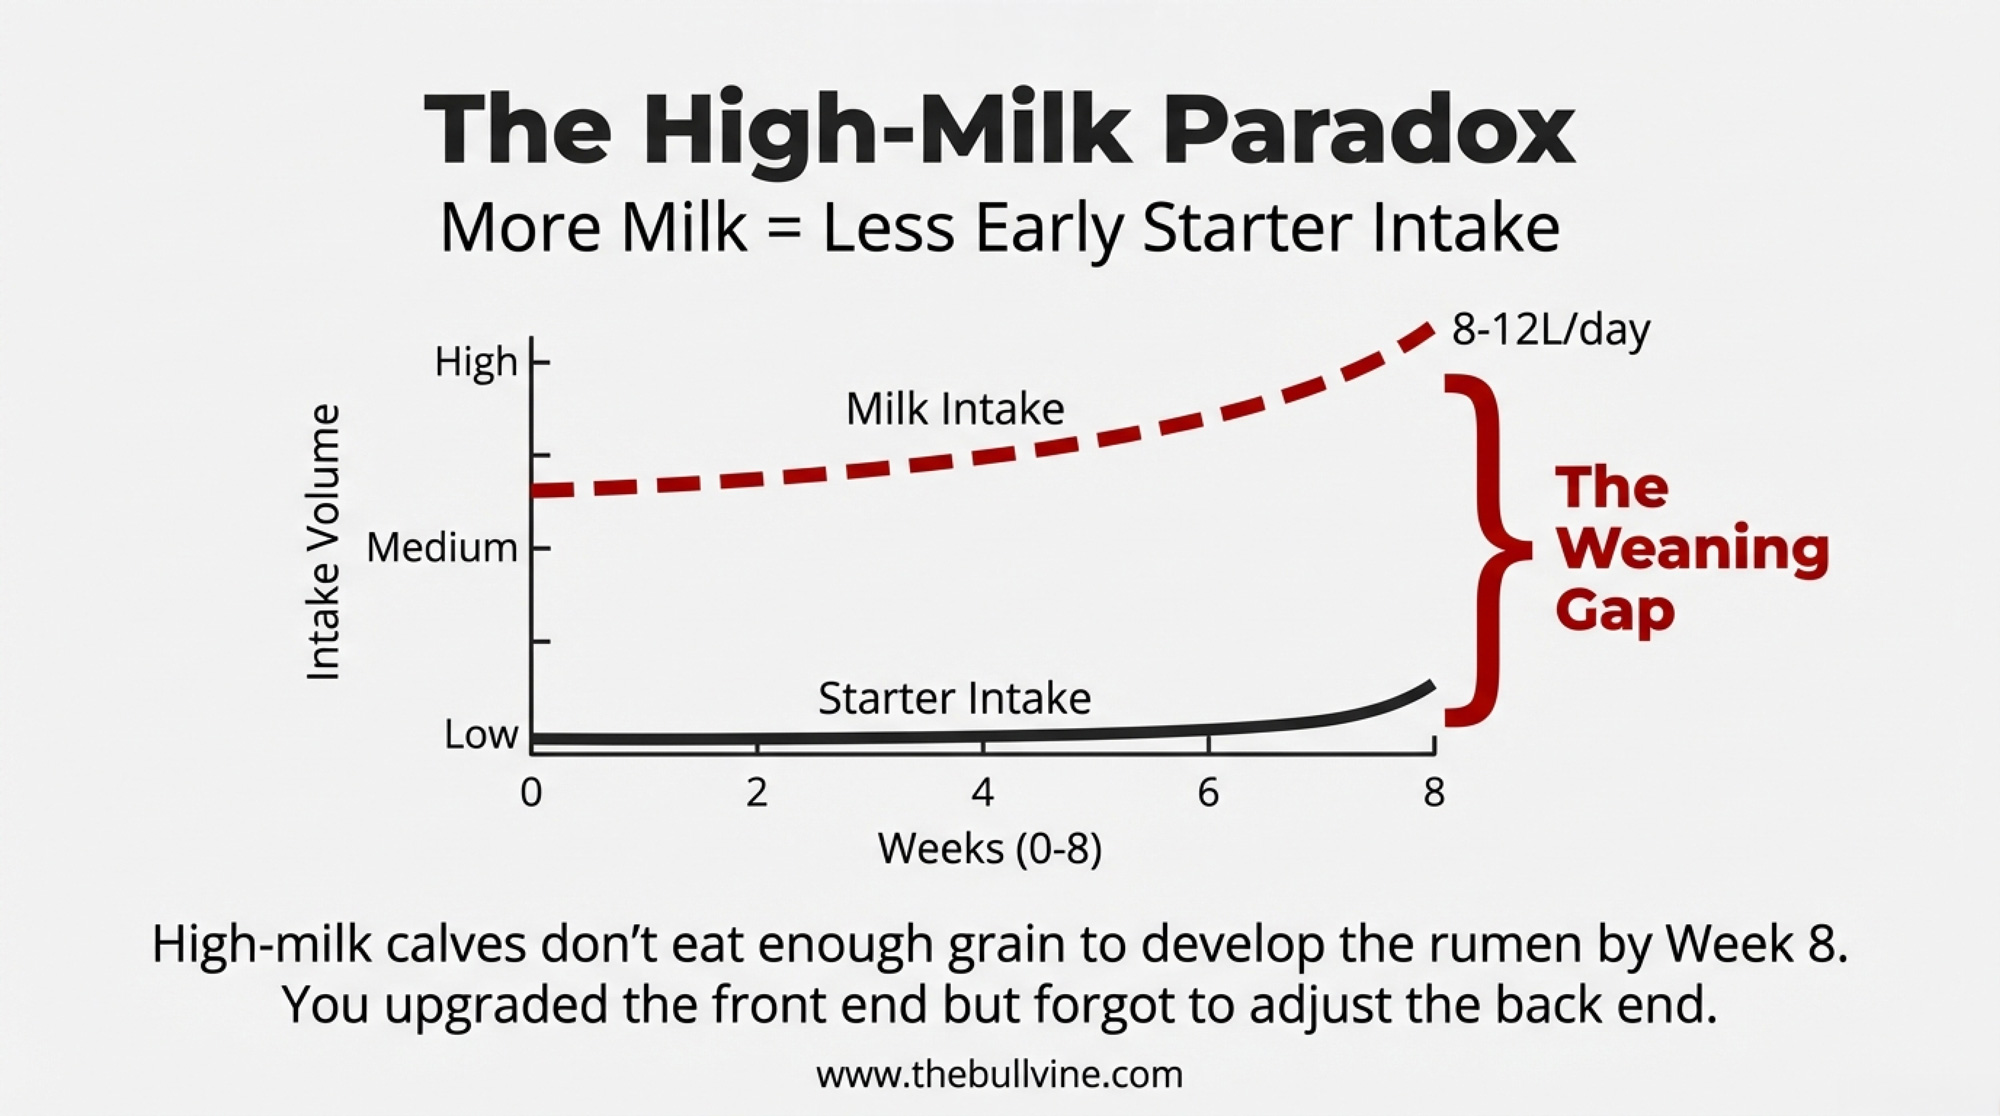
That was the right move. But higher milk intake suppresses early starter consumption.
The NASEM 2021 dairy nutrient requirements model confirms it: the more liquid energy a calf gets, the slower she ramps onto grain. Quigley sees the same thing in the field. When he looks at herds feeding 8–10 L/day and still weaning at 8 weeks, his verdict is blunt: more milk means less grain, so the rumen simply isn’t ready when the calendar says it’s time to quit milk.
The “glide path” to weaning has to be longer, or you drive calves into negative energy balance and ruminal acidosis during the transition — what he calls the “dark side” of feeding more milk. So we upgraded the front half of the feeding program without adjusting the back half.
James Drackley’s invited review in Applied Animal Science (Volume 41, Issue 3, June 2025) — “The Weaning Transition in Dairy Calves—Why So Traumatic?” — and Quigley in his ongoing Calf Notes work both point to this mismatch as the root of most post-weaning problems on well-managed dairies.
The Post-Weaning Slump You’re Probably Not Costing Out
NASEM 2021’s analysis of 64 studies found that solid-feed intake for weaned 8-week-old calves ranged from 2.16% to 4.45% of body weight — a wide range at the same age. Some of those calves are functioning as small ruminants. Others are essentially pre-ruminants with an underdeveloped fermentation vat.
When calves in that second group lose their milk, the energy math falls apart. Drackley’s review documents increased disease risk and depressed growth when weaning is too early or too abrupt, noting that “ruminal acidosis is likely more common than has been recognized and causes decreased intake, decreased growth, and diarrhea, especially in calves soon after weaning.”
Eckert et al. (2015, Journal of Dairy Science) showed this clearly: Holstein calves on an elevated plane of nutrition weaned at 8 weeks achieved 50% higher daily gains during the weaning transition than those weaned at 6 weeks. By three months of age, the later-weaned calves were 9 kg heavier and held that advantage through 150 days.
The 50% Energy Cut Nobody Talks About
Here’s a detail that doesn’t get enough attention. A lot of farms “step down” by simply cutting the afternoon milk feeding the week before weaning. Do the math on that. You just slashed ME intake by roughly 50% overnight.
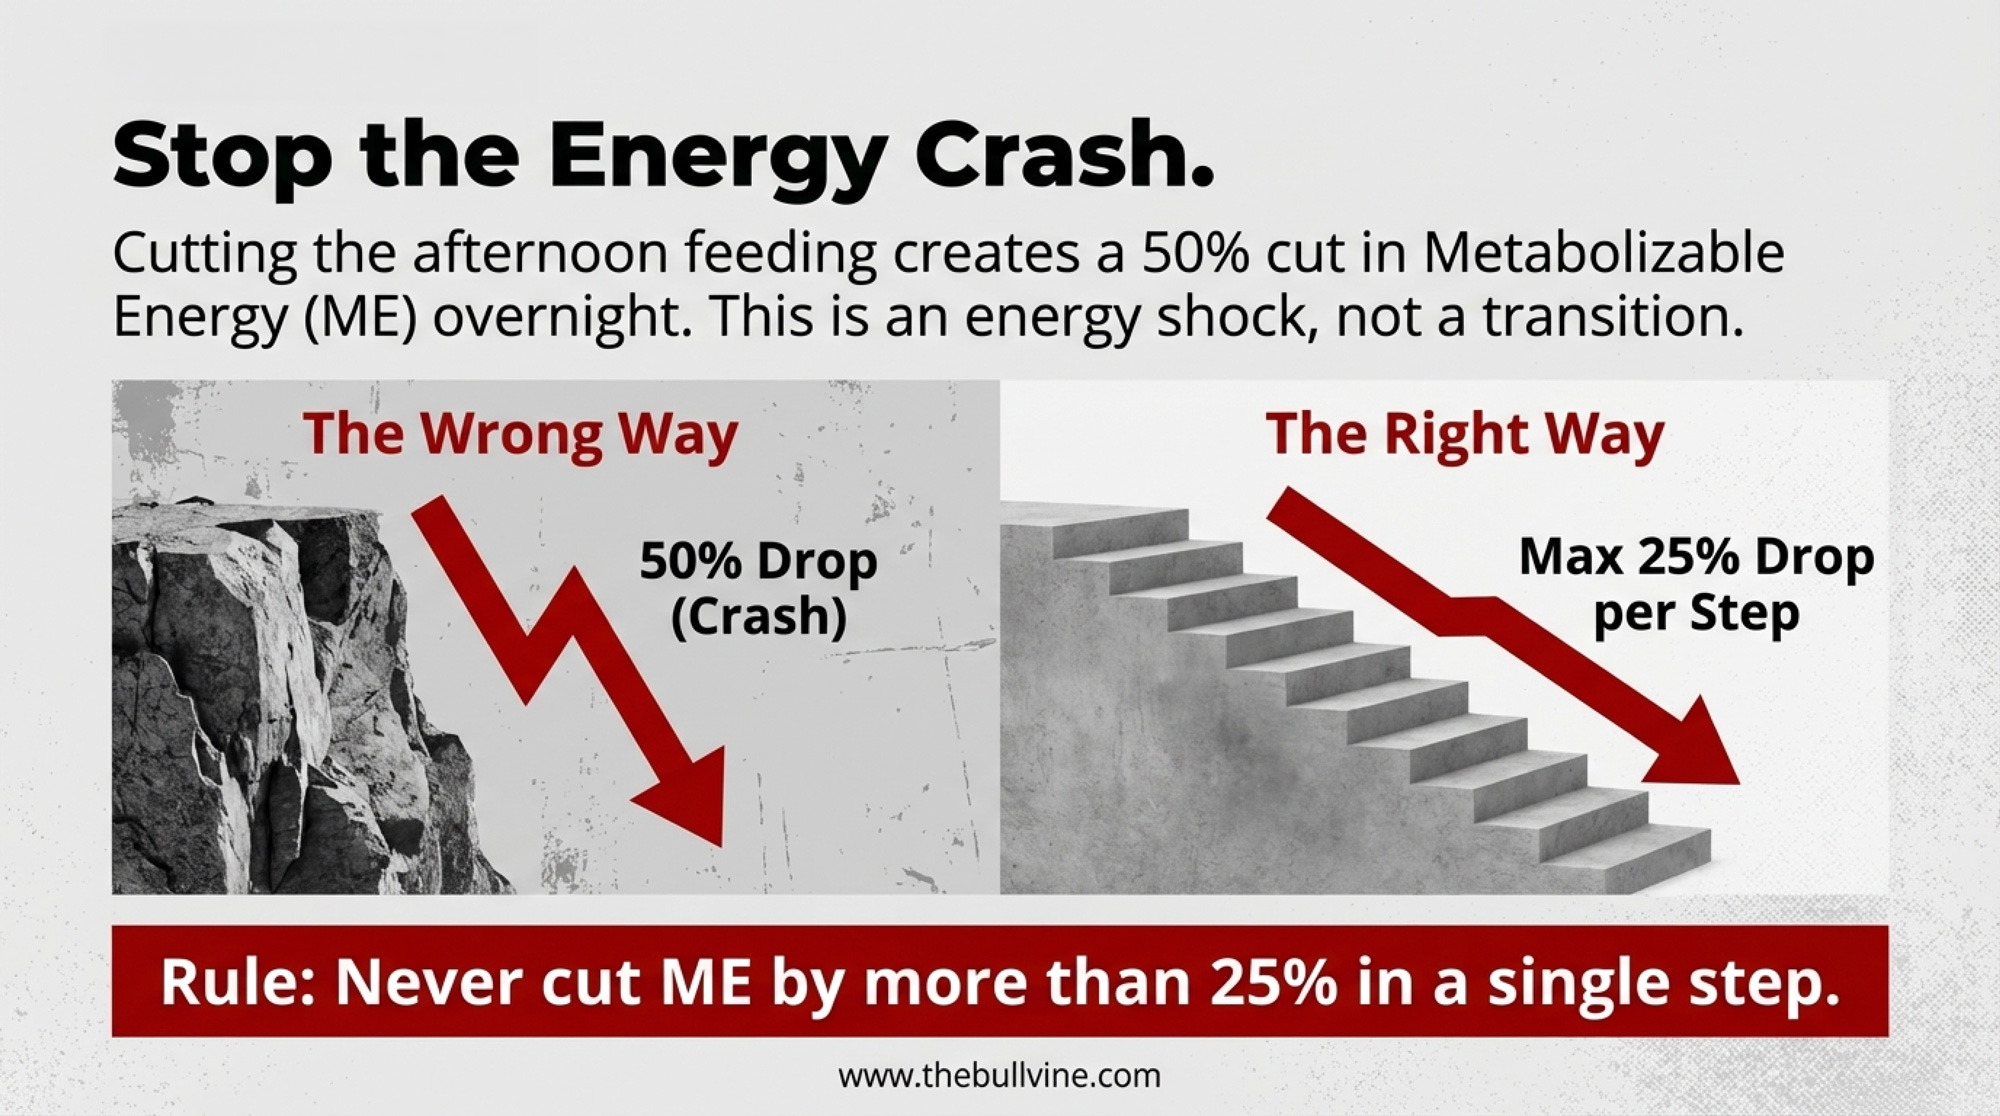
Quigley’s take is direct — a reduction greater than about 25% of ME intake is probably excessive. He’s upfront that hard numbers on that threshold don’t exist in the published literature, but the biology lines up. At a 50% ME cut, the calf may be barely above maintenance. You can’t expect an animal to keep growing under that kind of energy shock.
Think about it from the calf’s perspective: in nature, the cow’s milk production tapers gradually along her lactation curve. Calves don’t just quit drinking on a Tuesday afternoon. Wagner Farms’ 28-day step-down mimics that natural taper. Most 5–7 day transitions don’t even come close.
The pattern holds across a much larger evidence base. Welk, Neave, and Jensen at Aarhus University reviewed 44 studies in a 2024 Journal of Dairy Science systematic review (Volume 107, Issue 8, pages 5237–5258) and found “consensus for positive effects (or at least no negative effects) on overall growth of calves weaned at later ages, over longer durations, based on starter intake.” They also found that “weaning based on starter intake had superior growth and feed intakes compared with calves weaned at a fixed earlier age.”
Wagner Farms’ 28-day step-down isn’t radical. It’s just what the science — and basic biology — supports when you actually follow it.
How Much Starter Before Dairy Calf Weaning? Quigley Put a Number on It
Quigley’s team went looking for the threshold in digestibility data. His 2019 Journal of Dairy Science symposium review compiled results from 83 calves and 24 pens across three published studies and back-calculated how much metabolizable energy calves actually extracted from the starter at different ages. Early in life, the real energy yield was well below what the NRC tables predicted. The rumen’s microbial community and papillae simply weren’t mature enough.
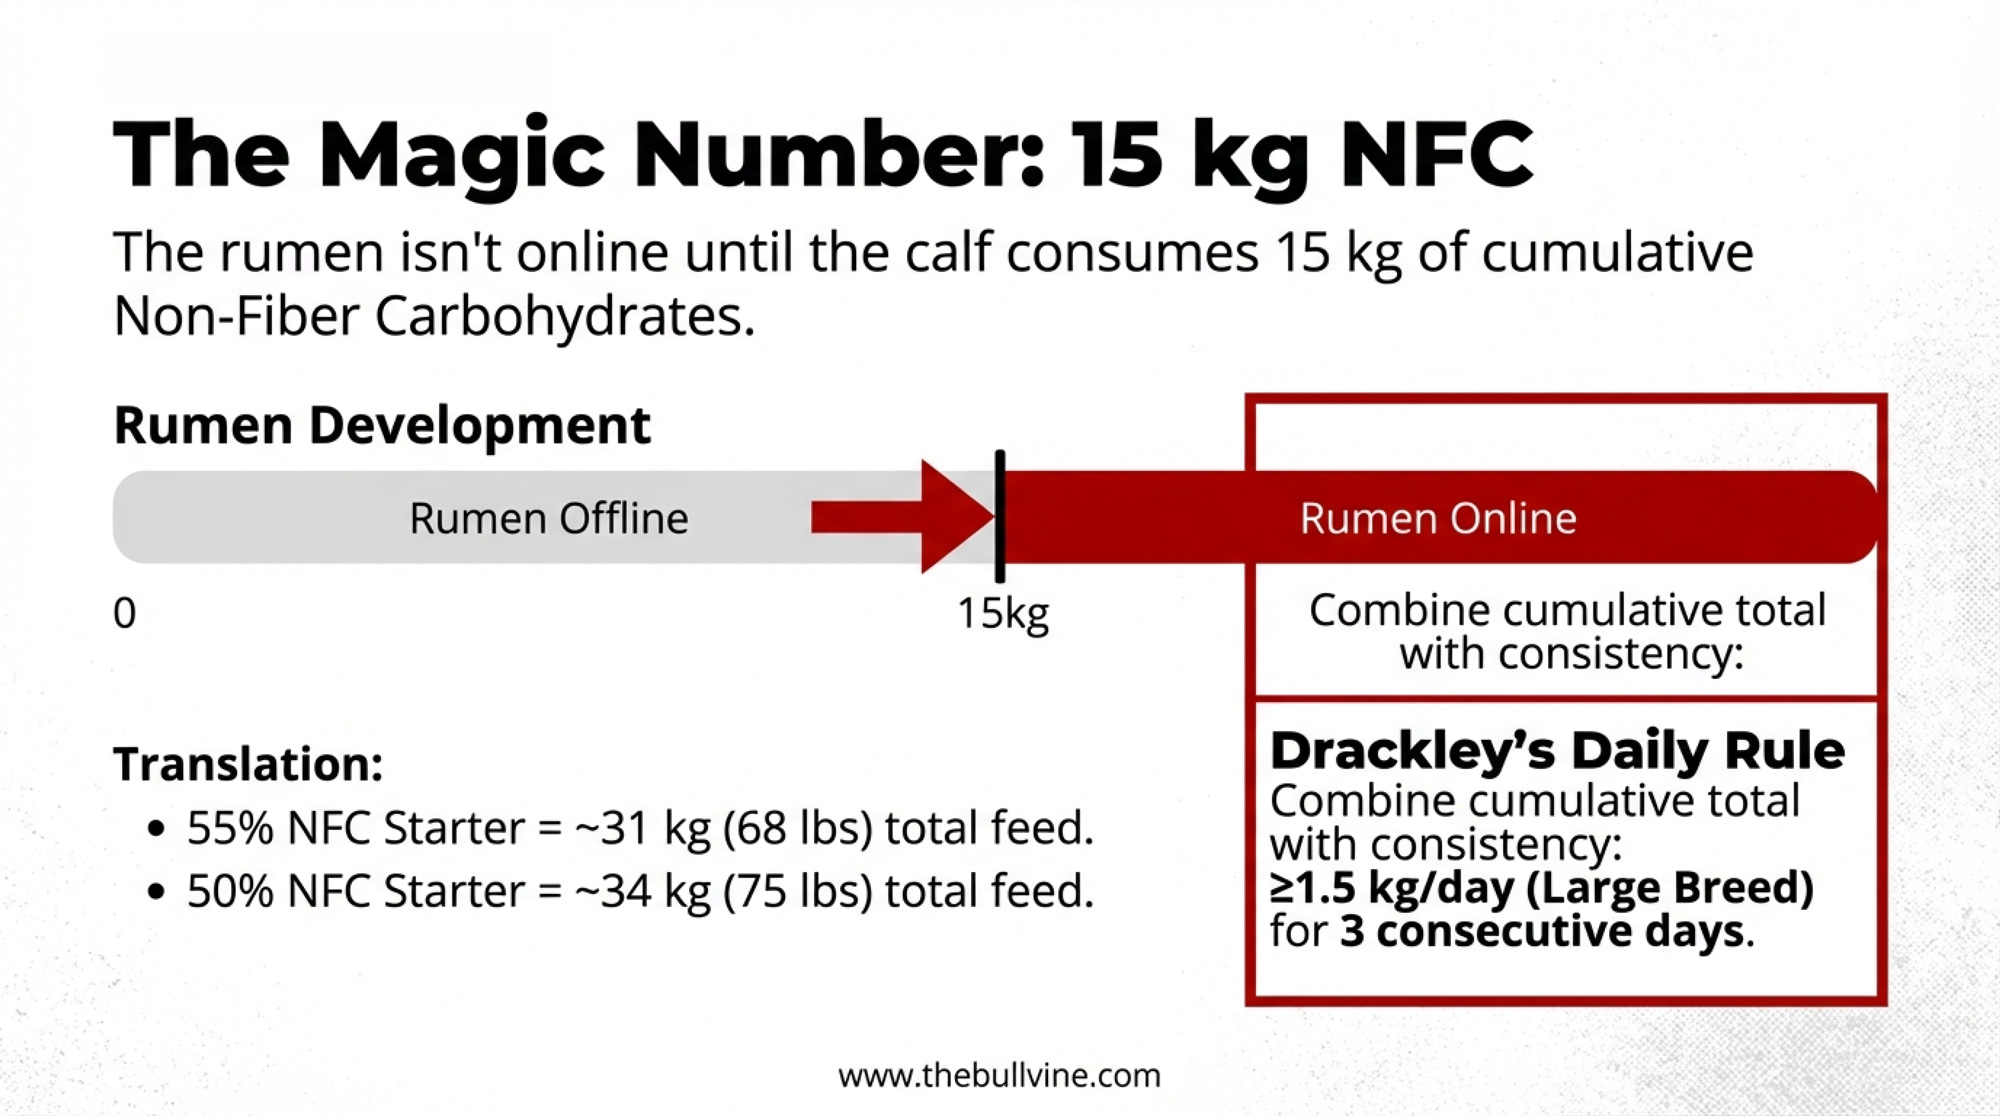
The tipping point: when calves consumed at least 15 kg of NFC, “ME calculated from digestibility measurements was similar to the ME calculated using NRC equations”—the rumen was finally “online.” Below it, your ration software is quietly overstating how much energy that grain is actually delivering.
When Quigley first shared that 15 kg cumulative NFC number, the research community’s reaction was basically, “Yes, biologically that makes sense.” The pushback wasn’t about the biology. It was the practical question every producer would ask next: how the heck do we know when a calf actually hits 15 kg?
For a typical calf starter at 55% NFC on a dry matter basis, that 15 kg of NFC works out to roughly 31 kg of total starter consumed as-fed. With a lower-NFC starter (50%), you’re looking at closer to 34 kg. The exact target depends on your starter’s composition.
Drackley’s daily intake gates pair with Quigley’s cumulative threshold. His Applied Animal Science review concluded that “calves should not be weaned until they are consuming an adequate amount of starter to allow the discontinuation of milk intake and should be weaned gradually rather than abruptly.” The Hoard’s Dairyman summary of his work raised the bar above the old rule of thumb: ≥1.5 kg/day starter DM for large-breed calves and ≥1.0 kg/day for small breeds, each for 3 consecutive days.
The old “1 kg/day for 3 days” isn’t enough for Holsteins. At that intake, NASEM modeling shows calves barely cover maintenance once milk disappears. Stack both gates — cumulative NFC near 15 kg and daily intake at the breed-appropriate threshold — and you’ve got a weaning signal grounded in physiology, not the calendar.
What Do CalfSim and NASCalf Tell You About Your Weaning Date?
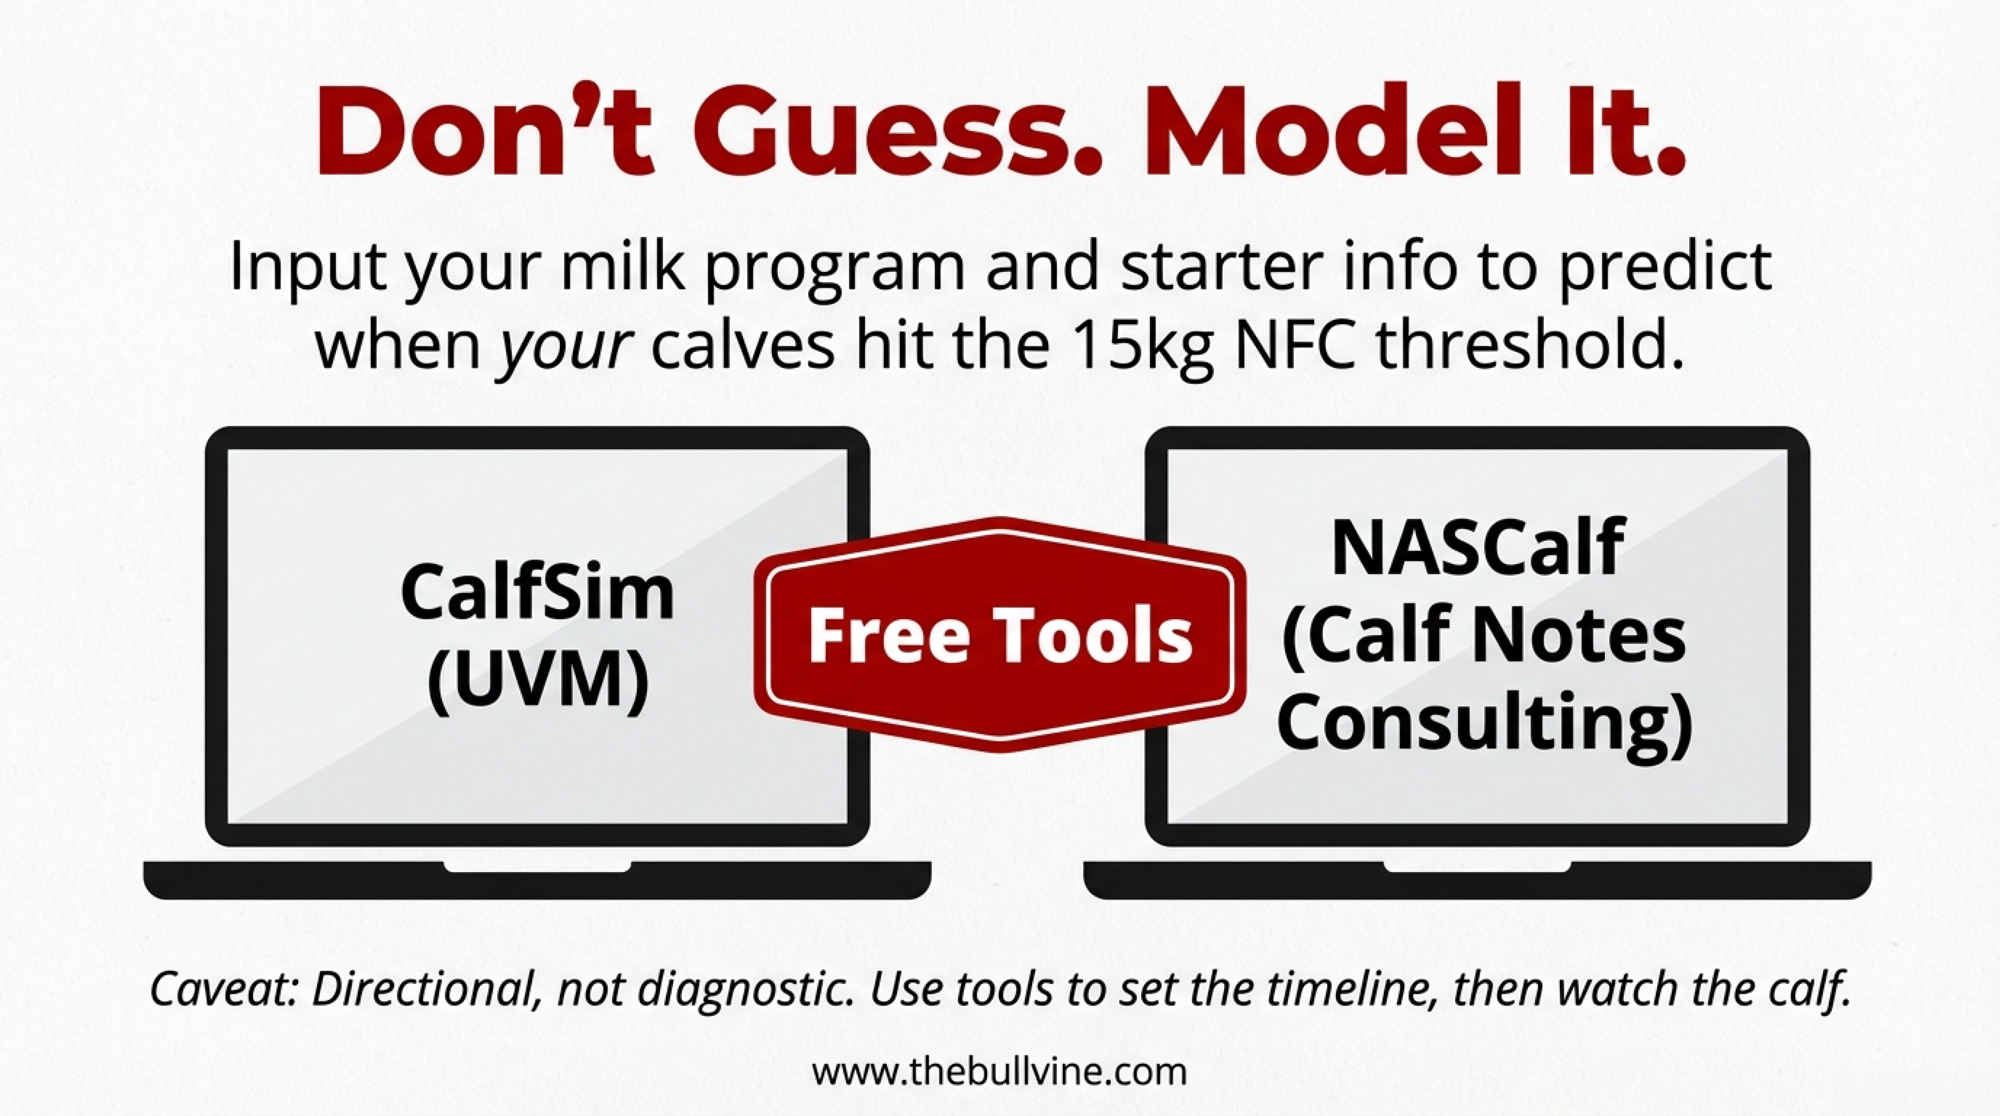
You don’t have to run this math on a whiteboard. Joao Costa’s group at the University of Vermont built CalfSim — a free, web-based decision-support tool that runs your feeding program using NASEM 2021 equations. Plug in breed, birth weight, milk program, starter composition, and environment. It gives you predicted daily and cumulative starter intake, NFC accumulation, ADG, bodyweight, and rearing costs.
Costa et al. (2025, JDS Communications) tested CalfSim against 27 studies covering 1,585 calves and 76 treatment groups. Bodyweight predictions hit an R² of 0.91 with an RMSE of 8.56 kg — meaning predictions can be off by about 19 lbs per calf.
Quigley’s own consulting work pushed the next step. Under Calf Notes Consulting, he launched NASCalf (tools.calfnotes.com), a more detailed intake and growth modeling tool built from the same biological logic. NASCalf goes deeper than CalfSim with a feed library, knowledge base, and more granular prediction of when calves accumulate enough NFC to support weaning.
A word of honest caution on both tools — and Quigley himself is the first to say it: don’t overpromise and underdeliver. CalfSim and NASCalf are models. They predict average performance. Your individual calves will scatter around that average, and farm-specific curveballs — a scours outbreak, a cold snap, poor-ventilation stress, a high-pathogen housing environment — can throw off even the best prediction. Think of the output as directional, not diagnostic. It tells you roughly when your program should get calves to the NFC threshold. It doesn’t tell you that calf #47 in hutch row B is ready today.
That said, directional beats are blind. Run your 6 L/day and 10 L/day programs side by side in either tool. You’ll see the high-milk calves reach the 15 kg cumulative NFC and 1.5 kg/day starter gates days or even weeks later. That gap is invisible until you model it.
What It Actually Costs — and What You Get Back
Let’s not pretend this is free. If calves need an extra 7–14 days on liquid feed, that’s real money. With U.S. Class III at just $14.59/cwt in January 2026 (USDA AMS, February 4, 2026) — and USDA’s own cost-of-production estimate showing expenses at $19.14/cwt against an $18.95 all-milk price — every input dollar has to earn its way back.
| Cost or Return Category | Per-Calf Impact | 150-Calf Herd (Annual) |
| Added Liquid Feed Cost (10 extra days @ $2/day) | +$20 | +$3,000 |
| Added Bedding & Labor | +$10–20 | +$1,500–3,000 |
| Total Added Rearing Cost per Calf | +$30–40 | +$4,500–6,000 |
| Reduced Treatment Costs (6% fewer treatments @ $25/treatment) | +$1.50 (savings) | +$225 (savings) |
| Faster Growth (15 kg heavier at 6 months) | Value: ~$45 (3% lower age at first calving) | +$6,750 |
| First-Lactation Milk Gain (+850 kg @ $0.35/kg) | +$297.50 | +$44,625 |
| Net ROI per Calf (24-month payback) | +$257.50–267.50 | +$38,625–40,125 |
| Break-Even Timeline | First lactation (month 24–26) | First lactation cohort |
Here’s the rough math on a 300-cow dairy raising 150 replacements per year. Extending weaning by 10 days, at roughly $2/day in added liquid feed costs, adds an extra $20 per head on the milk side alone. Factor in slower hutch turnover, additional bedding, and labor for intake monitoring, and the total added cost per head likely runs $3,0–40, depending on your system. On a tight-facility dairy, that 10-day extension could also require a temporary overflow solution or staggered starts for hutch turnover. Across 150 calves, that’s roughly $4,500–6,000 in added rearing expense.
A University of Wisconsin-Extension survey of 26 farms (published 2018) found autofeeder calves ran $6.35/day total vs. $5.84/day for individually housed, with liquid feed higher ($2.08 vs $1.60/day) but labor lower ($1.01 vs $1.39/day). Those costs have risen since, but the relative structure holds.
Against that, Soberon and Van Amburgh’s 2012 data showed 850–1,113 kg more first-lactation milk per 1 kg/day of preweaning ADG. Van Amburgh’s 2013 Journal of Animal Science meta-regression estimated roughly 1,551 kg of first-lactation milk per 1 kg/day of preweaning ADG. Even a conservative reading — say half the growth advantage holds — puts the first-lactation payback well ahead of the calf-barn cost.
But those returns arrive 24+ months later. That’s the tension: the expense hits now, the payoff compounds later. And the payoff only comes home if you’re keeping the heifer. If you’re raising beef-on-dairy calves headed for sale or feedlot, the NFC threshold still matters for health — but there’s no first-lactation payback. Run those numbers separately.
Three Phases to Testing It in Your Barn
Nobody’s asking you to overhaul your calf program overnight. Quigley summed it up neatly: farms need simplicity and consistency, or the best protocol on paper will die in the barn. Variation is hard to manage. Intake-based weaning only works if your team can repeat it.
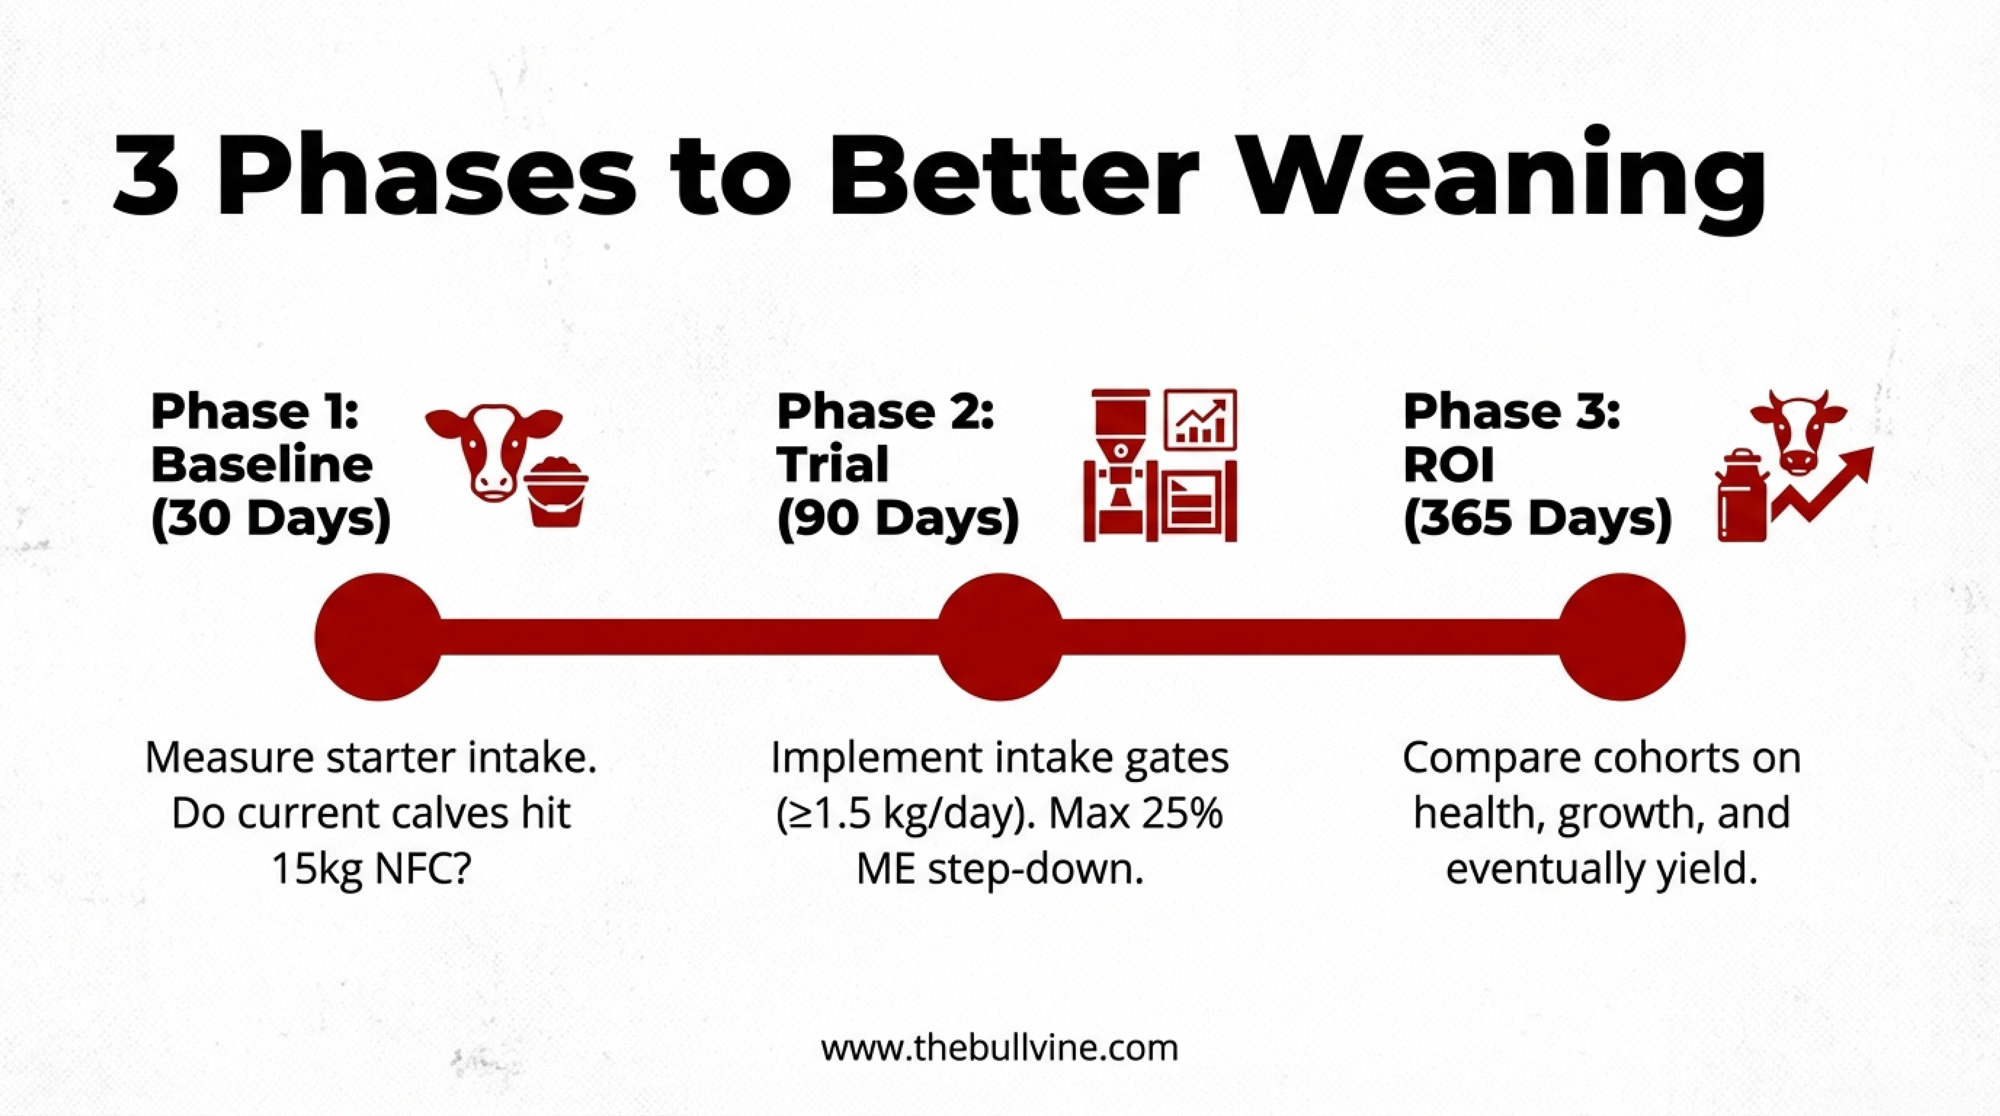
Phase 1 — 30-Day Baseline. Pick 15–20 calves approaching weaning. Measure starter intake with pre-weighed buckets and weigh-backs, even 2–3 times per week. Weigh calves before and after weaning. Run your current program through CalfSim or NASCalf. At the end of 30 days, answer one question: are your calves hitting the intake thresholds by the age you’re pulling milk?
Phase 2 — 90-Day Intake Gate Trial. Set a new rule: calves wean within an 8–10 week window, but only when they meet the daily starter gate. Stretch the step-down to 10–14 days minimum—and keep the ME reduction at any single step under 25%. Use CalfSim/NASCalf to predict when those gates should be reached, then compare that to what you see at the bunk. Track ADG and health events against your baseline.
Phase 3 — 365-Day Comparison. Run two cohorts for a full year — one on your old calendar, one on intake-based weaning informed by CalfSim or NASCalf. Track growth to 6 months, age at breeding, treatment costs, and first-lactation milk as records come in. This is where you build your own ROI case and decide how much complexity your crew can realistically manage every day.
| Performance Metric | Age-Based Weaning (8 weeks, calendar-driven) | Intake-Based Weaning (9–10 weeks, gradual step-down) |
| Post-Weaning Treatment Rate (%) | 12–15% | 6–8% |
| ADG Post-Weaning (kg/day, weeks 9–12) | 0.52–0.68 | 0.75–0.88 |
| Body Weight at 6 Months (kg) | 178–185 | 193–201 |
| Age at First Breeding (days) | 420–435 | 405–415 |
| First-Lactation Milk Yield (kg, 305d) | 10,200–10,800 | 11,050–11,650 (estimated +850 kg) |
| Calf Losses (%) | 5–8% (U.S. average) | 2–4% (improved health) |
| Added Rearing Cost per Calf | Baseline | +$30–40 (extra milk days) |
What This Means for Your Operation
If you’re feeding 4–6 L/day and weaning at 6–7 weeks, You likely need both more milk and a later weaning target. CalfSim or NASCalf can show which change moves the needle more.
If you’re feeding 8–10 L/day and weaning at 8 weeks: Your calves may be 1–2 weeks short of the NFC threshold. Run CalfSim or NASCalf with your actual starter analysis. If cumulative NFC at day 56 falls well below 15 kg, that’s your gap. And if your step-down protocol is “drop the afternoon feeding,” you’re probably cutting ME by 50% in one shot. That’s too much. Spread it out.
If you’re already weaning at 9–10 weeks with a gradual step-down, you may be closer than you think. A 30-day baseline will confirm it—and if your calves show no post-weaning ADG dip, don’t fix what’s working.
If you’re running an automated calf feeder that already tracks individual intake, you’ve solved the hardest part. Your feeder data tells you cumulative consumption. Map that to the NFC threshold using your starter’s NFC%, and you have an individualized weaning signal without any additional labor.
If you’re running a smaller herd raising 15–25 calves per year: Individual observation replaces modeling. You already know your calves. The value of CalfSim/NASCalf indicates whether your instincts align with the NFC math.
As a rough benchmark: if your current 8-week calves maintain an ADG above 0.75 kg/day for 2 weeks after weaning and your post-weaning treatment rate stays under 10%, you may not need to change anything. These aren’t published thresholds—they’re practical guideposts. Track your own data and let it tell you.
Quick NFC check for any program: Total starter consumed (kg as-fed) × 0.89 (DM factor) × your starter’s NFC%. For a 52% NFC starter, that’s roughly: total kg starter × 0.46. When that running total hits 15, you’re in the zone.
Key Takeaways
- 15 kg cumulative NFC (roughly 31–34 kg starter as-fed depending on NFC content) is Quigley’s research-based threshold for rumen readiness at weaning (Quigley et al., 2019, JDS).
- Daily intake gates: ≥1.5 kg/day for large-breed calves, ≥1.0 kg/day for small breeds, for at least 3 consecutive days before finishing weaning (Drackley, Applied Animal Science, Vol. 41, Issue 3, June 2025).
- Don’t cut ME by more than 25% at any single step-down. Dropping the afternoon feeding slashes ME intake by roughly 50% — that’s a maintenance-level energy shock, not a weaning transition. Taper gradually, like the cow’s own lactation curve would.
- Wagner Farms weans by intake with a 28-day step-down. The year Hoard’s profiled them, they lost zero calves. The calendar didn’t earn that result.
- CalfSim and NASCalf are directional, not diagnostic. They predict average performance — your individual calves will scatter around that average, and farm-level curveballs will shift the timeline. But directional beats blind, and both tools finally answer the question producers have been asking: when should my calves be ready?
- The extra milk days aren’t free — but the post-weaning slump isn’t free either, and only one of those costs shows up on your feed invoice.
The Bottom Line
Laura Raatz doesn’t check the calendar to decide when milk stops at Wagner Farms. She checks the bucket. And the science — from Quigley’s NFC threshold to Drackley’s Applied Animal Science review to Welk’s 44-study systematic review — says the bucket is right.
Pull your CalfSim or NASCalf report. Does cumulative NFC at your current weaning age hit 15 kg — or are you weaning calves that aren’t ready?
Learn More
- Breaking the Rumen Code: Six Science-Backed Strategies That Deliver $2,200+ More Lifetime Revenue Per Calf – Delivers six concrete tactics to slash replacement costs by 22% and program calves for 12% higher first-lactation yields. This roadmap arms you with immediate implementation steps to transform your calf barn from a cost center into a profit engine.
- 438,000 Missing Heifers. $4100 Price Tags. Beef-on-Dairy’s Reckoning Has Arrived. – Exposes the structural heifer shortage that will dictate your herd’s expansion limits through 2028. This strategic breakdown reveals why your current breeding mix might be a survival risk and how to reposition for a high-cost replacement market.
- 5 Technologies That Will Make or Break Your Dairy Farm in 2025 – Reveals the high-ROI precision tools, from calf wearables to AI-driven sensors, that allow one person to manage 30% more animals. This guide helps you separate flashy gadgets from the disruptive systems that actually protect your margins.
 Join the Revolution!
 Join the Revolution!
Join over 30,000 successful dairy professionals who rely on Bullvine Weekly for their competitive edge. Delivered directly to your inbox each week, our exclusive industry insights help you make smarter decisions while saving precious hours every week. Never miss critical updates on milk production trends, breakthrough technologies, and profit-boosting strategies that top producers are already implementing. Subscribe now to transform your dairy operation’s efficiency and profitability—your future success is just one click away.


