


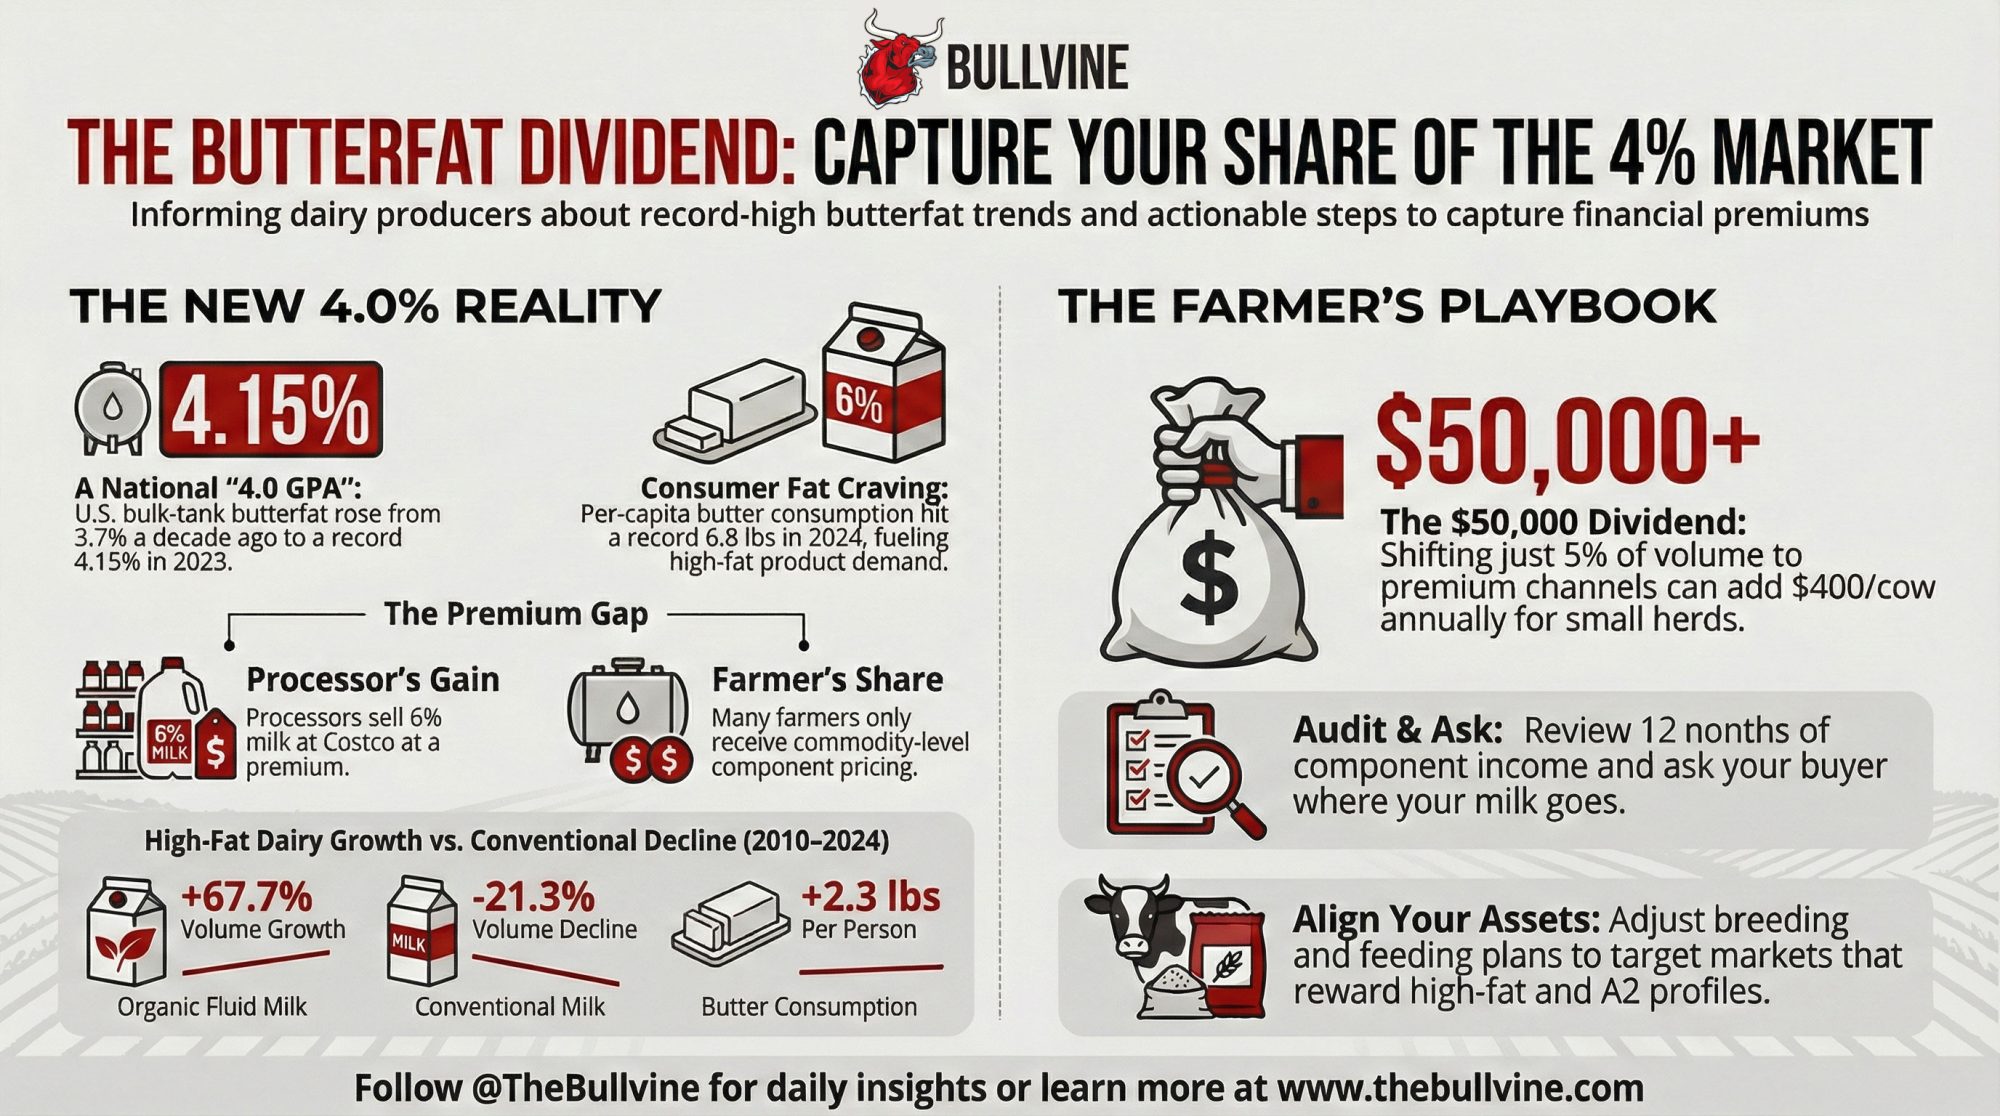
Costco is selling 6% milk. Your tank’s butterfat is over 4.0%. So who’s actually getting the $50,000 premium—your farm, or your processor?
Executive Summary: In 2024, U.S. bulk‑tank butterfat is on track to clear 4.0% every single month, according to USDA data showing annual averages rising from about 3.7% a decade ago to over 4.1% today. At the same time, component markets now pull close to 60% of milk check income from butterfat, per‑capita butter consumption has climbed to a record 6.8 lb, and organic fluid milk volumes have grown nearly 70% since 2010—all strong signs that the market will pay for fat when it’s packaged and positioned properly. This article uses Amul’s new 6% milk at Costco and Alexandre Family Farm’s 6% regenerative organic A2 milk to show how processors and brands are already turning rich milk into high‑margin products. For a 120‑cow herd averaging 80 lb at 4.2% fat, the math is straightforward: moving just 5% of your volume into the right premium channel can conservatively add about $50,000 a year, or roughly $400 per cow, if you control the story and the contract. From there, the piece lays out a clear playbook—component income audits, smarter conversations with co‑ops about where your milk really goes, tightly scoped premium milk trials, and breeding/feeding plans aligned with realistic markets—for small, mid‑size, and large herds. The core takeaway is uncomfortable and straightforward: in a 4.0% butterfat world, the question isn’t whether rich milk will sell, it’s whether the butterfat premium ends up on your milk check or on someone else’s.

You know that feeling when you walk past the milk case, and something just doesn’t look like the “usual” gallon? That’s been happening a lot lately with one particular jug: Amul Gold – 6% butterfat milk – sitting in U.S. Costco coolers.In March 2024, Michigan Milk Producers Association (MMPA) inked a deal with Gujarat Cooperative Milk Marketing Federation (GCMMF), the massive Indian co‑op behind the Amul brand, to supply Amul‑branded fresh milk in the U.S., with MMPA providing the milk and processing and Amul handling the marketing and brand. In MMPA’s own Milk Messenger article “The Taste of Home,” the co‑op lays out the product line: Amul Gold at 6% milkfat, Shakti at 4.5%, Taaza at 3.25%, and Slim ‘n’ Trim at 2%, all bottled at Superior Dairy in Canton, Ohio, which MMPA acquired through its 2021 purchase of Superior’s parent company to expand extended‑shelf‑life and value‑added capacity.
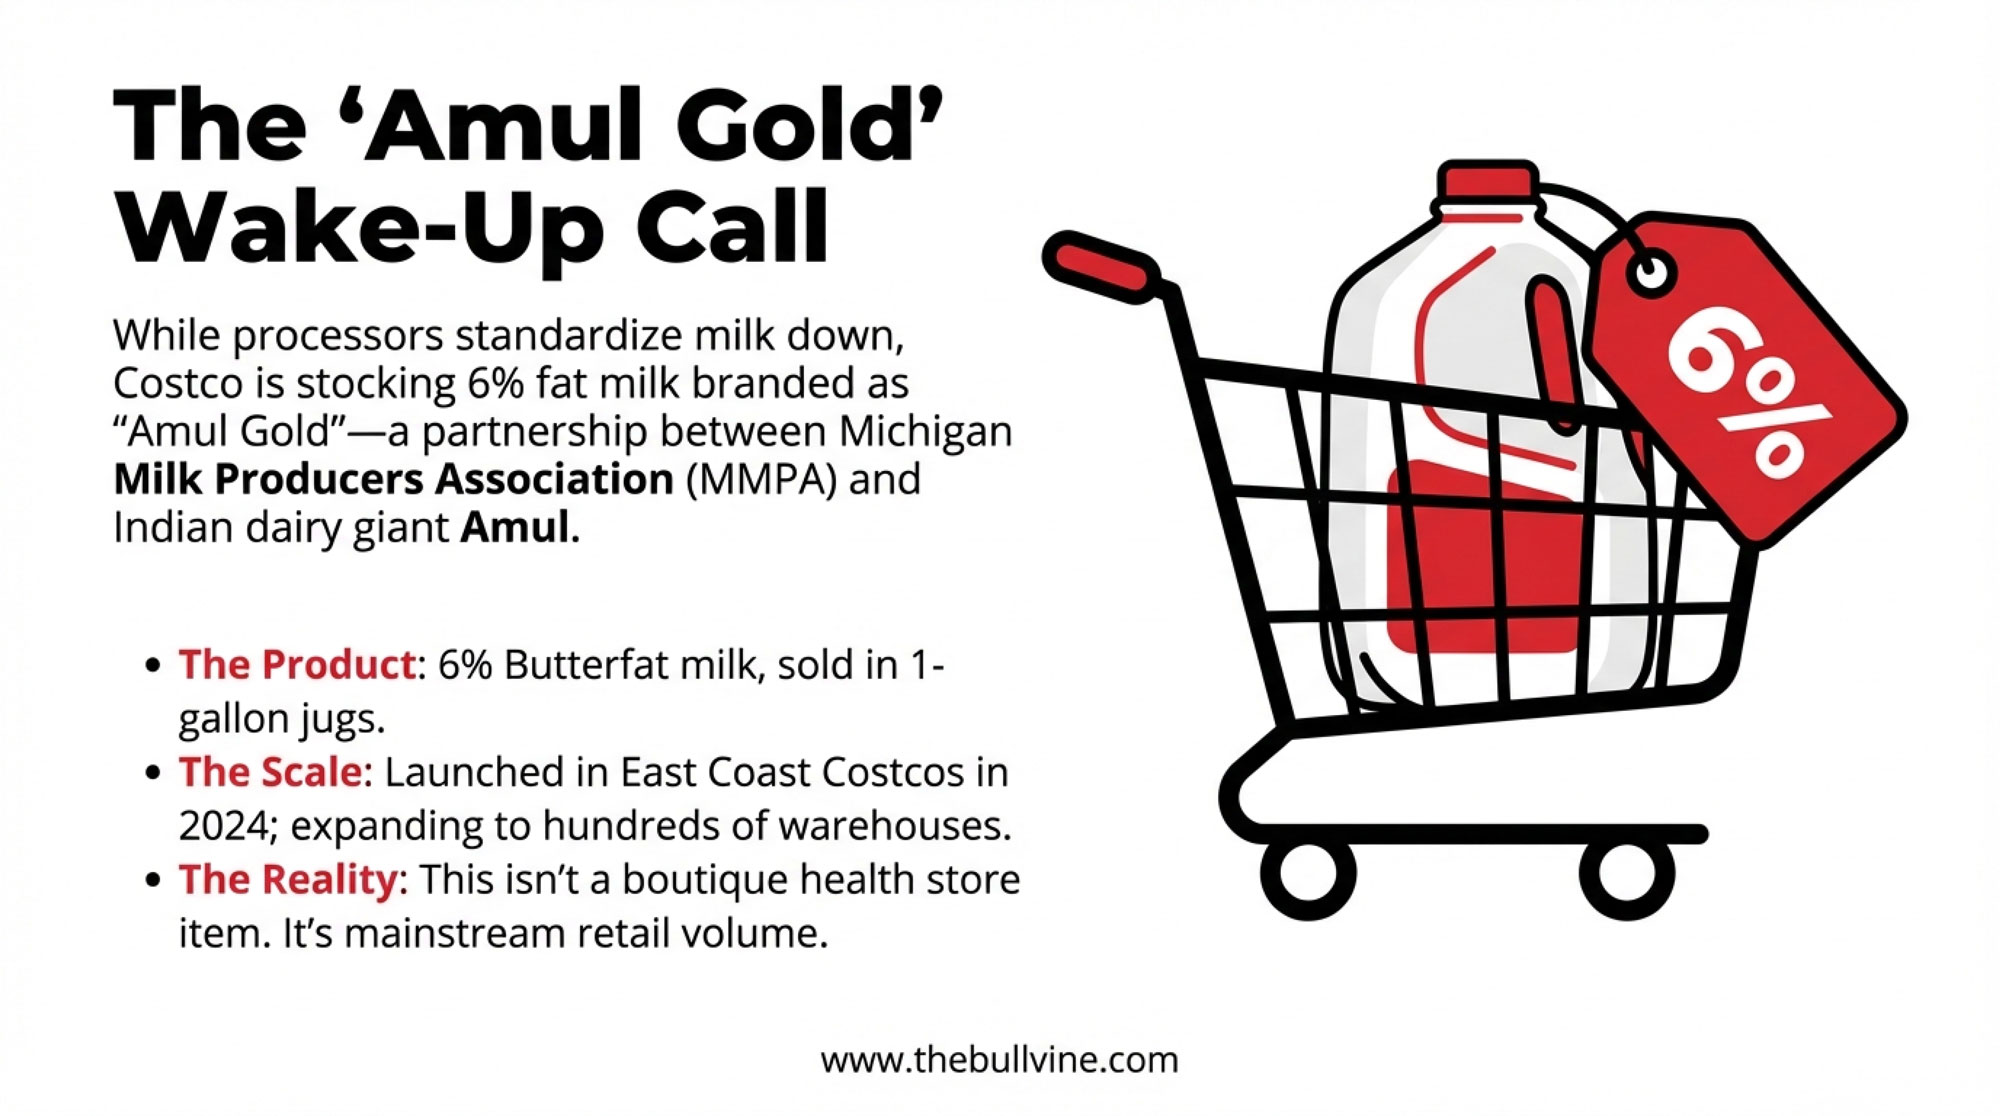
Indian coverage, including the Times of India and GCMMF’s own press release, describes how Amul Gold’s U.S. launch in 2024 put 3.78‑liter (1‑gallon) jugs of 6% milk into Costco stores on the East Coast, with plans to expand into hundreds of warehouses. You can see the product yourself in Costco’s same‑day grocery listings as “Amul Gold 6% Fat Milk 1 Gal.”
On the surface, it’s just another SKU. What’s interesting here is that this high‑fat jug showed up right as three big forces were already shifting under your feet: your cows’ butterfat performance, consumer demand for milkfat, and school milk policy.
Your Butterfat Has Quietly Gone to the Next Level
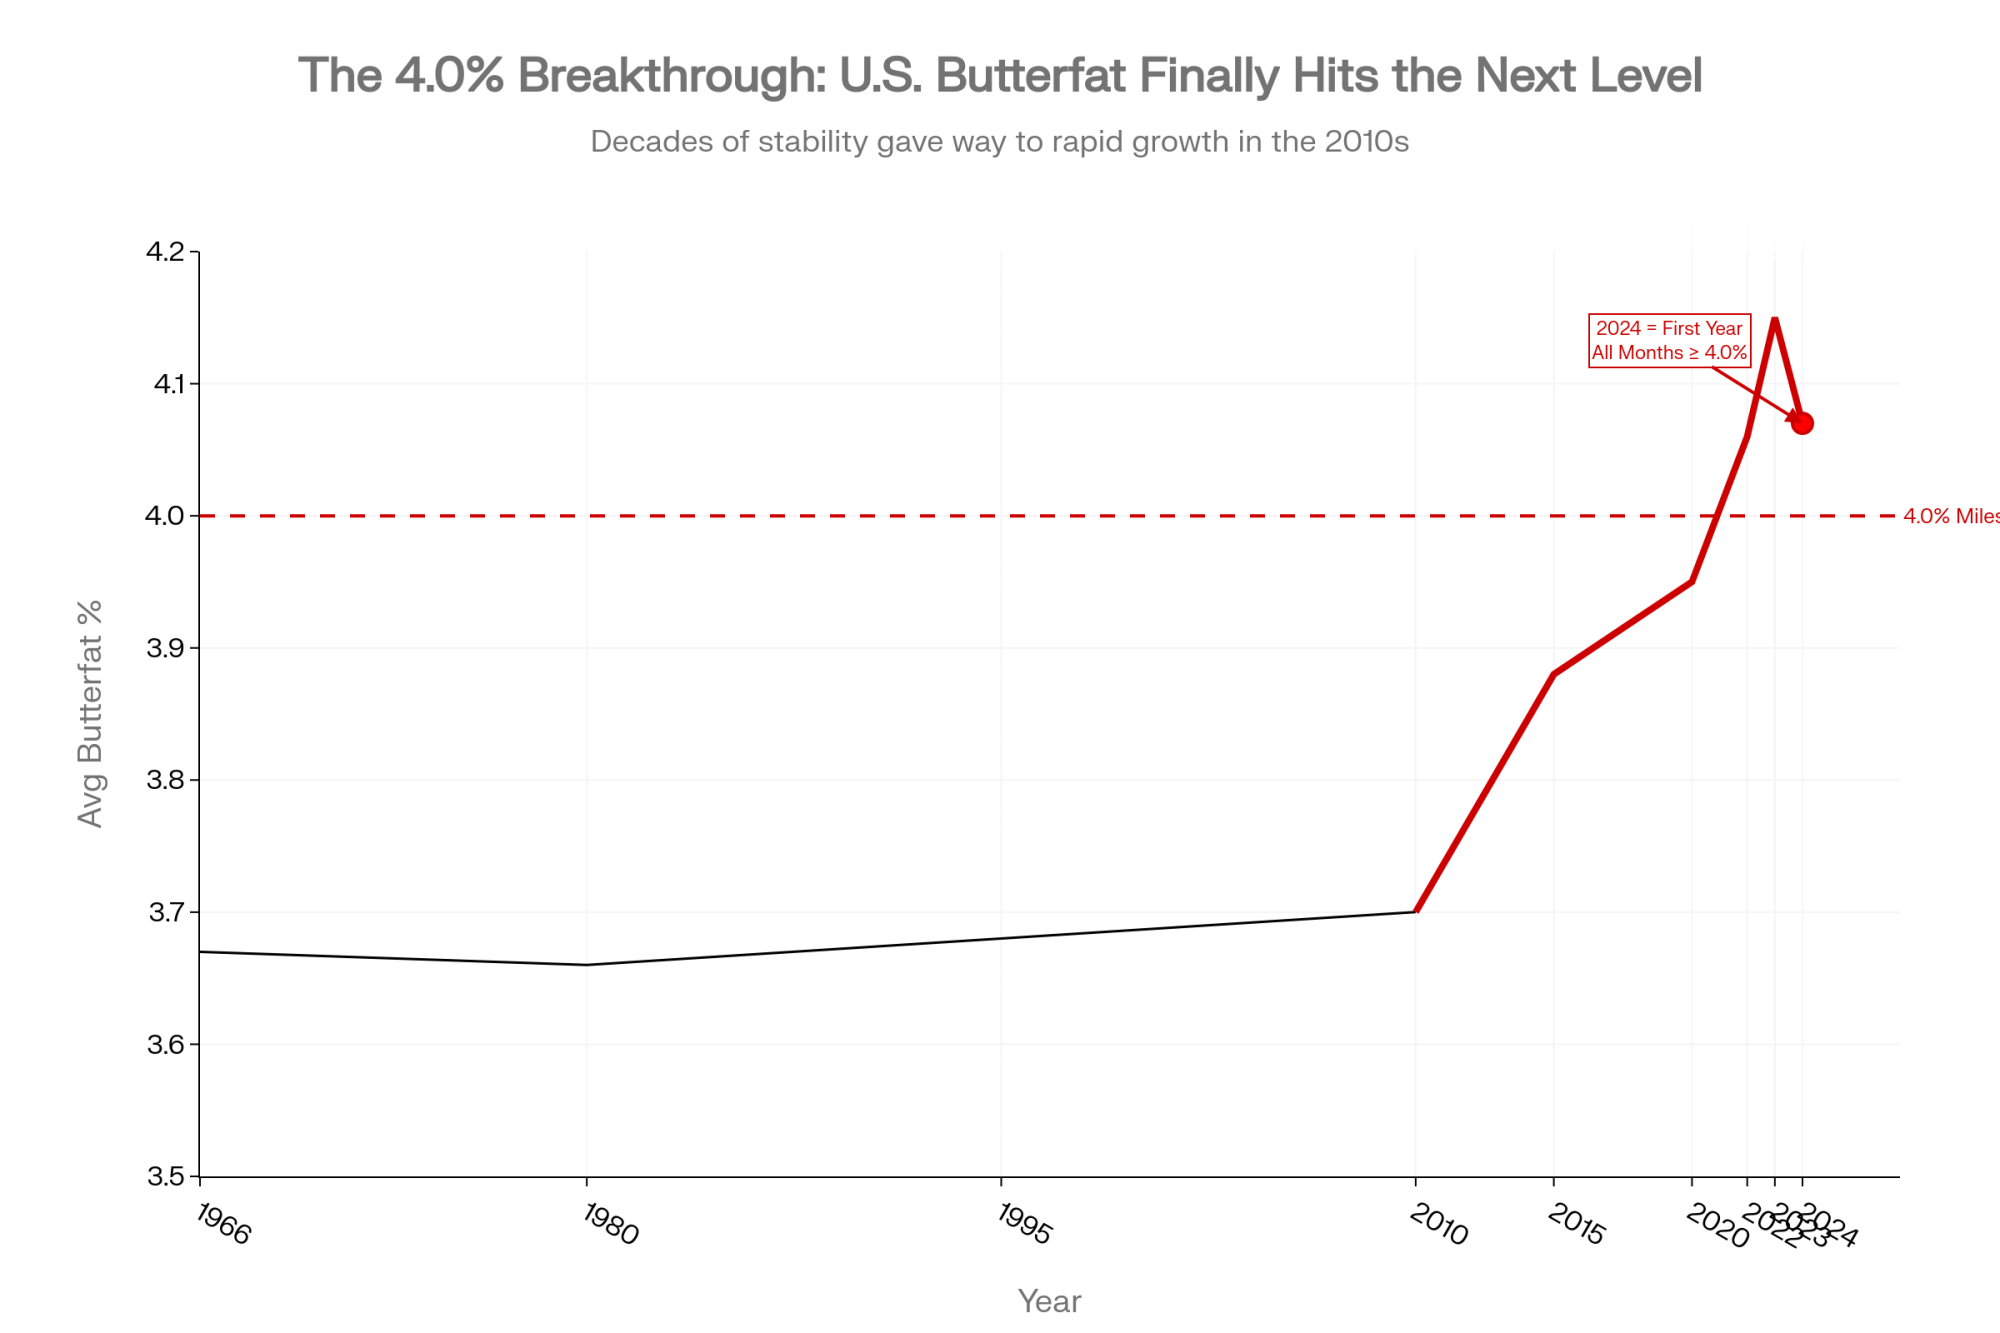
If you look back a decade, you’ve probably felt it in your own bulk tank: butterfat is not what it used to be. USDA component data showed that from 1966 through 2010, the national average butterfat held within a narrow 3.65–3.69% band. Starting in 2011, things began to change. From 2011 to the present, U.S. bulk‑tank butterfat has increased from 3.70% to 4.15% annually, reaching 4.06% in 2022 and 4.15% in 2023—each year a new record. They described it as U.S. dairy finally earning a “4.0‑plus GPA” on butterfat.
The seasonal detail is important. In 2022 and 2023, some warm‑weather months still dipped just under 4.0%; July 2023, for example, averaged 3.99% fat. In 2024, that last “holdout” disappeared when July came in at 4.07% butterfat. Reports showed that 2024 isn’t fully “in the books” yet, but based on long‑term seasonal patterns, the 4.07% in July is likely the low point, meaning every month of 2024 lands at or above 4.0% for the first time on record.
You see the same pattern up close in regional data. In the Mideast Federal Order (FO 33), covering Ohio and parts of surrounding states, the January 2024 bulletin shows 2023 producer milk averaging 4.06% butterfat and 3.22% protein, with monthly butterfat ranging from 3.91% in July to 4.25% in December. Regional butterfat variation shows several orders in the Upper Midwest and Pacific Northwest now averaging over 4.0% butterfat on an annual basis, not just in the cool months.
On the ground, that lines up with what many of us hear in barns and on service calls. In Wisconsin operations and other Upper Midwest freestall herds, it’s become pretty normal to see Holstein bulk tank butterfat in the low 4% range and protein just above 3.2% when fresh cow management, the transition period, and cow comfort are all dialed in. Those numbers match the Federal Order averages. Out west and in the Pacific Northwest, extension and breed statistics often show Jersey herds averaging in the high 4s for butterfat, and field reports from Jersey and Jersey‑cross dry lot systems and grazing herds in California and the PNW frequently mention herd tests in that high 4% range when rations and dry cow programs are tuned for components.
Genetics are pushing in the same direction. In its April 2025 update, the Council on Dairy Cattle Breeding (CDCB) adjusted the Net Merit index to place greater emphasis on fat yield and slightly less on protein yield, while increasing the weight on health and efficiency traits such as productive life and disease resistance. CDCB and USDA’s Animal Genomics and Improvement Laboratory outlined these changes as part of the 2025 index revision, and analysts summaries made it clear that solids as a whole still drive the index, but the tilt has moved more toward butterfat to reflect current price relationships.
So, what farmers are finding is that butterfat performance has already moved up a full notch. Between genetics, better fresh cow management, improved transition protocols, and more attention to cow comfort in freestalls, robots, and even dry lot systems, your bulk tank is richer than it was ten years ago. Amul Gold just happens to be one of the first big retail labels to shout “6%” from the cooler.
Why Plants Keep Skimming Cream Instead of Bottling 6%
Now, if you flip the cap around and look at this from inside the processing plant, some of the decisions that frustrate us on the farm side start to make more sense.

Most fluid plants are built around standardization. Milk comes in at whatever butterfat level your cows produce that day—often north of 4.0%. The plant uses separators and blenders to standardize “whole milk” to 3.25% butterfat, set 2% and 1% at their proper levels, and strip out the excess cream. That cream becomes butter, whipping cream, and other fat‑rich products that flow through established channels.
From a processor’s standpoint, there are some solid reasons to stick to that routine:
- Labeling and consistency. Keeping whole milk at 3.25% keeps labeling consistent and straightforward across huge volumes.
- Cream as a revenue stream. As bulk‑tank butterfat levels rise, that “extra” cream is not just a by‑product; it’s a major source of income. U.S. butter production hit 2.15 billion pounds in 2020, the highest on record at the time, and, through November 2024, had already reached 2.20 billion pounds, setting up 2024 as the new record year once December numbers are in. They also emphasized that from January to November 2024, the U.S. imported a record 204.4 million pounds of butter and milkfat, up 27% from 2023 and roughly 10 times the 2013 level, underscoring just how strong demand for milkfat has become.
- Risk management. Butter and nonfat dry milk prices feed into the Class IV formula, and co‑ops have long‑established hedging tools and risk strategies built around those commodities. A 5–6% fluid milk SKU doesn’t slot neatly into those existing tools.
Retailers add another layer. Fluid milk has long been treated in grocery research as a “known value item”—one of those core products, like bread and eggs, that shoppers use to judge whether a store is “expensive.” Category managers are very sensitive to shelf prices on those items. They know that if a gallon looks high, it can hurt the store’s price image out of proportion to the profit on that gallon.
Put that all together, and it’s not surprising that plants and co‑ops tend to standardize most fluid milk to fixed butterfat levels and capture the majority of butterfat value through cream and butter sold into manufacturing and retail channels. The Amul–MMPA venture doesn’t tear up that playbook, but it does show that with the right plant capacity, a strong brand, and a clear target audience, processors can occasionally step outside of it and get paid for richer milk in the jug.
What the Nutrition Science Actually Says About Dairy Fat
For years, much of what happened to fluid milk fat levels was driven less by economics than by nutrition policy. So it’s worth taking a quick look at where the science stands today.
You probably remember that earlier versions of the Dietary Guidelines for Americans strongly pushed low‑fat and fat‑free dairy. That was based on a broad concern about saturated fats in general. Over the last decade, though, the evidence has become more nuanced regarding dairy fat.
In 2021, a PLOS Medicine study led by Kathy Trieu used odd‑chain saturated fatty acids—15:0 and 17:0—as biomarkers of dairy fat intake in a large Swedish cohort and then pooled results from 18 similar prospective studies worldwide. That research team found that higher levels of these dairy fat biomarkers were associated with a lower risk of cardiovascular disease in the pooled analyses.
A 2020 review in the journal Advances in Nutrition, led by Jean‑Philippe Drouin‑Chartier of Université Laval, took a broader look at dairy fat and cardiometabolic health. They concluded that, within typical intake ranges and in the context of overall dietary patterns, current evidence doesn’t support a clear harmful association between consuming most full‑fat dairy products and cardiovascular disease risk in the general population.
Now, that doesn’t mean more saturated fat is always better. Some controlled feeding trials still show LDL cholesterol rising when people eat diets heavily loaded with saturated‑fat‑rich dairy foods, and a 2024 review in Foods discussed how altering cow diets and processing can shift the fatty acid profile of milk and potentially change its health effects. But taken together, these studies have pushed the conversation away from “full‑fat dairy is bad” toward “it depends on the food, the overall diet, and the person.”
Policy is slowly catching up. USDA and HHS have repeatedly said that the 2025–2030 Dietary Guidelines will emphasize overall dietary patterns over single nutrients. Recent USDA communications around school meals and nutrition suggest that full‑fat dairy can fit within healthy patterns when it’s part of a balanced diet, not the only source of saturated fat.
The clearest sign of that shift on your farm is the Whole Milk for Healthy Kids Act that was recently signed by President Donald Trump, allowing schools in the National School Lunch Program and related child nutrition programs to once again offer whole and 2% milk alongside 1% and fat‑free options, including flavored and unflavored, conventional and organic. USDA’s Economic Research Service and school nutrition associations note that the NSLP typically serves close to 30 million students per day across roughly 95,000 schools and institutions.
To make that concrete, schools and child care centers in federal programs can now serve:
- Flavored or unflavored whole milk
- Flavored or unflavored 2% (reduced‑fat) milk
- 1% and fat‑free milks
- Approved non‑dairy alternatives meeting nutrition standards
That change doesn’t mean every district will rush to whole milk, but it does remove a big legal barrier that kept fuller‑fat milk out of cafeterias for years.
What Consumers Are Actually Buying: Butter, Organic, and Cottage Cheese
While the scientific and policy debates have been shifting, shoppers haven’t been waiting around for permission to eat fat.
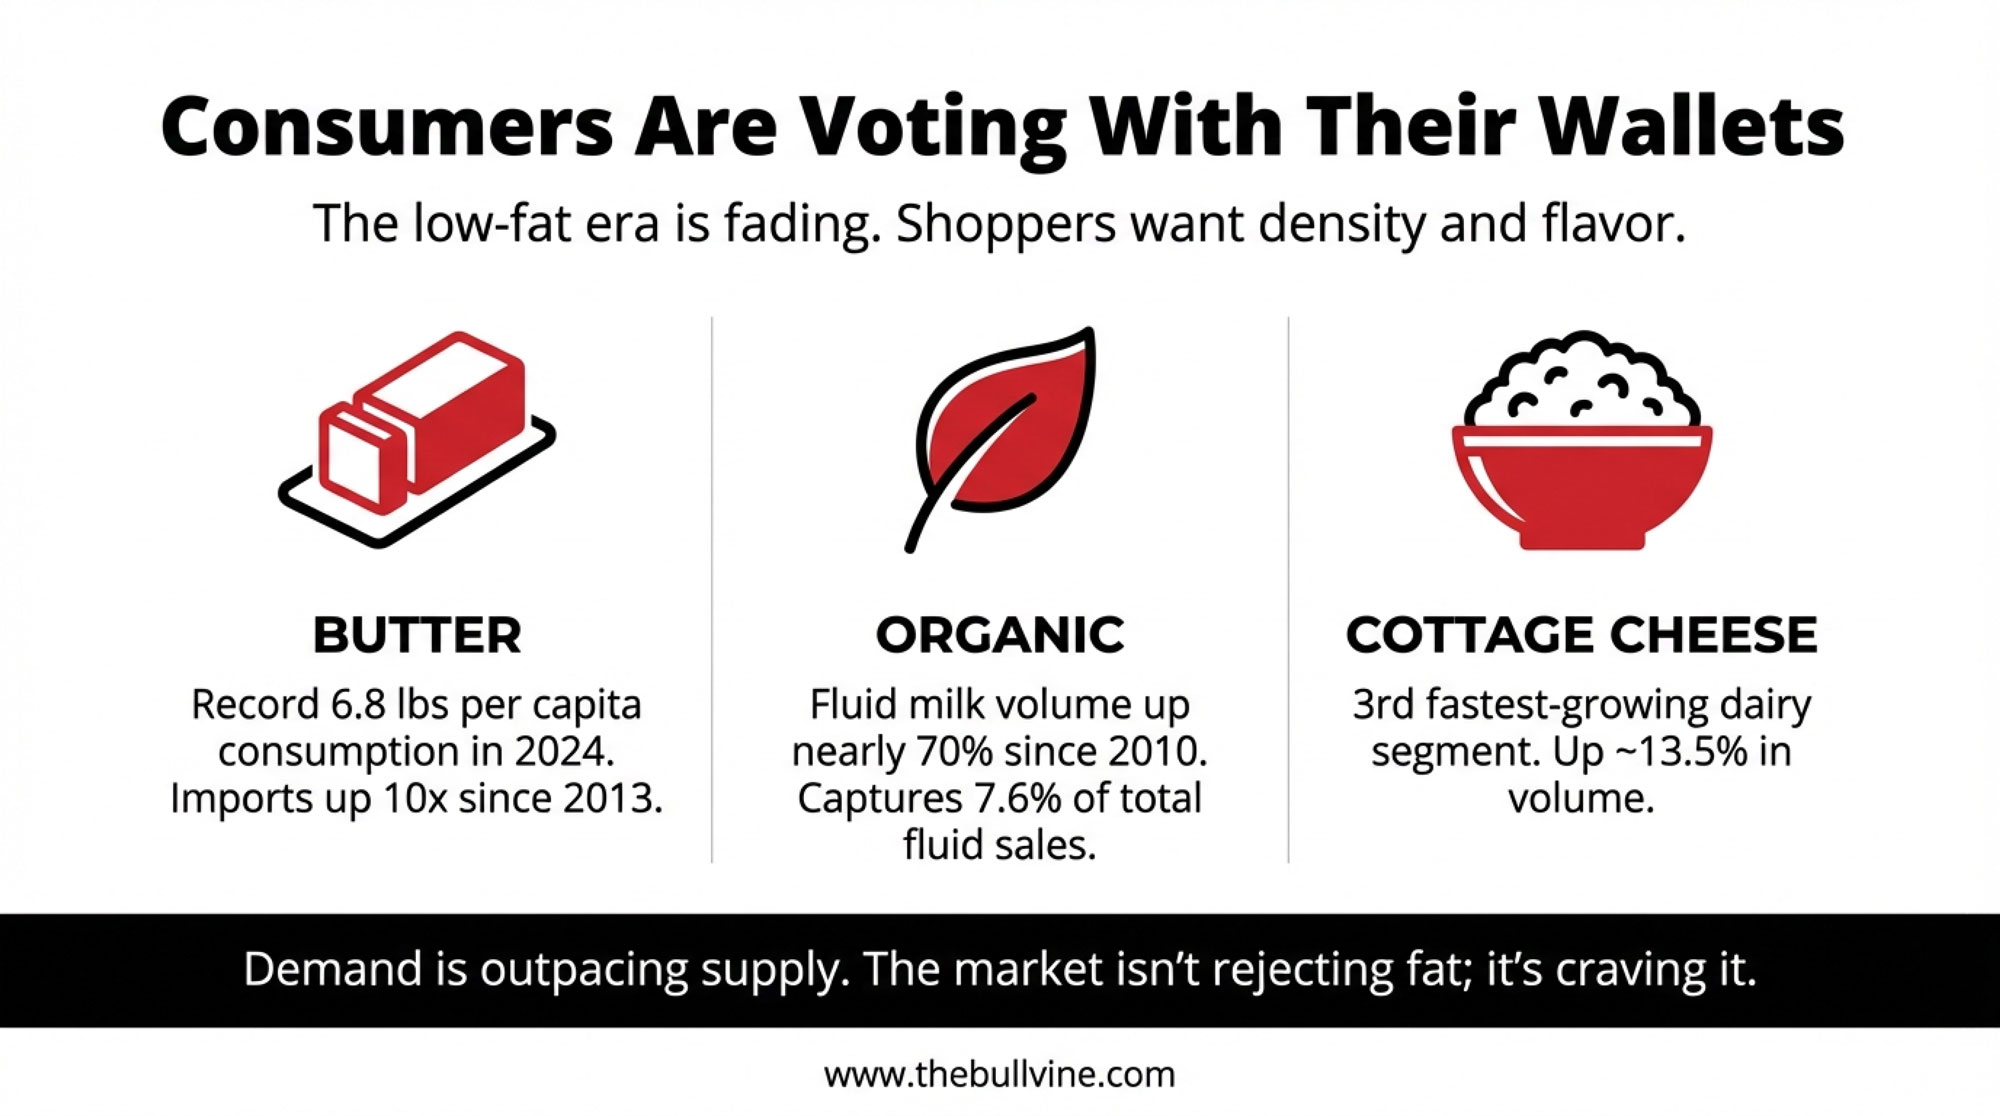
On the butter side consumption hits new all-time high in 2024″ reports that per‑capita butter consumption reached 6.8 pounds in 2024, a 0.3‑pound increase from 2023 and about 2.3 pounds higher than in 2000. The International Dairy Foods Association, using USDA Economic Research Service data, has also highlighted that butter consumption hit 6.8 pounds per person in 2024, surpassing all previous records. Butter market analysis shows 2020 holding the butter production record at 2.15 billion pounds, and that by November 2024 production had already hit 2.20 billion pounds, putting 2024 on pace to be the new record year once all months are counted. At the same time, as noted earlier, butter and milkfat imports are up 27% from 2023 and nearly tenfold compared to 2013.
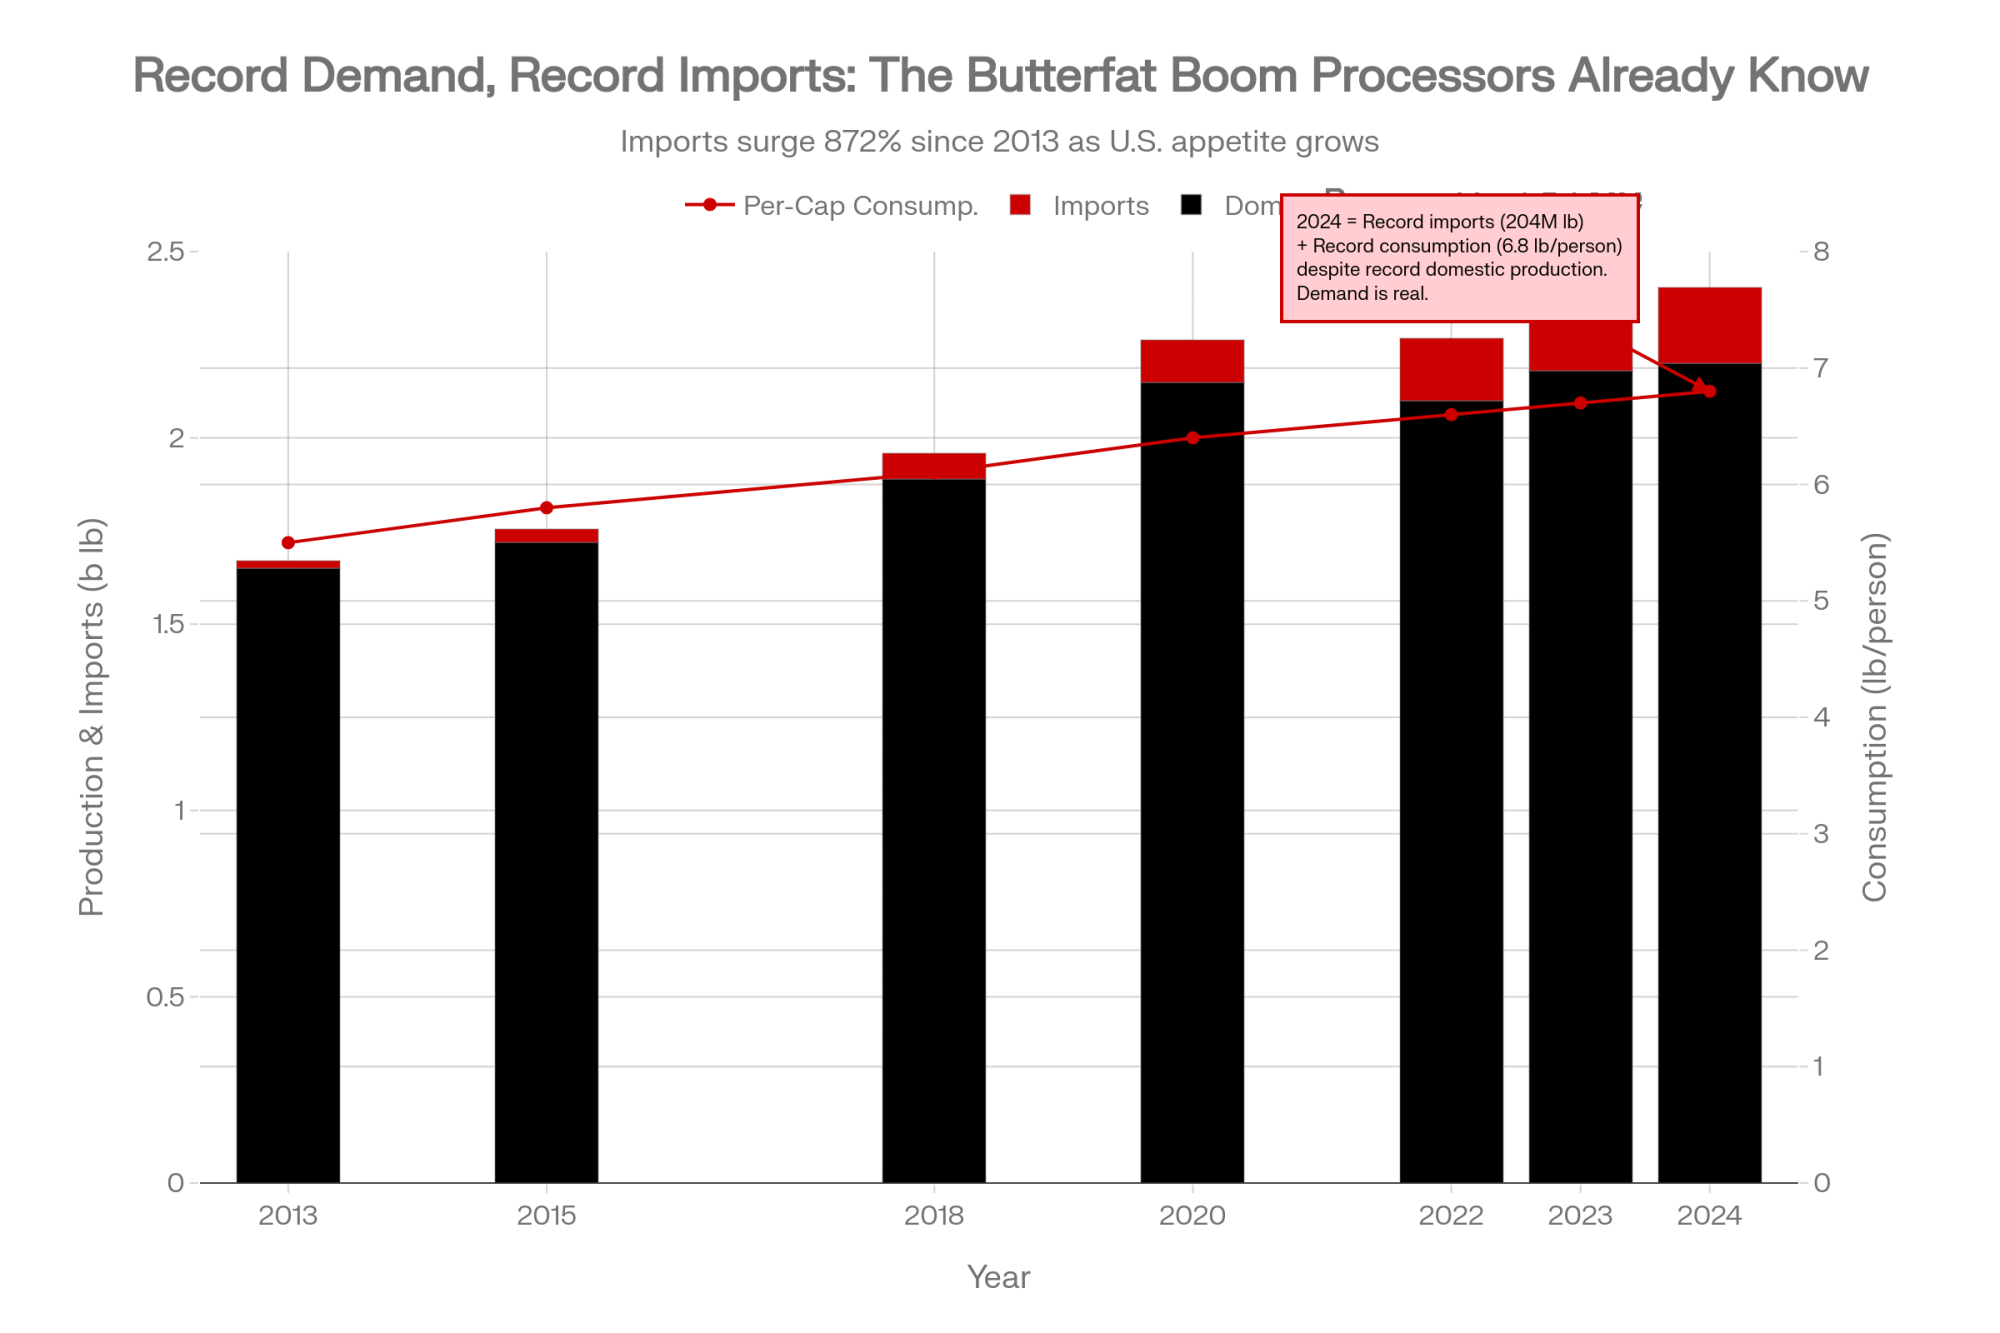
| Year | U.S. Butter Production (B lb) | Butter & Milkfat Imports (M lb) | Per-Capita Consumption (lb/person) |
|---|---|---|---|
| 2013 | 1.65 | 21 | 5.5 |
| 2015 | 1.72 | 35 | 5.8 |
| 2018 | 1.89 | 68 | 6.1 |
| 2020 | 2.15 | 112 | 6.4 |
| 2022 | 2.10 | 168 | 6.6 |
| 2023 | 2.18 | 178 | 6.7 |
| 2024 | 2.20 (est. Nov.) | 204 (Jan–Nov) | 6.8 (projected) |
That combination—record domestic production plus record imports—only happens when demand is strong, and margins are there. This development suggests that there’s no shortage of homes for milkfat, even if much of that value is captured beyond the farm gate.
Organic fluid milk tells another part of the story. RaboResearch’s 2025 report on U.S. organic milk found that from 2010 to 2024, organic fluid milk sales grew 67.7%, while conventional fluid milk sales fell 21.3%. Over that period, organic’s share of total fluid milk more than doubled, from 3.3% to 7.1%, with organic accounting for 7.6% of all fluid milk sales in July 2024. Rabobank senior dairy analyst Lucas Fuess noted that this growth is driven both by conventional decline and real organic volume growth, supported by dedicated organic supply chains and long‑term contracts.
Retail price data back up what many of you have seen. USDA retail milk reports and chain pricing snapshots show organic whole milk in major metro markets often selling in the $4.50–$6.50 per half‑gallon range, while conventional store brands typically sit closer to $2.50–$3.50. That roughly 2‑to‑1 gap can only persist if consumers buy into the story and are willing to pay for the combination of fat, production practices, and brand.
Then there’s the cottage cheese story. In 2024, cottage cheese was the third-fastest-growing edible dairy segment in the U.S., with 11.7% brand growth and 5.7% private label growth according to Circana, and that, in the year to May 19, 2024, volumes were up 13.5% and prices up 16%. Circana’s senior vice president of client insights for dairy, John Crawford, shared that this wasn’t just a pricing effect—usage and social media‑driven recipes have driven real volume growth, and he expected the category to stay in positive territory rather than fall off a cliff.
CNN and other business outlets later reported that cottage cheese sales jumped around 20% in the 52 weeks through June 15, 2025, following roughly 17% annual growth in both 2023 and 2024 and an 11% rise in 2022, marking a clear turnaround after declines in 2021. Brands like Good Culture and Daisy have responded by expanding production to keep up.
So, if you step back for a second, the pattern is pretty clear: butterfat‑rich products—whether that’s butter, organic whole milk, or high‑protein cottage cheese—are not scaring consumers off. They’re pulling them in.
A Homegrown 6% Example: Alexandre Family Farm
Before we circle back to your own operation, it’s worth looking at a U.S. example that’s already turned 6% milk into a premium story.
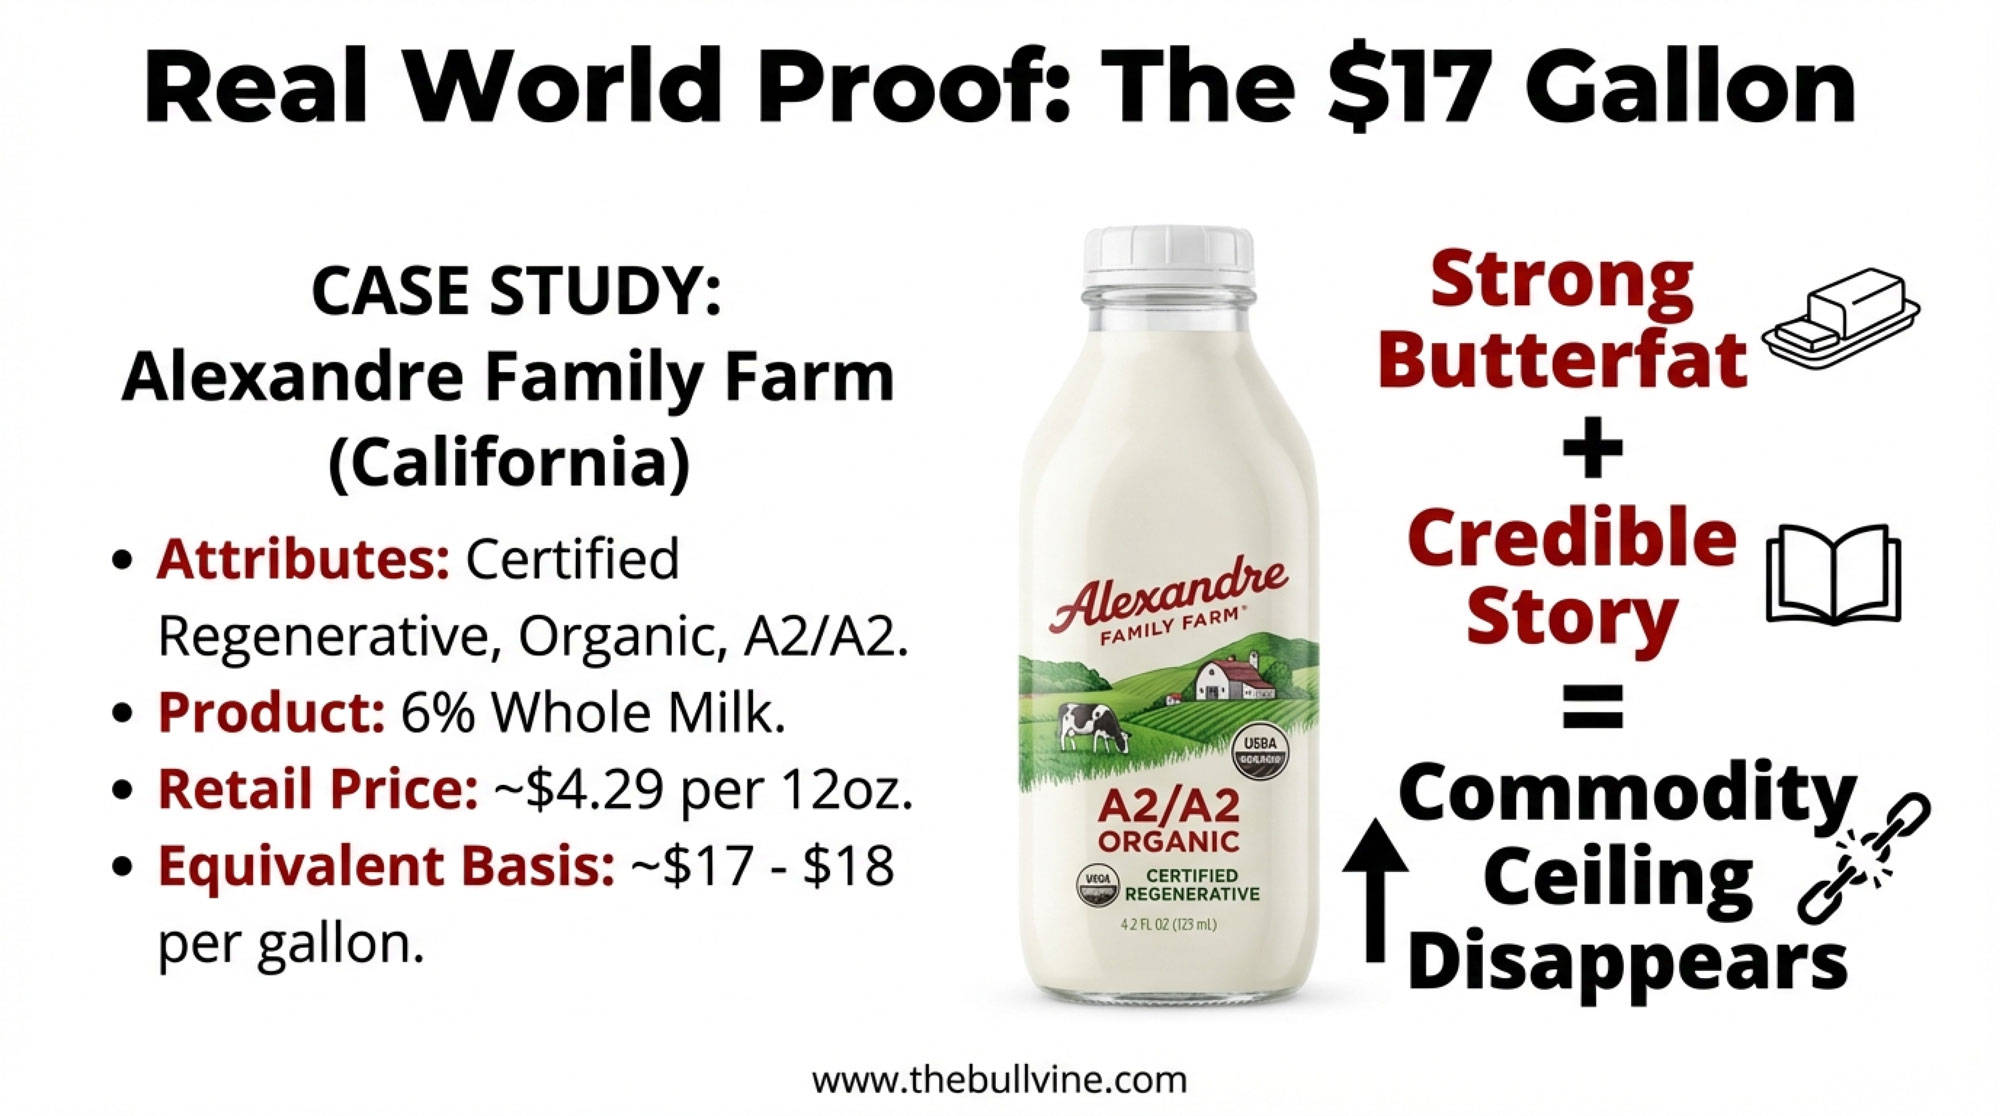
Alexandre Family Farm on California’s North Coast is recognized as America’s first certified regenerative organic dairy. Their program combines organic certification, regenerative practices, and A2/A2 genetics. They market a 6% whole milk as part of their lineup, positioned as richer, grass‑based, and easier to digest for some consumers.
If you check the online store for Bristol Farms, a California specialty grocer, you’ll see “Alexandre Family Farm Certified Regenerative A2/A2 6% Whole Milk 12 oz” priced at about $4.29. That’s roughly $0.36 per ounce, or about $17–18 on a gallon‑equivalent basis—orders of magnitude above commodity fluid prices.
In early 2024, children’s nutrition brand Once Upon a Farm entered the dairy space with organic A2 whole milk shakes and smoothies using organic A2 milk from Alexandre Family Farm. Their leadership emphasized Alexandre’s status as a fifth‑generation, regenerative organic dairy and stressed that the A2, grass‑fed profile fit the nutritional and environmental message they wanted to deliver to parents.
Most of us aren’t going to flip overnight to regenerative organic A2/A2 production. That’s a specific, demanding lane. But this example shows that when strong butterfat performance, credible production claims, and the right partners come together, 6% milk can command a price that has nothing to do with the commodity Class I mover.
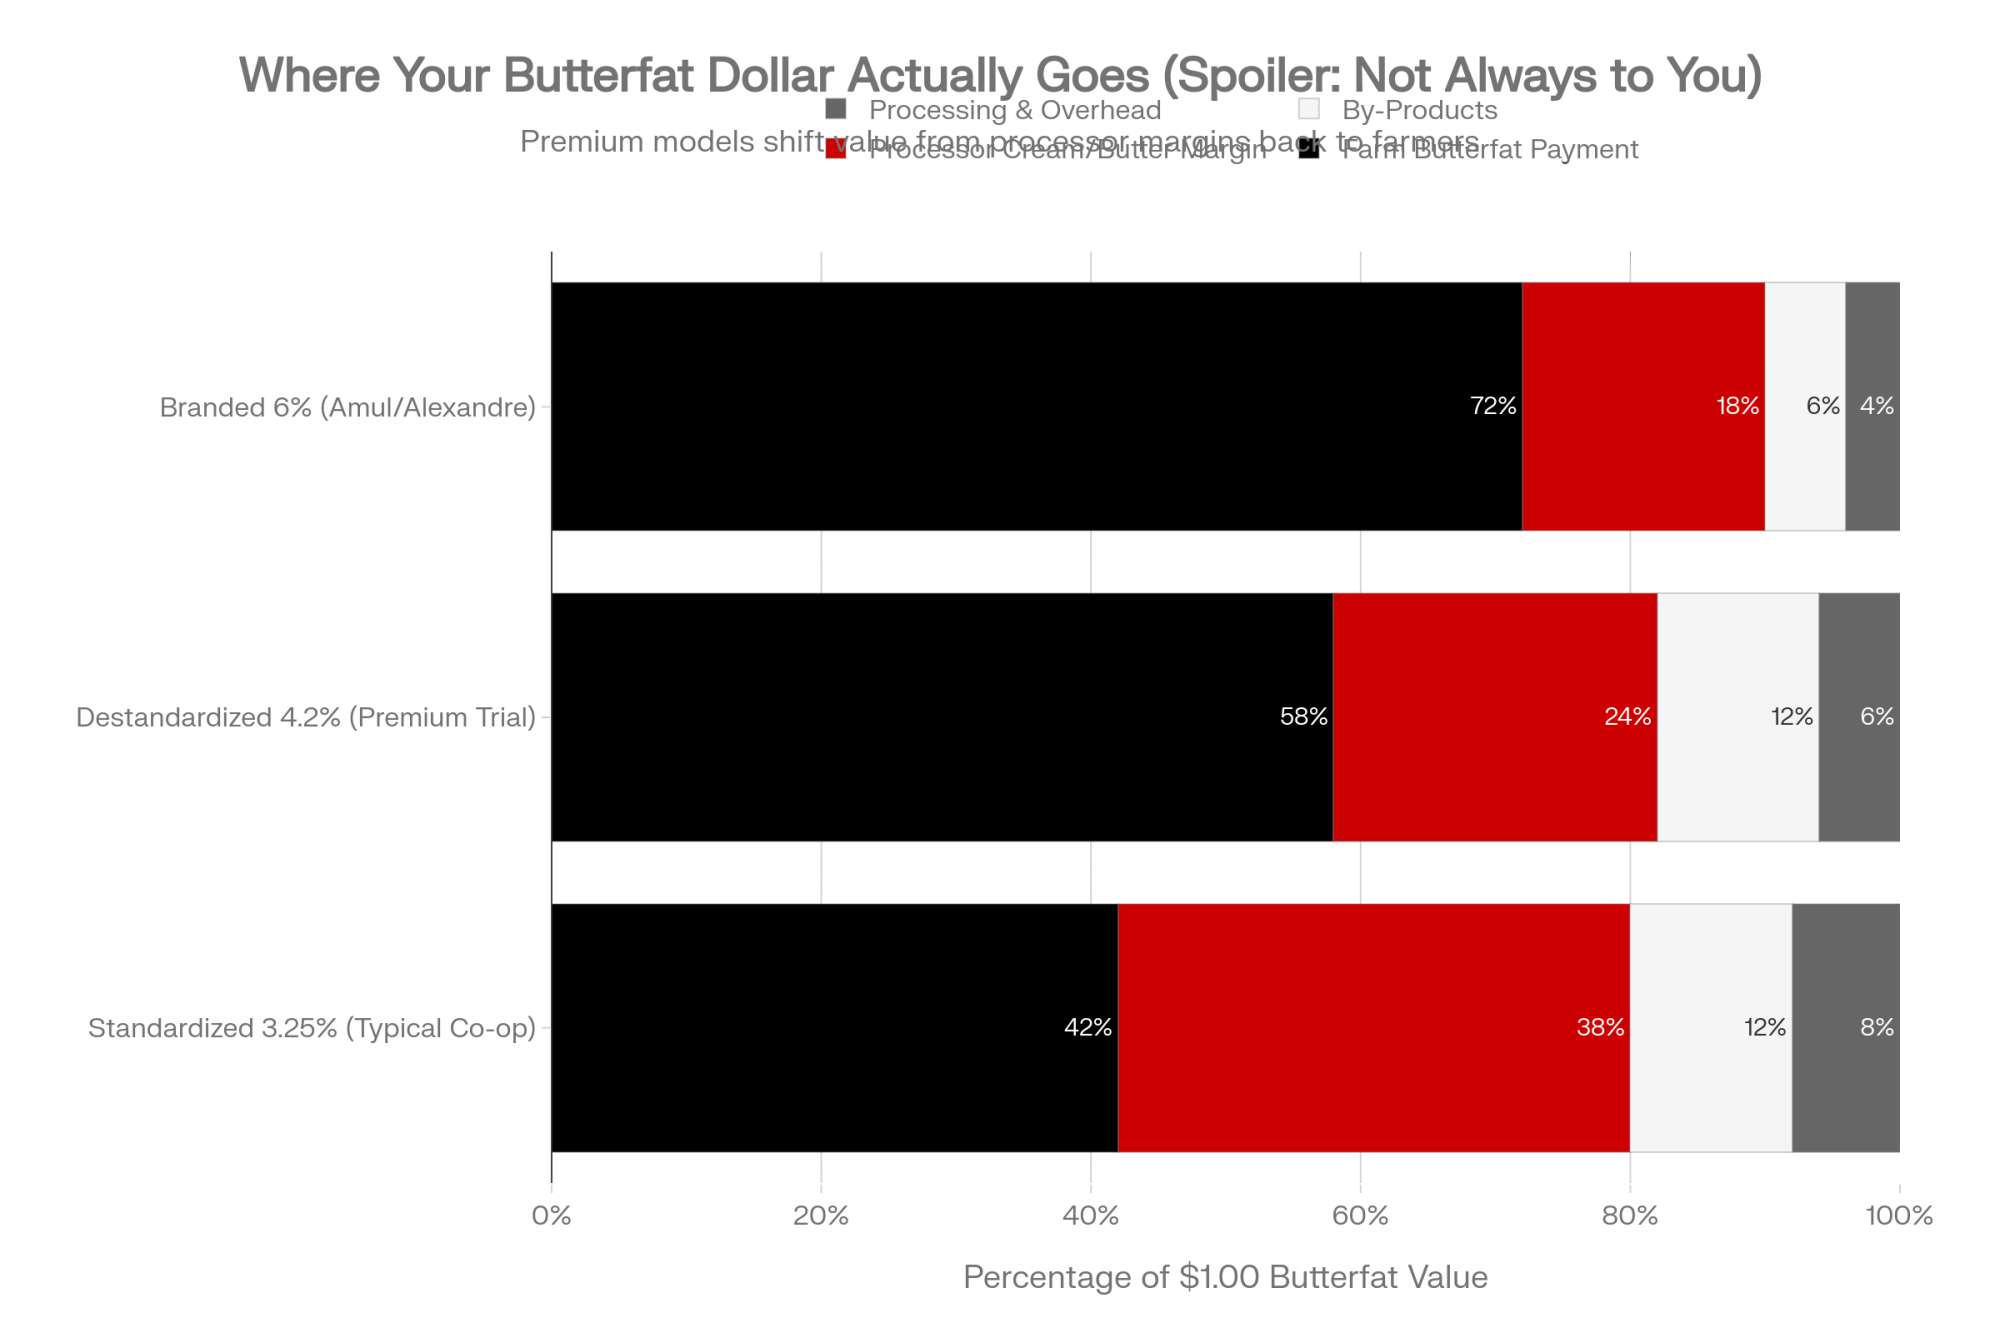
Where the Butterfat Money Actually Goes
So, let’s bring this back to your milk check, because that’s where the rubber meets the road.
Most producers in the U.S. are paid under some version of the Federal Milk Marketing Order. In simple terms, that means:
- Class III prices are based mainly on cheese and whey values.
- Class IV prices are based on butter and nonfat dry milk values.
- Class I fluid prices are derived from Class III and IV using the Class I mover formula.
- Component pricing in many orders pays you separately for butterfat, protein, and sometimes other solids, with additional premiums (for quality, volume, special programs) and deductions (hauling, balancing) layered on.
That structure absolutely pays you for butterfat. It’s why Net Merit, Cheese Merit, and other indices have leaned heavily into solids, and it’s why your co‑op has invested in butter churns, powder towers, and cheese plants over the years.
But here’s the hard truth I’ve noticed when looking at this value chain end‑to‑end: the system does a very good job of capturing milkfat value somewhere in the chain. It’s just not always clear how much of that value is being shared back to the farm, especially when butterfat ends up in premium fluid products or branded products rather than commodity butter or cheese.
Processors have to keep plants full, balance fluid, cheese, butter, and powder, and meet retailer demands for sharp pricing on “known value” items like gallons. Understandably, they default to standardizing fluid milk and building most of their butterfat strategy around butter and cream, where the market tools are familiar.
The myth that “the market just pays what butterfat is worth” glosses over many decisions made in plants and boardrooms, not at the CME screen. If you don’t know how much of your milk ends up in higher‑margin channels, you’re effectively letting someone else quietly decide what your butterfat is really worth.
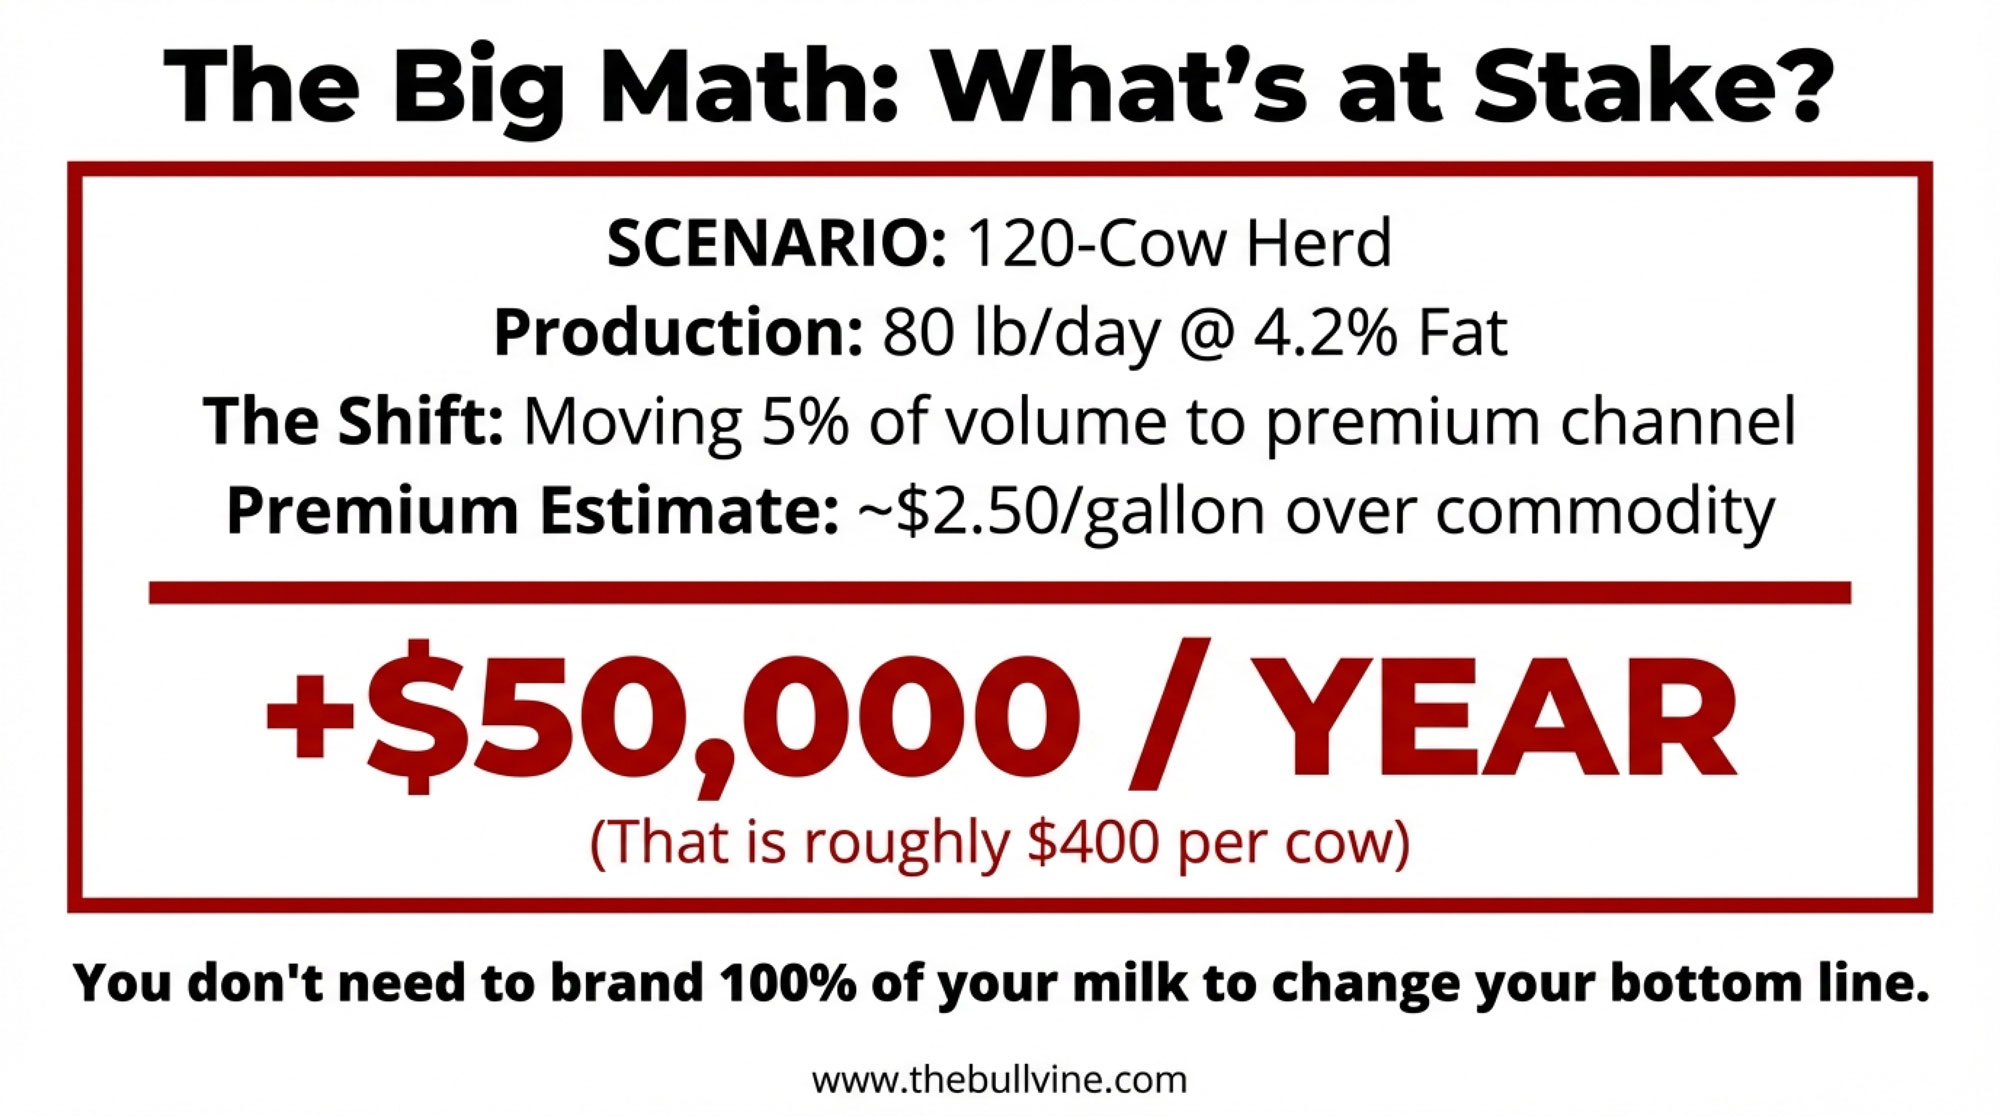
The Big Math: What Premium Butterfat Could Mean for Your Herd
Let’s put some numbers to this, because that’s where decisions get real.
| Herd Size | Herd Count | Milk/Cow/Day (lb) | Butterfat % | Annual Production (lb) | 5% Volume into Premium (lb) | Premium/Gal | Gross Annual Premium | Typical Costs (Labor, Delivery, Marketing) | Net Annual Premium | Per-Cow Value |
|---|---|---|---|---|---|---|---|---|---|---|
| Small | 120 | 80 | 4.2% | ~3.5M | ~175K (20K gal) | $2.50 | $50,000 | ~$8,000 | ~$42,000 | $350 |
| Mid-Size | 400 | 75 | 4.1% | ~11M | ~550K (65K gal) | $2.50 | $162,500 | ~$20,000 | ~$142,500 | $356 |
| Large | 2,000 | 75 | 4.0% | ~54.75M | ~2.74M (325K gal) | $2.50 | $812,500 | ~$60,000 | ~$752,500 | $376 |
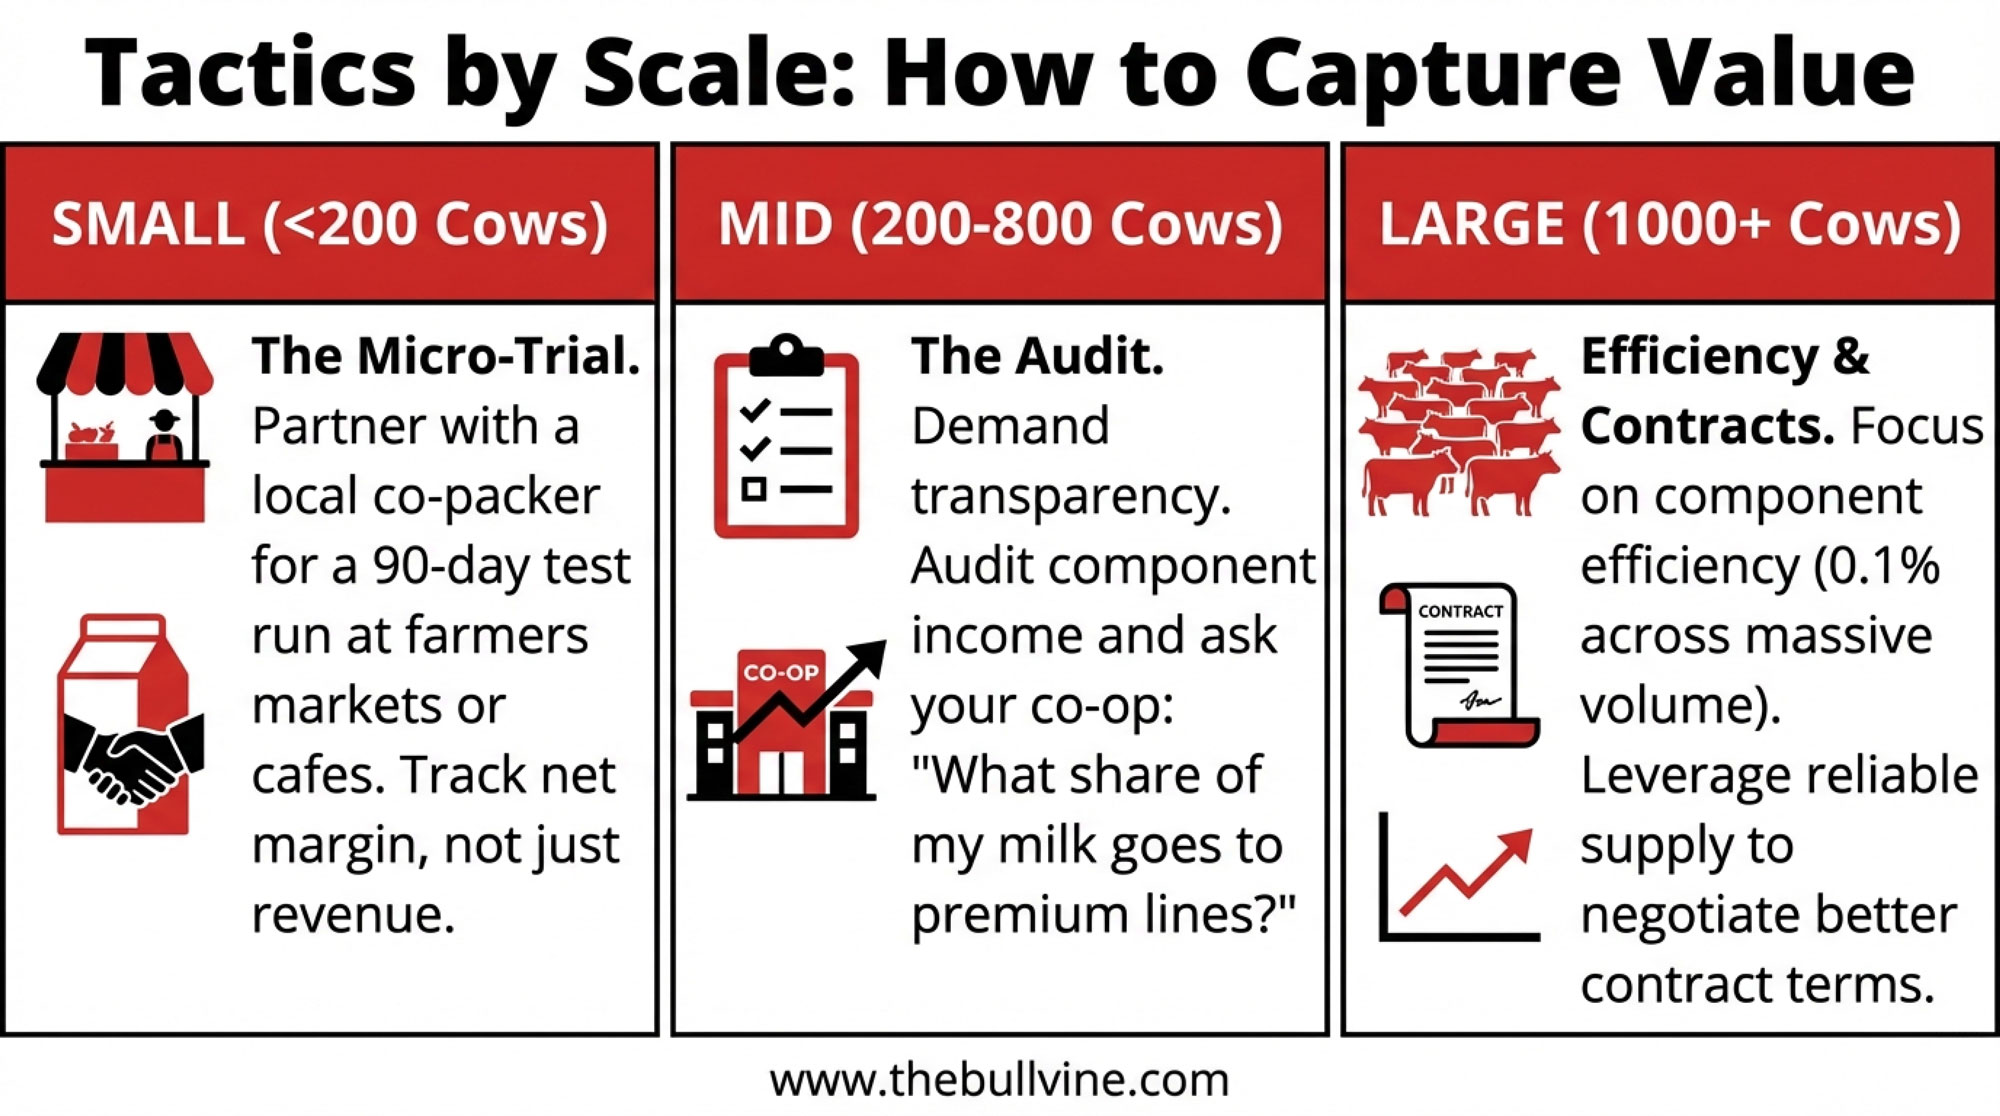
Small herds – under about 200 cows
If you’re milking 80–150 cows in places like New York, Wisconsin, Ontario, or the Pacific Northwest, your strength usually isn’t volume. It’s flexibility and your connection to your community.
Here’s a small piece of “big math” that tends to focus the mind. Say you’ve got:
| Factor | Value |
| Herd size | 120 cows |
| Daily production | 80 lb/cow/day |
| Butterfat test | 4.2% |
| Annual production | ~3.5 million lb |
| 5% of volume | ~175,000 lb (~20,000 gal) |
| Premium per gallon | $2.50 |
| Annual premium potential | $50,000 |
| Per-cow value | ~$400/cow/year |
For many small herds, that’s the kind of number that could cover a tractor payment, help with a parlor upgrade, or give you some breathing room on repairs.
There are practical constraints:
- Co‑op or processor contracts may limit diversions or set rules about branding and markets.
- Regulations require Grade A facilities, inspections, and proper labeling.
- Labor is tight; adding marketing and delivery is a real strain.
That’s why many smaller herds that are experimenting with premium milk treat it as a structured trial, not an identity shift. They partner with a licensed plant to co‑pack a few hundred gallons a week, place product in one or two outlets they know well—a farm store, farmers’ markets, a local café, or an independent grocer—and then run it for 60–90 days. During that time, they track:
- How quickly the product actually sells.
- What net margin remains after every cost.
- What does it does to their workload and stress level.
If the numbers don’t work, they scale back without having bet the whole farm on a brand experiment. If the numbers dowork, they have real data to bring to family discussions, lenders, and co‑op leadership.
For Canadian quota herds: The math is framed differently, but the questions are similar. Butterfat levels directly influence how efficiently you use quota and participate in pooled returns, and some processors in provinces like Ontario and Quebec are exploring higher‑fat or specialty fluid products. The concept of moving a small share of milk into a higher‑value use still applies; the trick is to do it within the rules of the quota system and processor agreements.
Mid‑size herds – roughly 200 to 800 cows
If you’re milking 300–600 cows in freestalls in the Upper Midwest or Northeast, or running 200–400 cows under Canadian quota, you’re big enough that a tiny farm‑store play won’t move the needle, but you may feel too small to have huge leverage on your own.
In that bracket, what I’ve seen pay off is clarity plus conversation.
Step one is a component income audit. Take the last 12 months of milk checks and total:
- Dollars from butterfat.
- Dollars from protein.
- Dollars from all premiums (quality, volume, programs).
- Dollars lost to hauling, balancing, and other deductions.
Once you know those numbers, you can approach your co‑op or plant rep with a different conversation. Instead of asking, “How are prices this month?” you can ask:
- Roughly where does my milk usually go—what share into fluid, cheese, butter, powder, and branded or specialty products?
- How much of your overall supply is going into higher‑margin or branded products, and how is that value shared with members or suppliers?
- Are there current or potential programs that pay differently for higher butterfat, A2 milk, organic, grass‑fed, or other traits?
Those questions signal that you understand they have a business to run, but you also want transparency about how your butterfat is being used.
From there, it’s smart to pull your nutritionist and genetics adviser into the conversation. We know from Hoard’s and FMMO data that average butterfat still has some room to climb in many herds. Ask them:
- Realistically, what would it take in sire selection and ration adjustments to add 0.15–0.25 points of butterfat over the next few years?
- Under our current pay program, what is each additional 0.1 point of butterfat worth per cow per year?
- If our co‑op or processors launch richer or specialty lines, what kind of component profile are they likely to want, and how close are we already?
Larger herds – 1,000 cows and up
If you’re running 1,000–5,000 cows in places like Idaho, Texas, New Mexico, or California’s Central Valley, your context looks different again. A handful of branded jugs won’t change your P&L, and your biggest levers tend to be efficiency, contracts, and positioning.
At this scale, the butterfat strategy is usually about three things:
- Component efficiency. A 0.05–0.10 point bump in butterfat across tens of millions of pounds of milk can translate into serious dollars, especially when combined with strong protein and low SCC. That makes fresh cow management, transition cow programs, ration design, and cow comfort in freestall or drylot systems central to your butterfat playbook.
- Contract terms. Many large herds ship under supply agreements that specify butterfat, protein, quality thresholds, and, sometimes, sustainability metrics. Knowing exactly how you’re rewarded (or penalized) for component changes is critical before you aim for higher fat.
- Strategic positioning. Even if most of your milk ends up in cheese or powder, being known as a high‑component, reliable supplier with a strong stewardship story matters when processors and retailers choose farms for higher‑margin or branded programs.
When you see stories like Amul Gold at Costco or Alexandre’s 6% in natural food stores, the takeaway for big herds isn’t “copy this.” It’s that brands looking to push richer or more specialized fluid products will need reliable pools of high‑butterfat milk. Being one of the herds already hitting strong butterfat performance, with good cow health and consistent supply, puts you at the front of the line if those programs come to your region.
Your Playbook for the Next 12–24 Months
Let’s pull this into something you can act on.
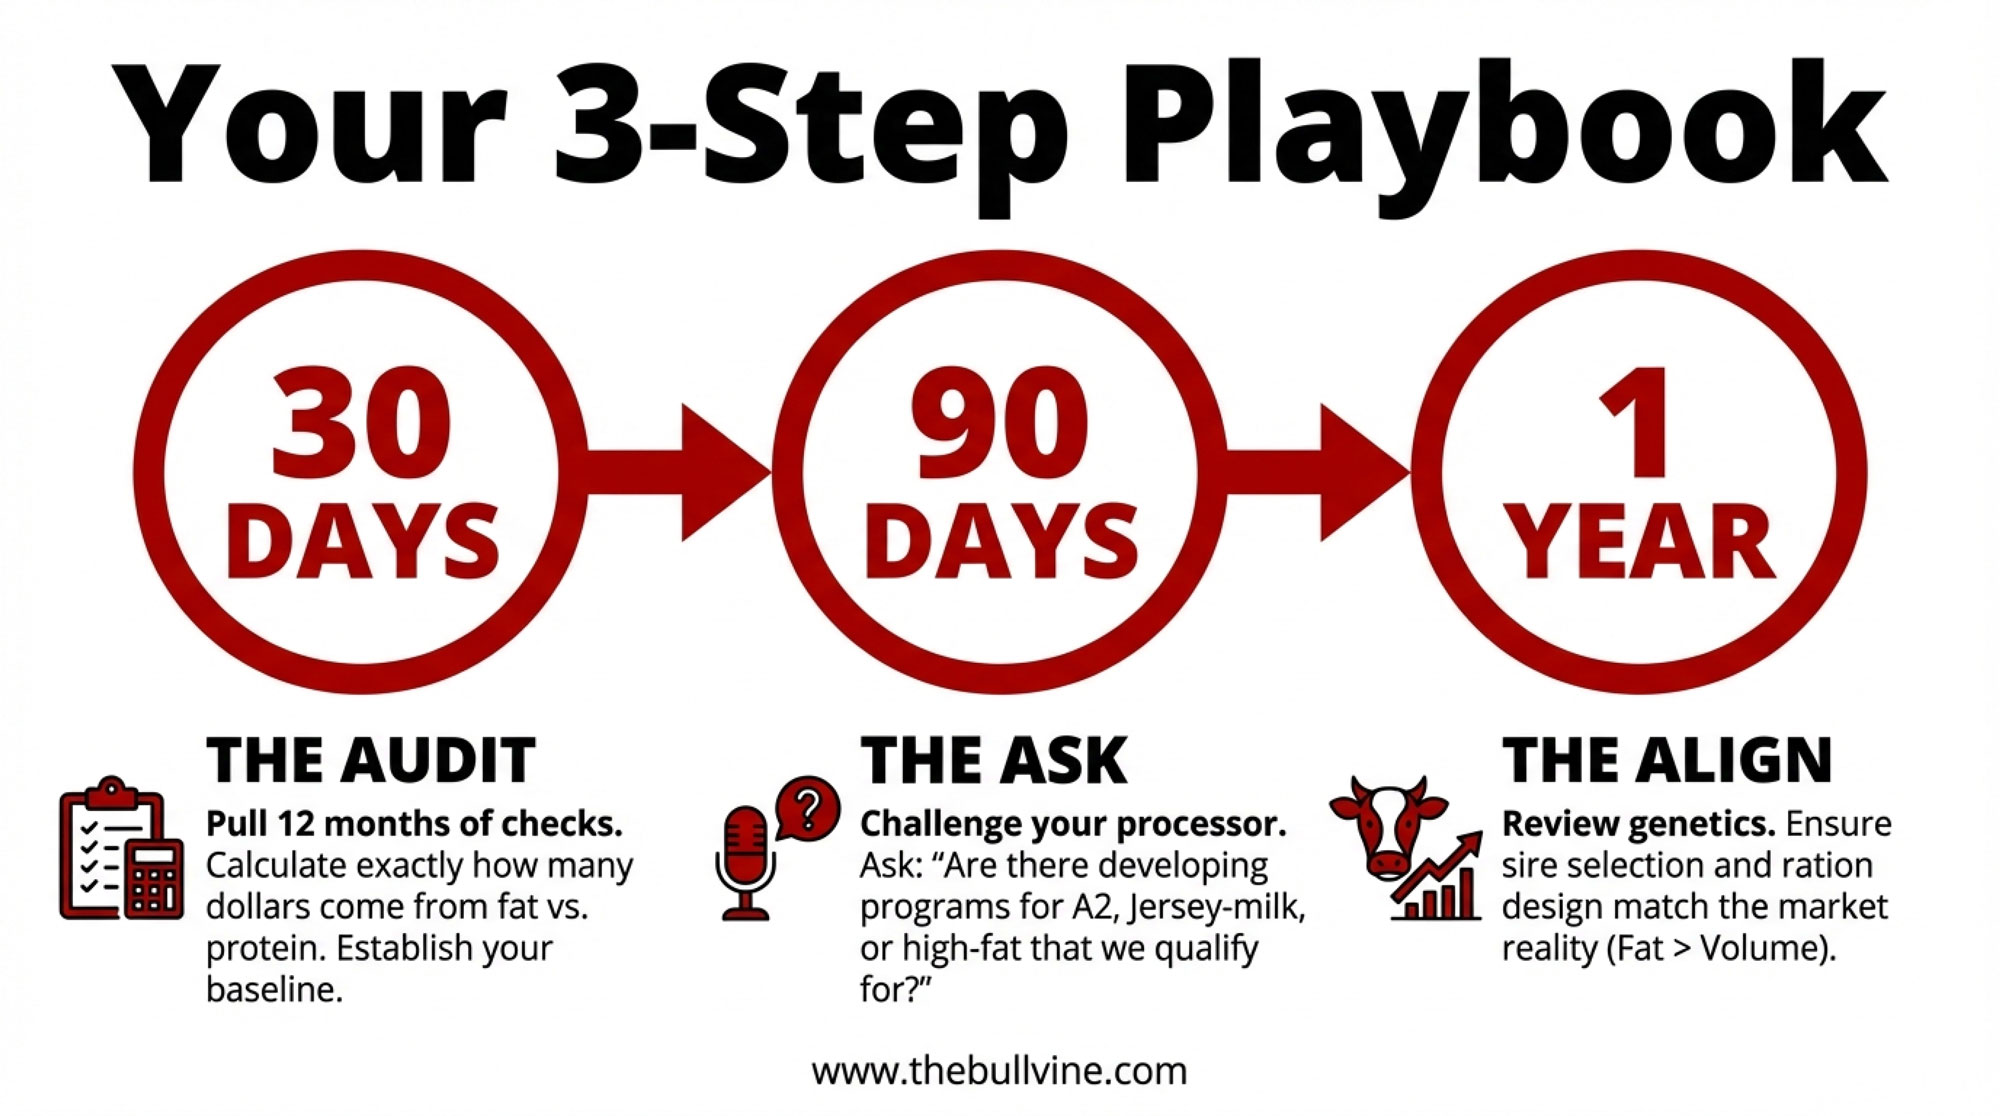
In the next 30 days: Audit your component income.
Grab your last 12 months of milk checks. Put numbers on:
- Total dollars from butterfat.
- Total dollars from protein.
- Total premiums and total deductions.
That’s your baseline. Without it, you’re flying blind on what butterfat is really worth to you.
In the next 90 days: Have the tough but necessary conversation with your buyer.
Go to your co‑op or plant rep with those numbers and ask:
- Where does my milk usually go—what share to fluid, cheese, butter, powder, and branded lines?
- How much of your total milk ends up in higher‑margin products like branded fluid, specialty cheeses, or premium cultured dairy, and how is that value shared?
- Are there current or developing programs that reward higher butterfat, A2 milk, organic, grass‑fed, or other traits?
If you’re in a Canadian quota system, make sure you also ask how butterfat levels affect your quota utilization and your ability to participate in any specialty programs.
Over the next year: Consider a tightly scoped premium trial if your situation allows.
If your contracts and local regulations give you some room, test moving a small share of your milk—say 5%—into a richer or differentiated product. Do it with a licensed processor, keep volumes modest, and commit to tracking:
- Net margin compared with your regular milk check.
- Additional labor, stress, and logistics.
- Retailer and consumer response.
Let the hard numbers and lived experience decide whether you scale up, tweak, or step back.
Over the next 12–24 months: Align breeding and feeding with the markets you can realistically serve.
Take what you learn from your milk check, your buyer, and your own herd data and plug it into your breeding and feeding plans. Ask:
- Under our current pay program, what’s the marginal value of another 0.1 point of butterfat per cow per year, and how does that compare with gains in protein, fertility, or health?
- If premium opportunities (like richer fluid milk, A2, organic, grass‑fed) emerge where we are, what milk profile will those programs likely require, and how far are we from that?
With Net Merit now placing more emphasis on fat and health, and with markets rewarding fat across multiple product categories, it makes sense to ensure your sire selection and ration design are calibrated to where the money is likely to be, not just where it used to be.
Keep watching the small signals.
Monitor:
- USDA and ERS reports on trends in whole, reduced‑fat, and skim milk consumption and organic share.
- Co‑op and processor announcements about ESL capacity, A2 launches, organic and grass‑fed programs, and partnerships like Once Upon a Farm–Alexandre or MMPA–Amul.
- What’s actually on your local shelves: more high‑fat fluid options, more organic, more A2 and regenerative labels—or less?
These details often tell you where butterfat value might move before it shows up in the pay formula.
The Bottom Line: Who Really Gets Paid for Your Butterfat?
When you step back from the day‑to‑day and look at the full picture—Amul Gold’s 6% jug at Costco, the steady climb of U.S. bulk‑tank butterfat past 4.0%, record per‑capita butter consumption, the surge in organic fluid milk, the cottage cheese boom, shifts in dairy fat science, full‑fat milk returning to school menus—it’s hard to miss the pattern.
You and your cows have already turned butterfat into one of your herd’s biggest assets. Genetics, better fresh cow management and transition programs, and improved cow comfort have pushed butterfat performance to record levels. Consumers are not shy about eating fat when it comes in the form of butter, organic whole milk, and high‑protein cultured dairy. Policy has backed off fighting full‑fat milk as hard. Processors and brands are starting to bottle richer milk when they see a clear story and a receptive audience.
What’s encouraging is that, for once, genetics, consumer demand, and policy are roughly aligned. The part that still needs your attention is everything between your bulk tank and the retail shelf: the contracts, the plant decisions, and the product mix.
Staying on autopilot means your butterfat keeps rising while your share of the value may not. Leaning in—even a little—means you start steering where those extra dollars land.
Audit your component income. Ask where your milk really goes. Run small, smart experiments where they make sense. And make sure your breeding and feeding plans reflect the markets you’re in, not the ones you left behind ten years ago.
Because the real question behind that 6% jug at Costco isn’t “Will rich milk sell?” The data says it already does. The real question is: when your cows put that extra butterfat in the tank, are you capturing the premium—or is someone else?
Key Takeaways
- Your tank just hit 4.0%—finally. U.S. butterfat averaged over 4.15% in 2023, and 2024 is on track to be the first year every single month clears 4.0%.
- Consumers are all in on fat. Record 6.8 lb per-capita butter consumption in 2024. Organic whole milk up nearly 70% since 2010. Cottage cheese posting double-digit growth three years running.
- Processors are already capturing the premium. Amul’s 6% milk at Costco and Alexandre’s $17/gallon regenerative A2 milk prove high-butterfat products sell—and sell well.
- The math: $50,000 from 5% of your milk. On a 120-cow herd at 4.2% fat, shifting just 5% of volume into a premium channel can add roughly $400 per cow per year.
- Your move: audit, ask, test, align. Know your component income. Press your co-op on where your milk really goes. Run a small premium trial. Match genetics and feeding to markets you can actually reach.
Complete references and supporting documentation are available upon request by contacting the editorial team at editor@thebullvine.com.
Learn More
- Maximizing Milk Components: It’s Not Just Genetics – Stop leaving money in the gutter by mastering transition cow protocols. This breakdown arms you with management tweaks to squeeze every tenth of a point of butterfat from your current ration before you even look at a bull catalog.
- Whole Milk for Healthy Kids Act: A Win for Dairy Farmers and Students – The legislative tide has turned. This analysis exposes the massive volume shift coming to fluid markets and reveals how to position your herd’s component profile to capitalize on the return of full-fat milk to American schools.
- 2025 Genetic Evaluations: Net Merit and the Push for Components – Forget 4.0%—the new indices are already pushing the goalposts. Discover the genomic strategies that deliver a “butterfat first” approach, ensuring your future herd is built for the high-margin retail jug and evolving component pricing.
 The Sunday Read Dairy Professionals Don’t Skip.
 The Sunday Read Dairy Professionals Don’t Skip.
Every week, thousands of producers, breeders, and industry insiders open Bullvine Weekly for genetics insights, market shifts, and profit strategies they won’t find anywhere else. One email. Five minutes. Smarter decisions all week.


