


$17.40 cash break-even. $19.80 real break-even. That $2.40/cwt you’re ignoring? It’s the whole ballgame in 2026.
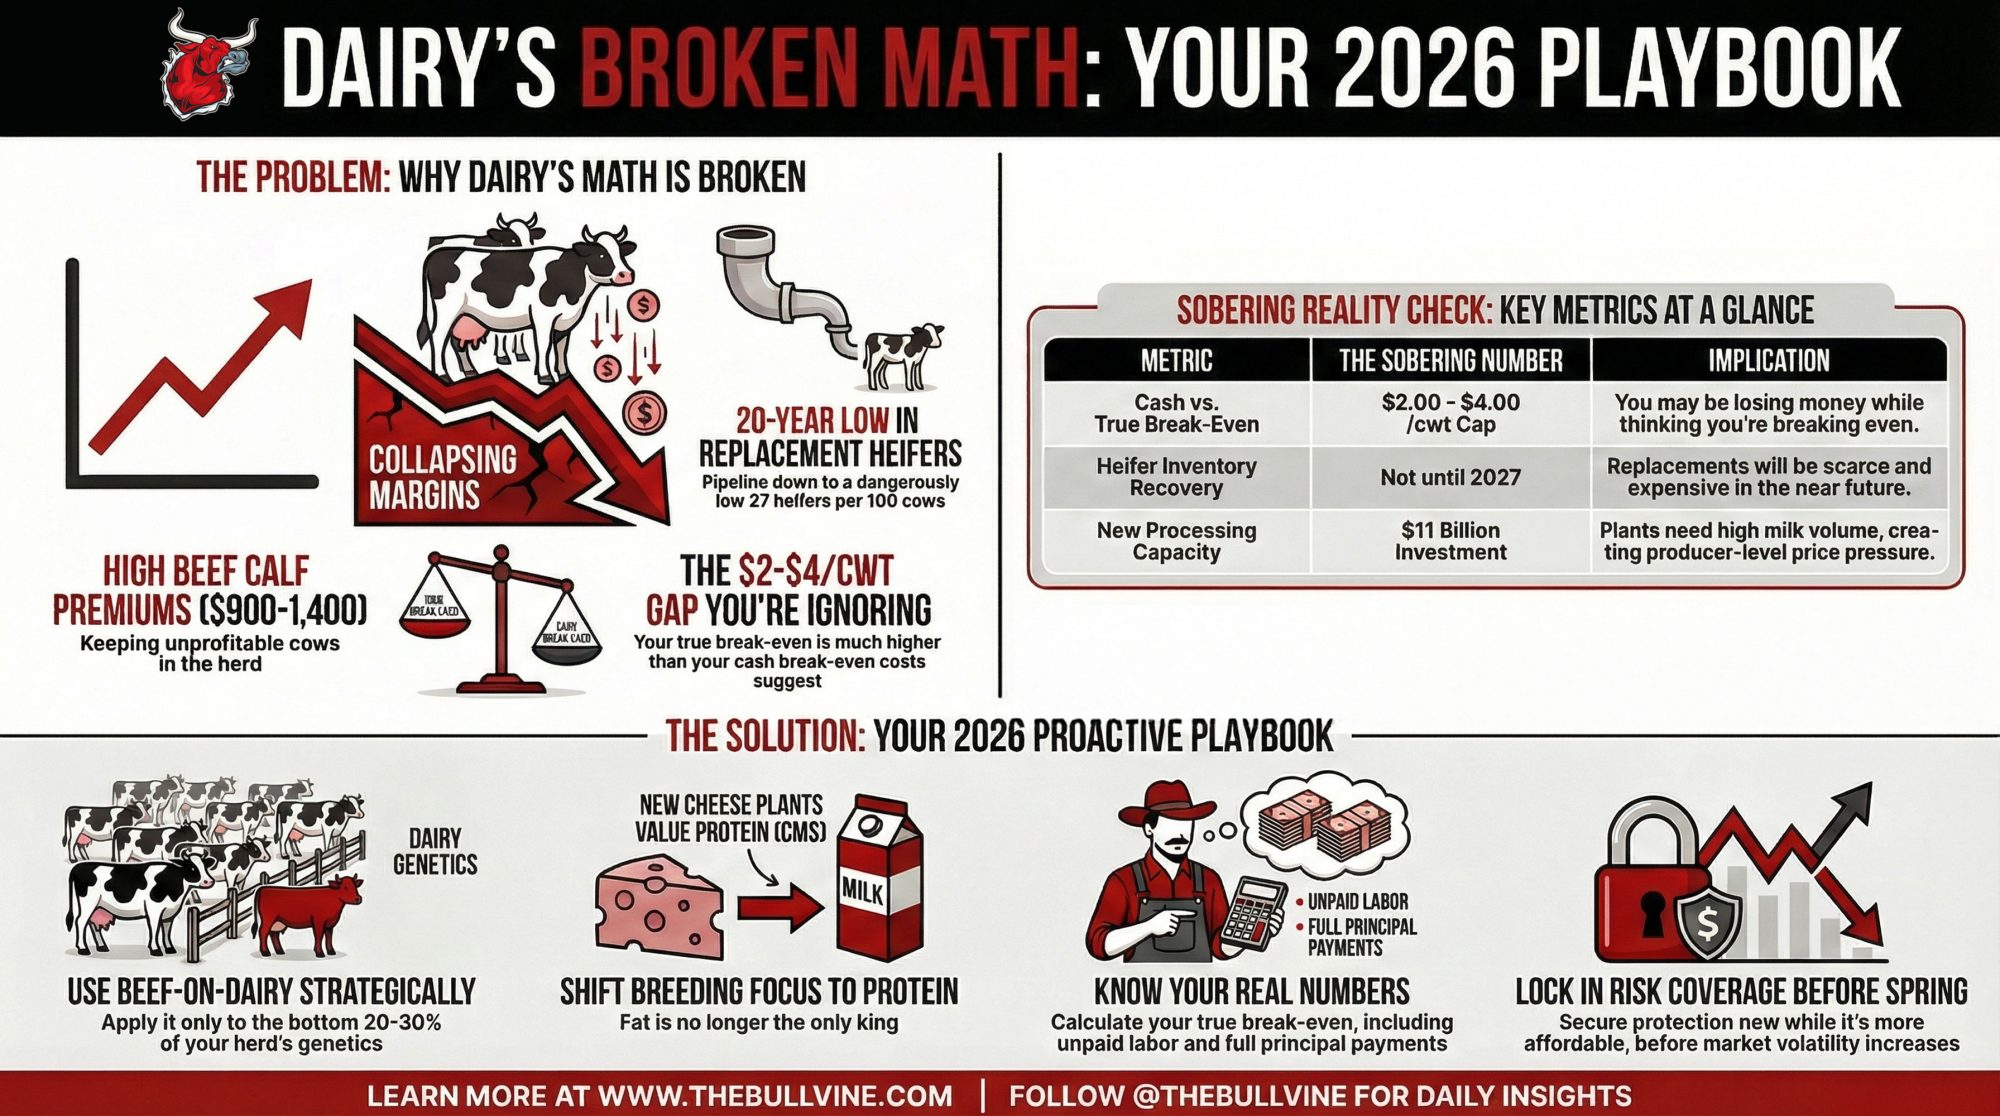
EXECUTIVE SUMMARY: Something’s broken in dairy economics. The U.S. herd grew by 211,000 cows in 2025—while margins collapsed. The culprit: beef-on-dairy premiums ($900-$1,400/calf) are keeping genetically weaker cows in barns that should be empty, starving the replacement pipeline to a 20-year low of just 27 heifers per 100 cows. Add $11 billion in new processing capacity hungry for volume, a component shift from fat toward protein, and producers underestimating their true break-even by $2-4/cwt—and this stops looking like a cycle. It’s a structural reset. With $17-18 milk projected through 2026 and heifer supplies not recovering until 2027, the next six months are a decision window, not a waiting period. The playbook: know your real costs, deploy beef-on-dairy only on your bottom 20-30% of genetics, and lock risk coverage before spring. Producers who act on this will shape their future. The rest will have it shaped for them.
Think about what that means for a moment. Milk prices are sliding. Margins compressing. Every traditional economic signal is screaming that producers should be culling hard and contracting supply. That’s what happened in 2015. That’s what happened in 2018. It’s what the textbooks say should happen when prices drop.
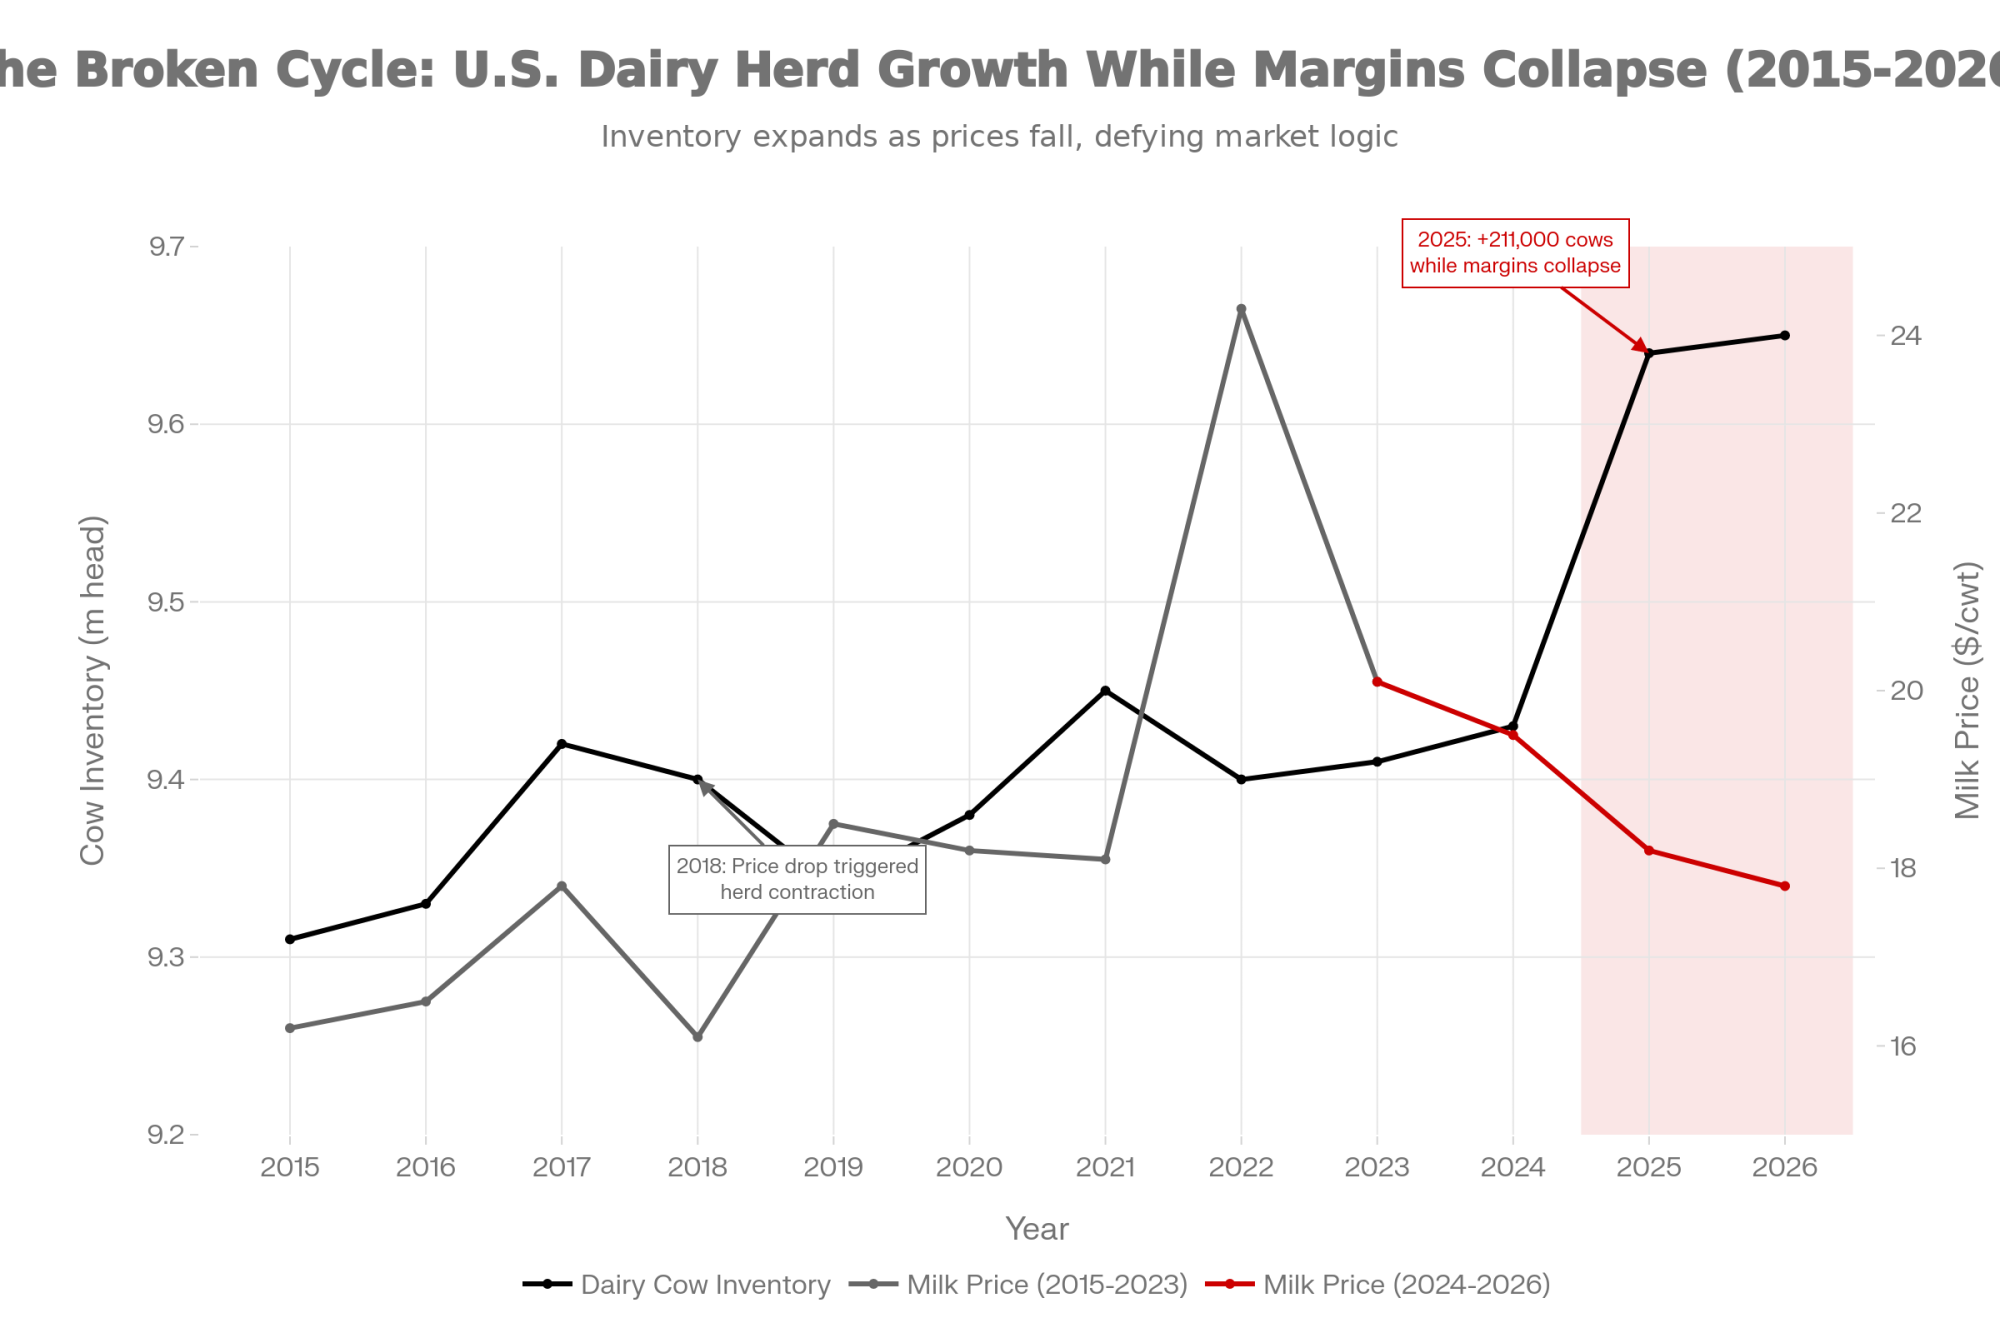
Instead, the national herd keeps expanding.
USDA’s November milk production report confirmed what many of us already sensed: production in the 24 major dairy states is running 4.7 percent above year-ago levels, with total U.S. milk up about 4.5 percent.
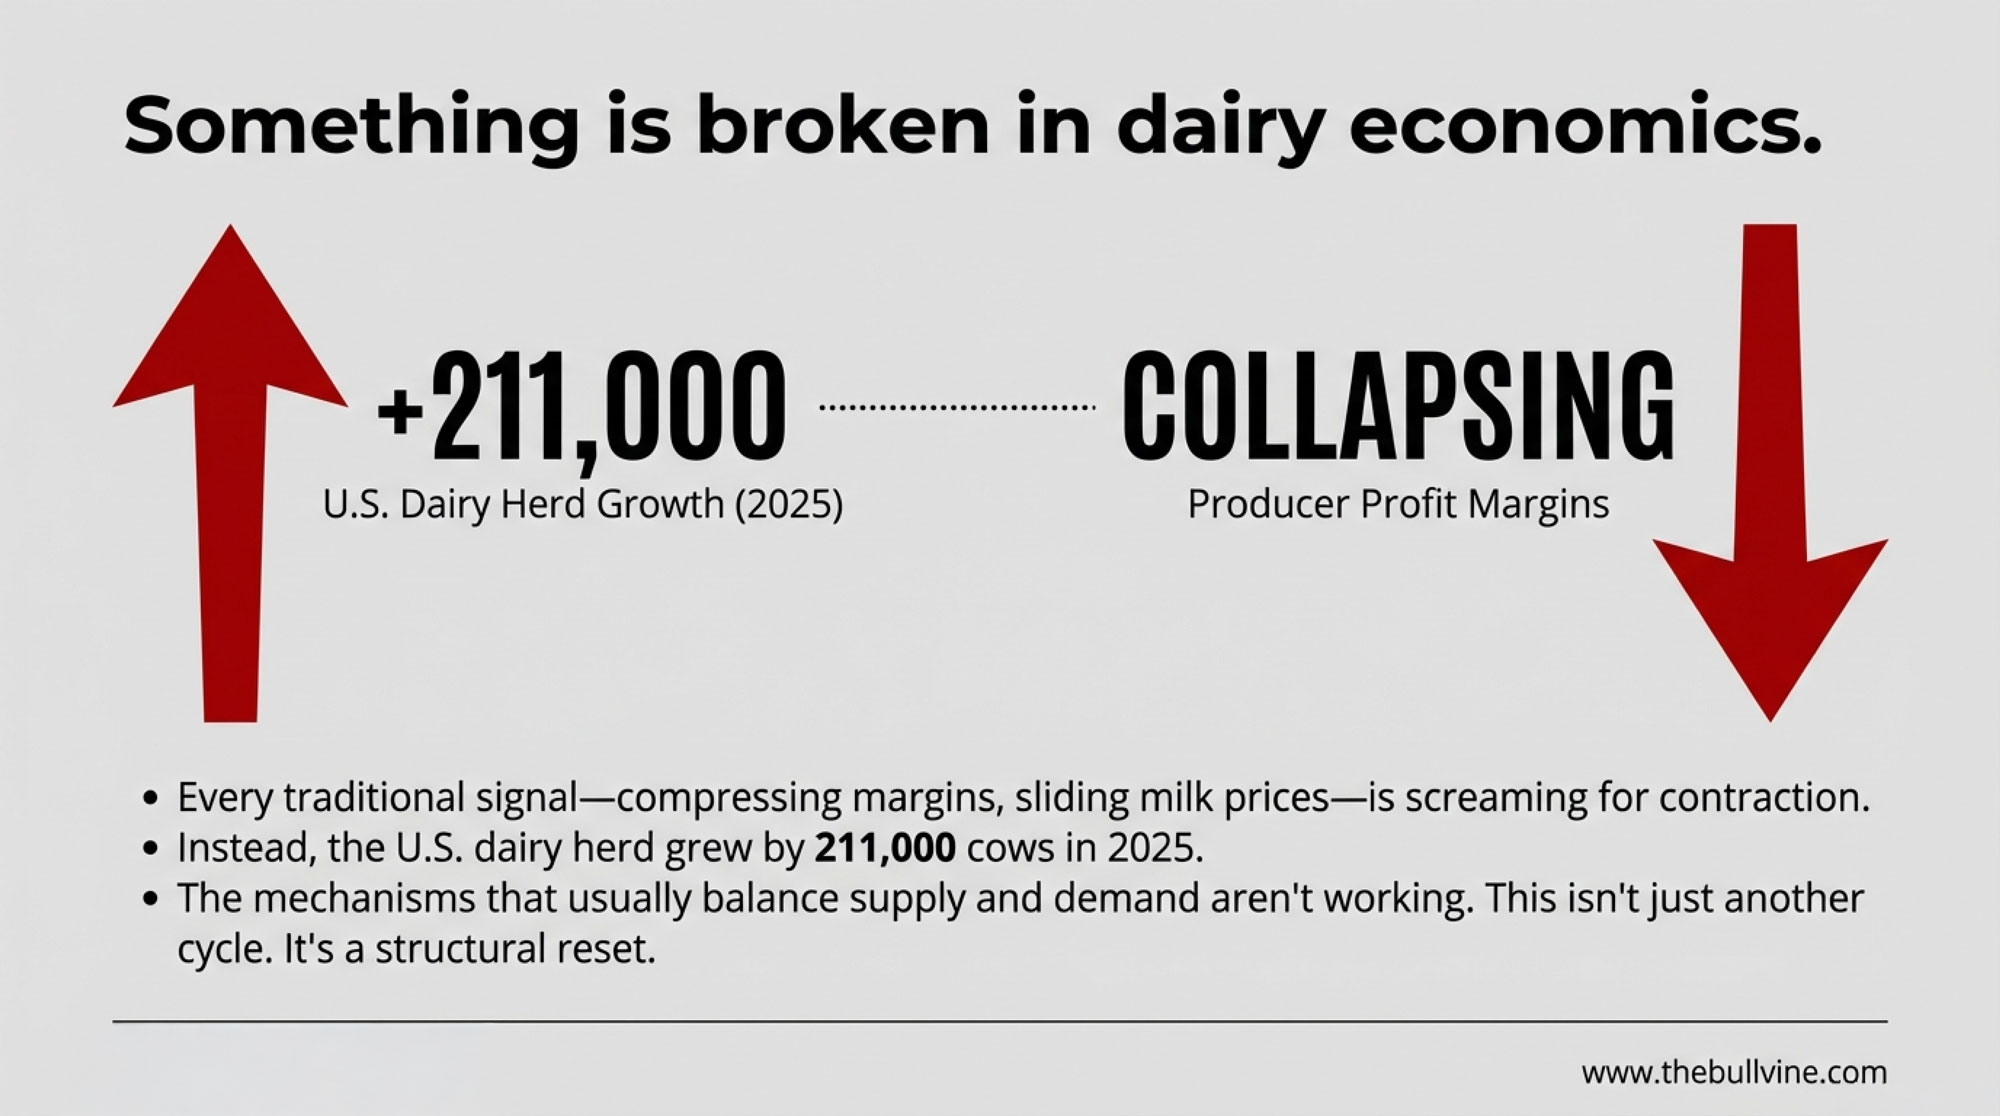
I’ve been watching dairy markets for over a decade now, and what’s unfolding feels meaningfully different from the cyclical downturns we’ve navigated before. The mechanisms that usually bring supply and demand back into balance… they’re just not functioning the way they used to, understanding why that’s happening matters to anyone trying to figure out their path forward.
The Numbers That Matter
Before diving deeper, here’s the data that should frame every strategic conversation you’re having right now:
| Metric | Figure | Source |
| Dairy cow increase (YoY) | +211,000 head | USDA November 2025 |
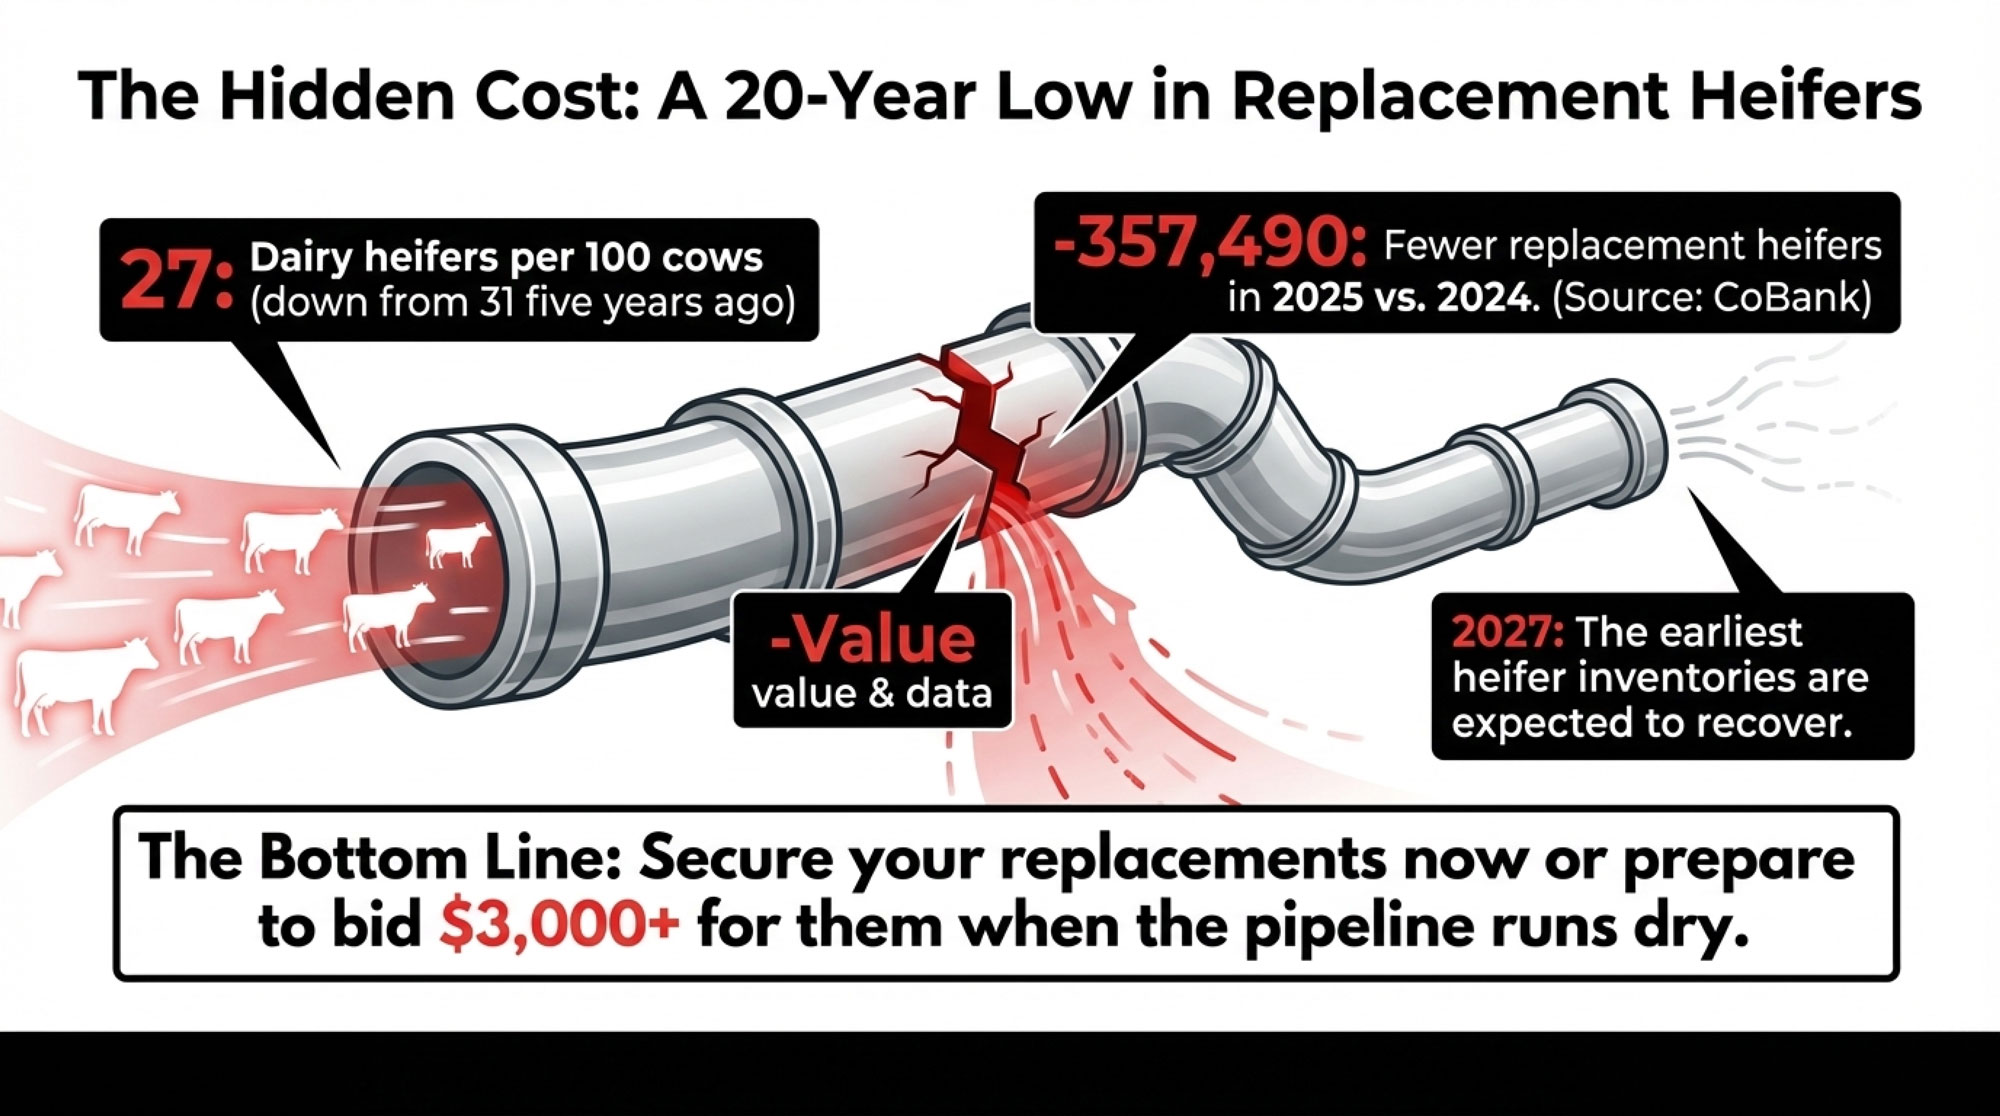
| Fewer replacement heifers (2025 vs 2024) | -357,490 head | CoBank modeling |
| Replacement ratio | 27 heifers per 100 cows | USDA January 2025 Cattle Inventory |
| Cash break-even vs. true break-even gap | $2.00–$4.00/cwt | Cornell DFBS analysis |
| Butter price decline (May–December) | ~35% | Global Dairy Trade |
| Heifer inventory recovery expected | 2027 at the earliest | CoBank forecast |
The Beef-on-Dairy Equation Changed the Calculus
Let’s start with what’s driving that herd expansion, because it explains a lot about the current situation—and raises some serious questions about where we’re headed genetically.
Beef-cross calves are commanding strong premiums right now. Reports from Purina, and various auction summaries show day-old beef-on-dairy calves commonly bringing $900 to $1,400, depending on genetics and region. Laurence Williams, over at Purina’s dairy-beef cross program, has been tracking averages right around $1,400 for quality calves.
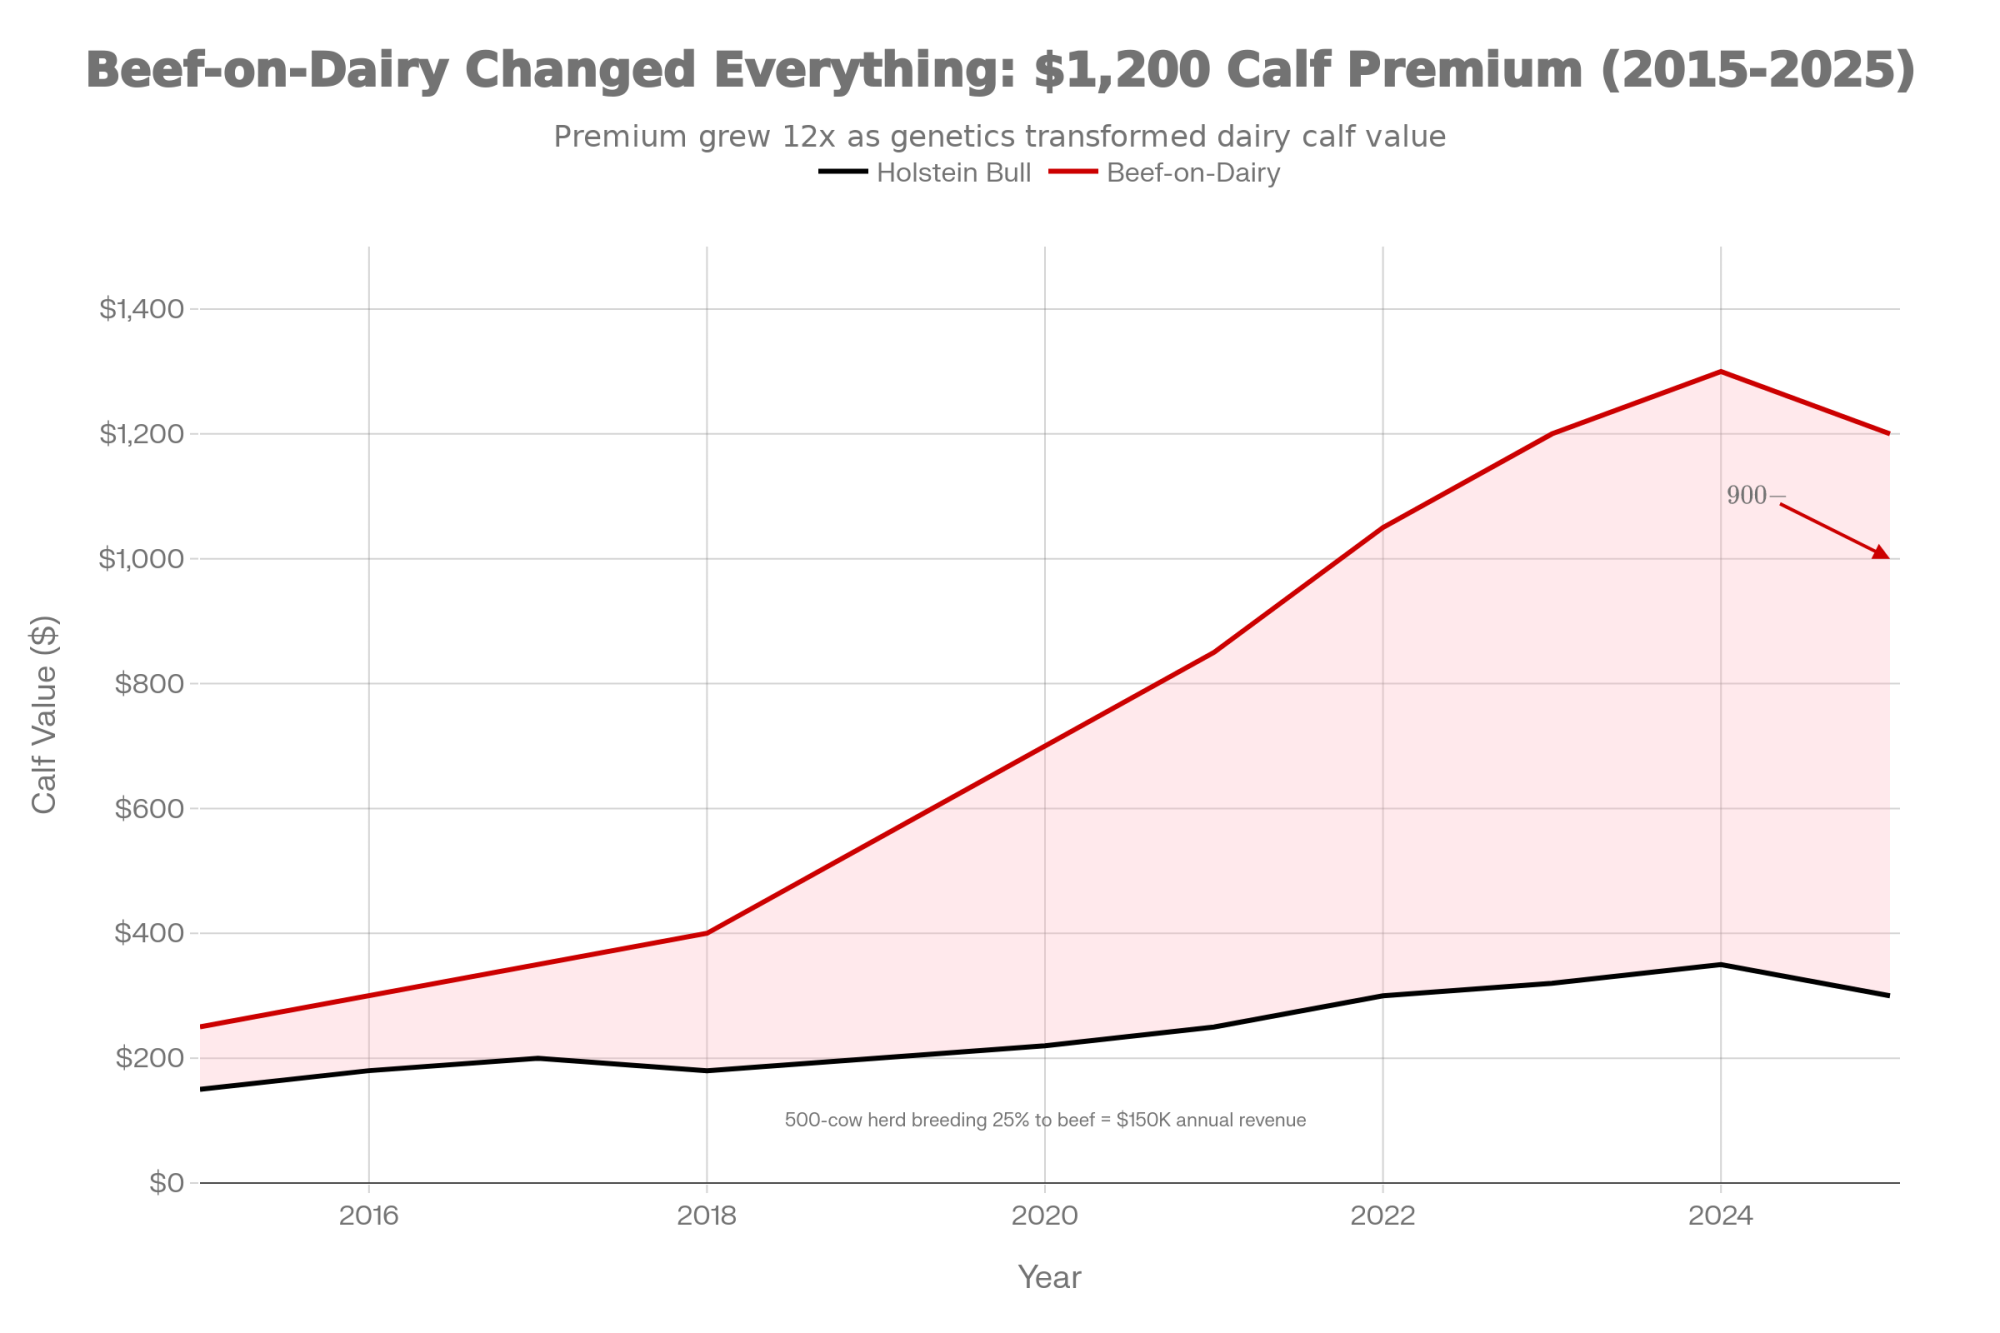
Compare that to straight Holstein bull calves, which in many sale barns are still bringing only a few hundred dollars—often in the $200 to $400 range. The math is just too compelling to ignore.
Industry breeding data and semen sales trends show that beef-on-dairy has gone from a niche to the mainstream. Many herds are now using beef semen on a sizable share of lower-index cows. A 500-cow operation breeding a quarter of its herd to beef generates somewhere around $150,000 to $175,000 in additional annual revenue from calf sales alone.
But here’s what’s keeping me up at night: we’re creating a crisis of replacement heifers.
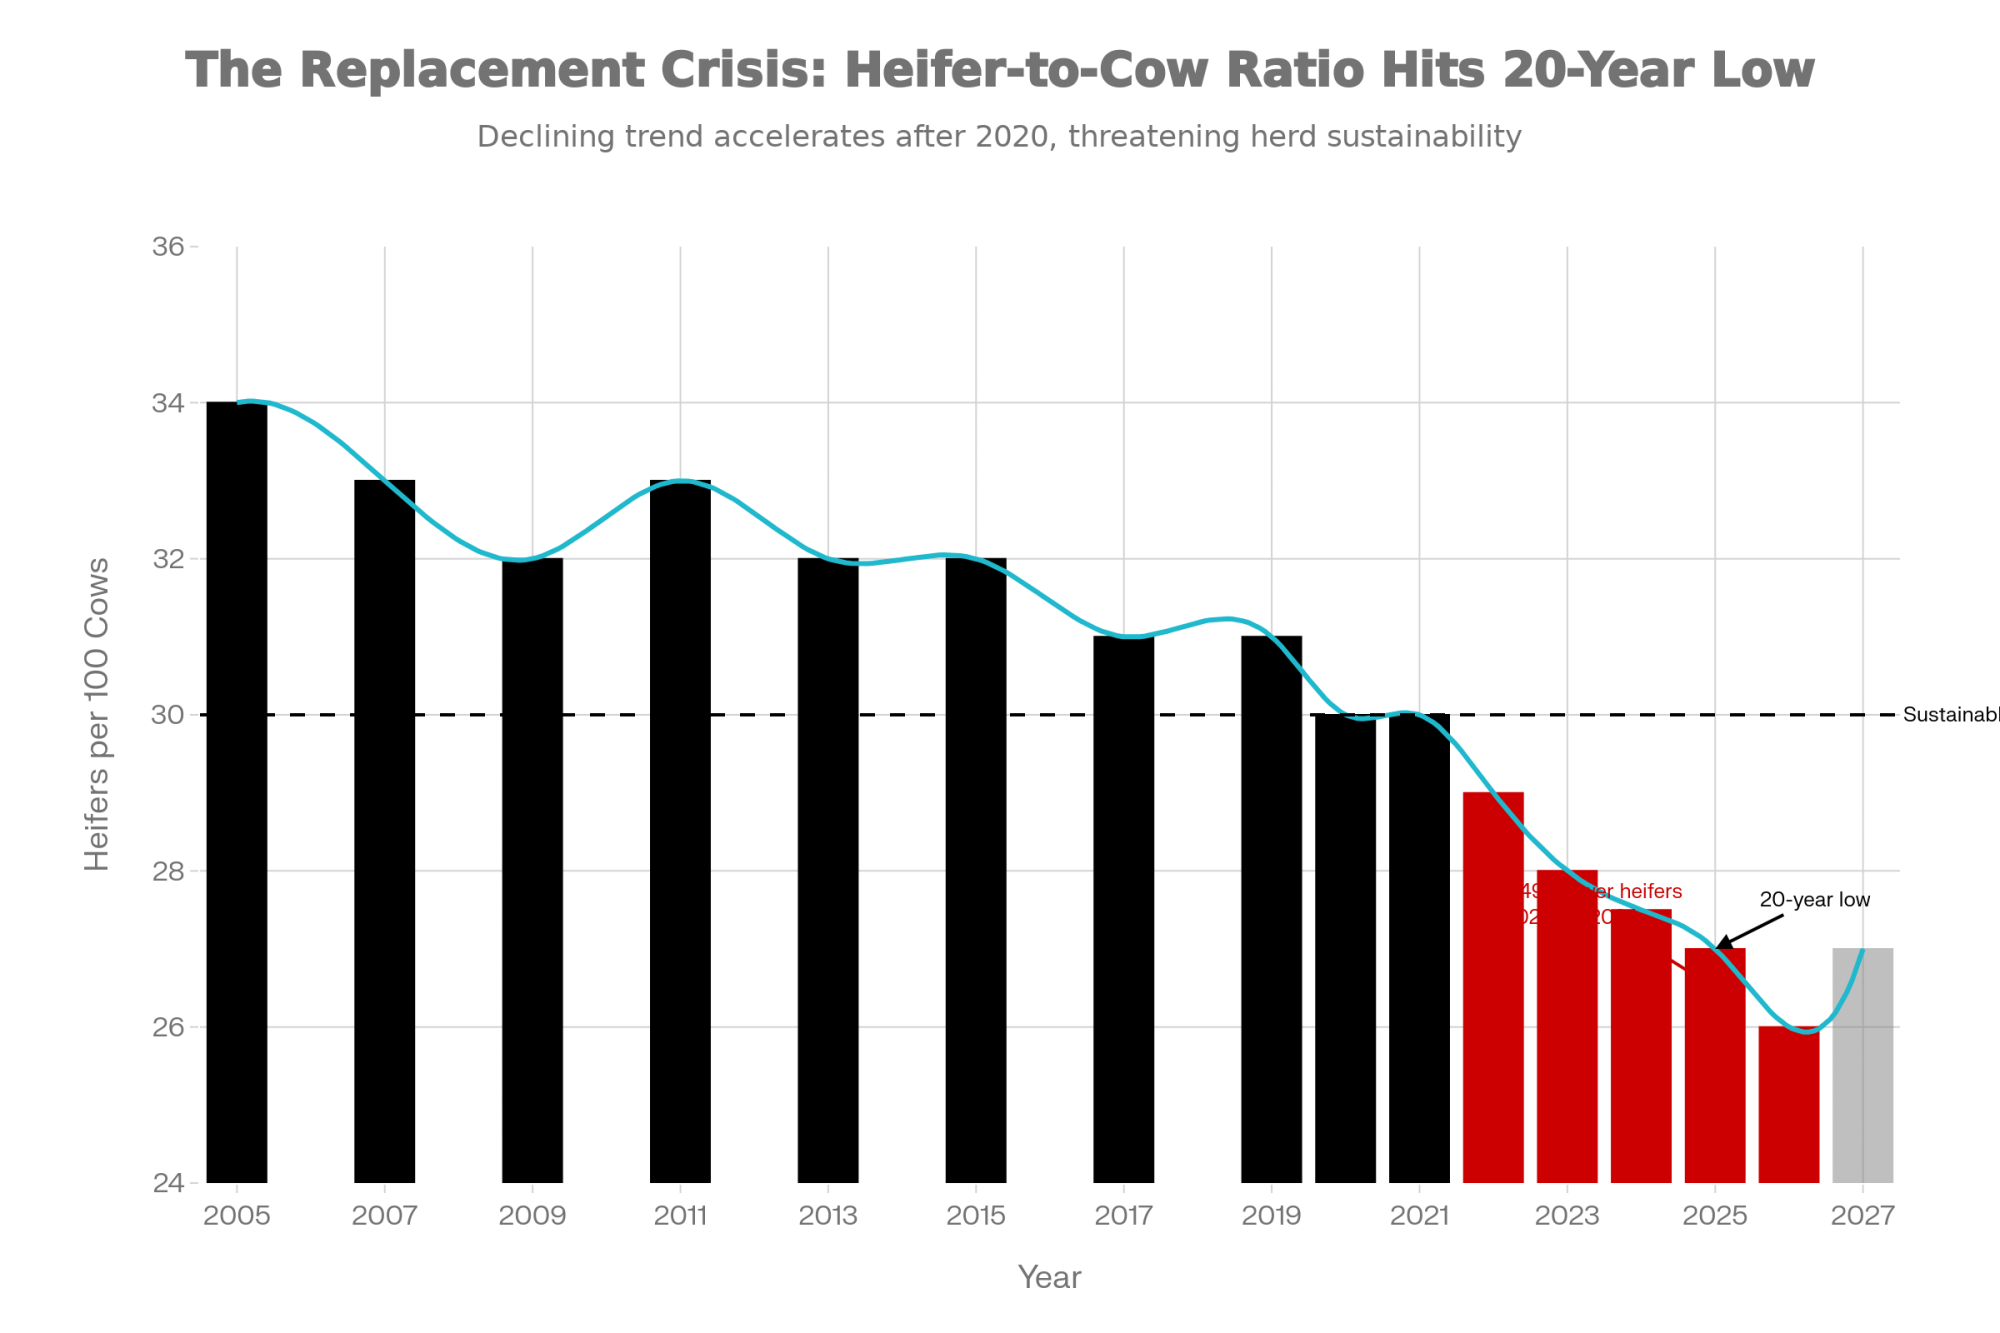
CoBank’s analysis is sobering. Their model predicted 357,490 fewer dairy heifers for 2025 compared to the prior year—driven by more beef-on-dairy calves, fewer conventional dairy semen sales, and only modest gains from sexed semen. Replacement heifer inventories are at a 20-year low and aren’t expected to rebound until 2027 at the earliest.
According to analysis of USDA’s January 2025 Cattle Inventory Report, the dairy herd’s replacement ratio has dropped to just 27 dairy heifers expected to calve for every 100 cows—down from 31 heifers per 100 cows just five years ago. That’s a dangerously thin pipeline.
And there’s a genetic dimension here that doesn’t get enough attention. When we keep older, less efficient cows in the herd because they’re carrying a valuable beef calf, we’re slowing genetic progress for milk production. Every lactation we add to a genetically inferior cow is a lactation we’re not getting from her higher-merit replacement. Research published in the Journal of Dairy Science has documented that herds with high availability of potential replacement heifers have substantially better longevity management options—and faster genetic turnover.
Industry geneticists estimate that every year of delayed genetic turnover costs dairy operations approximately $50 to $75 per cow, due to foregone production improvements, health trait gains, and feed efficiency advances. That’s not nothing—especially compounded across a herd over multiple years.
One Wisconsin producer I spoke with recently—running about 280 cows in the central part of the state—put the dilemma this way:
“I’ve got cows that aren’t really paying their way on milk. Maybe they’re giving me 55 pounds a day, but the components are just okay. Three years ago, she’s on the truck without question. But now she’s carrying a beef calf worth $1,300. How do I justify selling her?”
— Central Wisconsin dairy producer, 280 cows
He’s asking a reasonable question. But multiply that decision across thousands of operations, and you get a national herd that keeps growing even when milk economics alone would suggest contraction—while simultaneously starving the replacement pipeline and slowing genetic progress.
Traditional culling response to low milk prices has been significantly muted. Beef-on-dairy revenue is keeping cows in the herd that would otherwise have been on the truck months ago.
The strategic takeaway: Use beef-on-dairy on your verified bottom 20-30 percent of genetic performers—not random animals, and definitely not your genetic core. Genomic testing matters more than ever when you’re making these decisions.
A Global Situation Worth Understanding
What makes the current environment particularly complex is that this isn’t just a U.S. story.
USDA and international analysts expect global milk production to edge higher in 2025, led by strong U.S. growth and recovering production in Oceania, even as EU output slips slightly. The European Union is actually forecasting a small decline due to environmental and cost pressures, but that’s being more than offset by what’s happening elsewhere.
Normally, when one region overproduces, somewhere else contracts. That’s been the pattern for decades. Research published in the Journal of Dairy Science has documented these offsetting regional cycles going back years—they’ve been a defining feature of how global dairy trade finds equilibrium.
This season looks different.
The Global Dairy Trade auction platform—where about $3 billion worth of dairy products trade annually—has seen prices decline for nine consecutive sessions as of mid-December. That 4.4 percent drop in the most recent auction marked the ninth straight decline in the index. Whole milk powder, butter, cheese… all softening as supply growth outpaces demand.
What this suggests for U.S. producers is that we may not be able to count on export markets to absorb domestic oversupply the way they have in past cycles. International buyers have more options now. Multiple suppliers competing for their business means everyone’s offering competitive prices.
For Canadian producers operating under supply management, the dynamics play out differently—but they’re not immune. P5 quota holders watching U.S. oversupply should recognize that cross-border price pressure affects ingredient markets, and the component value shifts happening south of the border tend to ripple through eventually. The fundamentals around protein versus fat valuation are worth watching regardless of which side of the border you’re milking on.
That said—and I want to be fair here—trade dynamics can shift quickly. Strong demand from Southeast Asia or supply disruptions elsewhere could change the picture. But for planning purposes, it’s worth understanding the current global context.
The Processing Paradox
Here’s something that seems counterintuitive at first but makes more sense once you understand the underlying economics: all the new processing capacity coming online might actually be contributing to the challenge rather than solving it.
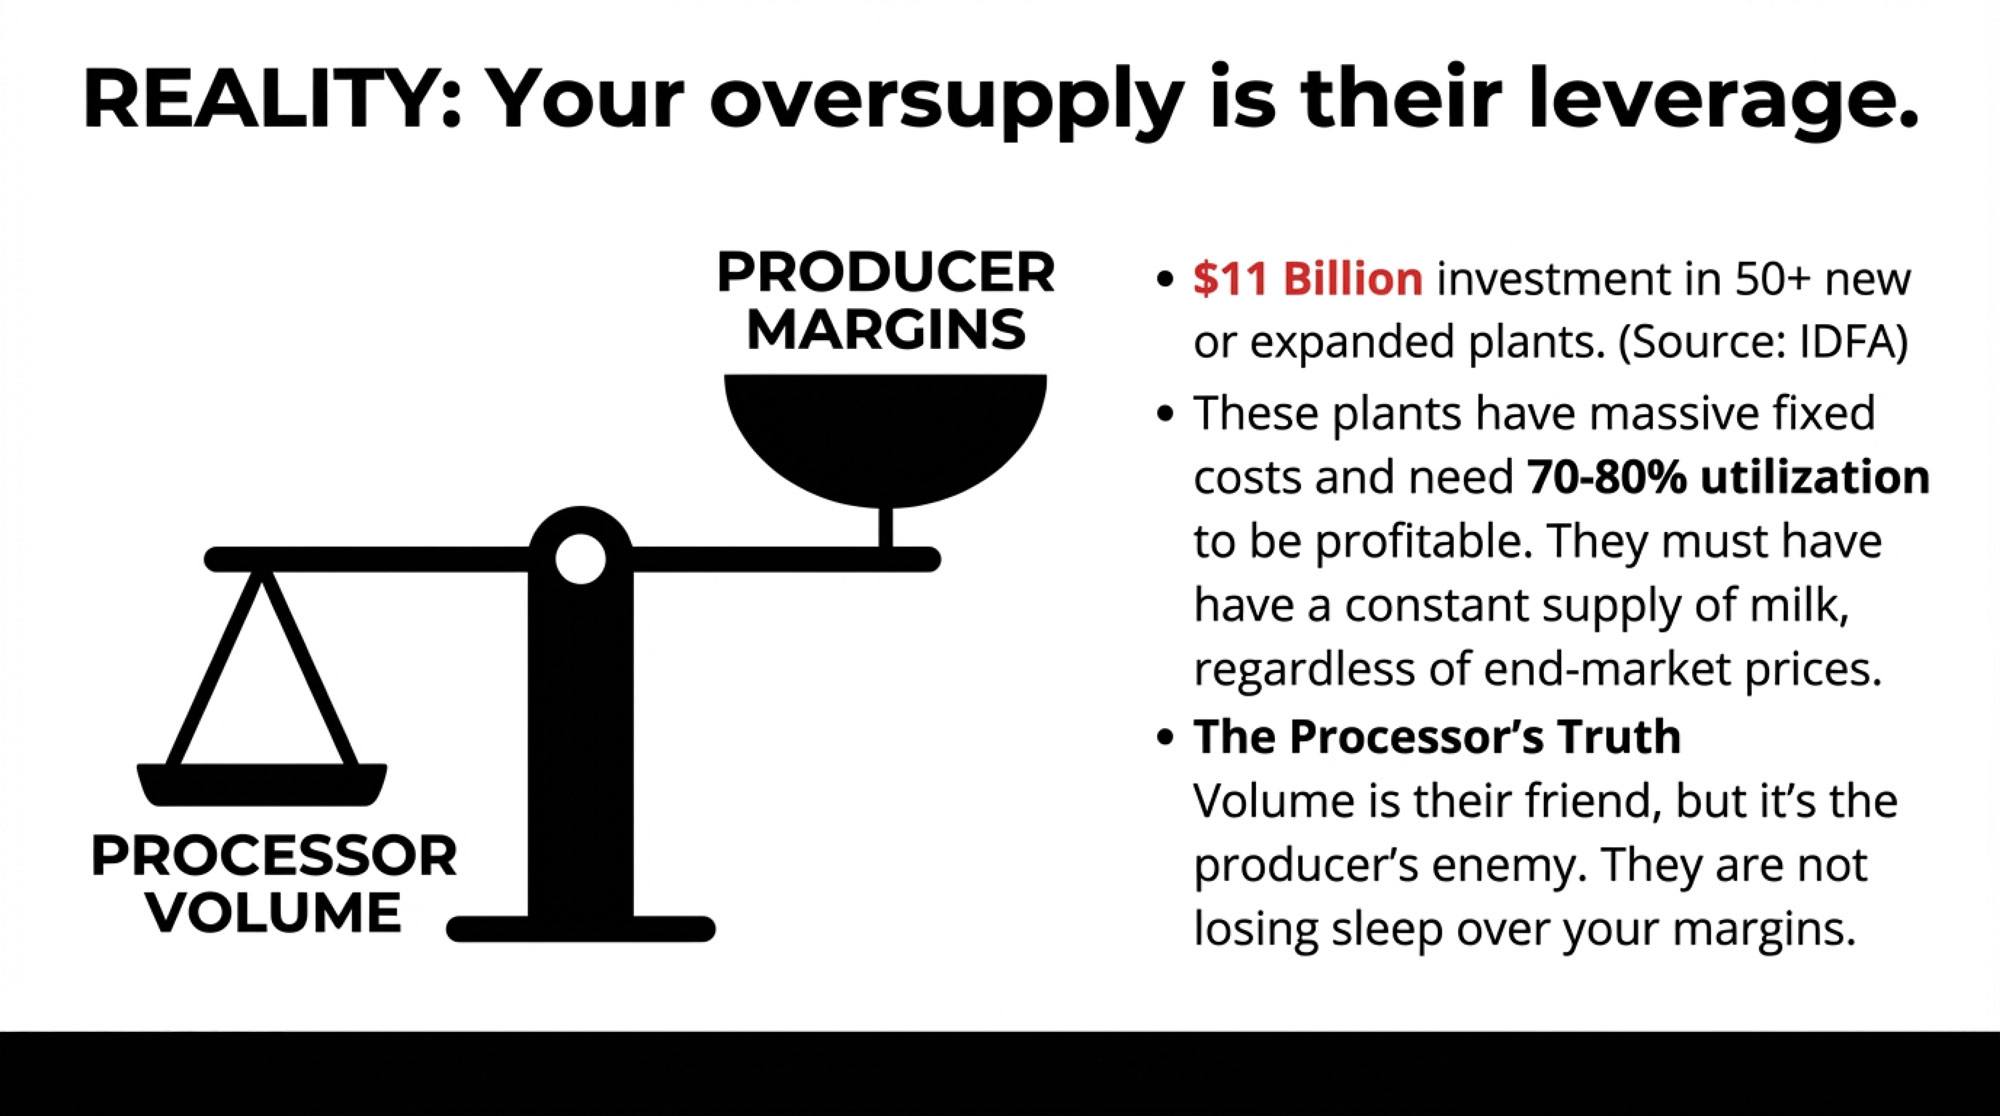
The International Dairy Foods Association released some eye-opening numbers back in October. Between 2025 and early 2028, more than $11 billion is being invested in over 50 new or expanded dairy processing facilities across 19 states. We’re talking major expansions by companies like Leprino Foods in Texas, Valley Queen in South Dakota, and Darigold out in Washington—substantial capacity additions for cheese, butter, and powder.
On the surface, more processing capacity should help absorb milk supply and support prices. In practice, it’s a bit more complicated than that.
These plants were planned and financed three to five years ago, when milk was running $20 to $24 per hundredweight, and the outlook was considerably more optimistic. The facilities incur substantial fixed costs—debt service, equipment depreciation, utilities, staffing—that don’t change much whether they’re operating at 50 percent capacity or at full utilization.
To cover those fixed costs, the plants need to operate at 70 to 80 percent utilization or better. That means they need milk. Consistently. Regardless of what’s happening in end markets.
Here’s the uncomfortable truth: volume is the processor’s friend, but it’s the producer’s enemy.
When processors compete for milk to fill their vats, it’s helpful to nearby producers. But all that processing creates output—cheese, butter, powder—that still needs buyers. So while a Wisconsin producer might see premiums from regional processor competition, they’re also seeing more cheese hitting markets that were already well-supplied. USDA Economic Research Service data shows domestic cheese consumption growing by maybe 1 to 2 percent annually. New capacity is adding somewhat more to production. Without proportional growth in exports or domestic demand, inventories build, and prices stay under pressure.
Mike North, who leads dairy market intelligence at Ever.ag, addressed this at the 2025 Dairy Strong Conference in Madison. What he said kind of surprised me: “We don’t have enough animals to make all the milk to supply all the plants in the U.S.”
That sounds puzzling, given everything about herd expansion, right?
The explanation lies in geography. The new capacity isn’t always located where the milk is. So you get regional competition for supply, with processors paying premiums to secure the milk they need to run efficiently.
“With all of this cheese potentially coming online, we have a real need for exports,” North noted. “Because we are going to be creating a lot of additional products.”
What’s Happening With Component Values
For nearly a decade, the consistent message to producers was straightforward: push butterfat. And you know what? Producers delivered impressively.
CoBank’s analysis shows U.S. butterfat levels grew from the mid-3.7s in 2015 to just above 4.2 percent by 2024, with some months hitting 4.26 percent according to University of Wisconsin Extension data. That’s remarkable progress driven by Jersey crossbreeding, thoughtful genetic selection, and nutrition programs. Processors rewarded high-component milk with meaningful premiums.
That dynamic appears to be shifting.
USDA Cold Storage data shows butter inventories running above prior-year levels for much of 2025. And spot butter values have trended lower from earlier highs—GDT butter prices dropped from about $3.59 per pound back in May down to roughly $2.31 at December auctions. That’s around a 35 percent decline.
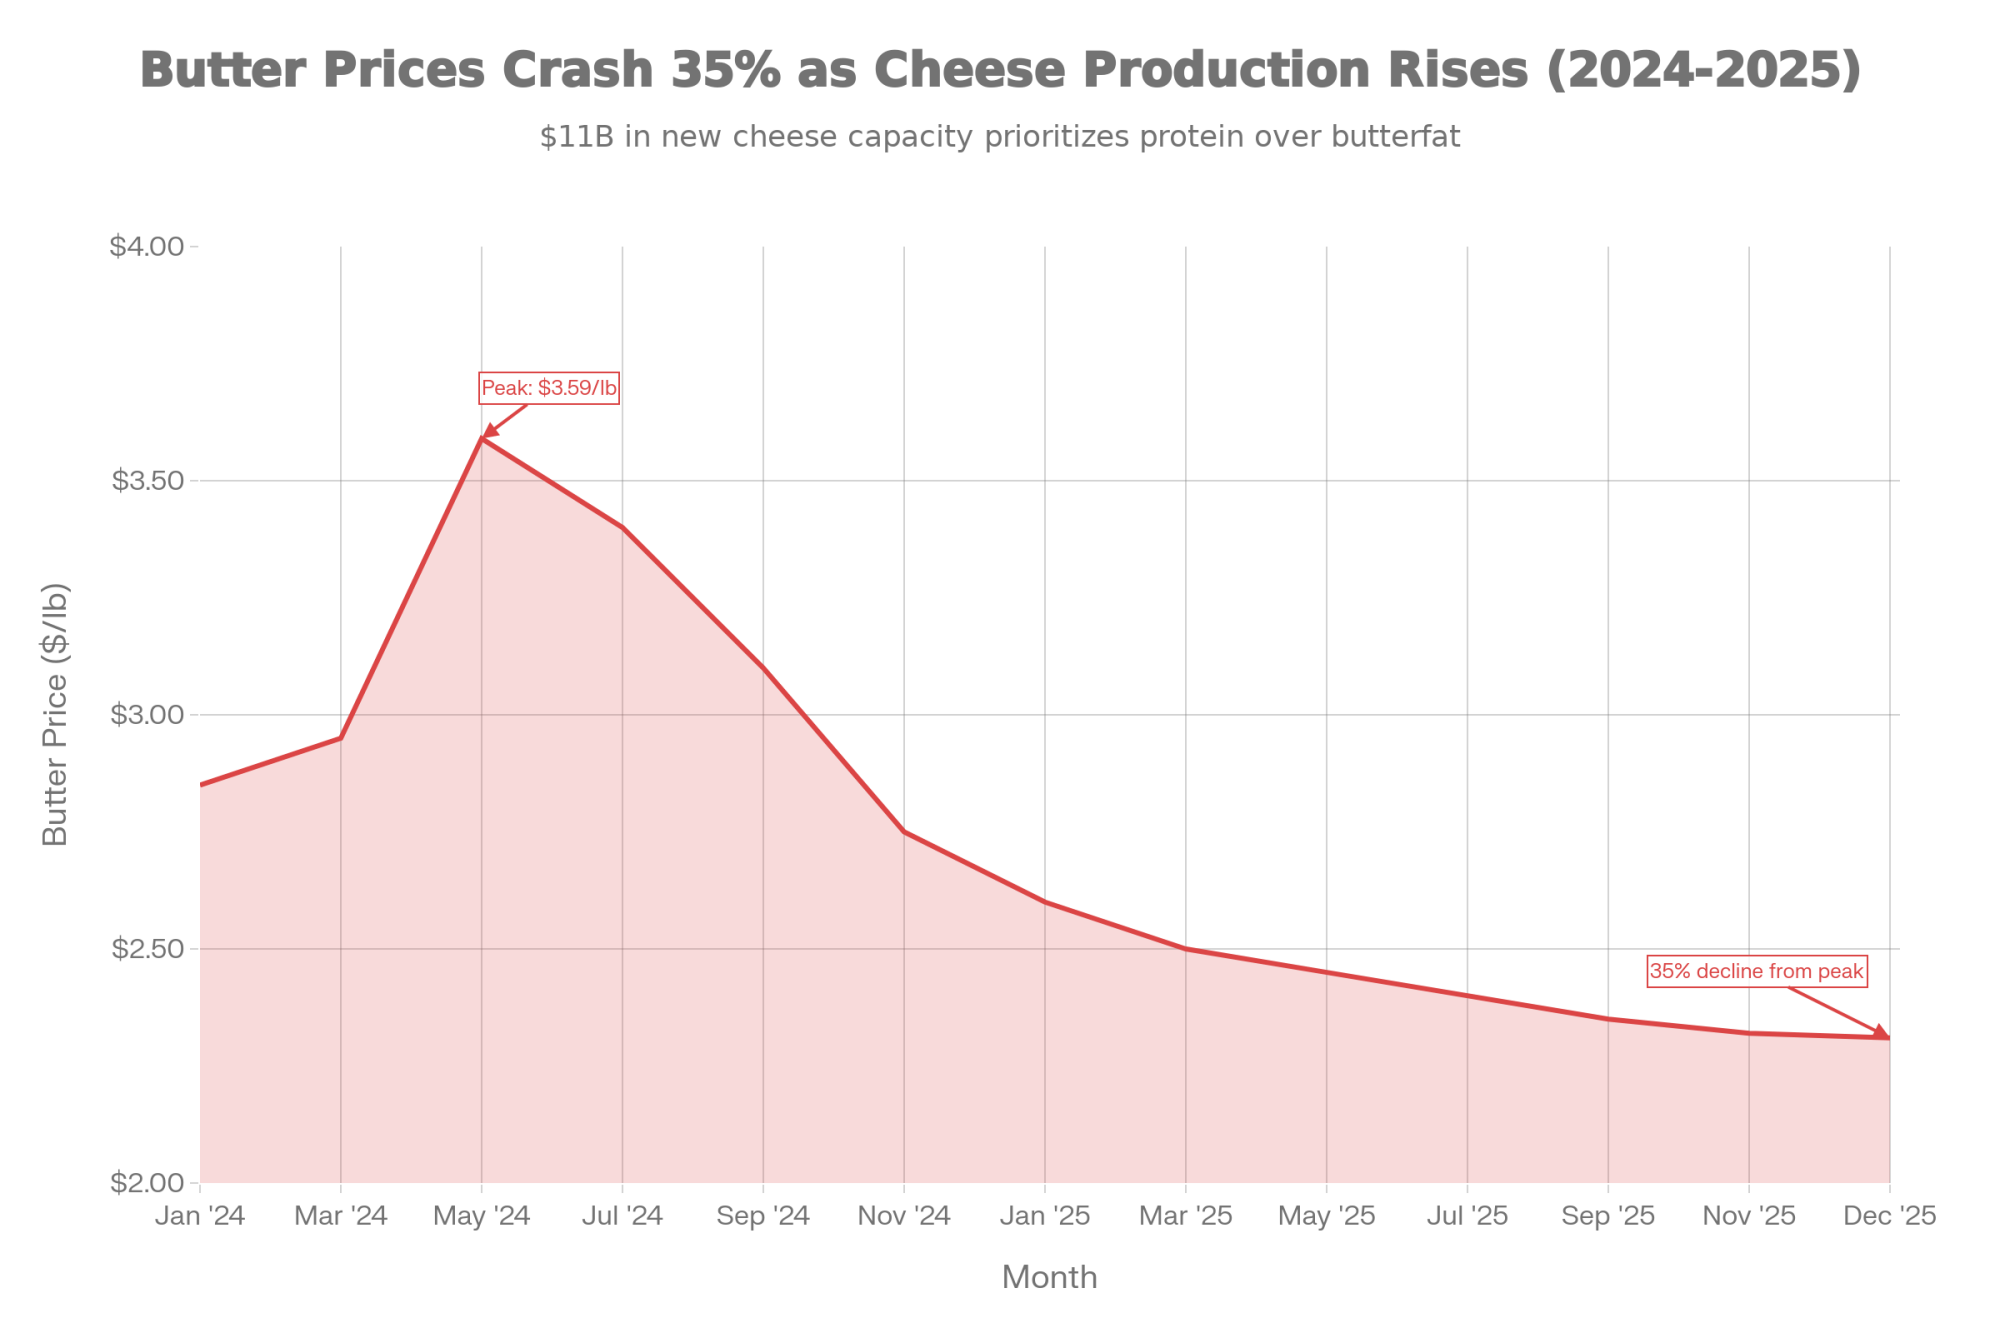
Here’s what I think is really driving the shift: while fat was the “golden child” of the 2010s, these new processing plants—mostly cheese and powder-focused—are hungry for protein and solids-non-fat.
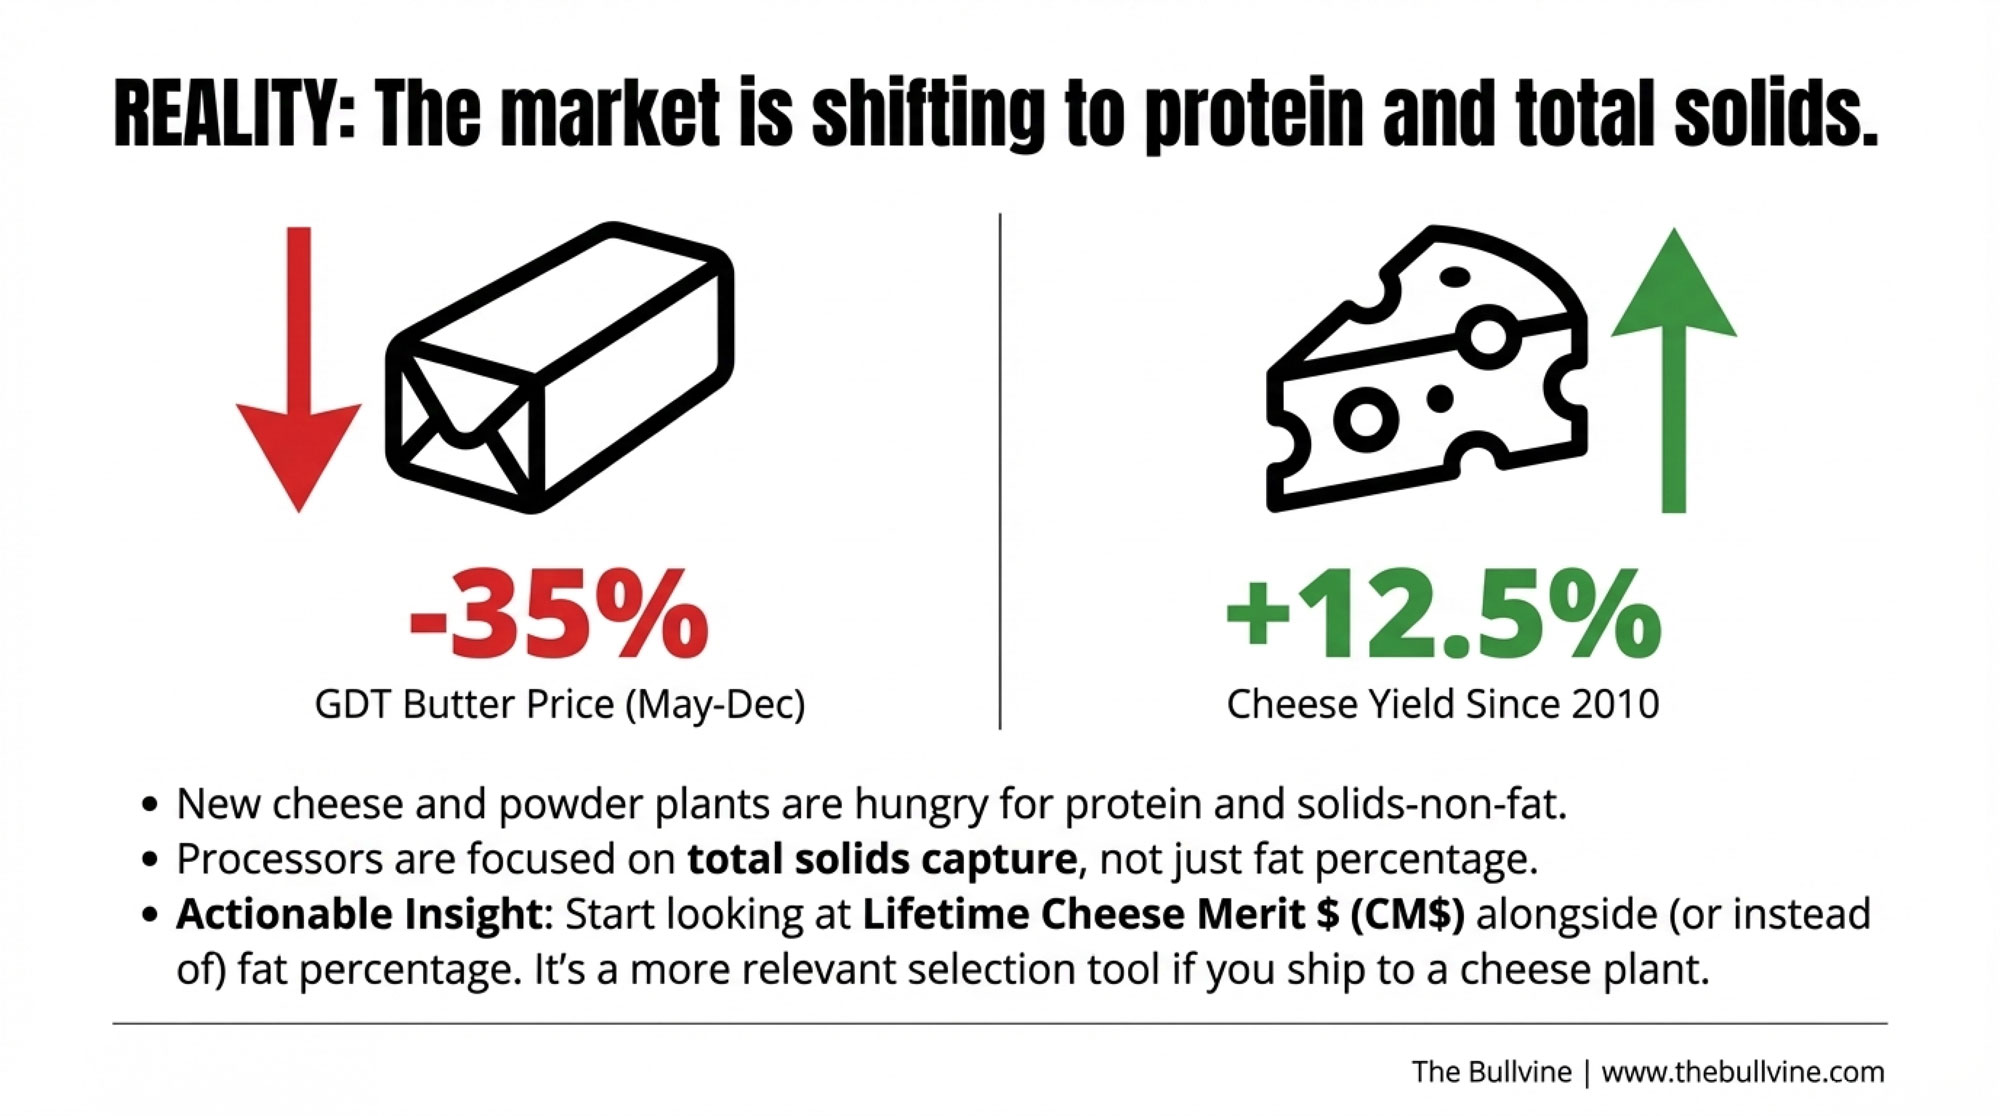
Analysis from earlier this year really drove this home. Cheese yields have climbed to historic highs—100 pounds of milk now yields 11.41 pounds of cheese, up a whopping 12.5 percent from 2010, when yields sat at 10.14 pounds. And what’s driving that improvement? Butterfat and protein together. The processors I’ve talked with are increasingly focused on total solids capture, not just fat percentage.
The Federal Milk Marketing Order pricing adjustments taking effect are affecting how component values translate into producer checks, and the effects are still sorting themselves out.
Practical suggestion: If you’re not already looking at your Lifetime Cheese Merit $ (CM$)—published by the Council on Dairy Cattle Breeding—alongside or even instead of straight fat percentage, now’s the time to start. CM$ places more weight on traits valued in herds selling milk into cheese markets, including greater emphasis on protein. For operations shipping to cheese plants, it may be a more relevant selection tool than traditional indexes.
This really comes back to the breeding decisions you’re making right now. Operations that built genetic programs around butterfat maximization may want to evaluate whether some shift toward protein emphasis makes sense for their situation. That kind of genetic transition, as you probably know, takes three to five years to implement fully.
Of course, component values will keep fluctuating, and every operation’s situation is different. The point isn’t that fat is suddenly worthless—it’s that the economics have become more nuanced than the simple “more fat equals more money” equation that held for most of the past decade.
The Cost Calculation That Deserves Your Attention
This might be the most practically important topic to address, because it directly affects how you evaluate your situation and think through strategic decisions.
Most operations track what I’d call “cash costs”—feed, hired labor, vet bills, utilities, supplies. When producers mention their break-even point, they’re usually referencing this number.
But cash costs don’t capture the complete picture. Not by a long shot.
When you add in unpaid family labor—and Cornell’s Dairy Farm Business Summary work values this at meaningful dollar amounts per full-time equivalent—the numbers shift noticeably. A farm with the operator and spouse both working full-time represents substantial labor value that may not appear in your break-even calculation.
Then there’s the gap between tax depreciation and actual principal payments on debt. Your tax return might show $75,000 in depreciation on facilities. But if you’re actually paying $180,000 in principal annually on those loans, your real cost is quite different. Cornell’s DFBS work shows that when you factor in actual principal payments instead of just tax depreciation, total cost can easily rise by $1 to $2 per hundredweight compared to cash-cost estimates.
Add family living expenses that come from farm income but don’t show up on Schedule F. Add what economists call the opportunity cost of having capital tied up in the dairy rather than invested elsewhere.
Recent Cornell Dairy Farm Business Summary reports show operating costs for many New York farms in the high teens per hundredweight, with total economic costs—including unpaid labor, capital costs, and family living—often running into the low twenties.
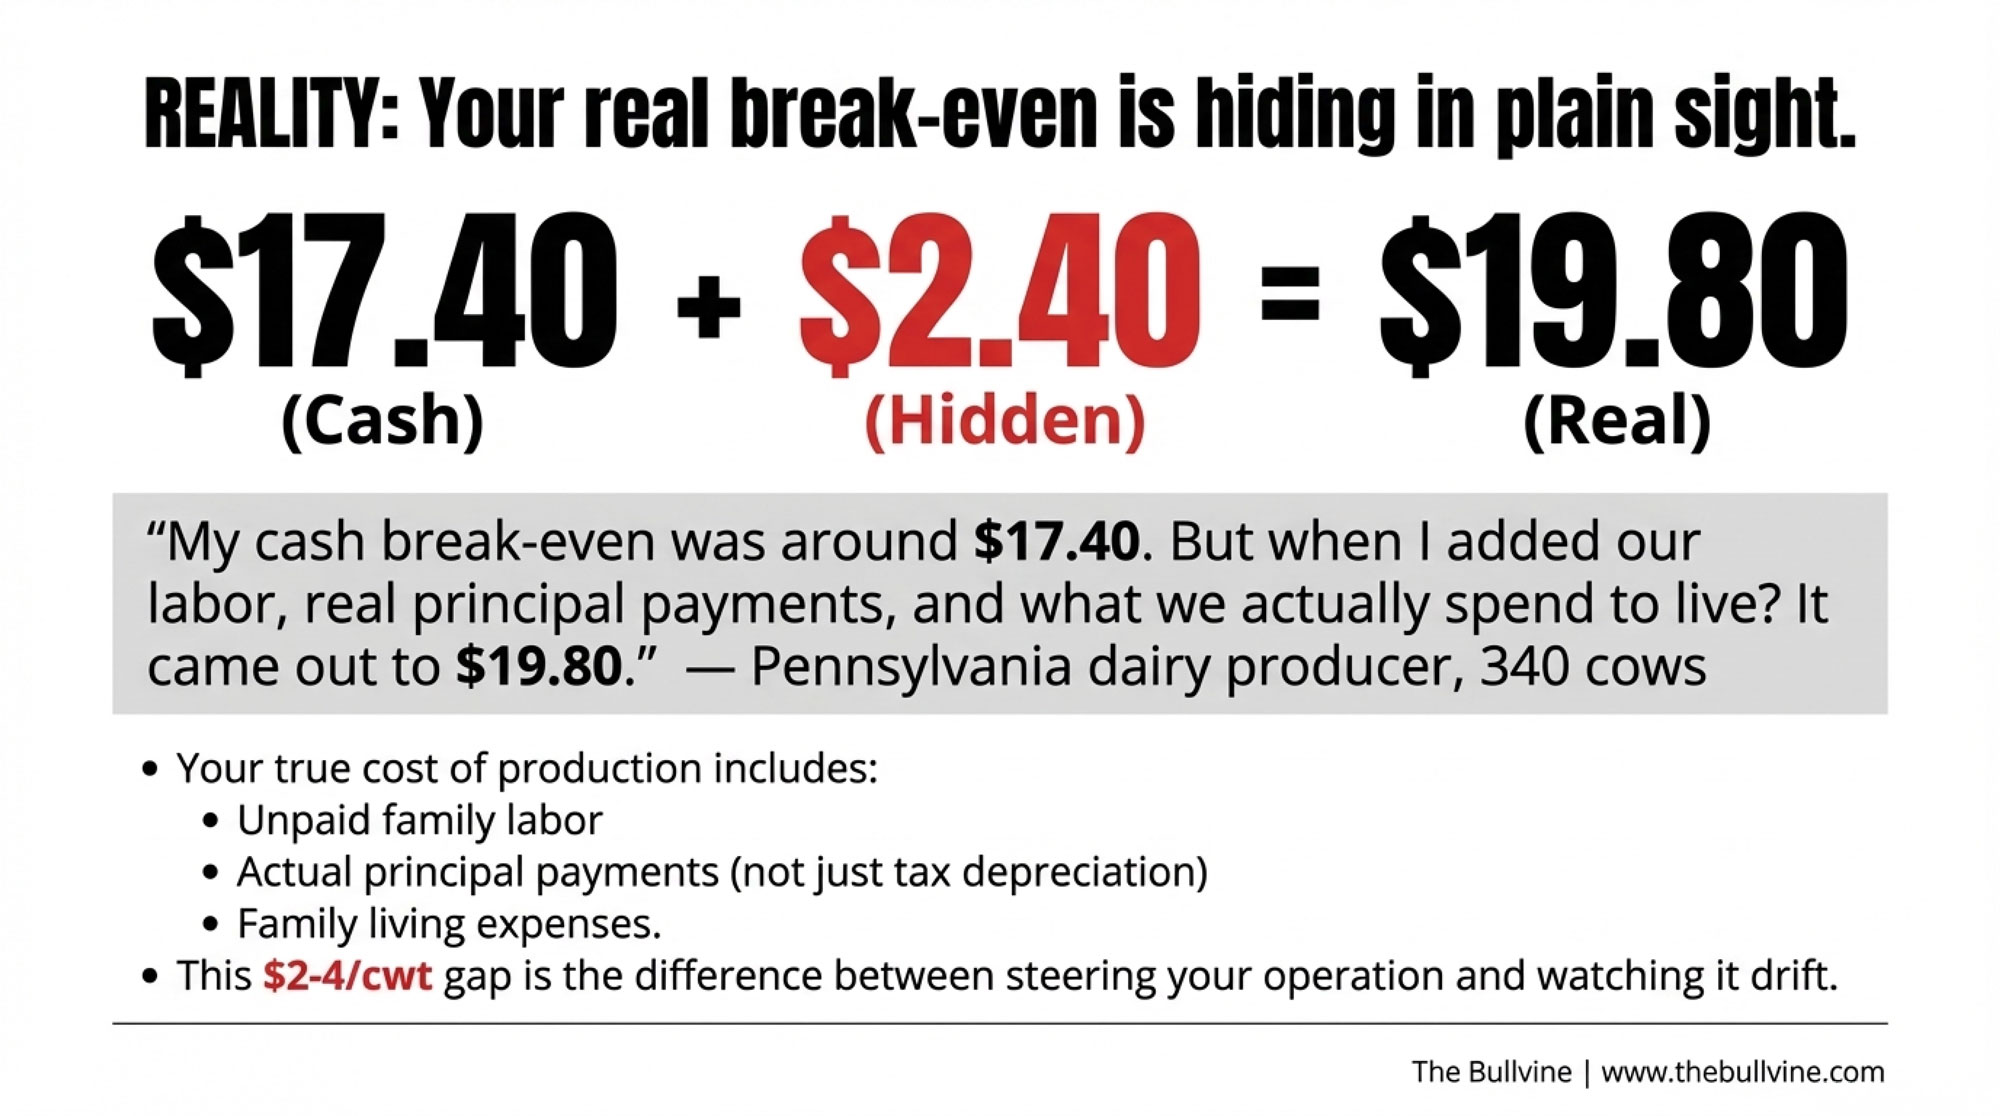
“I ran the numbers three times because I couldn’t believe them. My cash break-even was around $17.40. But when I added our labor, real principal payments, and what we actually spend to live? It came out to $19.80. That was a hard conversation to have with my wife.”
— Pennsylvania dairy producer, 340 cows
| Cost Category | Cash Break-Even ($/cwt) | Real Break-Even ($/cwt) |
| Feed & Purchased Inputs | $8.50 | $8.50 |
| Hired Labor | $2.80 | $2.80 |
| Veterinary & Breeding | $1.20 | $1.20 |
| Utilities & Fuel | $1.10 | $1.10 |
| Supplies & Maintenance | $1.50 | $1.50 |
| Interest Paid | $1.20 | $1.20 |
| Tax Depreciation | $1.10 | — |
| Unpaid Family Labor | — | $1.85 |
| Actual Principal Payments | — | $2.40 |
| Family Living Expenses | — | $1.05 |
| Opportunity Cost of Capital | — | $0.20 |
| TOTAL BREAK-EVEN | $17.40 | $19.80 |
| Hidden Cost You’re Ignoring | — | +$2.40/cwt |
That gap matters when you’re looking at USDA projections suggesting extended periods of $17 to $18 milk in 2026. Operations that believe they’re “close to break-even” based on cash costs may actually be losing $2 to $4 per hundredweight when everything is honestly accounted for.
This isn’t meant to be discouraging—it’s meant to help you see clearly. You can’t make good strategic decisions without understanding your real numbers.
Risk Management Tools Worth Your Consideration
For producers who’ve worked through their cost calculation and recognize potential exposure, several risk management tools deserve a closer look. Each has strengths and limitations worth understanding.
- Dairy Margin Coverage enrollment typically runs from late winter to early spring—check with your local FSA office for exact dates, as they can vary year to year. Historically, the top coverage level has come with a relatively low per-hundredweight premium after federal subsidy, making it inexpensive catastrophic protection for the first 5 million pounds. Here’s a consideration worth noting: with feed costs currently moderate—corn projected in the $ 4 range—DMC margins may stay above trigger levels even with softer milk prices. Generally speaking, corn would need to push above $5.50 before DMC payments become likely under current milk price projections. It’s probably not wise to count on meaningful payments, but the coverage is cheap enough that enrollment makes sense for most operations.
- Dairy Revenue Protection offers quarterly revenue coverage with federally subsidized premiums. One detail that catches some producers off guard: coverage typically starts about 5 percent below current market prices. On $17 milk, that means your floor is around $16.15 before protection kicks in. Robin Schmahl has noted this limitation in his market commentary—put options may offer better protection for producers whose break-evens sit meaningfully above projected prices.
- Put options through the CME require a higher upfront premium but allow you to select strike prices based on your actual situation rather than accepting a built-in discount. For operations facing real exposure, the math sometimes favors options despite the higher initial cost.
- Feed forward contracts represent an opportunity worth evaluating this season. Many risk-management advisers suggest locking in a portion—often 40 to 60 percent—of projected feed needs when forward prices look favorable, while leaving some flexibility to take advantage of future dips.
Key Risk Management Considerations for 2026
| Tool | Coverage Level / Strike | Premium Cost | Best For | Key Limitation | 2026 Action Timing |
|---|---|---|---|---|---|
| Dairy Margin Coverage (DMC) | Top tier: Margin above feed cost | Low(~$0.15/cwt after subsidy for 5M lbs) | Catastrophic protection; tight-margin operations | Unlikely to trigger unless corn >$5.50 with $17 milk; covers margin, not price | Enroll late Feb-early Mar (check local FSA) |
| Dairy Revenue Protection (DRP) | ~5% below current market | Moderate(federally subsidized) | Operations within 10-15% of break-even | Coverage starts 5% below market—$17 milk = $16.15 floor | Early Feb for Q2 (Apr-Jun coverage) |
| CME Put Options | Custom strike at/above break-even | Higher (full premium, not subsidized) | Operations with break-even >$19; need specific floor | Upfront cost; requires market knowledge | Q1 2026before volatility increases |
| Feed Forward Contracts | Lock corn/soybean prices | Varies by basis, timing | Securing input costs when forwards favorable | Lose flexibility if cash market drops; typically lock 40-60% | Q1 2026 for growing season |
| LGM-Dairy | Gross margin protection | Moderate-High (some subsidy) | Comprehensive margin coverage | Complex; 27-hour weekly enrollment windows | Weekly Fri-Sat windows |
The timing element matters here. Options and insurance products tend to become more expensive as market volatility increases. Producers who secure protection earlier—before first-quarter results confirm or deny margin pressure—typically access better pricing than those who wait until the situation becomes clearer.
Strategic Considerations for Different Operations
The segment facing perhaps the most complex decisions right now is the 200- to 400-cow operation. Large enough to have meaningful capital at risk. But potentially facing questions about whether the scale economics work if milk settles into the $19 to $20 range that many analysts suggest as a reasonable baseline.
Looking at the options realistically, there are three general paths producers are considering:
- Scaling up to 700 to 1,000-plus cows can achieve cost structures that work better at projected price levels. The requirements are substantial, though—$3 to $5 million for facilities, equipment, and livestock based on current costs. And then there’s labor. Finding and retaining quality employees has become increasingly challenging across dairy regions, and larger operations require more sophisticated workforce management. This path tends to make sense for operations with strong balance sheets, favorable regional positioning, clear next-generation commitment, and confidence in building a reliable team.
- Optimizing at the current size while managing costs aggressively remains viable for operations that can get their numbers to work. University of Wisconsin Extension analysis suggests realistic reductions of $0.75 to $1.20 per hundredweight are achievable through improved feed efficiency, labor optimization, and purchasing improvements. Whether that’s sufficient depends entirely on where your true break-even point sits relative to projected prices—and on your broader goals for the operation.
- Strategic transition while equity remains strong represents a financially rational consideration for some, particularly producers approaching retirement age without clear succession or those in regions where cost structures have become especially challenging. The reality—uncomfortable as it may be to discuss—is that producers who make this decision while they’re choosing rather than being forced generally achieve better outcomes than those who wait.
Now, I want to be fair here. There’s a different perspective worth acknowledging. Not everyone sees the outlook the same way. Some analysts point to potential supply response as beef-on-dairy calf values moderate, or unexpected demand growth from food service channels. Keith Woodford, an agricultural economist who’s studied dairy markets extensively, has cautioned against assuming current trends continue in a straight line. Markets have surprised observers before, and they’ll do it again.
Even the more optimistic scenarios, though, tend to suggest $19 to $20 milk as a reasonable baseline—not the $22 to $24 levels of 2022. The question isn’t really whether an adjustment is happening; it’s how significant and how prolonged it is.
Regional Factors That Shape Your Decision
Geography matters considerably in how these dynamics play out for individual operations.
In Wisconsin, Michigan, Idaho, South Dakota, and parts of Texas, producers often benefit from proximity to new processing capacity, relatively moderate cost structures, and continued infrastructure investment. Expansion strategies tend to pencil out more favorably in these regions, and break-evens generally run lower due to feed costs and regulatory environments.
The Northeast faces different arithmetic. Higher land costs, higher labor costs, and limited expansion opportunities make large-scale operations harder to justify economically. Many of the successful operations I’ve encountered in New York, Pennsylvania, and Vermont have differentiated themselves through organic certification, grass-fed programs, or direct-to-consumer relationships rather than competing primarily on volume.
California still leads the nation in total milk production, but its share of U.S. output has slipped as growth has shifted inland to states like Texas, Idaho, South Dakota, and Kansas. Higher labor and compliance costs, along with water constraints, are part of that story—and the trend seems likely to continue, though California will certainly remain a major dairy state.
Practical Considerations for the Year Ahead
After working through all of this, what actually matters for producers making decisions right now?
- Understanding your real numbers. The true cost of production—including unpaid labor, actual principal payments, family living, and capital costs—often runs several dollars per hundredweight above cash costs alone. Strategic decisions work better when they’re based on complete information.
- Recognizing this environment may be different. The mechanisms that normally bring markets back into balance—culling in response to low prices, regional production adjustments, export market absorption—don’t appear to be functioning quite the way they have historically. Planning for eventual recovery to $22-$24 milk may be optimistic.
- Using beef-on-dairy strategically, not reflexively. Genomically test everything. Target your verified bottom 20-30 percent of genetic performers for beef crosses—not random animals, and definitely not your genetic core. The calf premium matters, but having quality replacements available in 2027-2028 matters more.
- Rethinking component selection. Look at the Lifetime Cheese Merit $ (CM$) if you’re shipping to cheese markets. Protein is gaining importance relative to fat as new cheese capacity comes online.
- Considering risk management earlier rather than later. Check with your local FSA office about the timing of DMC enrollment. Feed contracts secured in the first quarter protect against potential price increases. Protection tools are generally most cost-effective before volatility increases.
- Making decisions proactively. The first half of 2026 is a window during which most producers still have options. Waiting to see how things develop sometimes means accepting whatever options remain.
The Bottom Line
Over the next few years, the U.S. dairy industry will likely produce roughly the same total milk volume—but with fewer operations, greater geographic concentration in lower-cost regions, and generally larger scale.
The adjustment period won’t be comfortable for everyone. But it also creates opportunity for those who recognize what’s happening and position accordingly—whether that means building an operation optimized for current market realities, or thoughtfully transitioning capital and energy elsewhere.
The producers who navigate this period successfully won’t necessarily be those who love dairy the most—though that passion certainly helps sustain the effort through difficult stretches. They’ll tend to be the ones who understood their numbers, made decisions based on realistic assumptions, and built for the emerging market rather than the one that existed five years ago.
I don’t pretend to know exactly how the next few years will unfold. Markets have surprised me before, and they’ll do it again. But the patterns in the data—herd expansion despite margin pressure, a replacement heifer crisis building in the background, global supply dynamics, processing capacity hungry for volume, component value shifts—suggest this is a period that rewards clear thinking and early action rather than hopeful waiting.
Based on CoBank’s modeling, we likely won’t see heifer inventories stabilize until 2027 at the earliest—which means the decisions you make in the next six months will determine your position when that inflection point arrives.
For those of you reading this, the first part of 2026 offers a window for decisions that will shape outcomes for years to come. They’re not easy decisions. They’re not comfortable. But they’re worth making deliberately rather than letting circumstances make them for you.
KEY TAKEAWAYS
- 211,000 more cows while margins collapse — Beef-on-dairy premiums ($900-$1,400/calf) are keeping genetically weaker cows in herds, breaking the culling math that normally corrects oversupply
- 27 heifers per 100 cows — Down from 31 five years ago. A 20-year low that won’t recover until 2027. Secure your replacements now or bid $3,000+ for them later
- $17.40 cash break-even vs. $19.80 real — That $2-4/cwt gap you’re ignoring? It’s the difference between steering your operation and watching it drift
- $11B in new plants need your milk — Processors cover fixed costs with volume. Your oversupply is their leverage. They’re not losing sleep over your margins
- The 2026 playbook — Beef-on-dairy on the bottom 20-30% of genetics only. Breed for protein (CM$), not just fat. Lock risk coverage before spring. Decide now or react later
Complete references and supporting documentation are available upon request by contacting the editorial team at editor@thebullvine.com.
Learn More
- Beyond the Milk Check: How Dairy Operations Are Building $300,000 in New Revenue Today – Stop bleeding cash by identifying five immediate revenue drivers that transcend the milk check. This breakdown delivers a 90-day roadmap for strategic culling and feed efficiency gains, arming you with a $300,000 competitive advantage.
- The Heifer Crisis Hiding in Plain Sight: Why Your Next 90 Days Determine Your 2028 Herd – Secure your operation’s future by navigating the biological trap of the current heifer shortage. This analysis exposes the 30-month lag in breeding decisions, revealing how your next 90 days dictate who’s milking in 2028.
- Genetic Correlations Upended: Why Sticking with Old Breeding Indices Could Cost Your Dairy $486 Per Cow – And What the Data Really Proves – Outperform the competition by adopting the 2025 genetic reset that favors real-world profit over outdated showring standards. This guide reveals how the new Net Merit weights deliver $486 more lifetime profit through superior feed efficiency.
 The Sunday Read Dairy Professionals Don’t Skip.
 The Sunday Read Dairy Professionals Don’t Skip.
Every week, thousands of producers, breeders, and industry insiders open Bullvine Weekly for genetics insights, market shifts, and profit strategies they won’t find anywhere else. One email. Five minutes. Smarter decisions all week.


