


Is your dairy in the 10–15% Nathan Kauffman says are in ‘significant’ stress at $18.95 milk and 8% money, and would your bank tell you if it was?
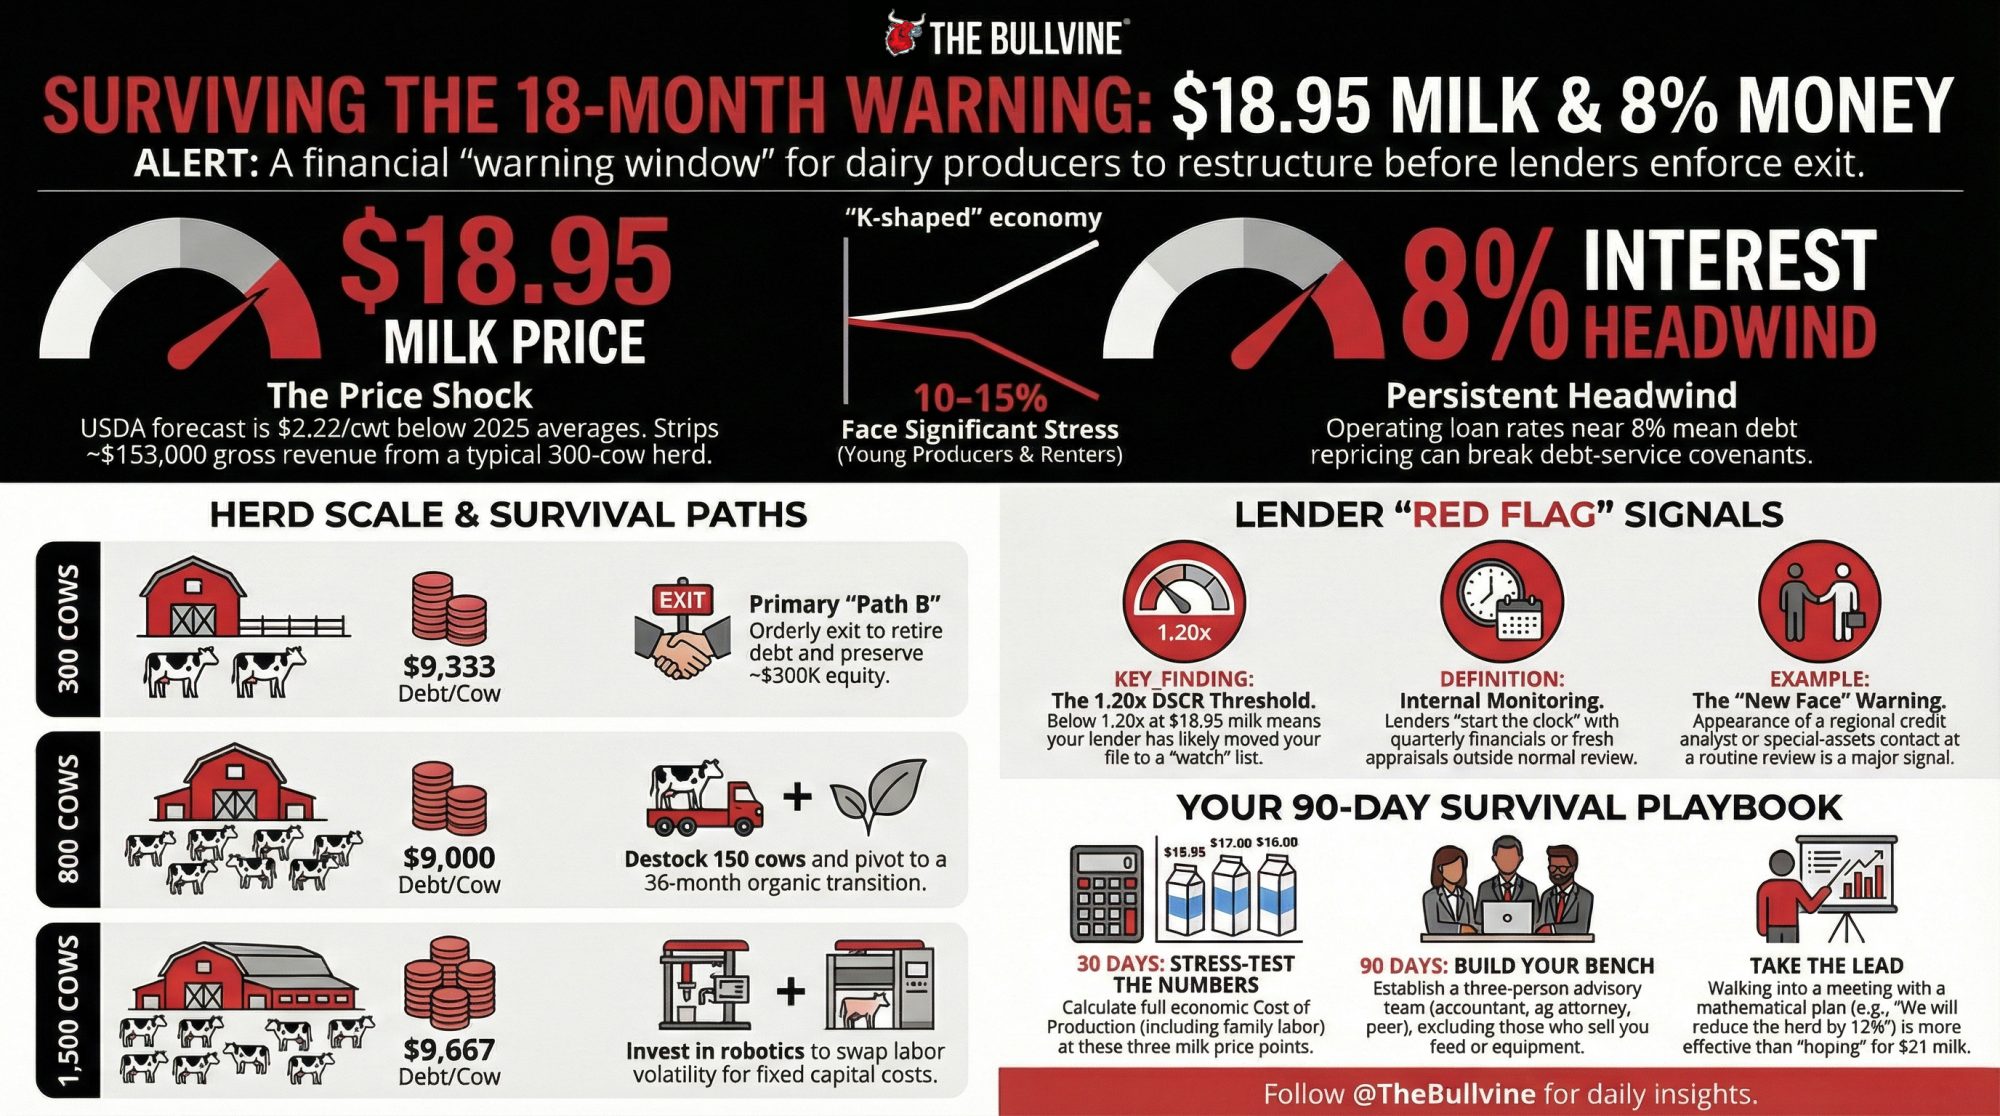
Executive Summary: USDA’s February 2026 WASDE pegs all‑milk at $18.95/cwt, $2.22 below 2025, while USDA‑ERS full‑economic costs for large herds still sit around $19.14/cwt — meaning many dairies are already underwater on paper before interest and principal. Kansas City Fed data shows operating loan rates near 8% and a surge in operating loan volume, with economist Nathan Kauffman warning that 10–15% of producers are in “significant” financial stress even as 80% remain stable. Using three composite herds — 300, 800, and 1,500 cows — the article shows how $18.95 milk, repriced debt, and higher labour costs hit debt‑service coverage ratios and equity, and where fighting, scaling, or exiting pencils actually work. For a 300‑cow herd carrying about $9,300/cow in debt, realistic culling, beef‑on‑dairy premiums, and ration tweaks can close roughly half to three‑quarters of a $195K–$210K cash‑flow gap, while an orderly exit can still retire $2.8M in debt, keep $300K+ in equity, and avoid roughly $200K in herd‑value erosion over 18 months. At 800 and 1,500 cows, the piece walks through concrete “Path A vs Path B” options — components and longer notes vs. destocking and organic premiums, filling empty stalls vs. robots — and shows how each changes DSCR and risk, rather than pretending scale alone is a safety net. It closes with a step‑by‑step DSCR stress‑test at $18.95, $17, and $16 milk, a checklist of lender “red flag” signals, and a 30‑/90‑day playbook so owners can see whether they’re in Kauffman’s 10–15% band and decide how to use the 18‑month clock before their banker uses it for them.
Your lender ran the numbers before you did. While you’re watching Class III futures and tweaking rations, the credit analyst across the hall already stress‑tested your file at $18.95 all‑milk — USDA’s February 2026 WASDE forecast — and flagged the debt service coverage ratio that slipped below covenant. The operating line crept up. Working capital burned faster than revenue replaced it. Nobody said “watch list” out loud. But the file moved.
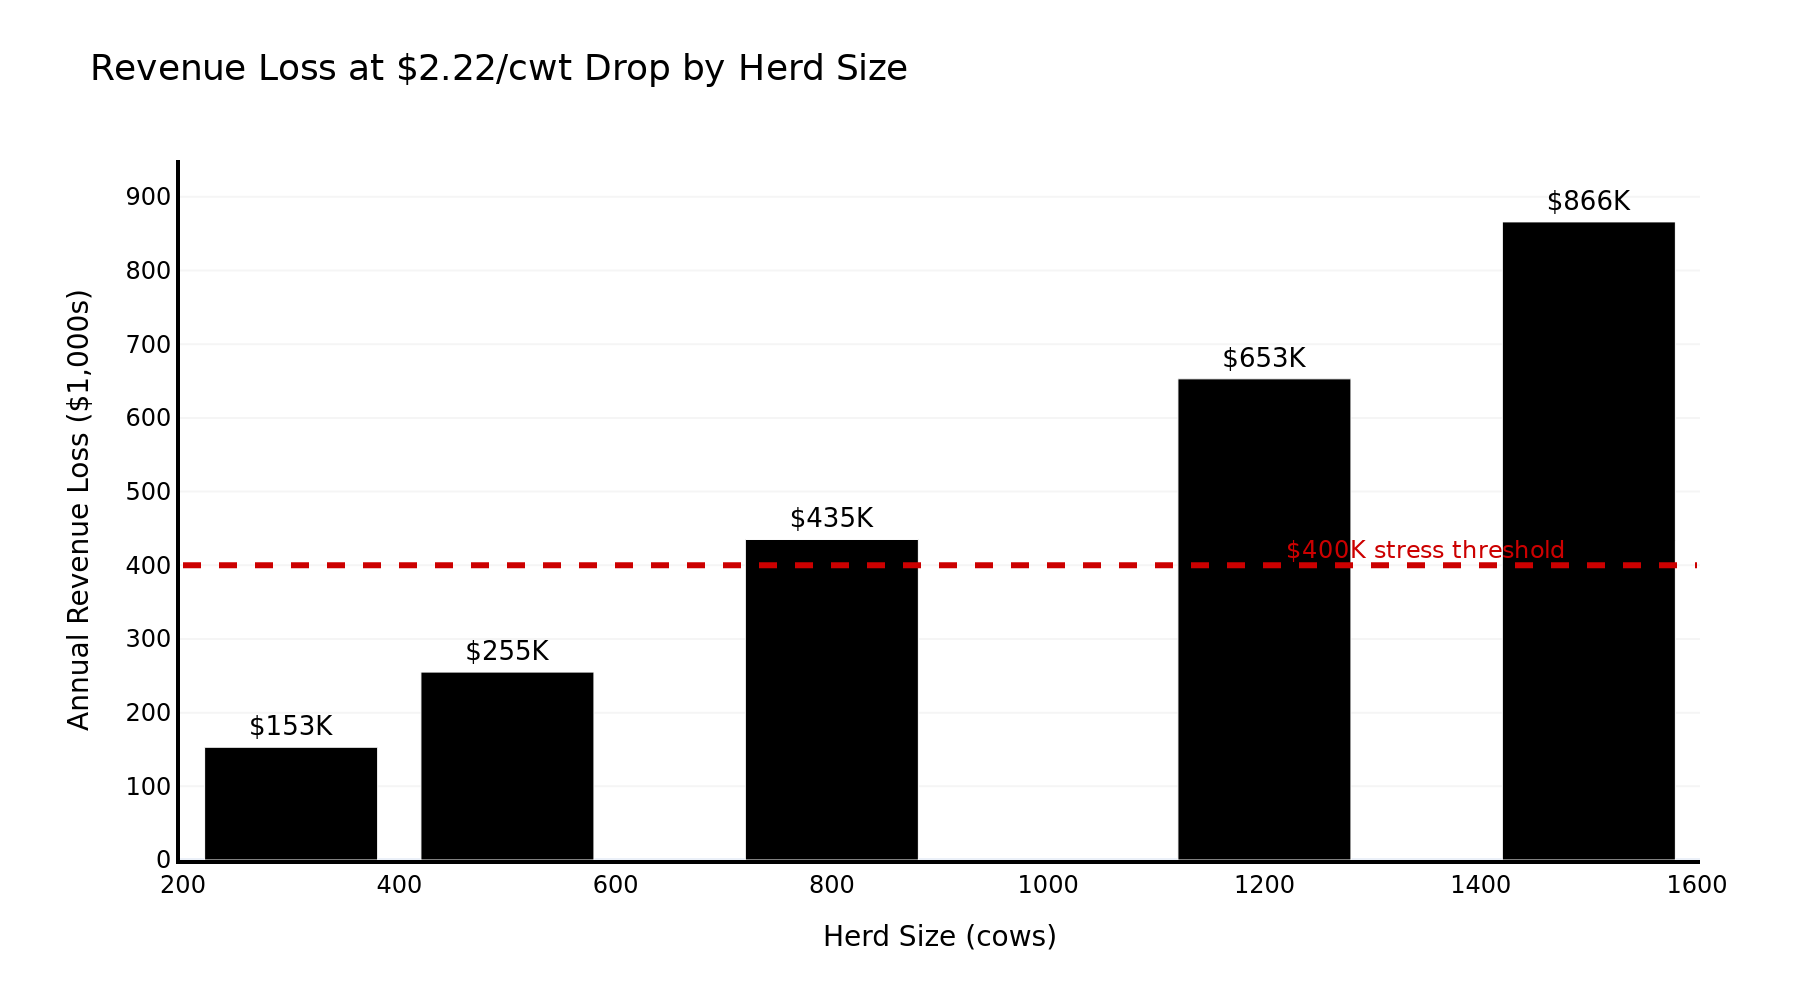
That information gap is one of the most expensive blind spots in farm finance. WASDE has all‑milk down $2.22/cwtfrom a revised 2025 average of $21.17. On a 300‑cow herd shipping 69,000 cwt a year, that’s about $153,000 in gross revenue gone before you touch feed, labour, or interest.

Kauffman’s K‑Shaped Warning
Nathan Kauffman — Senior Vice President and Omaha Branch Executive at the Kansas City Fed, and Executive Director of the Center for Agriculture and the Economy — told a University of Nebraska‑Lincoln webinar on February 12 that the headline credit picture still looks relatively stable. But not for everyone.
“There’s a small increase in delinquencies, but it doesn’t compare with the situation before the pandemic,” he said. Bank debt portfolios show “significant” financial stress for around 10% to 15% of producers — “But that means 80% are still stable.” He described the ag economy as increasingly “K‑shaped”: some operations doing very well, others clearly in distress.
Who’s on the wrong leg of that K? Kauffman pointed at younger producers who haven’t had years to build equity during the 2020–2023 “good years,” and renters without land as collateral. If that’s you, the aggregate averages won’t save your file.
Why the Clock Is 18 Months, Not 12 or 24

Lenders re‑underwrite operating and term debt once a year based on your year‑end numbers. In practice, they’re watching you every month: milk check assignments, feed bills, how your operating line cycles — or doesn’t.
Once internal monitors start blinking — DSCR drifting under 1.25×, working capital down quarter over quarter, an operating line parked at 85%+ with no seasonal dip — your file can move from “performing” to “watch” without anyone saying the words.
Here’s how the 18‑month window plays out:
- Year 1 review: Lender flags concerns, tweaks covenants, maybe orders an appraisal.
- Year 2 review: Lender looks at whether you actually moved the ratios.
- In between: One full production year to bend your numbers back toward safety.
Miss that window, and the conversation hardens. Accelerated repayment. Forced asset sales. Transfer to special assets.
The macro data matches the gut feeling. Kansas City Fed surveys show new farm operating loan volume jumped nearly 40% year‑over‑year in Q4 2025, with strong growth through the year. Farm production loan delinquencies at commercial banks sat around 1.02% in Q4 2025: still low, but trending up.
USDA‑ERS puts the full economic cost for herds of 2,000+ cows at $19.14/cwt, based on the 2021 ARMS dairy survey — the most recent available. That includes family labour, owned land, and return on equity; operating costs run lower, but lenders look at the full economic row.
And interest isn’t helping. KC Fed’s Survey of Terms of Lending shows operating loans averaging 8.12% in Q2 2025, down from 8.83% in Q2 2024. Kauffman called the decline “slight” and described interest costs as “a somewhat persistent headwind,” noting some long‑term rates “haven’t moved much, or at all.”
What Cornell’s DFBS Tells You About the Bottom 25%
Before you look at your own books, it helps to know where you sit in the stack.
Cornell PRO‑DAIRY’s 2024 Dairy Farm Business Summary, covering 129 New York farms, shows a wide performance spread. Even in 2023 — a solid milk year feeding into that summary — the lowest‑earning farms struggled to cover debt service. Their debt coverage ratios ran close to or below 1.0× at net milk prices around $22–$23/cwt.
For the long‑term panel group, EB 2024‑5 reports overall DCRs under 1.0× in the repayment analysis, with planned debt payments per cow in the mid‑$500s and farm debt per cow in the mid‑$4,000s. The composite herds below carry heavier debt — $9,000–$9,667/cow — on purpose. They represent the profile Kauffman warned about: expanded when money was cheap, now repricing with less land equity as a cushion.
These composites aren’t real farms. They’re built off real cost structures, current prices, and actual loan‑rate trends. Your job is to plug your own numbers into the same math.
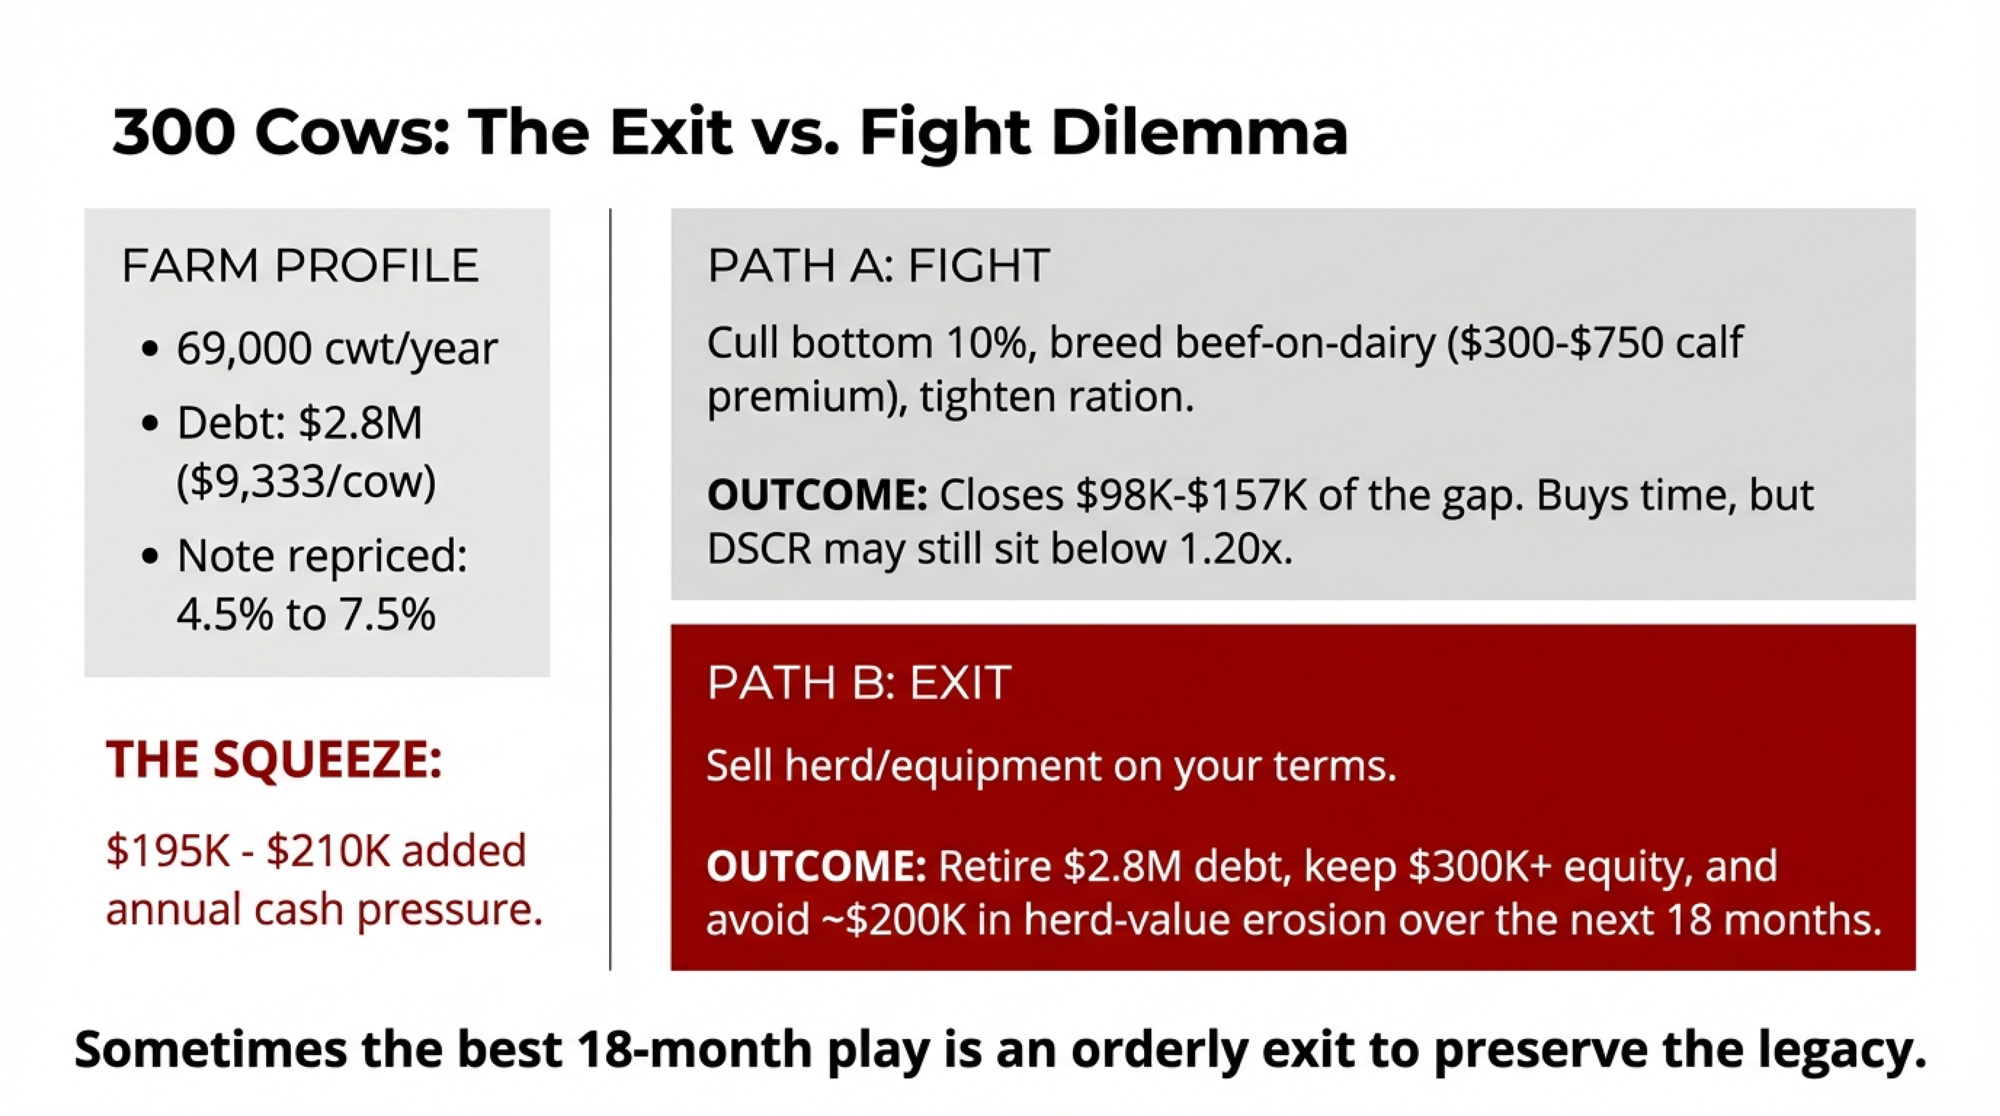

The 300‑Cow Herd: When the Window Is an Exit Question
The setup. Three hundred Holsteins at 23,000 lbs — 69,000 cwt shipped a year. Total debt: $2.8M ($1.6M real estate, $800K equipment, $400K operating line). That’s $9,333/cow — well above Cornell’s quartile averages.
The real estate note repriced last fall from roughly 4.5% to around 7.5%, pushing annual debt service up an estimated $40,000–$55,000 before milk moved a penny.

The squeeze. The $2.22/cwt drop across 69,000 cwt strips out about $153,000 in gross revenue. Layer in the extra debt service, and you’re staring at $195,000–$210,000 in added annual pressure. DSCR can easily slide under 1.0×. That’s covenant‑breach territory.
There’s also money that doesn’t show up in milk price charts. Beef‑on‑dairy calf premiums, cull checks, and government payments have been quietly cushioning margins. In strong Wisconsin markets, crossbred beef‑on‑dairy calves have cleared $1,000–$1,750/head versus $700–$1,000 for Holstein bulls — a $300–$750 per‑calf premium. Real cash. But not guaranteed.
The fight math. Cull the bottom 10%: 30 cows at roughly $137/cwt blended (USDA‑AMS), 1,300 lbs live = $1,781/head → about $53,400 applied straight to the operating line. Breed beef‑on‑dairy on your bottom genetics: ~87 saleable calves → $26,000–$65,000 in premium revenue above Holstein bull calf values. Tighten the ration for $0.30–$0.50/cwt on 62,100 cwt → another $19,000–$31,000 in margin.
300‑Cow Playbook
| Path | Core move | Financial outcome | Trade‑off |
| Fight | Cull 10% + beef‑on‑dairy + ration work | Close $98K–$157K vs. $195K–$210K squeeze | Buys time; may still leave DSCR below 1.20× |
| Exit | Sell herd, equipment, facilities on your terms | Retire $2.8M debt, keep $300K+ equity, avoid ≈$200K herd‑value erosion over 18 months | You’re out of cows; legacy shifts |
On a spreadsheet, that exit looks clean. In the kitchen, it doesn’t. For a lot of 300‑cow families, the 18‑month window isn’t just about DSCR — it’s about whether one more generation gets a shot at the home place, or whether you take the equity that’s left and protect your kids from carrying your debt into their forties.
What Does $18.95 Milk Mean for an 800‑Cow Expansion Herd?
If 300 cows is an exit question, the 800‑cow herd is a margin‑compression test — and it’s the profile Kauffman flagged most directly. hpj
The setup. Eight hundred cows at 24,500 lbs = 196,000 cwt a year. Expanded in 2019 with a new freestall and double‑18 parlour. Debt: $7.2M. Blended interest after repricing: ~7.1%. Debt service: roughly $820,000, up an estimated $150,000–$180,000 since rates moved. Full economic COP near $18.40/cwt.
The squeeze. Revenue loss: 196,000 cwt × $2.22 ≈ $435,000. Labour creep — USDA NASS pegged livestock worker wages around $18.15/hour nationally in April 2025, with average farm wages up roughly 3–4% year‑over‑year — adds another $35,000–$65,000 at this scale. Stack it all: $620,000–$680,000 in extra annual cash pressure. DSCR slides from the low 1.30s toward 1.0–1.05×.
Meanwhile, that 2019 freestall, which cost $2.8M to build, might appraise at only $2.0–$2.2M today. Debt‑to‑asset ratio creeps past the 60% covenant. Technically offside without missing a payment.

800‑Cow Playbook
| Path | Core move | Annual impact | Trade‑off |
| A: Components + labour + longer note | Push BF from 3.85% to 4.05% (+$115K); trim 3× milking on bottom cows (+$80K); stretch barn mortgage to 25‑yr amortization (+$92K) | ≈ $287K vs. $620K–$680Khit | Keeps 800‑cow scale; demands tight execution on nutrition, labour, and lender cooperation |
| B: Destock + premium pivot | Sell 150 cows ($350K–$430K debt reduction); begin organic transition (36‑month cert) | One‑time debt paydown; premium upside later | Gives up volume now; organic benefits depend on processor contracts and a 3‑year timeline |
On Path A, the butterfat math is straightforward: 19.6M lbs × 0.20 percentage points = 39,200 lbs more BF × $2.94/lb ≈ $115,000. That’s real money. But the breeding decisions behind that 0.20‑point shift matter as much as the ration, and as Dr. Kent Weigel has pointed out, nobody can reliably predict component prices five to seven years out.
On Path B, organic pay in the Northeast has held well above conventional. Bullvine’s 2025 coverage of NODPA data showed Upstate Niagara’s 2025 program at $29.50/cwt base plus a $2.75/cwt organic market adjustment and $2/cwtseasonal incentive, and Horizon targeting up to $45/cwt for some larger herds. NODPA’s January 2026 “Pay and Feed Prices” update confirms that Upstate Niagara will move to a $32.50/cwt base, plus a $2.75/cwt regional adjustment and a $2/cwt seasonal incentive in 2026, and notes that other processors raised base pay by roughly $3/cwt going into 2026. Terms vary — contact processors directly for current details.
Certification takes 36 months. You’re not patching this year’s DSCR with organic premiums. What you are doing is giving your lender a different story than “we’re stuck.”
When Scale Stops Being a Safety Net: 1,500 Cows
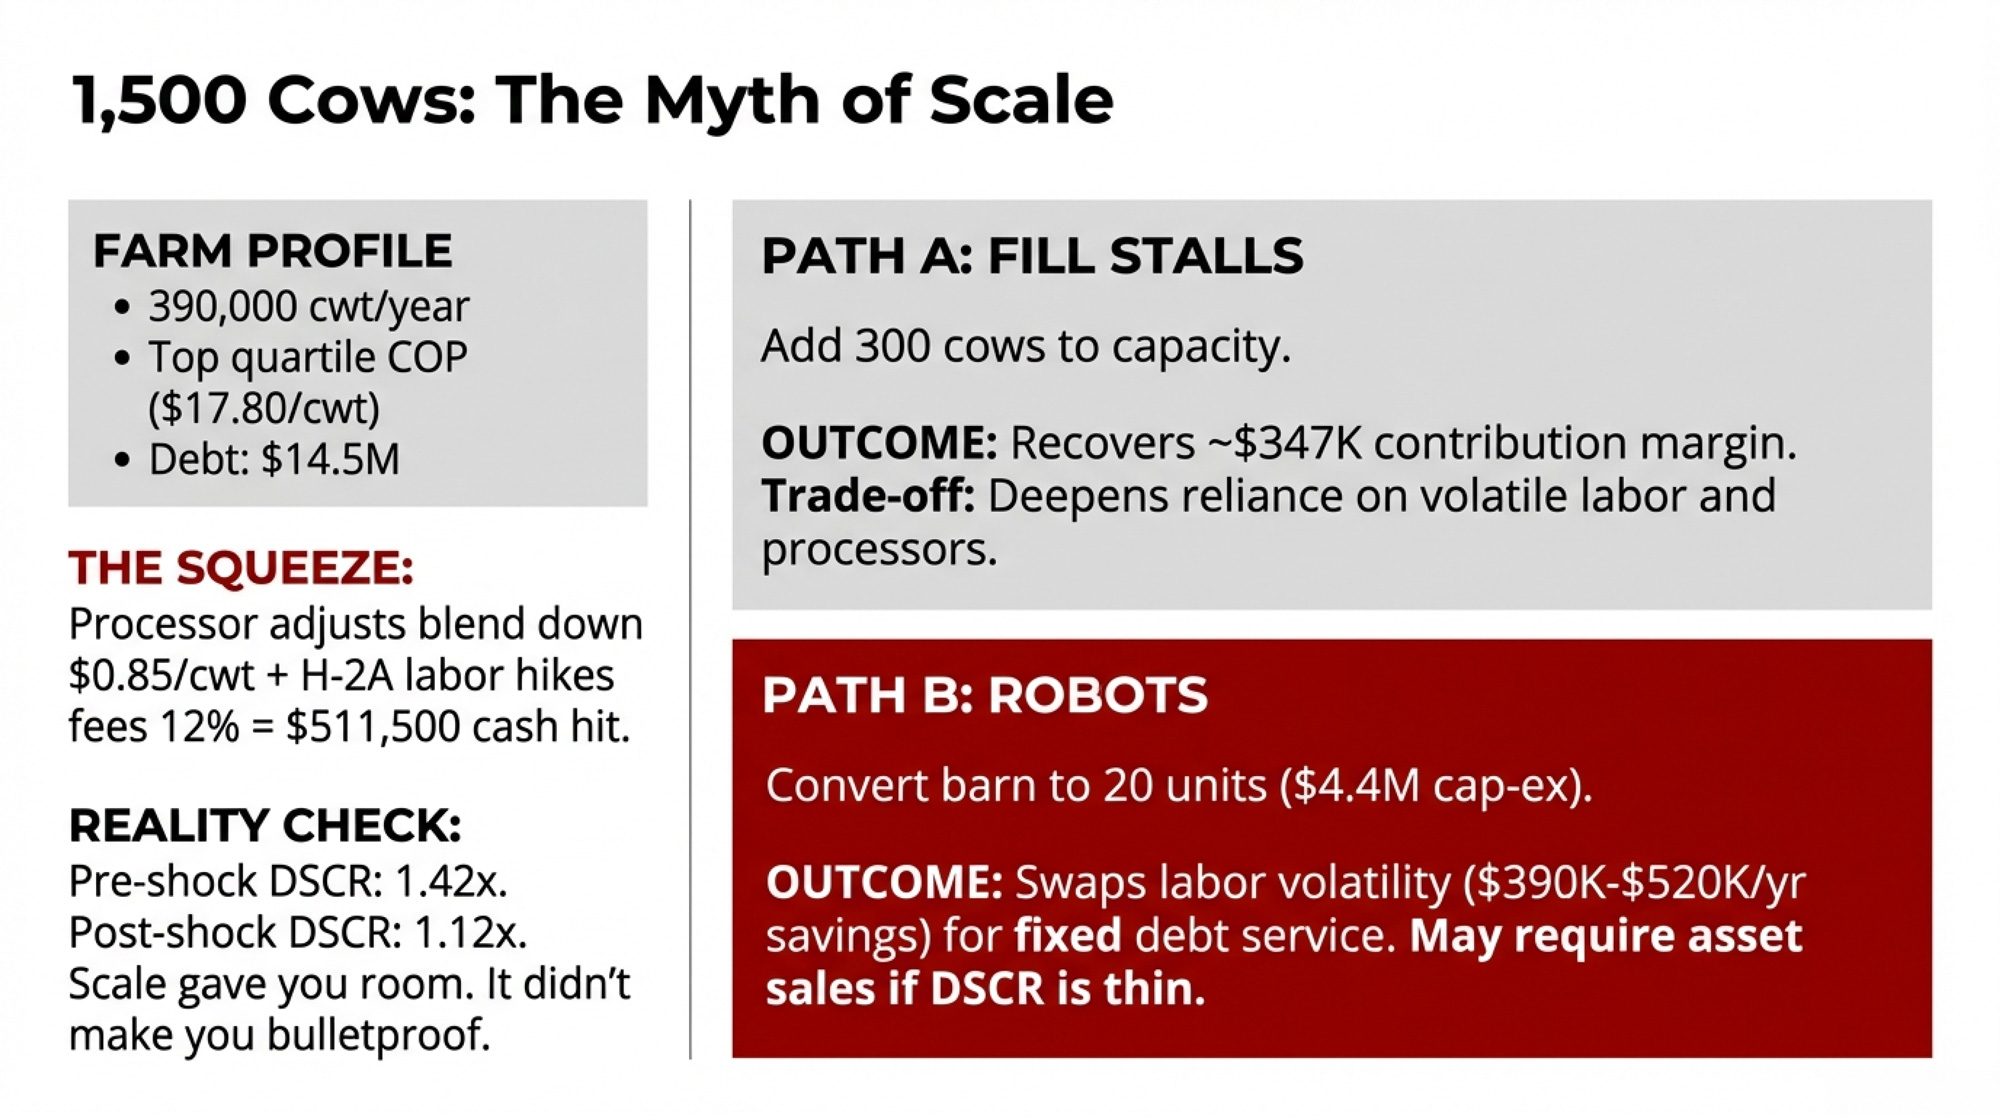
Two sites, 1,500 cows total, 26,000 lbs/cow — 390,000 cwt a year. Debt: $14.5M. COP sits in the top quartile at about $17.80/cwt, better than ERS’s $19.14 average for ≥2,000‑cow herds. Sounds comfortable.
Then a regional processor adjusts its Class III allocation, and your blend drops $0.85/cwt — that’s $331,500. In the same quarter, your H‑2A contractor raises fees 12%, adding $180,000 to labour costs. You’ve eaten $511,500 in cash pressure while still technically “efficient.”
Pre‑shock DSCR: 1.42×. Post‑shock: 1.12×. Scale gave you room. It didn’t make you bulletproof.
1,500‑Cow Playbook
| Path | Core move | Impact | Trade‑off |
| A: Fill empty stalls | Add 300 cows to 1,800‑head capacity (78,000 cwt × [$18.95 – $14.50 marginal COP] ≈ $347K contribution) | Recovers about two‑thirds of a $511Kshock | Deepens processor and labour dependency |
| B: Robots | Convert one barn to 20 units ($4.4M); labour savings $390K–$520K/yr; extra milk $185K–$296K | Net year‑one: –$41K to +$200K; improves as wages rise | Swaps labour volatility for $4.4M in new capital; may need asset sales or guarantees if DSCR is already thin |
ISU extension specialist Larry Tranel pegs the installed robot cost at $185,000–$230,000/unit, with some projects reaching $250,000. At $220,000 midpoint, 20 units = $4.4M — about $616,000/year in debt service over 10 years at current rates. The bet is that wages keep climbing while the robot payment stays fixed.
| Herd Size | Path Options | Financial Impact | Key Trade-Off |
| 300 cows | Fight: Cull 10%, beef-on-dairy, ration tweak | Close $98K–$157K of $195K–$210K gap | Buys 6–12 months; may still breach covenants |
| 300 cows | Exit: Orderly liquidation | Retire $2.8M debt, keep $300K+ equity | Out of dairy; avoid $200K herd-value erosion over 18 months |
| 800 cows | Path A: Push components 0.20%, trim labor, stretch note | Recover ~$287K of $620K–$680K hit | Demands tight execution; lender cooperation required |
| 800 cows | Path B: Destock 150 cows, begin organic transition | $350K–$430K debt paydown now; premium upside at month 36 | Gives up volume immediately; 3-year wait for premiums |
| 1,500 cows | Path A: Fill 300 empty stalls to 1,800-head capacity | Add $347K contribution margin | Deepens processor and H-2A labor dependency |
| 1,500 cows | Path B: Install 20 robotic units | $390K–$520K labor savings + $185K–$296K milk = net +$200K year 1 | Swaps labor volatility for $4.4M new capital; DSCR impact if already thin |
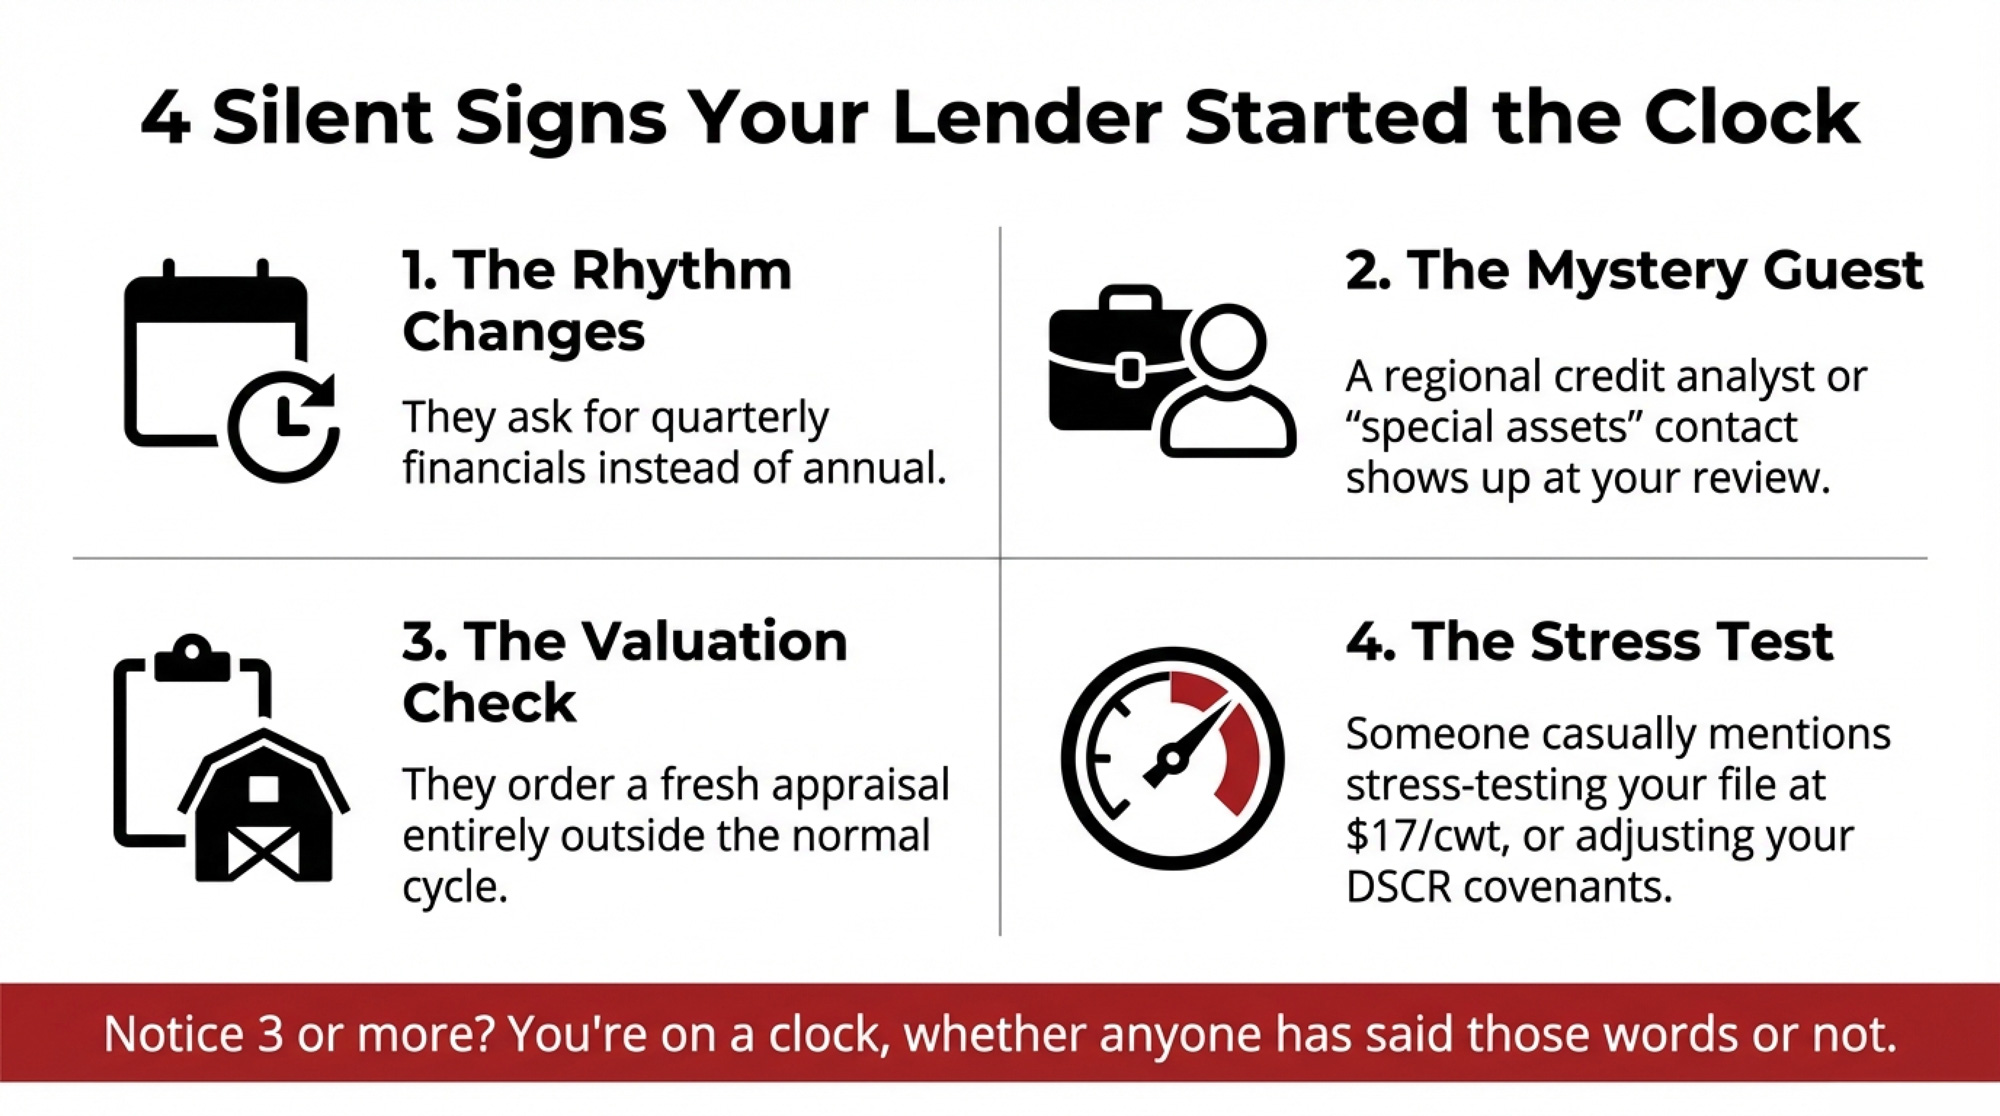
Ten Signals Your Lender Already Started the Clock
You’re likely on an 18‑month clock if:
- Your lender asks for quarterly financials instead of annual.
- There’s someone you’ve never met at your review — a regional credit analyst or special‑assets contact.
- They order a fresh appraisal outside the normal cycle.
- Covenant language gets “adjusted”—temporary waivers and revised DSCR targets.
- The conversation shifts from “What are your plans?” to “Walk me through your cost of production.”
- They start asking for milk per cow, SCC, and cull rates that weren’t part of prior reviews.
- Your operating line renewal comes back with a lower limit or shorter term.
- Someone mentions stress‑testing at $17/cwt.
- They request personal financials from all guarantors, not just the main operator.
- Capital‑expense conversations get met with “Let’s revisit after the next review.”
Three or more? You’re on a clock, whether anyone has said those words or not.
How to Stress‑Test Your Dairy at $18.95 Milk

In the next 30 days:
- Pull your full economic COP. Not the rough number in your head. Family labour at $18–$22/hour, depreciation at replacement cost, return on equity included. ERS and Cornell DFBS data show total cost ranging from roughly $20/cwt into the high $20s/cwt depending on herd size and performance. Put that number next to $18.95 and see what you’re really asking your lender to finance.
- Run your DSCR at three price points. Use the formula:
(Total cwt × milk price – operating expenses) ÷ annual debt service = DSCR.
Plug in $18.95, $17.00, and $16.00. Under 1.10× at $17? Red flag. Under 1.20× at $18.95? You’re in the band Kauffman’s data identifies as “significant” stress. - Model your exit equity — today and at month 18. Herd, equipment, land. Subtract every dollar of debt. Then re‑run those values 18 months out with lower prices and more forced timing. On a 300‑cow herd, the cattle‑value spread alone can run around $200,000.
| Herd Size | DSCR @ $18.95/cwt | DSCR @ $17.00/cwt | DSCR @ $16.00/cwt |
|---|---|---|---|
| 300 cows (23K lbs, $280K debt service) | 1.08× | 0.82× | 0.68× |
| 800 cows (24.5K lbs, $820K debt service) | 1.28× | 1.05× | 0.92× |
| 1,500 cows (26K lbs, $1.45M debt service) | 1.42× | 1.22× | 1.09× |
| Your herd: ___________ | _________ | _________ | _________ |
In the next 90 days:
- Pick your path and take it to your lender — with a number, not a hope. “We’ll reduce the herd by 12%, apply $X to the operating line, and target a DSCR of 1.22× by Q3. Here’s the math.” That’s a different meeting than “We’re hoping milk comes back.”
- Build a three‑person advisory bench that doesn’t sell you anything. Your accountant. An ag attorney. One peer who’s been through financial stress and came out the other side. Not your feed rep. Not your equipment dealer.
By this time next year:
- Hit the DSCR target you committed to — or have a planned, orderly exit underway before someone else decides for you.
If you’re in Canada, supply management, quota values, and provincial financing change the per‑cwt math. But lenders still watch DSCR and working capital. The 18‑month pressure window exists under quota, too — it just plays out against land and quota values, not Class III futures.
Key Takeaways
- If your DSCR sits below 1.20× at $18.95, you’re in the 10–15% band Kauffman’s data flags as “significant” financial stress. KC Fed work suggests 10–15% of producers are in that zone, even as 80% remain stable, and Cornell’s DFBS shows some farms couldn’t cover debt even in stronger milk years.
- At 300 cows with $9,000+/cow in debt, a disciplined exit may preserve more equity than fighting for 18 months. The herd‑value spread alone can run around $200,000 before equipment and real estate discounts.
- At 800 cows with 2019 expansion debt repricing from mid‑4s into the 7–8% range, you gave up $150,000+ in cash flow before milk moved a penny. Path A or Path B both beat drifting into the next review with no plan.
- At 1,500 cows, scale buys more ways to respond — not immunity. One processor adjustment and one H‑2A contract change can add roughly $500,000 in annual pressure, even in a top‑quartile COP herd.
The Bottom Line
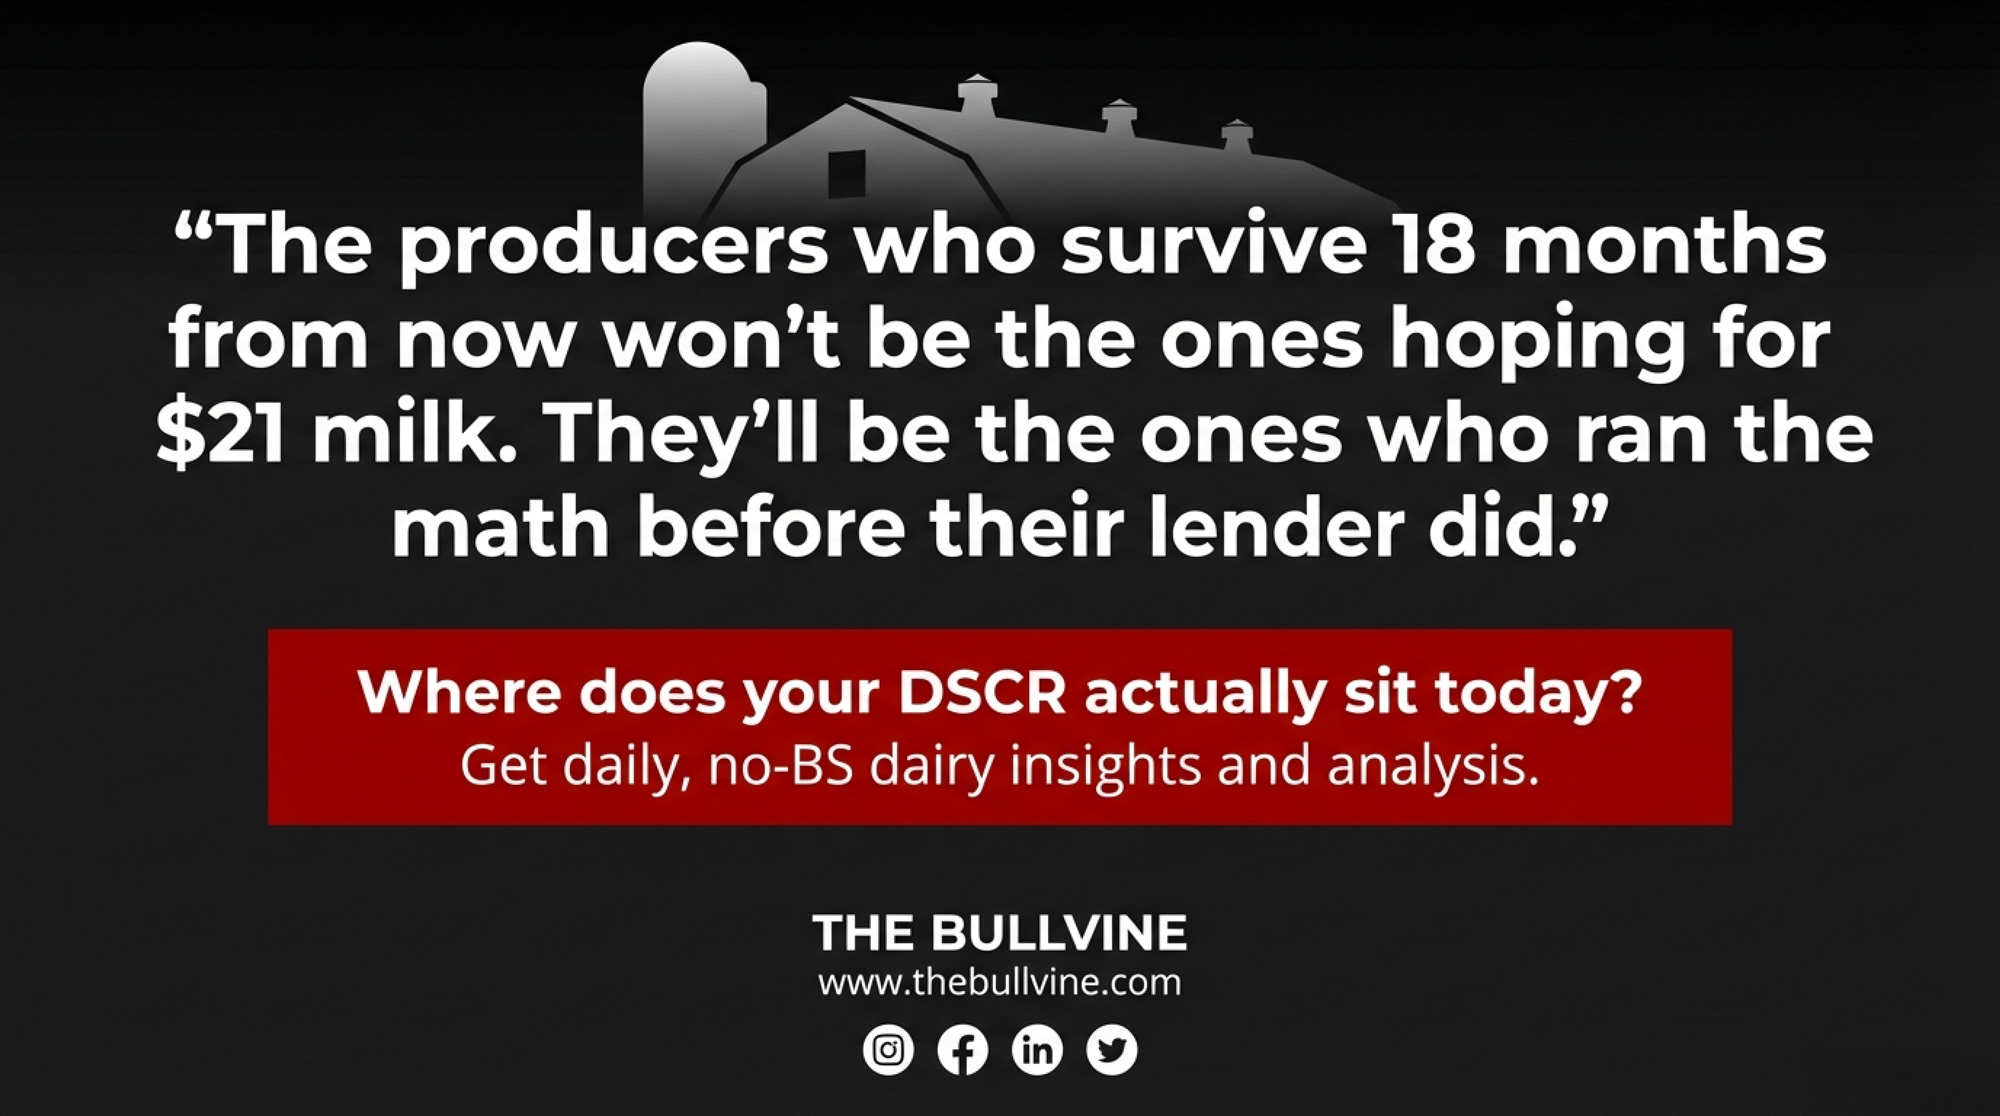
The producers who still have options 18 months from now won’t be the ones who hoped for $21 milk. They’ll be the ones who ran the DSCR math at $18.95, $17, and $16 before their lender did — and walked into that meeting with a decision, not just a problem.
Where does your DSCR actually sit today?
Complete references and supporting documentation are available upon request by contacting the editorial team at editor@thebullvine.com.
Learn More
- Feed Smart: Cutting Costs Without Compromising Cows in 2025 – Arms you with a precision-feeding roadmap to slash up to $470 per cow in annual costs. It reveals how to leverage co-products and forage digestibility to protect production while margins tighten, providing immediate relief for your Monday morning ration decisions.
- Decide or Decline: 2025 and the Future of Mid-Size Dairies – Exposes the three survival paths for mid-sized dairies facing structural industry shifts. You’ll gain a clear-eyed framework for regional positioning, financial clarity, and succession planning to ensure your operation remains a viable legacy through 2027 and beyond.
- Bred for $3 Butterfat, Selling at $2.50: Inside the 5-Year Gap That’s Reshaping Genetic Strategy – Breaks down the dangerous five-year lag between your genetic selections and bulk tank reality. It delivers a methodical approach to hedging against market volatility, ensuring today’s breeding decisions don’t leave you stranded in tomorrow’s component market.
 The Sunday Read Dairy Professionals Don’t Skip.
 The Sunday Read Dairy Professionals Don’t Skip.
Every week, thousands of producers, breeders, and industry insiders open Bullvine Weekly for genetics insights, market shifts, and profit strategies they won’t find anywhere else. One email. Five minutes. Smarter decisions all week.


