


Greg Bethard told a roomful of dairy operators he doesn’t want investors — he wants partners who know what a bad milk year smells like.
“We are looking for partners, not investors.”
That’s how Greg Bethard opened his talk at the 2025 MILK Business Conference. He’s the CEO and managing partner of High Plains Ponderosa Dairy near Plains, Kansas — a rotary‑parlor operation that ships milk to the Hilmar Cheese Co. plant in Dodge City and earned the 2025 Kansas Distinguished Dairy Award. Bethard has expanded without private equity, choosing people who already understand cows and volatility over funds that want out in five to seven years. Sitting beside him on the panel were TJ Tuls, a fourth‑generation Nebraska dairy farmer, and Hank Hafliger of Cedar Ridge Dairy in Filer, Idaho. Different herds, different structures, same basic bet: keep the timeline with the cows and the family, not the fund clock.
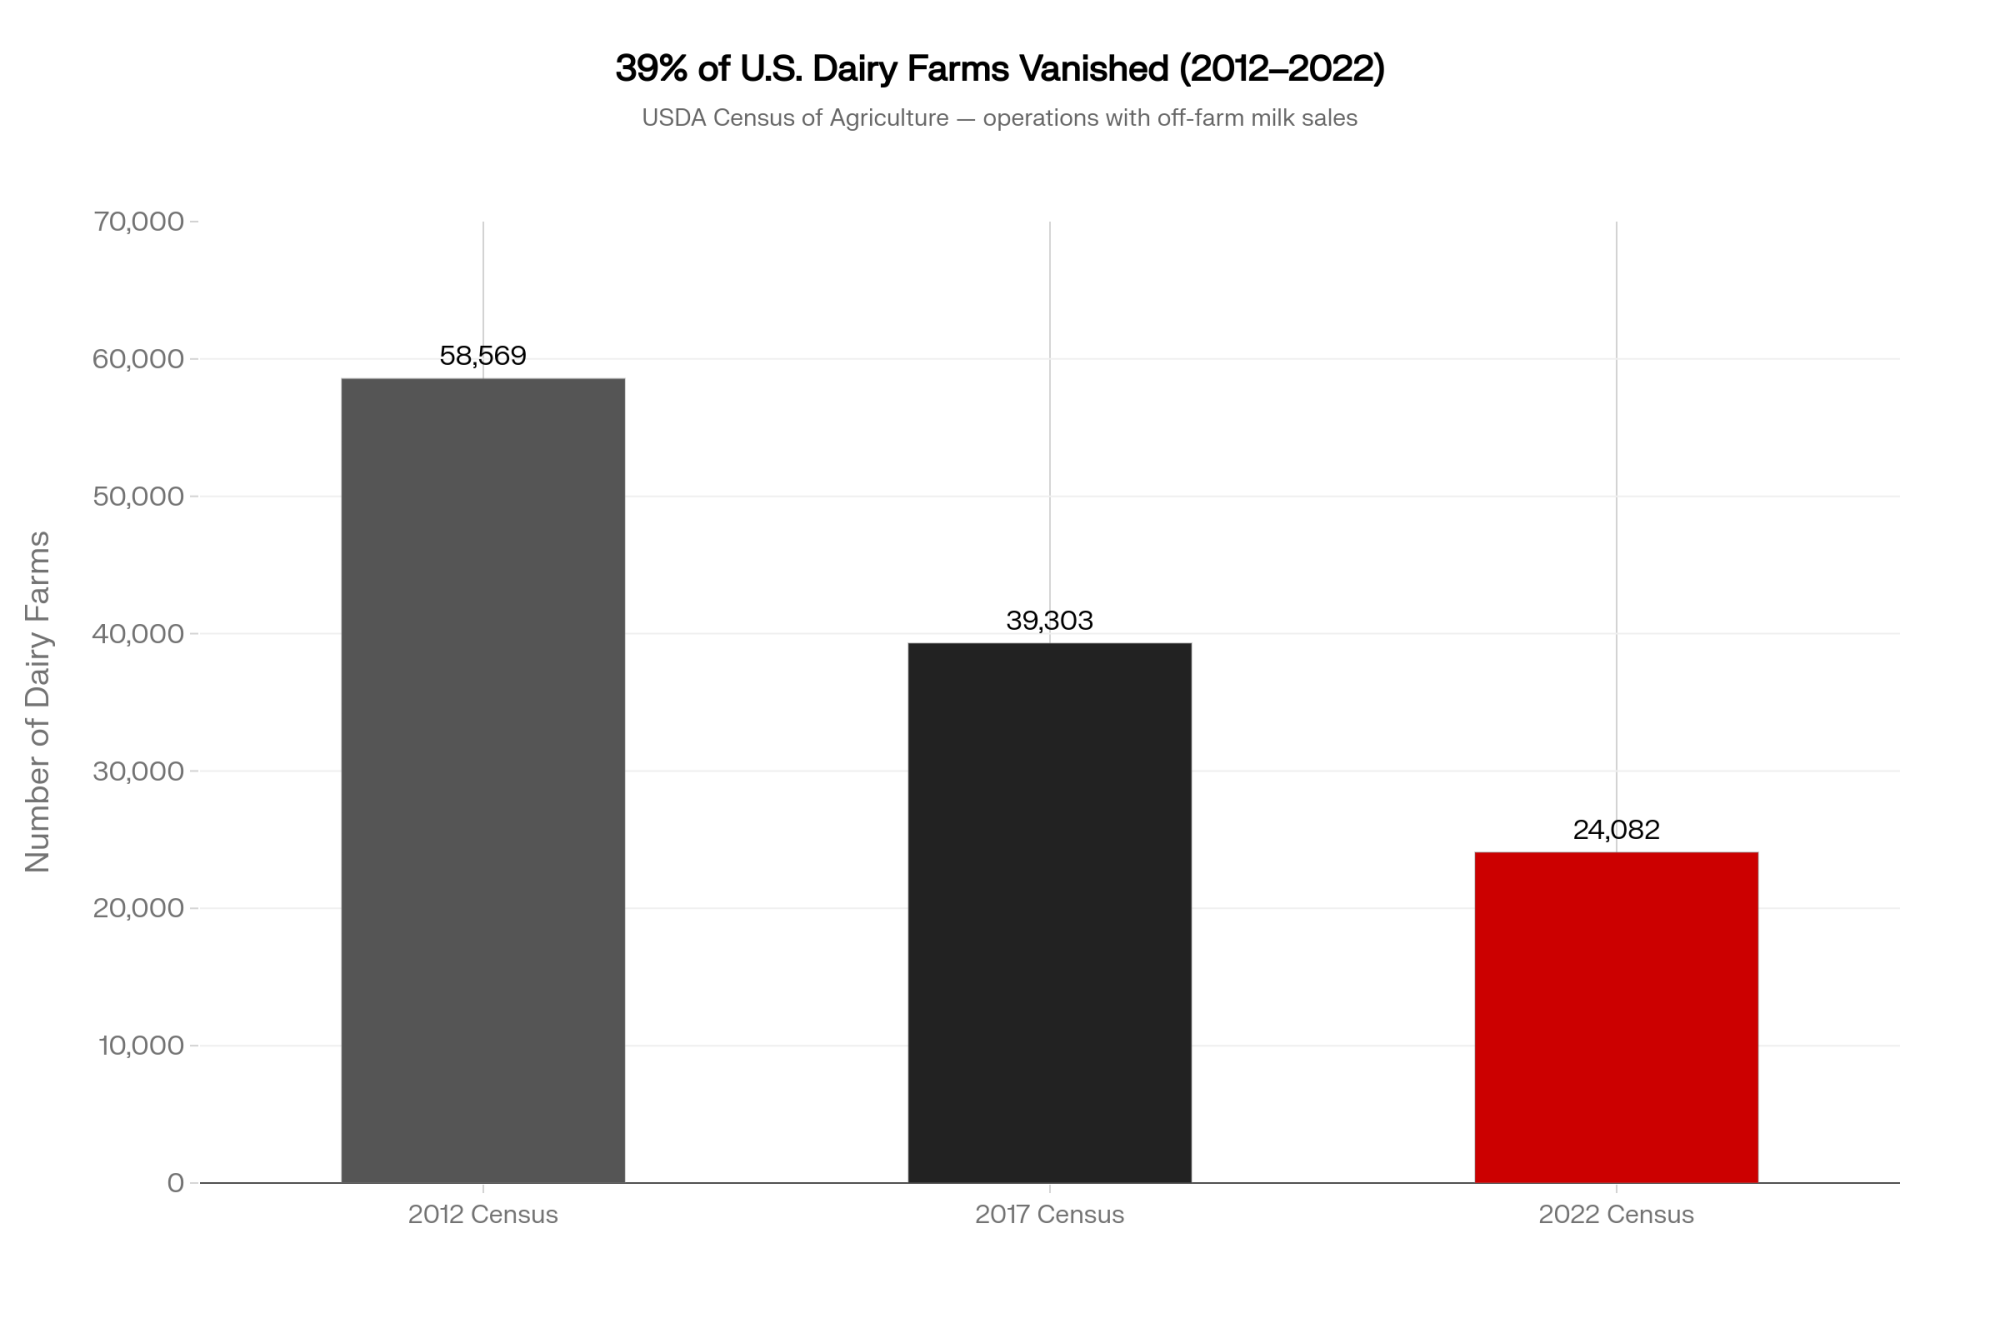
Nearly 4 in 10 U.S. dairy farms with off‑farm milk sales disappeared between 2017 and 2022. Cow numbers barely moved — still around 9.3–9.4 million head — but milk shifted hard into fewer, bigger herds. Those herds now face a blunt question: do you take fast capital and more leverage, or do you find slower money that lets you sleep at night?
The Fork Every Growing Dairy Hits
Any serious expansion now runs into the same wall: your own balance sheet.
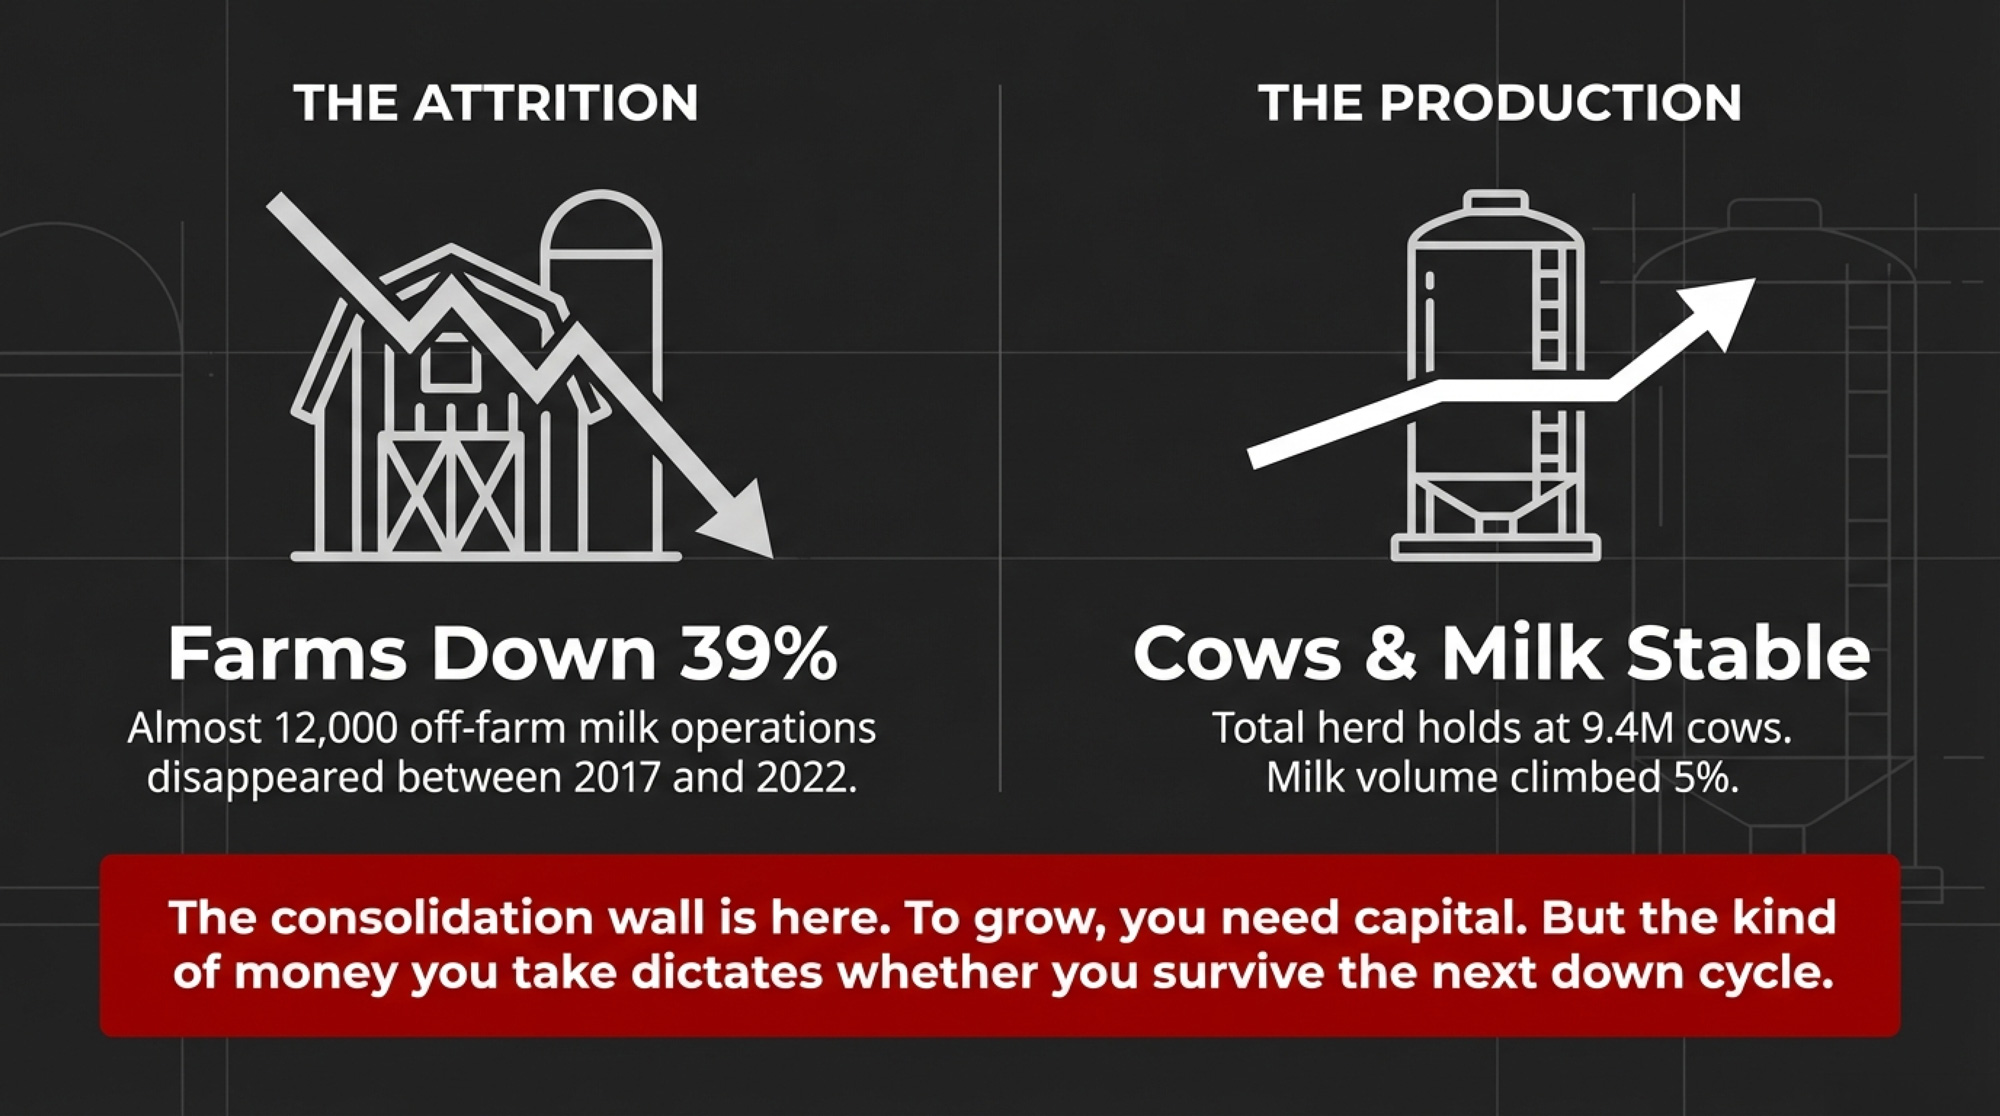
USDA’s 2022 Census of Agriculture shows the number of dairy operations with off‑farm milk sales fell from 39,303 in 2017 to 24,082 in 2022 — almost 12,000 farms gone, roughly a 39% decline. Over that stretch, total cow numbers held near 9.3–9.4 million while milk volume climbed about 5%. Just over 2,000 herds with 1,000‑plus cows now produce about two‑thirds of the country’s milk by value, according to Census analysis and Rabobank estimates. PE funds look at that curve and see a defensive thesis. People still buy food in a downturn.
You know the other side of it. A heifer you raise this year won’t really pay back until her second or third lactation. You invest for years before you know whether genetics and cow‑care decisions actually worked. When you finance that biology with a five‑ to seven‑year buy‑grow‑flip model, something gives — either the cows, the capital, or your control.
Three Families, Three Very Different Paths
What made the MILK Business panel worth paying attention to wasn’t just that Bethard, Tuls, and Hafliger all said no to PE. It’s that each built a completely different alternative — and accepted the trade‑offs that came with it.
| Operator | Capital Model | Structure | Geographic Anchor | Core Trade-Off | Exit Timeline |
|---|---|---|---|---|---|
| Greg Bethard— High Plains Ponderosa Dairy, KS | Patient ag-industry partners; no PE | Private partnership | Plains, KS → Hilmar Cheese, Dodge City | Slower growth; full cow-level decision control | None — family timeline |
| TJ Tuls — Nebraska, DARI Processing | Bank + infrastructure lenders for $165M greenfield plant | Family + lenders | Seward Rail Campus, NE | Concentration risk; construction/ramp-up execution risk | None — generational build |
| Hank Hafliger— Cedar Ridge Dairy, ID | Family equity + bank debt; no outside shareholders | Multi-site family unified business | Filer, ID (moved from CA) | High people/alignment demands across kids and in-laws | None — family-controlled |
| PE-Backed Generic Model | Private equity fund; limited partners | Fund-controlled; DSCR covenants | Processor clusters; “packageable” geography | 5–7 yr hold period; drag-along exit rights; covenant restrictions | 5–7 years (fund clock) |
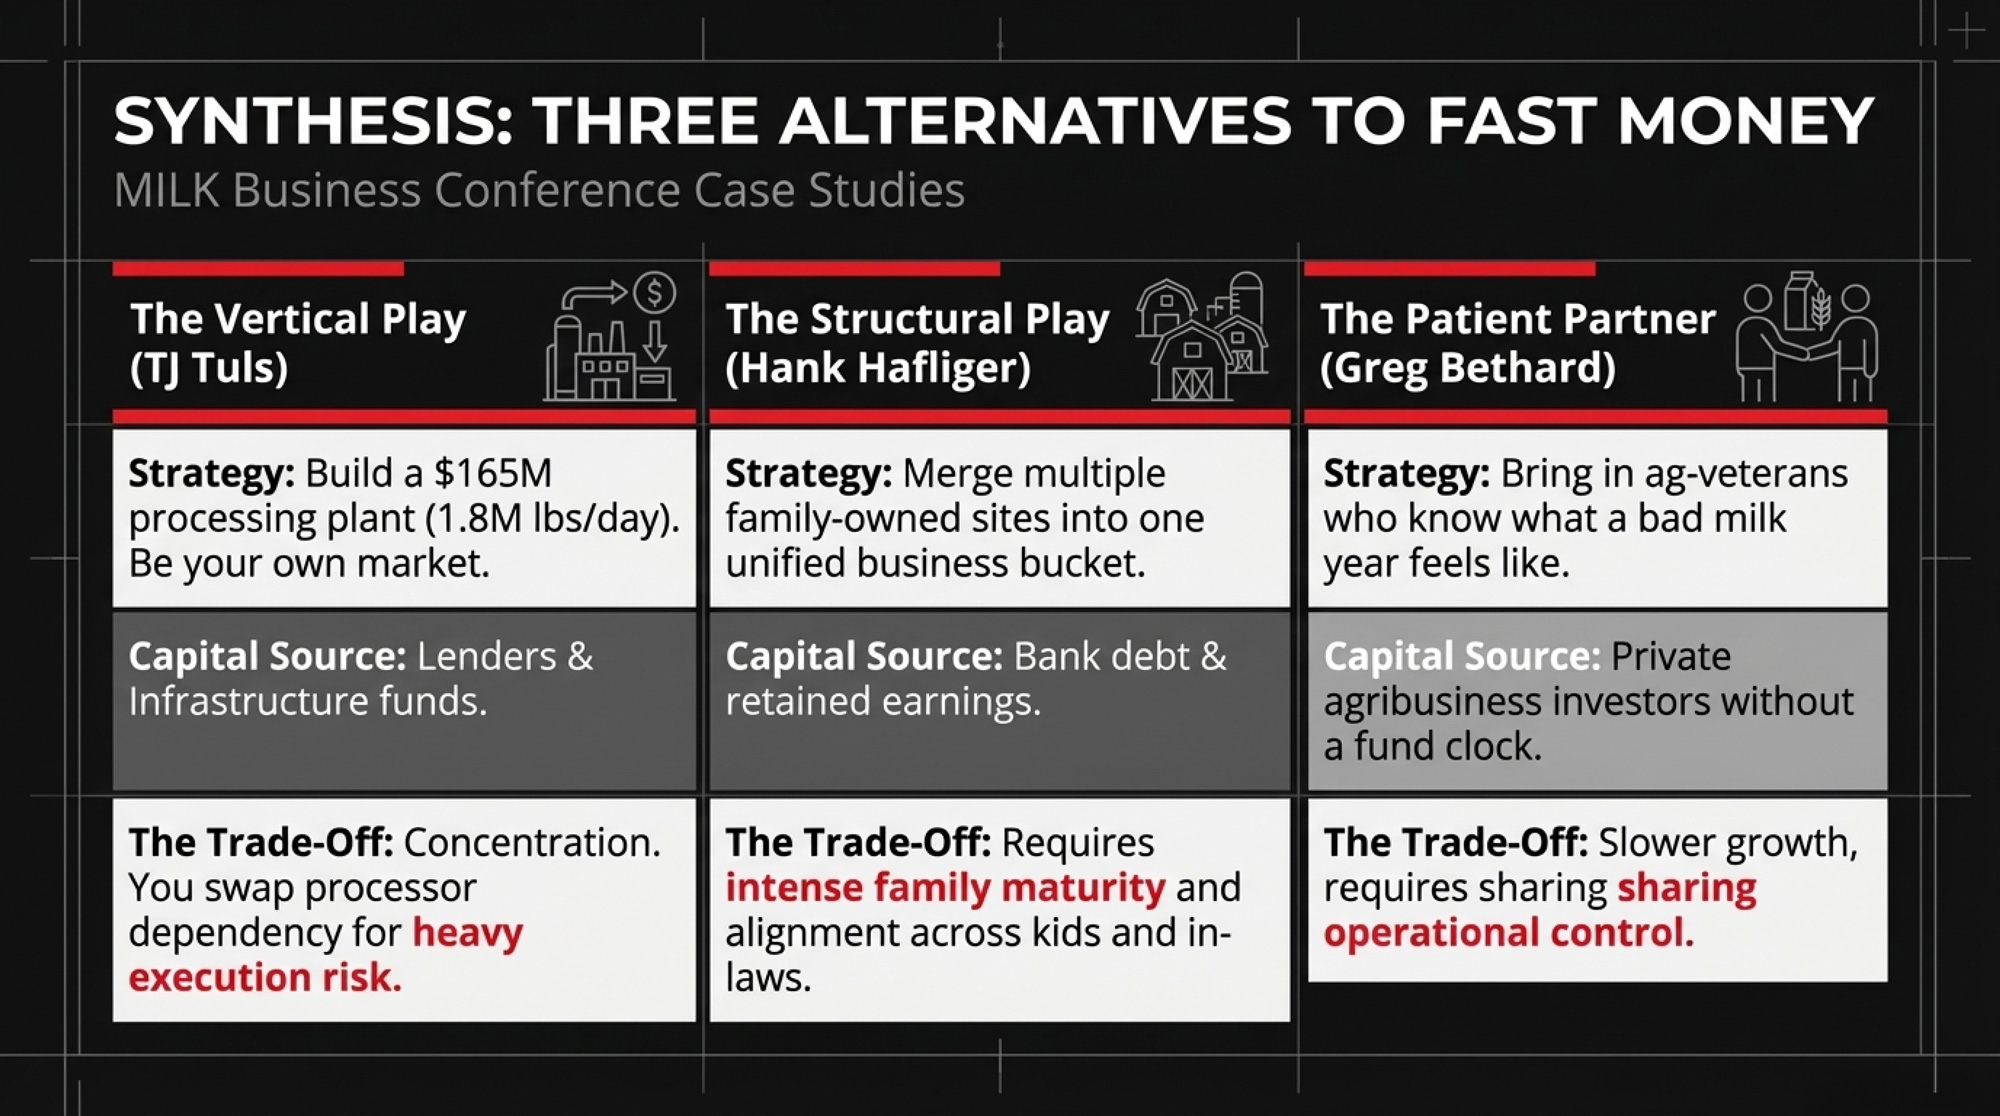
TJ Tuls went vertical. His family is building DARI Processing at Nebraska’s Seward Rail Campus — reported in mid‑2025 coverage as the state’s first major greenfield dairy plant in more than six decades. Trade and state sources peg the project at about $165 million, designed to handle roughly 1.8 million pounds of milk per day, with groundbreaking in 2025 and start‑up targeted around 2027. When asked where he’d build a new dairy, Tuls didn’t hesitate: “Close to a milk plant.” His family decided to be the milk plant. Their capital partners are lenders and infrastructure‑focused entities, not limited partners, grading them on quarterly IRR.
The trade‑off is concentration. If DARI hits a rough patch — construction overruns, a slower ramp‑up, margin squeeze — every part of the family’s operation feels it. You swap processor dependency for execution risk. Not every family wants that exposure.
Hank Hafliger went structural. Cedar Ridge Dairy started in California before the family moved the operation to Filer, Idaho. Today, Hank owns it with three of his children and their spouses, running multiple dairy sites as a single unified business. No PE fund. No outside equity. Bank debt, retained earnings, and a family agreement that everything lands in one bucket. “By running them as one, we don’t have that ‘my dairy is doing better than yours’ conflict,” Hafliger told the crowd. “It’s about maturity, learning to relax and let things happen rather than trying to force them.”
That model asks a lot of people, not just paper. Not every family can operate three sites as one business without it fracturing. When it works, you get alignment across kids, in‑laws, and locations. When it doesn’t, the damage runs deeper than dollars.
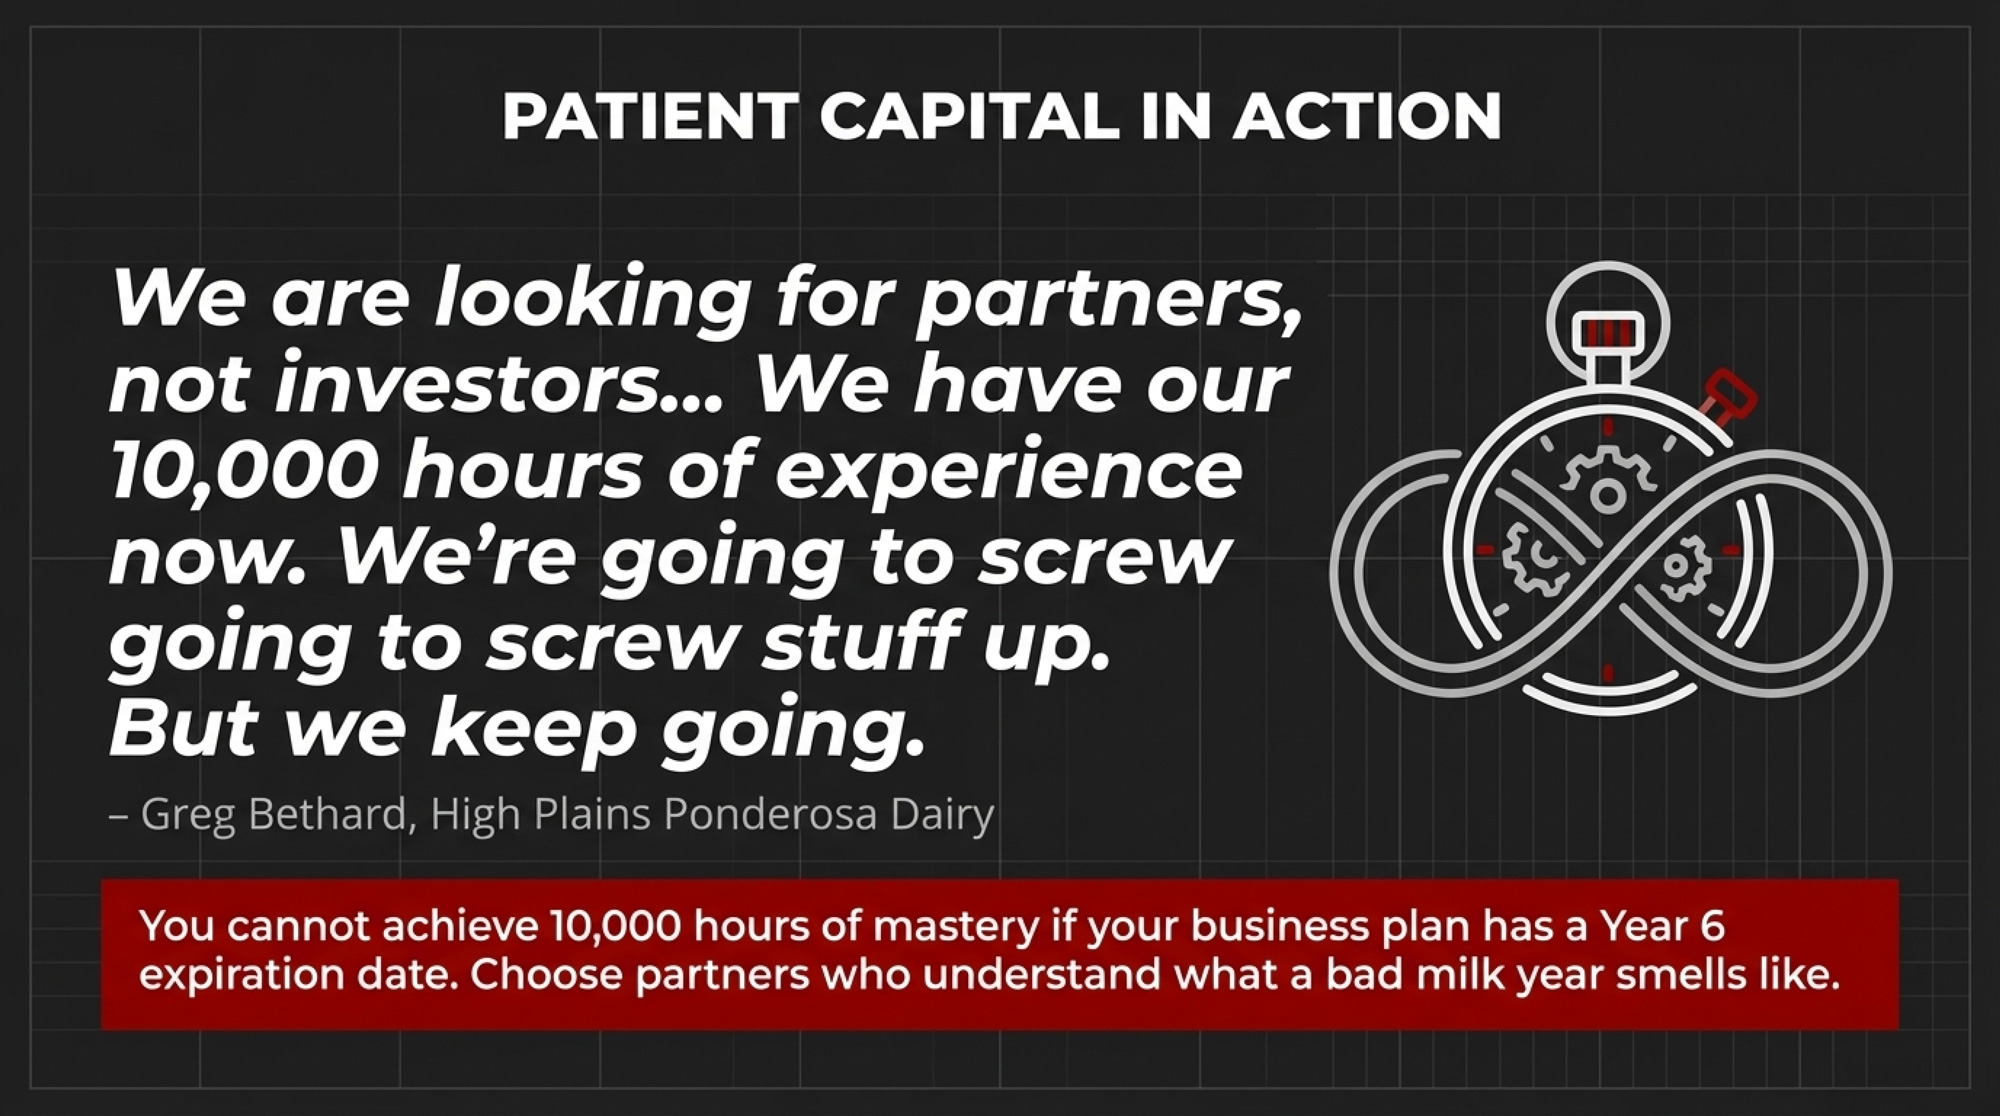
Bethard went for patient partners with ag scars. High Plains Ponderosa has grown by bringing in people who already know what a bad milk year feels like — not financial sponsors planning a sale before the heifers from this year ever calve. He’s honest about the early expansion learning curve. “We have our 10,000 hours of experience now,” he said, borrowing Malcolm Gladwell’s mastery concept. “We’re going to screw stuff up. There are going to be bad days… But we keep going at it, and we’ll get it figured out.”
You don’t get to 10,000 hours if the business plan has a Year 6 expiration date.
What Does $6,638 of Debt Per Cow Actually Look Like?
Here’s where this stops being theoretical and starts hitting your spreadsheet.
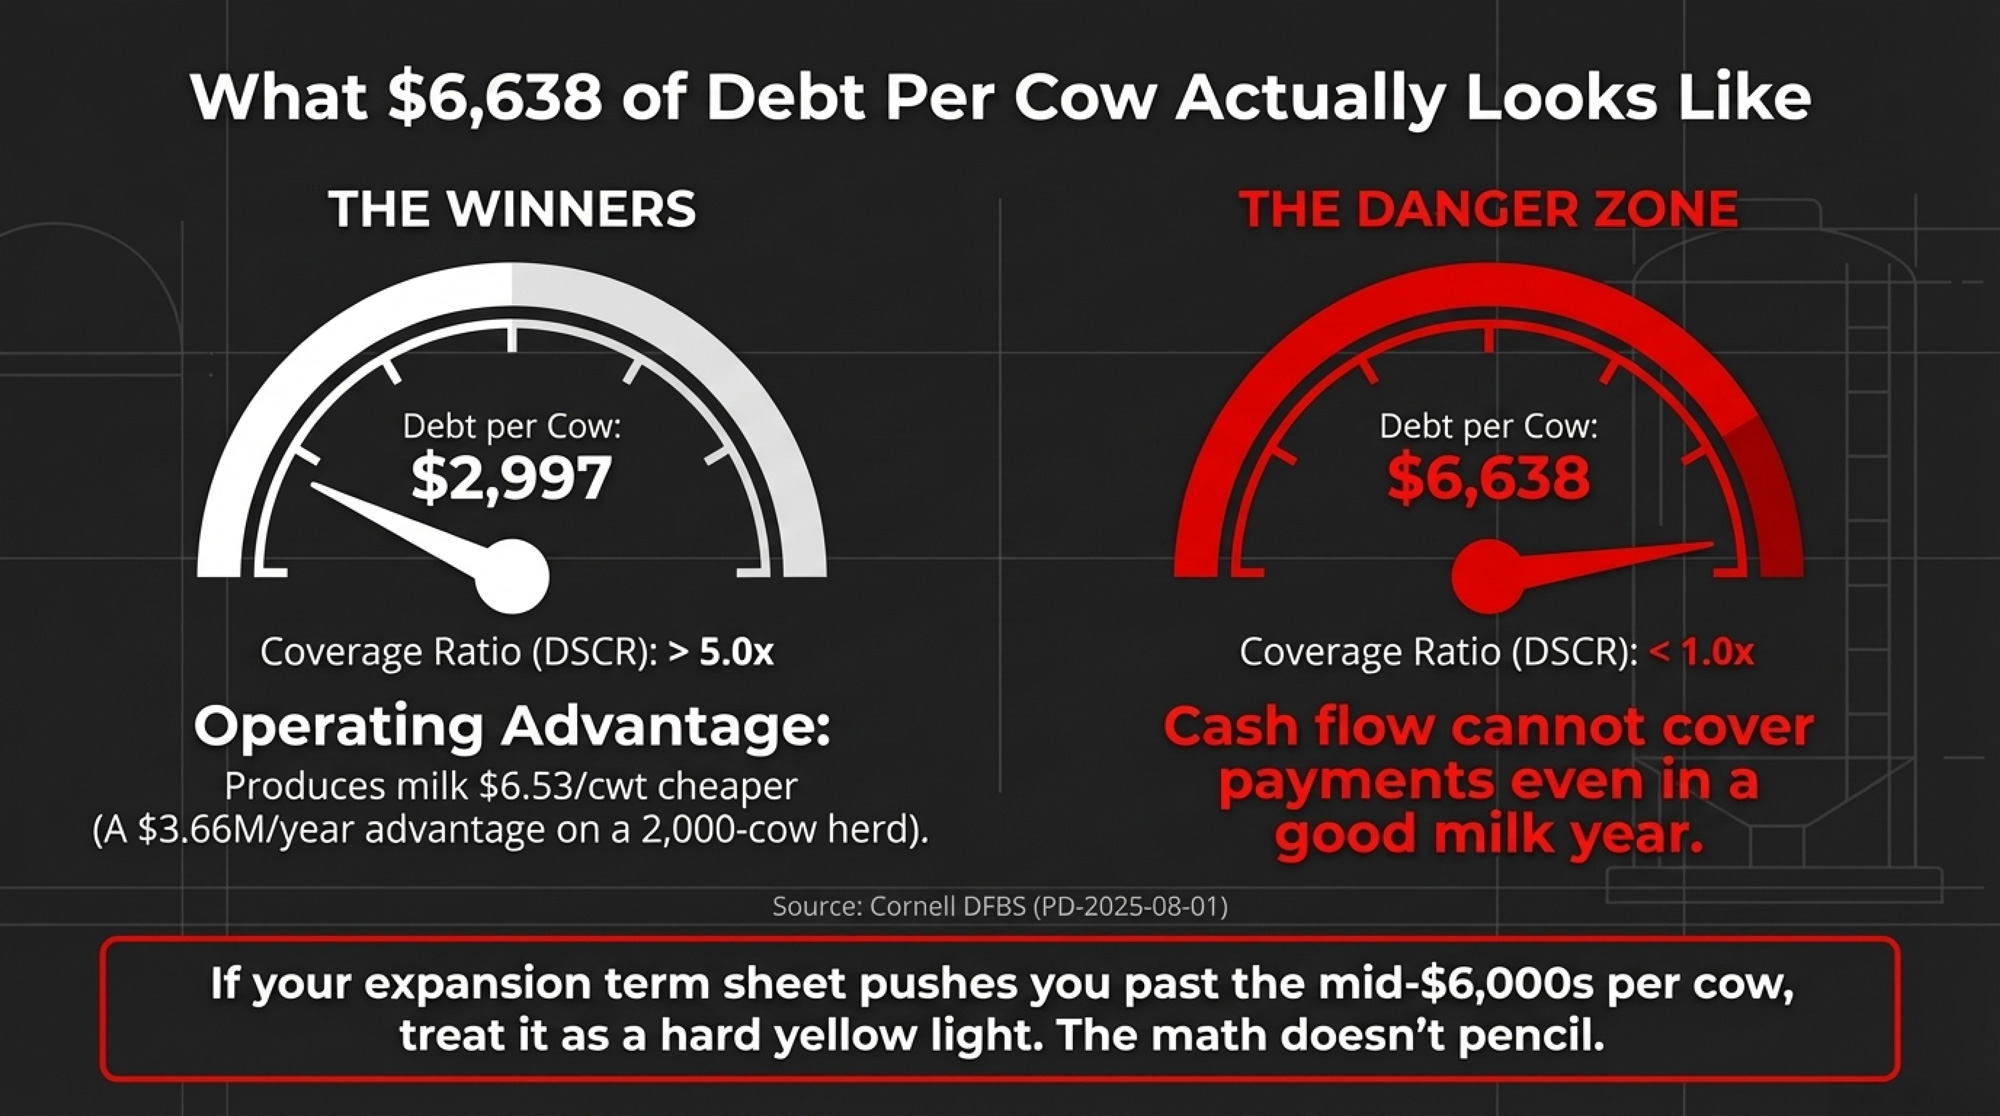
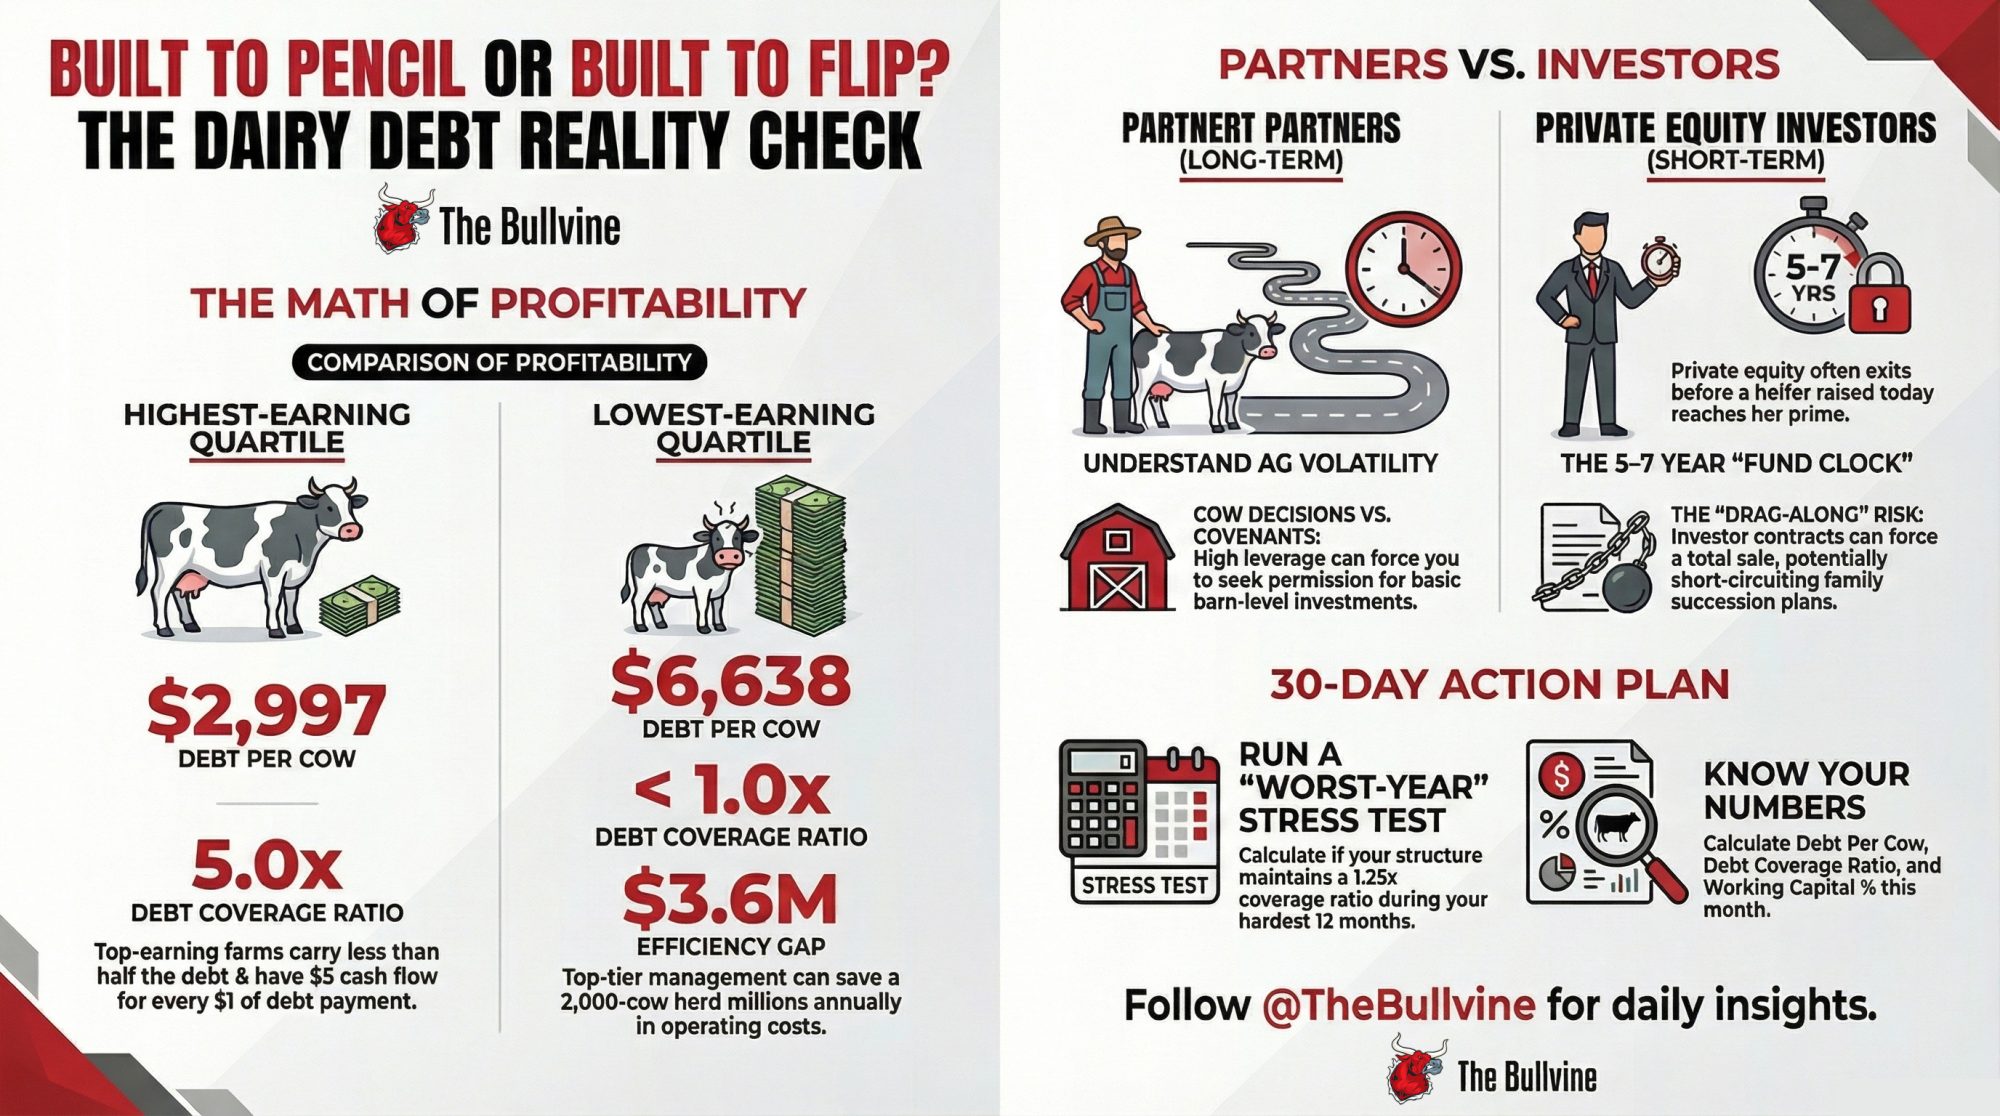
Cornell’s July 2025 bulletin “Comparing New York dairy farm characteristics, costs, and returns by profitability, 2024” (PD‑2025‑08‑01) sorted 129 New York dairy farms into earnings quartiles. The patterns are stark. More profitable herds consistently carried less debt per cow, held stronger debt coverage ratios, and produced milk at a substantially lower cost per cwt than the least profitable group. In that dataset, the highest‑earning quartile averaged about $2,997 of debt per cow with a debt coverage ratio north of 5× — roughly five dollars of cash flow for every dollar of scheduled principal and interest. The lowest‑earning quartile? About $6,638 per cow, with coverage under 1×. Cash flow couldn’t cover the payments. And this was during a year when average net farm income per cow jumped sharply.
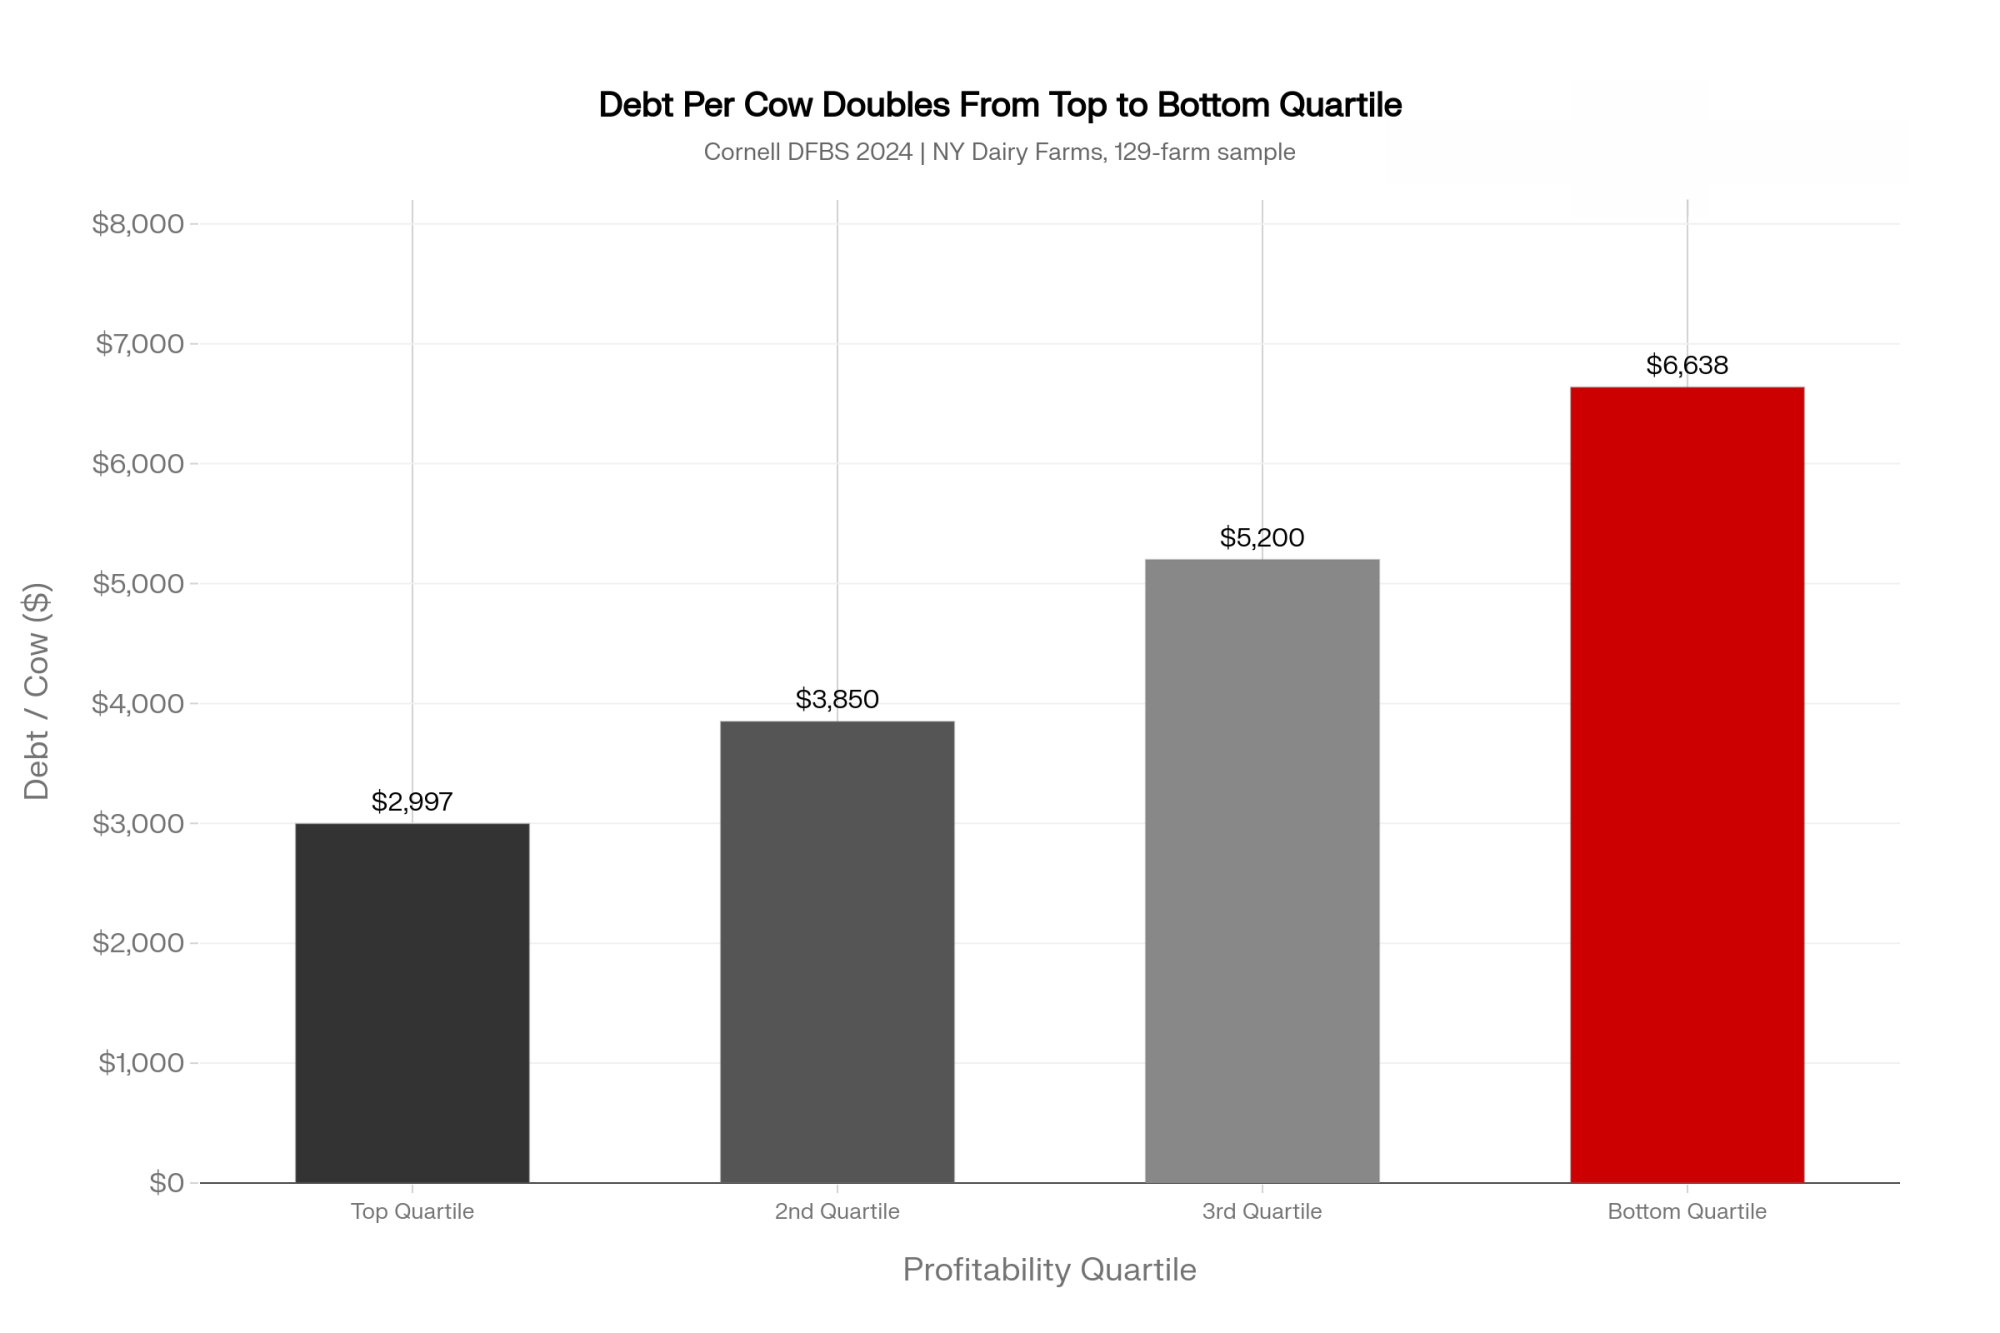
Even in one of the best income years in recent memory, the most leveraged herds couldn’t comfortably service their debt.
The cost‑of‑production gap runs parallel. Cornell’s public DFBS tables show top‑quartile farms producing milk several dollars per cwt cheaper than the bottom group — a function of better feed efficiency, labor productivity, and fixed‑cost absorption. Using a spread of roughly $6.53/cwt between the top and bottom quartiles, run that through a real herd: 2,000 cows shipping 280 cwt per cow per year gives you 560,000 cwt. Multiply by $6.53, and you’re looking at approximately $3.66 million per year in operating‑cost difference. Same milk prices. Same feed markets. Very different bank statements.
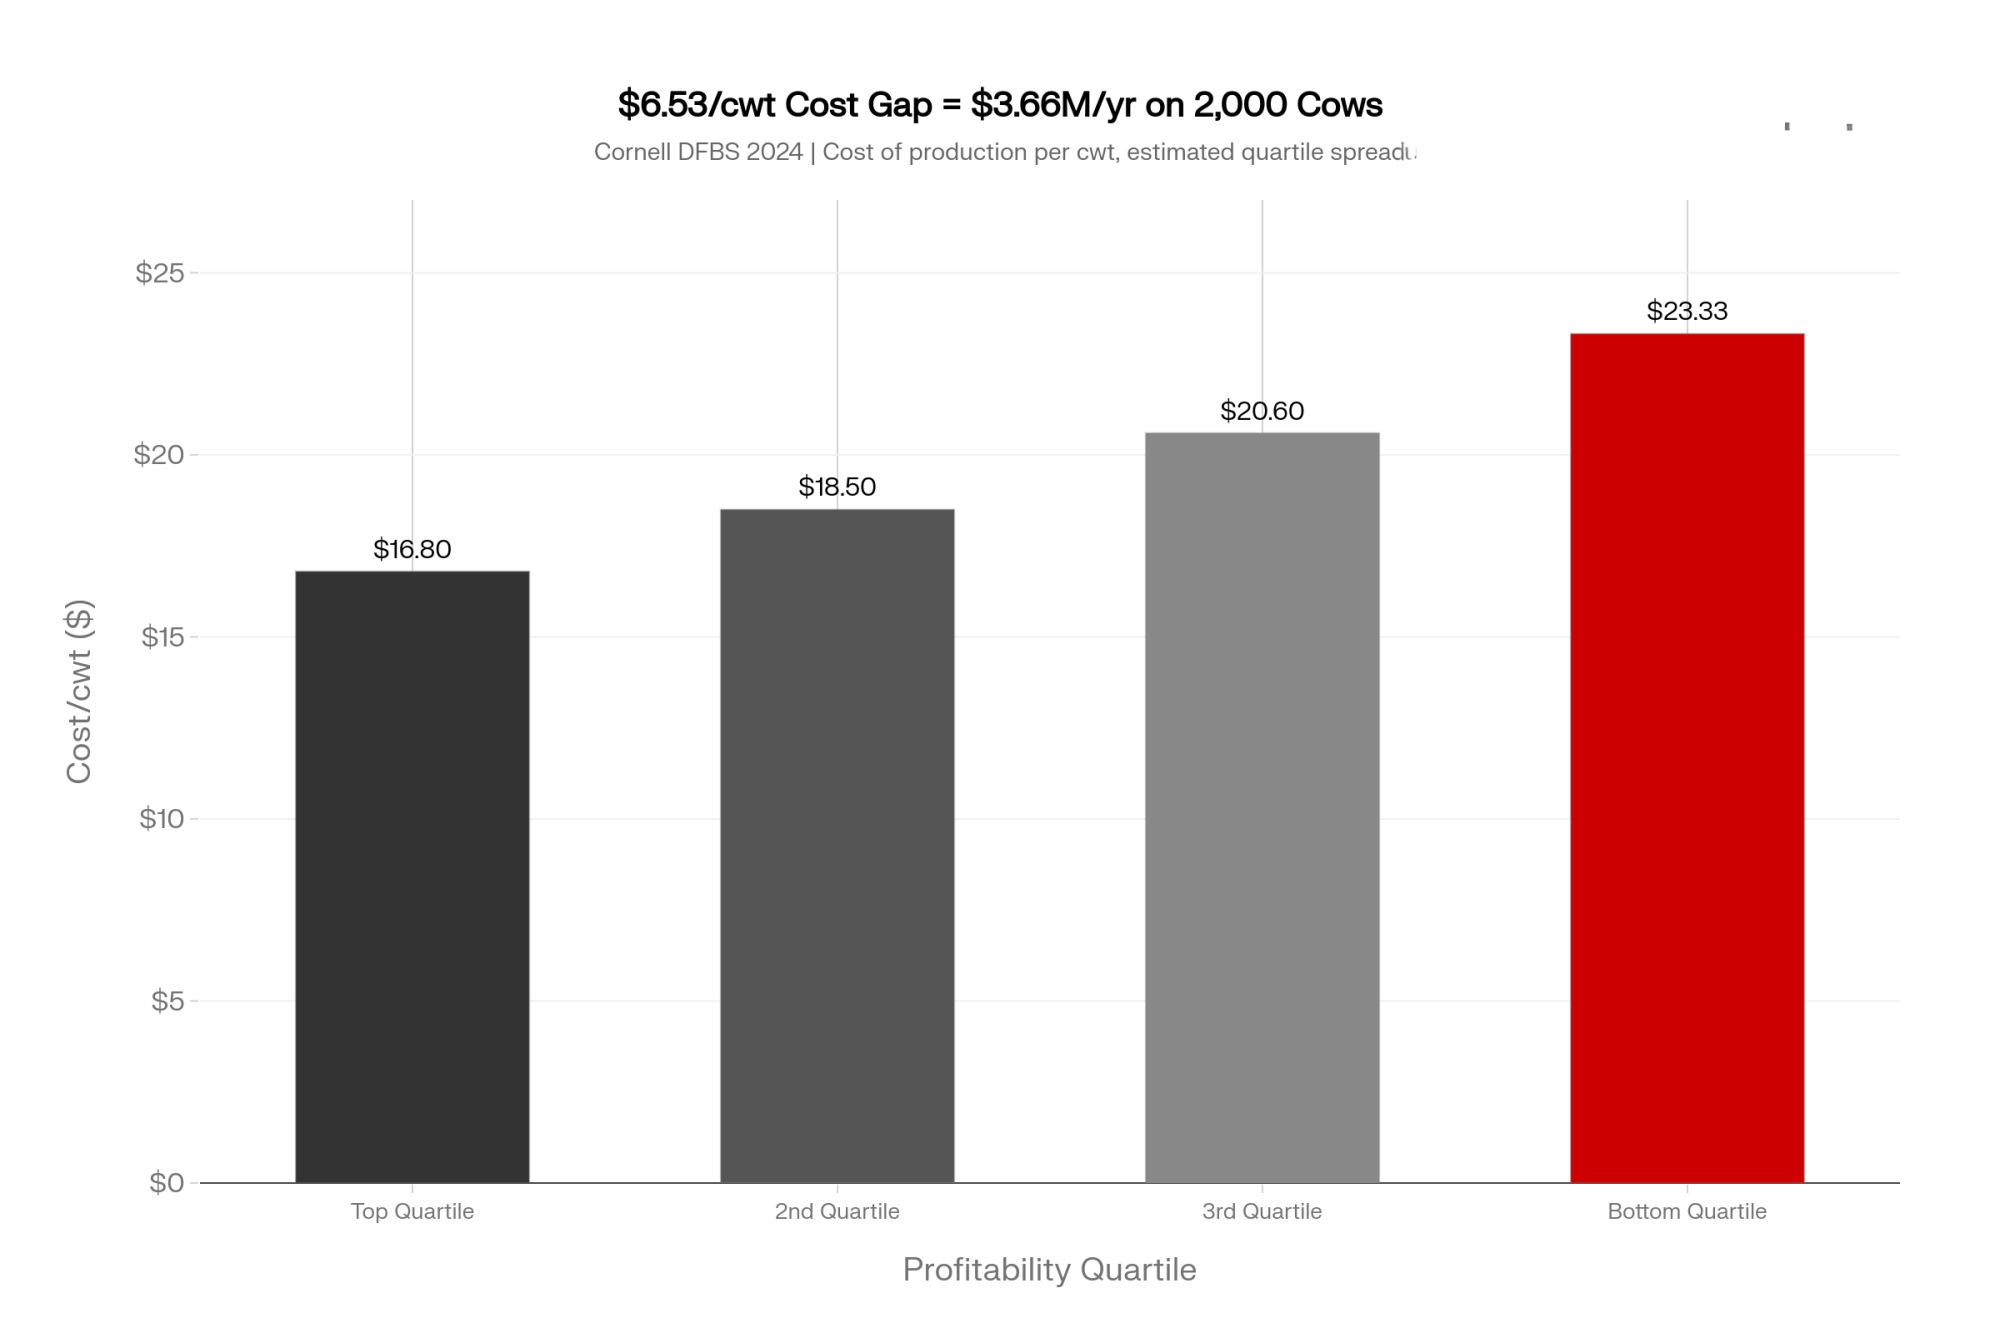
That’s New York data, not a national average — your region’s numbers will look different. But the pattern between top and bottom tends to hold across state farm‑business summaries. When any capital source — PE or otherwise — pushes you toward that $6,600‑per‑cow neighborhood before your earnings and cost structure say you belong there, the term sheet isn’t your biggest problem. The math is.
Is the Deal Built to Pencil — or Built to Sell?
This is the economic question you actually live with: can you still hit your numbers when things go sideways?
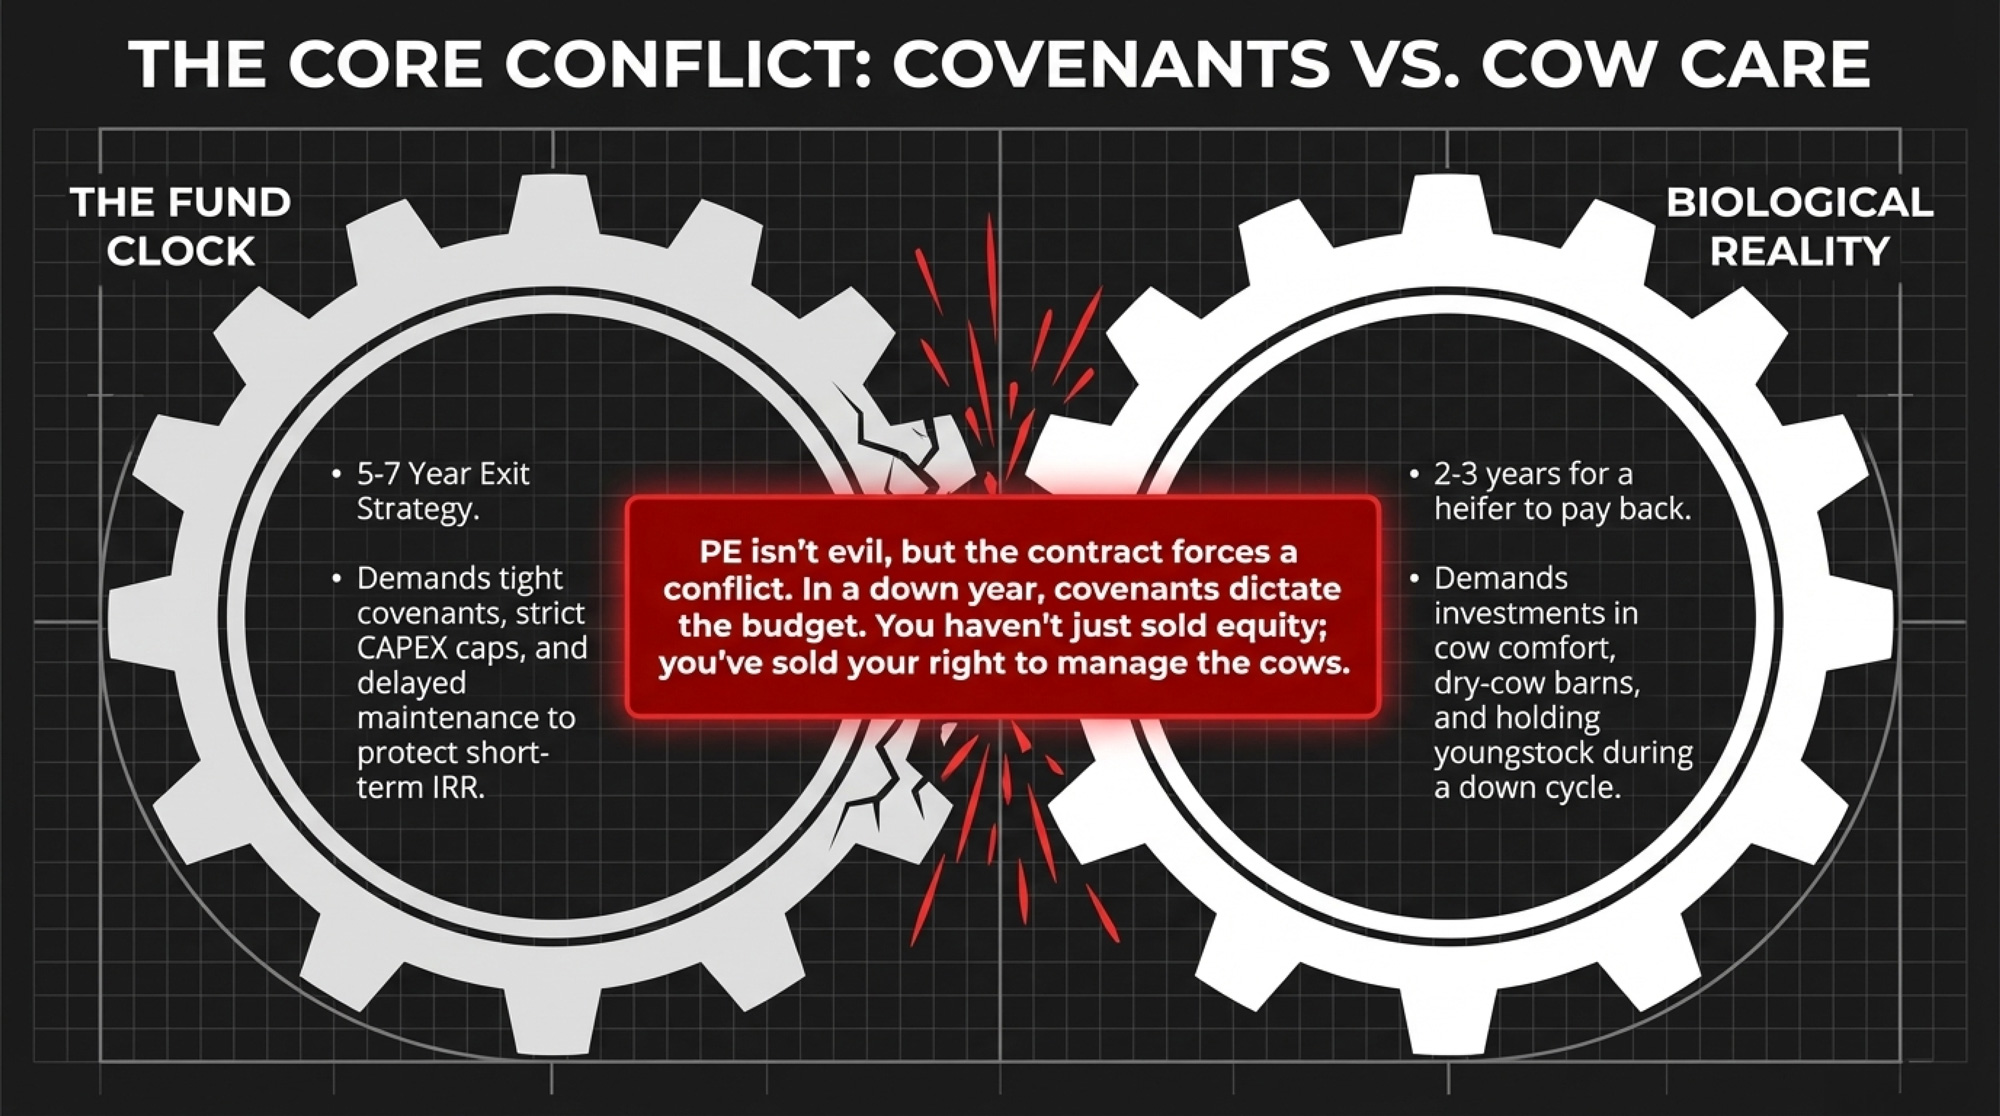
Highly leveraged structures — PE‑backed or just aggressive debt — usually come with tighter covenants than a traditional bank expansion. DSCR floors, restrictions on new borrowing, caps on capex, and sometimes approval requirements on major operational changes. None of that bites when milk is good, and feed is reasonable. It bites when you need breathing room.
You’ve probably had that year already. Health wreck, feed quality issue you chase for months, or a long run of heat that drags component tests. Your instinct says: slow expansion, keep youngstock, invest in a dry‑cow barn or fans, buy time to reset. Tight covenants can push in the opposite direction: freeze spending, delay maintenance, and more milk per stall. That’s the structural conflict Bethard described on the panel — not that PE is evil, but that the contract can force you to make the opposite call from what your gut and cows are telling you.
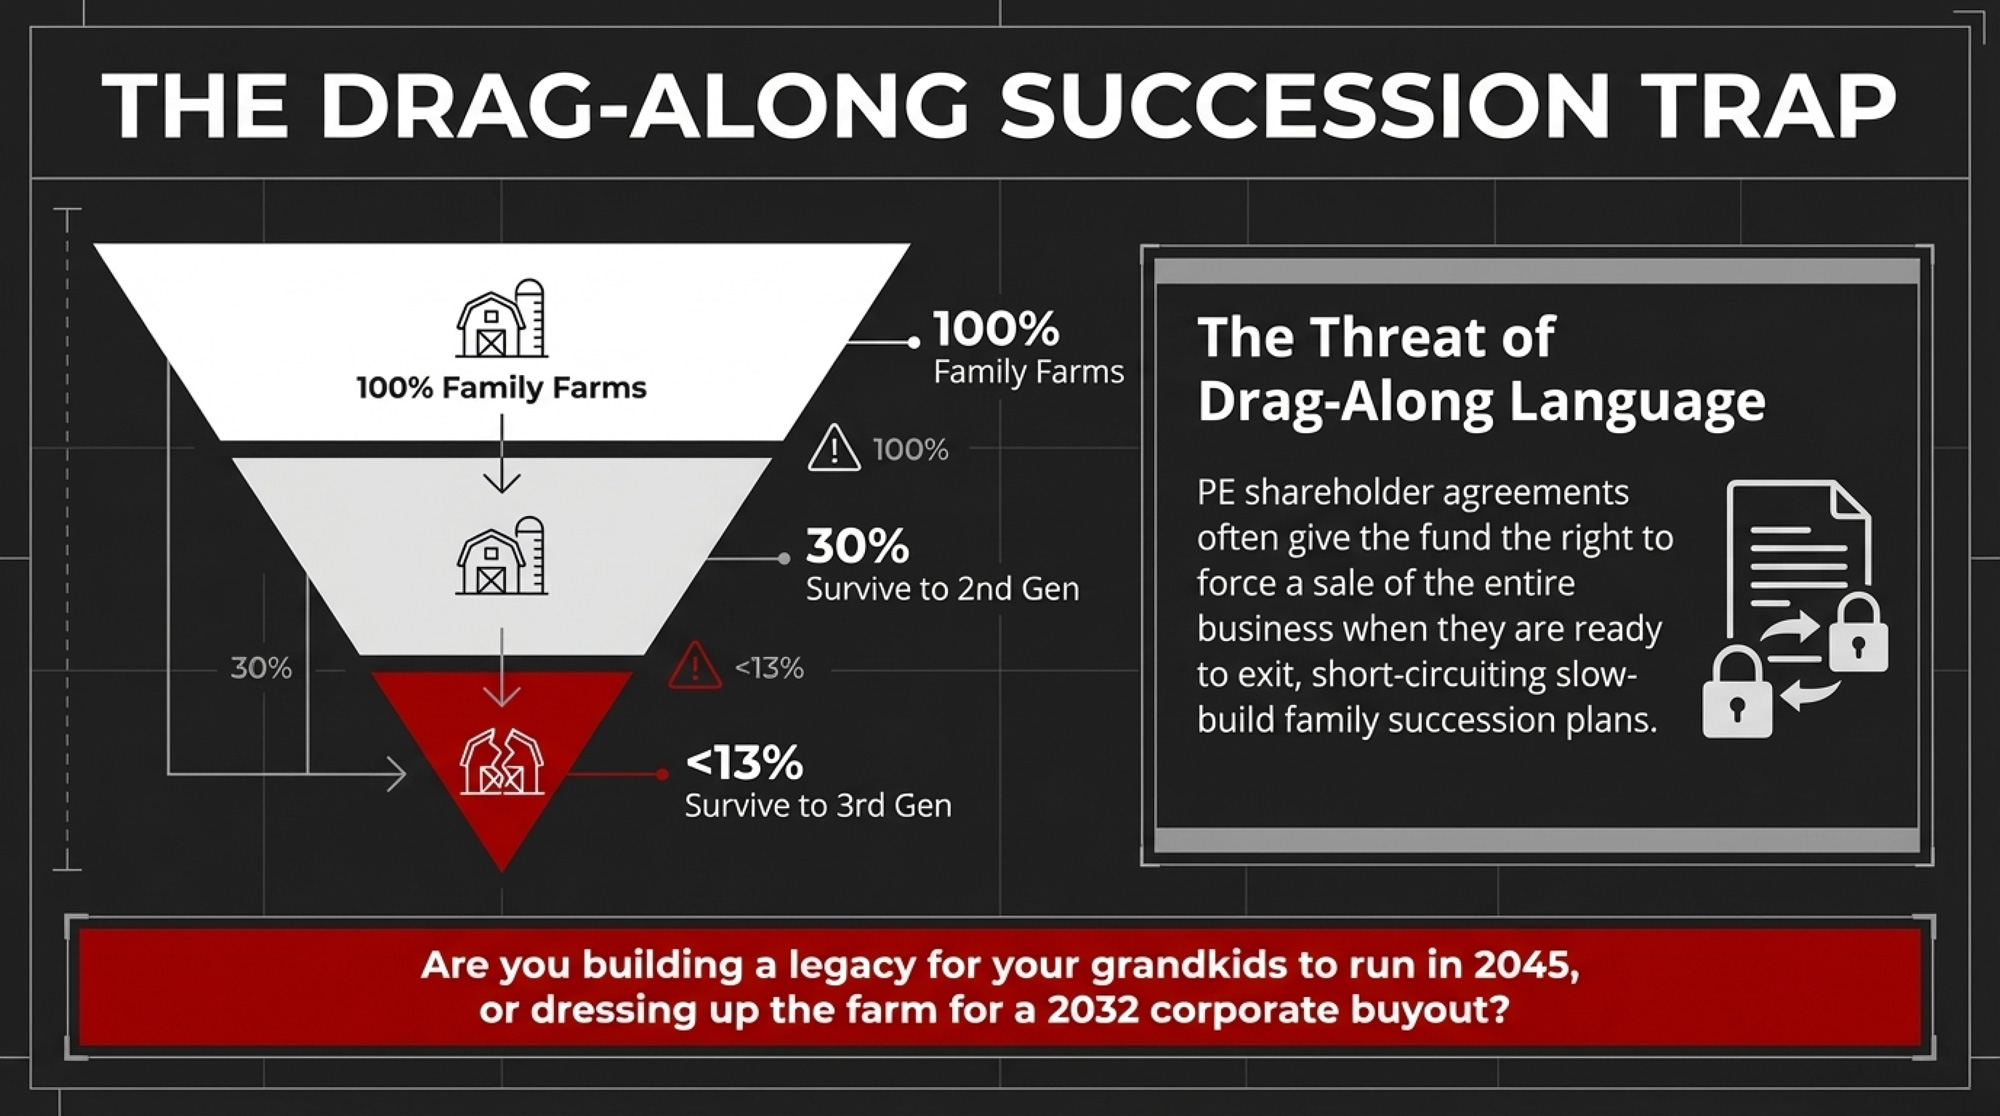
Then there’s drag‑along language. Many PE shareholder agreements give the fund the right to force a sale of the whole business when they exit. In corporate settings, that’s standard. On a family place, depending on how it’s written, it can short‑circuit a slow‑build succession plan. Cross‑industry family‑business research consistently reports that only about 30% of family businesses transition to the second generation, and fewer than 12–13% make it to the third. Contract provisions that accelerate a sale timeline don’t improve those odds.
Before you stare at the check size, it’s fair to ask: Is this structure built to pencil through your worst 12‑month stretch, or is it built to be easy to sell?
Can You Still Make Cow‑Level Decisions When Covenants Control the Budget?
This is the operational version of the same question.
Ask anyone who’s lived under tight covenants. The day‑to‑day pressure doesn’t feel like “capital structure.” It feels like arguing with your own spreadsheet about things you’d normally just do..
Do you need a lender sign‑off to build that fresh‑pen addition you know would take stress off transition cows? Does a board have to agree before you hang more fans, add a hoof‑trimming visit, or keep more heifers this year instead of selling? On paper, those are capital‑allocation decisions. In the barn, they’re cow‑care decisions that directly change milk, longevity, and cull rates.
Bethard was blunt on this point. When you pick partners, you’re also picking who sits at the table when there’s a tough quarter. He wants people who understand that holding onto extra heifers in a bad year can be the best long‑term move, even if it drags DSCR in the short run.
If a deal puts you in a position where every down‑cycle adjustment needs outside permission, you haven’t just sold equity. You’ve sold a chunk of how you manage cows.
Is Your Expansion Built to Stay — or Built to Flip?
Location exposes what you really believe about your time horizon.
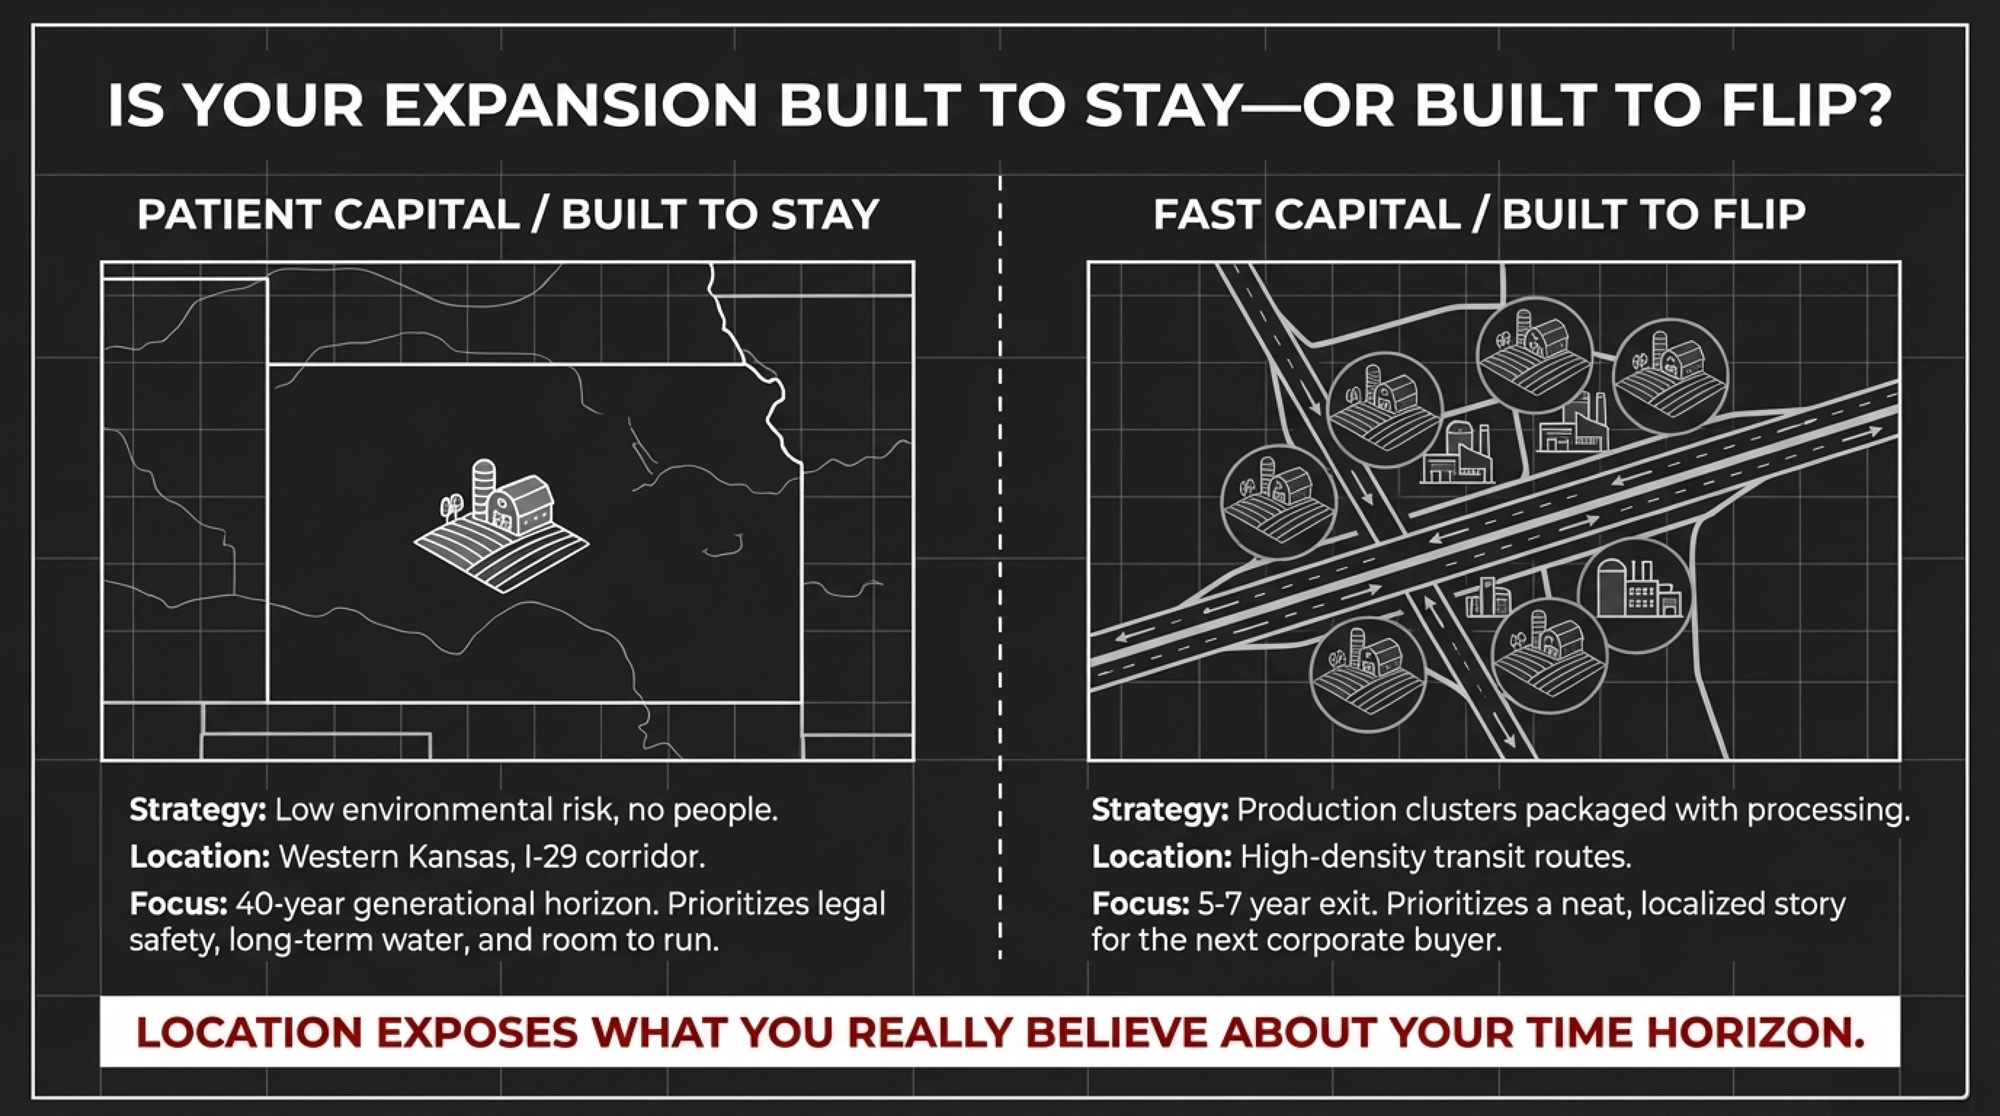
Bethard told the audience that if he were siting a new dairy today, he’d look for “low environmental risk and a place without a lot of people.” Fewer neighbors, less legal risk, more room to run. Tuls’ answer was short: “Close to a milk plant.” For him, that means DARI — because that’s the anchor his family is building generations around.
Investors running a shorter‑term play often think about geography differently. They like production clusters that can be packaged with processing capacity and sold together: multiple herds within hauling distance of a plant, good roads, a neat story for the next buyer. That doesn’t automatically make a site wrong for a 40‑year plan. But it means you need to double‑check the long‑term water, permitting, and community story — not just the current land price.
Bethard noted you need a contract before you can even build now. That reality has pushed new capacity toward regions like western Kansas and the I‑29 corridor, where processors like Hilmar and Valley Queen are pulling milk into existence rather than chasing existing herds. If you’re choosing a spot for your grandkids to renew contracts in 2045, that’s a completely different filter than picking the easiest site to sell in 2032.
Options and Trade‑Offs for Farmers
You don’t need a PE term sheet on your desk for this to matter. Any expansion that stretches your balance sheet forces you to pick a path.
| Path | Typical Debt/Cow | DSCR in Bad Year | Cow-Level Decision Control | Exit Pressure | Best For | Yellow / Red Flag |
|---|---|---|---|---|---|---|
| 1. Traditional Debt + Patient Bank | ~$2,997–$4,500 | >1.25× if sized right | Full — no outside approval | None | Solid profitability, clean financials, moderate growth | 🔴 Red if debt pushed past ~$5,500/cow |
| 2. Strategic Partners (No Fund Clock) | $3,500–$5,500 | >1.0× if structured correctly | High — per operating agreement | Minimal if agreements are written right | Expansion beyond bank capacity; multigenerational family | 🟡 Yellow if partners want short-term return hurdles |
| 3. Private Equity / PE-Style Equity | $4,500–$6,638+ | May drop below 1.0× under covenants | Reduced — capex/hiring may require board approval | High — 5–7 yr hold, drag-along rights | Rapid roll-up, processing integration, very large facilities | 🔴 Red if DSCR <1.0× in bad-year scenario |
| 4. Slow-Build / Do Less, Better | <$3,500 | Typically >1.5× | Full — sole-prop or tight family | None | Operations with sub-optimal cost structure needing reset | 🟡 Yellow if facility is fundamentally inefficient |
Path 1: Traditional Debt + Patient Partners
When it makes sense: You’ve got solid profitability, reasonable leverage, and a lender who understands your history. Your debt per cow sits closer to that top‑quartile DFBS band than the most leveraged group, and your coverage ratio stays above roughly 1.25× even when you run a bad‑year scenario.
What it requires: Clean financials, believable projections, and genuine working capital. In Cornell’s 2024 DFBS, the most profitable quartile held substantially more working capital relative to operating expenses than the least profitable group. You don’t need to match any specific benchmark exactly, but you need real cushion — not wishful thinking.
Risks and limits: You’re still exposed to milk price and interest‑rate swings. Size the project too aggressively relative to your earnings, and the “traditional” deal lands you in bottom‑quartile debt territory without a PE fund anywhere in the picture.
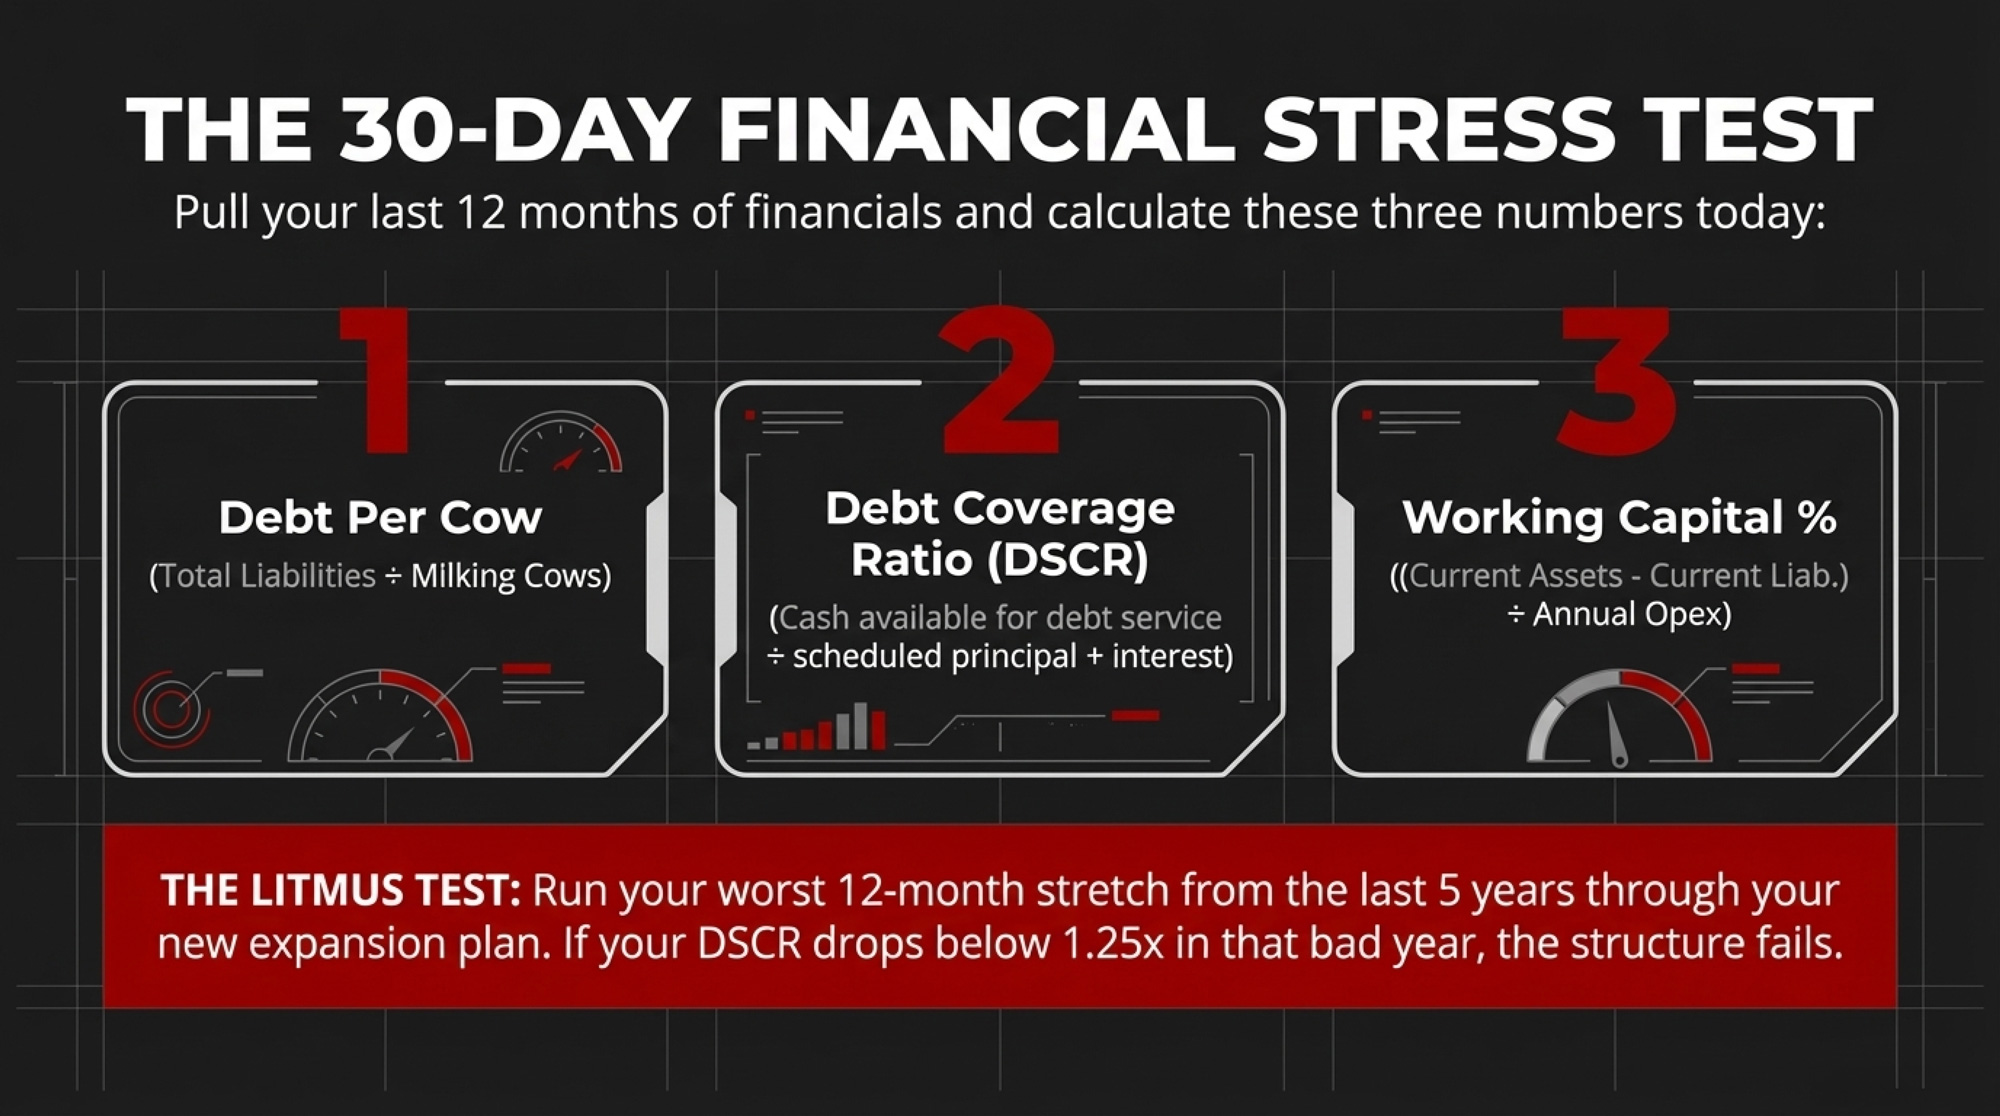
30‑day action: Pull your last 12 months of financials this month and calculate three numbers:
- Debt per cow (total liabilities ÷ milking cows)
- Debt coverage ratio (cash available for debt service ÷ scheduled principal + interest)
- Working capital % ((current assets − current liabilities) ÷ annual operating expenses)
Then run your worst 12‑month stretch from the last five years through your next‑step plan. If this structure keeps DSCR above ~1.25× in that bad year, it stays on the table. If it drops below 1.0×, the red flag goes up.
Path 2: Strategic Partners Without a Fund Clock
When it makes sense: You need more capital than your bank will supply alone, but you want partners who’ll stay through cycles — family members, neighbors, or agribusiness investors who aren’t running a 5‑ to 7‑year fund. This is the space Bethard lives in, and it’s what Hafliger built with his kids and spouses across multiple Idaho sites.
What it requires: Hard conversations about control. Operating agreements that spell out who decides what: capex thresholds, hiring and firing senior managers, land purchases, and dividend policy. A common understanding that you’re building for 20–40 years, not dressing the place up for a sale.
Risks and limits: People risk. These deals fall apart when expectations around distributions, lifestyle, or succession were never put on paper. Even without PE, your partners may still want tighter covenants than a simple family sole‑prop structure.
Signals to watch: If a potential partner insists on sale or IPO timelines, short‑term return hurdles, or aggressive drag‑along rights, you’re drifting back into fund‑clock land. That’s not automatically wrong — but call it what it is.
Path 3: Private Equity or PE‑Style Outside Equity
When it makes sense: You’re chasing a very specific play: rapid multi‑site roll‑up, vertical integration into processing, or a large‑scale facility where the check size isn’t realistic any other way. Teams like Tuls’ on the processing side live near this territory, even if their specific capital stack isn’t classic PE.
What it requires: Exceptional cost of production, real management depth, and a story that sells in a boardroom as well as it does in the parlor. You need a cold‑eyed lawyer walking you through every clause: covenants, drag‑along, tag‑along, non‑competes, and reserved matters.
Risks and limits: The fund’s holding period is usually 5–7 years. That’s a heifer and a half. If milk prices and interest rates don’t cooperate, pressure to hit IRR targets can show up as stalled maintenance, pushed cows, or delayed people investments. At the family level, drag‑along language can force a sale on a timeline that doesn’t match the next generation’s readiness.
Forward‑looking signals: Where are interest rates headed over the next 3–5 years? How tight are current milk‑supply contracts in your region, and how long are they written for? Are lenders and investors pricing in environmental and labor risk — or assuming they’ll be gone by the time it matters?
Path 4: Slow‑Build or “Do Less, Better”
When it makes sense: Your numbers don’t justify aggressive leverage, you don’t like the idea of outside veto power, and there’s still a path to solid profitability by tightening the cost of production and modestly growing components instead of cow numbers.
What it requires: Patience. Relentless work on cost per cwt instead of headline herd size — feed efficiency, cow longevity, reproduction, labor efficiency. In DFBS data, the most profitable, lower‑debt farms didn’t just borrow less; they also produced milk several dollars per cwt cheaper. That combination is what gives them room to breathe.
Risks and limits: You may age out of opportunities if processors shift or neighbors move faster. And if your current facility is fundamentally inefficient, no amount of small tweaks fully fixes that.
Forward‑looking signals: Watch how processors tweak premiums in your area, what they say about components, and whether they start writing water‑ or sustainability‑linked clauses into contracts. That tells you how far a “do less, better” strategy can carry you where you sit.
Key Takeaways
- If your expansion plan pushes debt past the mid‑$6,000s per cow, treat that as a hard yellow light.Cornell’s 2024 DFBS shows the lowest‑earning New York quartile at about $6,638 per cow with debt coverage under 1×, even in a strong income year. Top earners sat near $2,997 with coverage above 5×.
- If one capital structure survives your worst recent 12‑month stretch and another fails the DSCR test, believe the math. Run both through your ugliest year. The structure that keeps coverage above roughly 1.25× when everything goes wrong is the one you can build on.
- If you can’t approve cow‑comfort or youngstock spending in a down year without outside sign‑off, someone else is making your cow‑level calls. Any deal that pulls basic barn decisions into board or lender approval changes how you manage stress years.
- If there’s drag‑along language, understand what it can force — and when. Cross‑industry benchmarks say only about 30% of family businesses survive to the second generation and fewer than 13% reach the third. You don’t want contract terms cutting those odds even further.

The Bottom Line
Hafliger’s grandkids are already counting cows. Bethard talks about 10,000 hours of expansion scars. Tuls is backing a $165 million plant with no exit date in the plan.
None of them got there quickly. All of them got there on terms they chose.
So here’s the question worth sitting with: five years from now, do you want to be explaining your decisions to a board — or to your kids?
We’re building the full debt‑per‑cow stress‑test model now — covenant math, leverage thresholds by herd size, and a PE‑vs‑partner calculator you can drop your own numbers into. Watch for it in The Bullvine Weekly and our follow‑up economics deep dive.
Source note: Quotes and panel insights are drawn from MILK Business Conference coverage in Dairy Herd Management. Financial patterns are based on Cornell’s 2024 Dairy Farm Business Summary bulletin, “Comparing New York dairy farm characteristics, costs, and returns by profitability, 2024” (PD‑2025‑08‑01).
Learn More
- Squeezed Out? A 12-Month Decision Guide for 300-1,000 Cow Dairies – Secure your farm’s immediate future with this ruthless 12-month survival checklist. This guide breaks down labor costs by herd size and delivers specific “Action This Week” steps to protect your equity before the market decides for you.
- The Bullvine Dairy Curve: 15000 U.S. Farms by 2035 and Under 10000 by 2050 – Who’s Still Milking? – Gain the long-term clarity needed to survive the shift toward 2,500+ cow herds. This analysis maps the “Dairy Curve” timeline, helping you choose between scaling, specializing, or executing a strategic exit while your balance sheet is still strong.
- Unlock Hidden Dairy Profits Through Lifetime Efficiency: How Modern Genetics and Strategic Nutrition Can Cut Feed Costs by $251 Per Cow – Boost your bottom line by $251 per cow through precision genetics and RFI-focused breeding. This report exposes the immediate margin gains available from early-life programming and shows how to capture efficiency that traditional management simply misses.
 The Sunday Read Dairy Professionals Don’t Skip.
 The Sunday Read Dairy Professionals Don’t Skip.
Every week, thousands of producers, breeders, and industry insiders open Bullvine Weekly for genetics insights, market shifts, and profit strategies they won’t find anywhere else. One email. Five minutes. Smarter decisions all week.
