


These days, if you use AI sires as opposed to natural service, it’s practically impossible not to make genetic progress. The bulls offered by AI companies are of such caliber that for the most part, genetic progress heads in one direction – upwards! However, the rate at which a herd makes progress is highly variable.
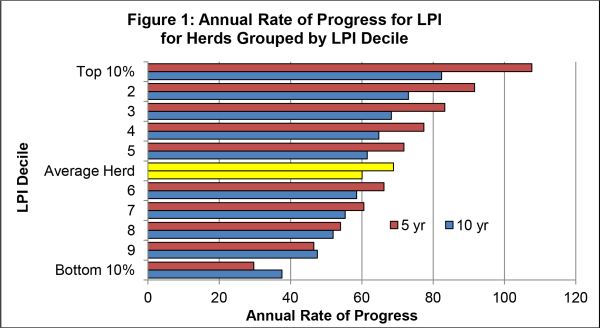
To reveal the different rates at which herds are making genetic progress, CDN examined a dataset including cows with an official LPI that were born in either 2001, 2006 or 2011. Using these birth years gave the opportunity to analyze the rate of genetic progress in each herd across five and ten year periods. Herds included in the analysis were restricted to those that had at least 10 cows with an official LPI in each of the three birth years. In total, the analysis involved approximately 193,700 cows from nearly 2,500 herds across Canada. The Fast, the Average and the Slow Progressers Herds were grouped into ten groups (i.e.: deciles) based on the annual rate of genetic progress achieved for LPI over the five year period based on cows born in 2011 versus 2006. Annual rates of genetic progress were graphed for this five year period, as well as for the ten year period (i.e.: cows born in 2011 versus 2001), as shown in Figure 1. The average herd has experienced a faster rate of genetic gain over the most recent five year period compared to the ten year period. This is surely, due to genomics to some degree, which has increased the rate of genetic progress in the breed. During the ten year period, the top 10% of herds made around 20 points more progress per year than average herds. During the five year period this doubled, with the herds in the top 10% making 40 LPI points more progress per year compared to herds with the average rate of LPI progress.
Female genomic testing was used twice as much in herds in the top 10% compared to in average herds (12% versus 6%). It’s likely that owners of the top herds genomic tested more animals because they realize the importance of genetic selection and may be involved with marketing genetics. Nonetheless, female genomic testing is a tool used to accelerate genetic progress, and increased uptake by herds in the top 10% speaks to the willingness of these herd owners to seek out and utilize such tools to their advantage.
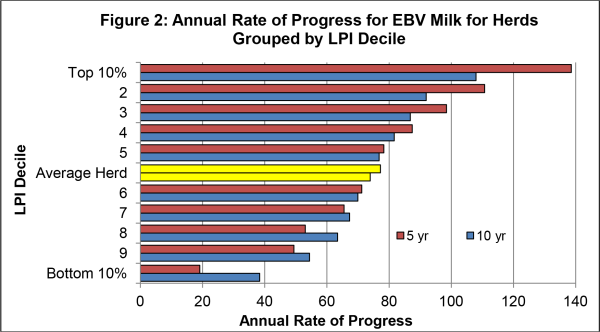
Figure 2 groups herds the same way as Figure 1, but shows progress for EBV Milk over five and ten year periods. Once again, it is clear that there are certain herds making much faster genetic progress for this trait, and that the annual progress achieved in these herds in the most recent five year period far exceeds that achieved over the ten year period. Also noteworthy is the fact that in both Figures 1 and 2, herds in the bottom deciles made more progress per year for LPI and EBV Milk over the ten year period than the five year period, meaning that the annual rate of progress has been slowing down so these herds are falling more and more behind.
Annual Progress for Key Traits Table 1 shows the annual genetic gain for key traits in an average herd, as well as the average progress per year experienced by herds in the top and bottom 10%. Only LPI and its three components as well as production yields and Conformation are included since rates of genetic progress for functional traits are quite slow in most herds with little difference across herds.
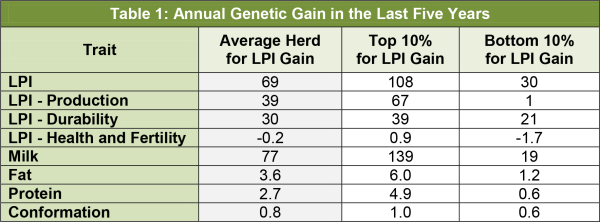
The average herd makes approximately 70 LPI points of progress per year while a herd in the top 10% or bottom 10% would make approximately 40 points more or 40 points less gain per year, respectively. By looking at the LPI components, it is clear that most of the annual rate of gain in LPI comes from progress for Production and Durability. For the Health and Fertility, however, the average herd in Canada has virtually made no genetic progress for this component while the best herds have achieved an average gain of one point per year during the past five years. The poorest herds for rate of progress for LPI actually lost ground for Health and Fertility at an average rate of nearly two points per year.
Genetic progress for production traits is variable from herd to herd, with the average herd gaining 77 kg EBV Milk per year while the top 10% of herds for LPI gain achieve EBV Milk gains of nearly 140 kg EBV Milk. Progress for herds in the bottom 10% is only 19 kg EBV Milk, annually. These extreme genetic differences surely translate into considerable production differences among herds, which translates to poorer profitability.
In terms of Conformation, the average herd makes 0.8 EBV points of progress annually. Interestingly, even herds in the bottom 10% for LPI gain make 0.6 EBV points of progress for Conformation each year. This shows that significant progress is made for Conformation, even if progress for LPI is minimal. Summary Your herd is almost certainly making genetic progress but there are real and significant differences among herds in the rate at which genetic progress is occurring. Thanks to genomics, genetic progress has sped up in most herds in the past five years, which has contributed to the fact that annual rates of gain have been faster in the most recent five years compared to earlier years. While the average herd has made more progress over the past five years, it is herds in the top 10% that are achieving gains at a much faster rate than others. Herds in the top 10% for LPI gains are likely utilizing all tools available to them to maximize genetic progress, keeping them far ahead of the pack in terms of annual genetic gain.
[related-posts-thumbnails]
Leave a Reply
You must be logged in to post a comment.