


With $11 billion in new processing capacity reshaping the industry and loan renewals looming, the decisions you make before February will echo for years
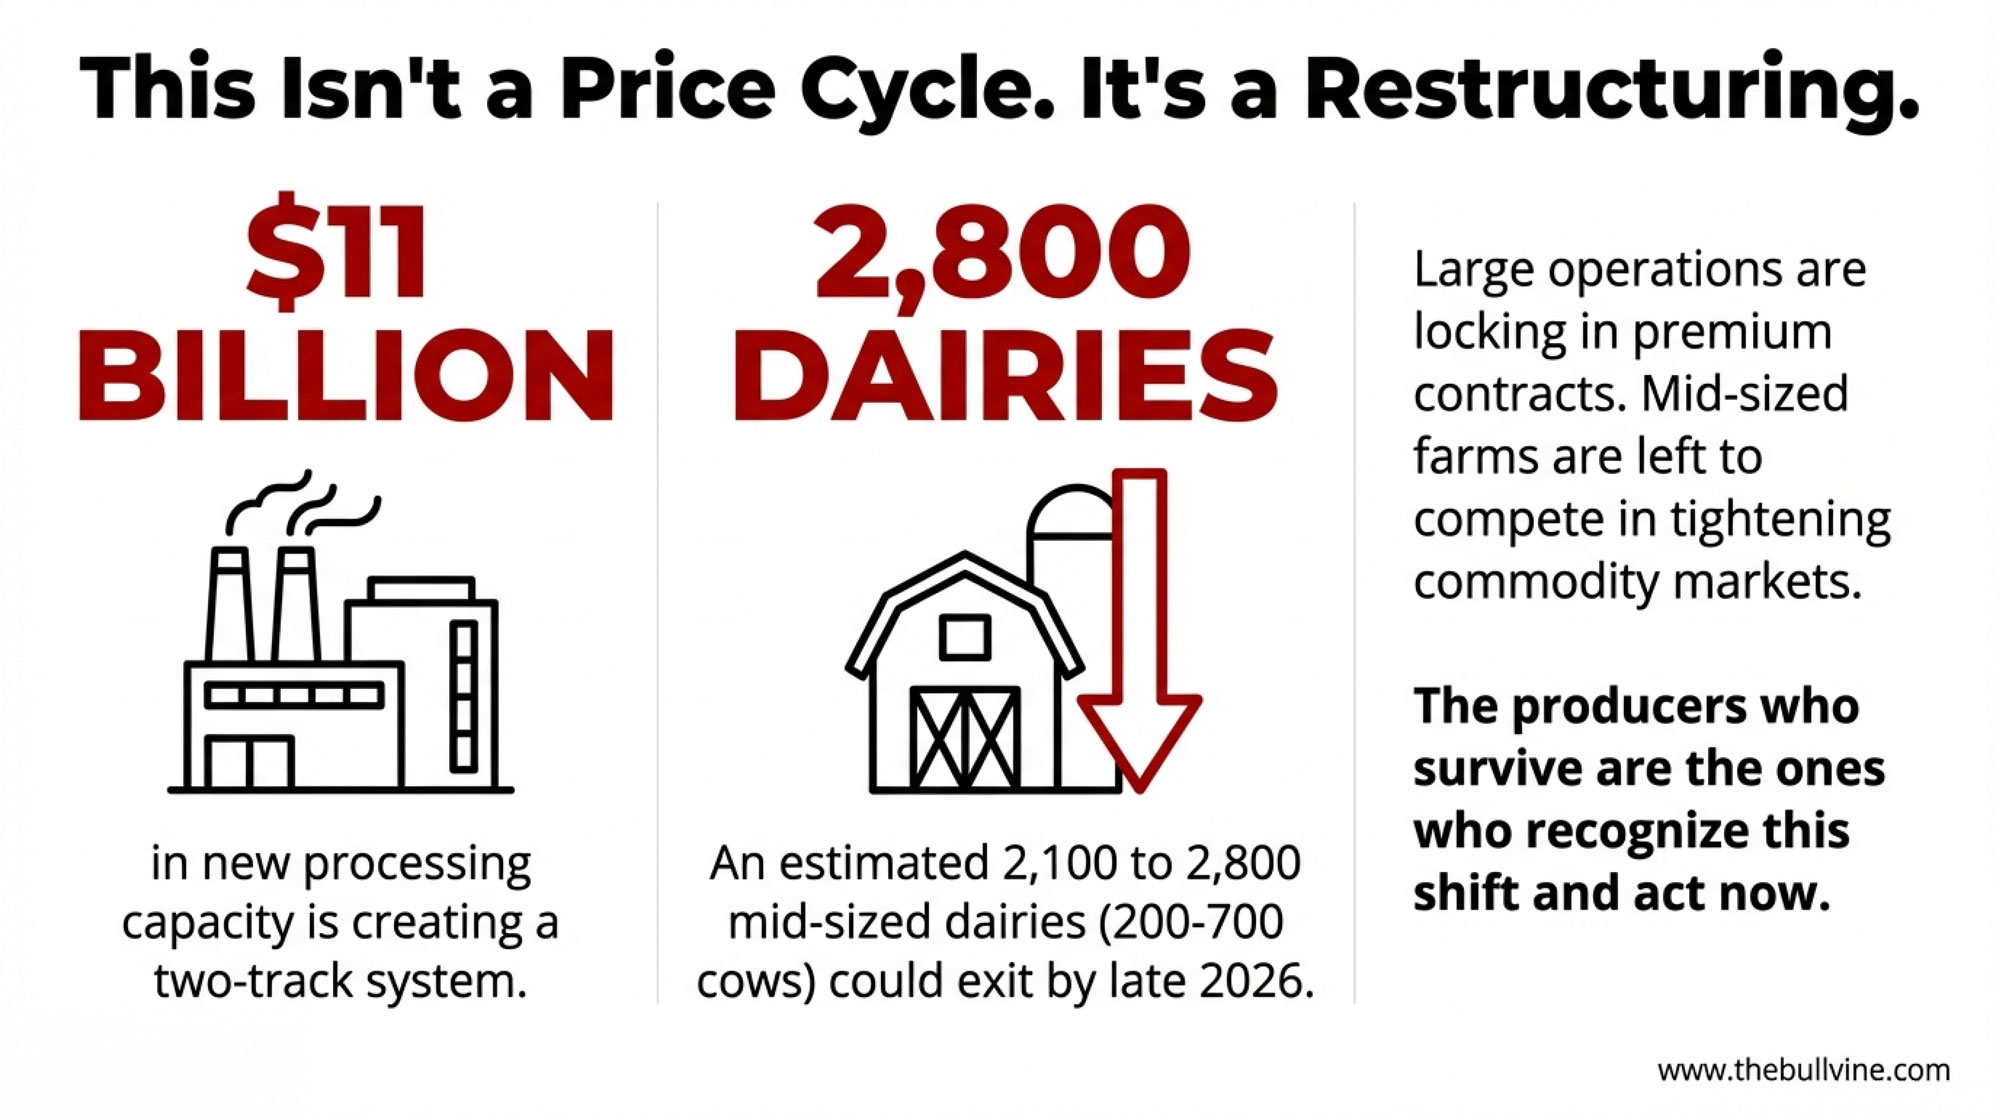
EXECUTIVE SUMMARY: Your lender is already running the numbers on your 2026 renewal—and if you haven’t done the same math, you’re starting from behind. With Class III futures stuck in the mid-$15s and real production costs running $19-21/cwt, the margins that looked workable 18 months ago have evaporated for many mid-sized operations. This isn’t a typical price cycle. It’s an industry restructuring: $11 billion in new processing capacity is creating a two-track system where large operations lock in premium contracts while mid-sized farms compete in tightening commodity markets. Heifer inventories have hit a 47-year low, genetic indexes have shifted hard toward components, and analysis suggests 2,100-2,800 dairies in the 200-700 cow range could exit by late 2026. But exit isn’t inevitable for those who move now. The producers who’ll still be milking in 2030 are making decisions this month: locking in risk protection, aligning genetics with where the premiums are heading, and walking into their banker’s office with a plan—not waiting to be handed one.
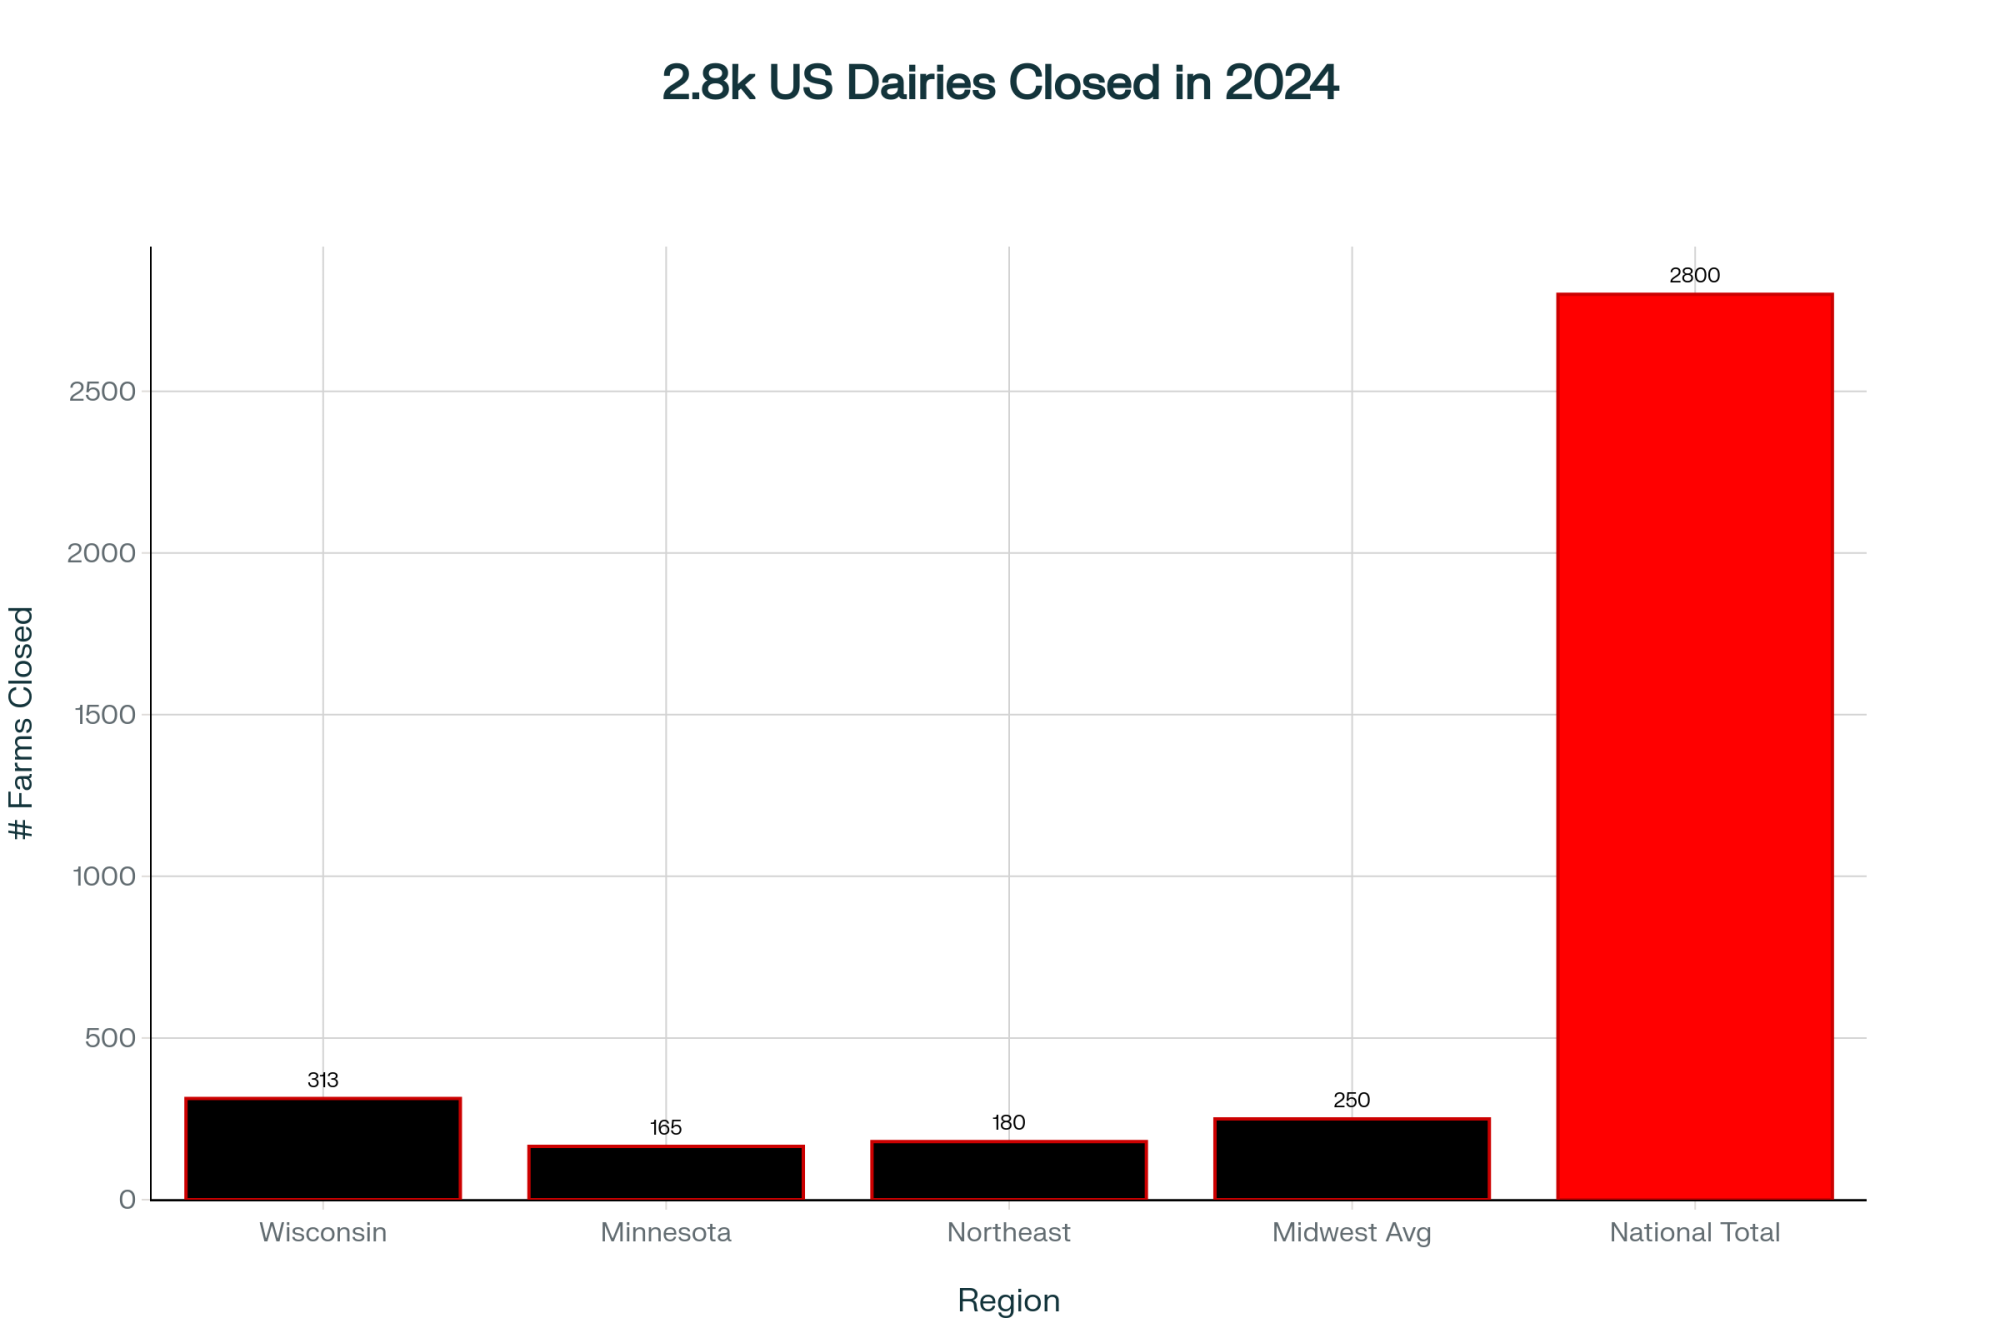
There’s a conversation happening in bank offices and kitchen tables across dairy country right now, and it deserves more attention than it’s getting. Drawing on exit-rate data and economic analysis from sources like UW-Madison’s Center for Dairy Profitability, the pattern suggests somewhere between 2,100 and 2,800 mid-sized dairy operations could leave the industry by the end of 2026. We’re talking farms running 200 to 700 cows—operations that, in many regions, still form the backbone of rural dairy communities.
What strikes me about this moment is how many of the farms facing pressure aren’t the ones you’d expect. I talked with a producer in central Wisconsin running 400 cows—solid genetics, modern parlor, experienced management team. On paper, everything looks right. Yet he’s facing the same margin squeeze as operations half his size. These aren’t dairies with obvious management problems or run-down facilities. Many are well-run operations with experienced owners who’ve weathered tough cycles before.
The difference this time feels structural. And understanding that distinction matters quite a bit for anyone figuring out their next move.
The Financial Conversations Already Underway
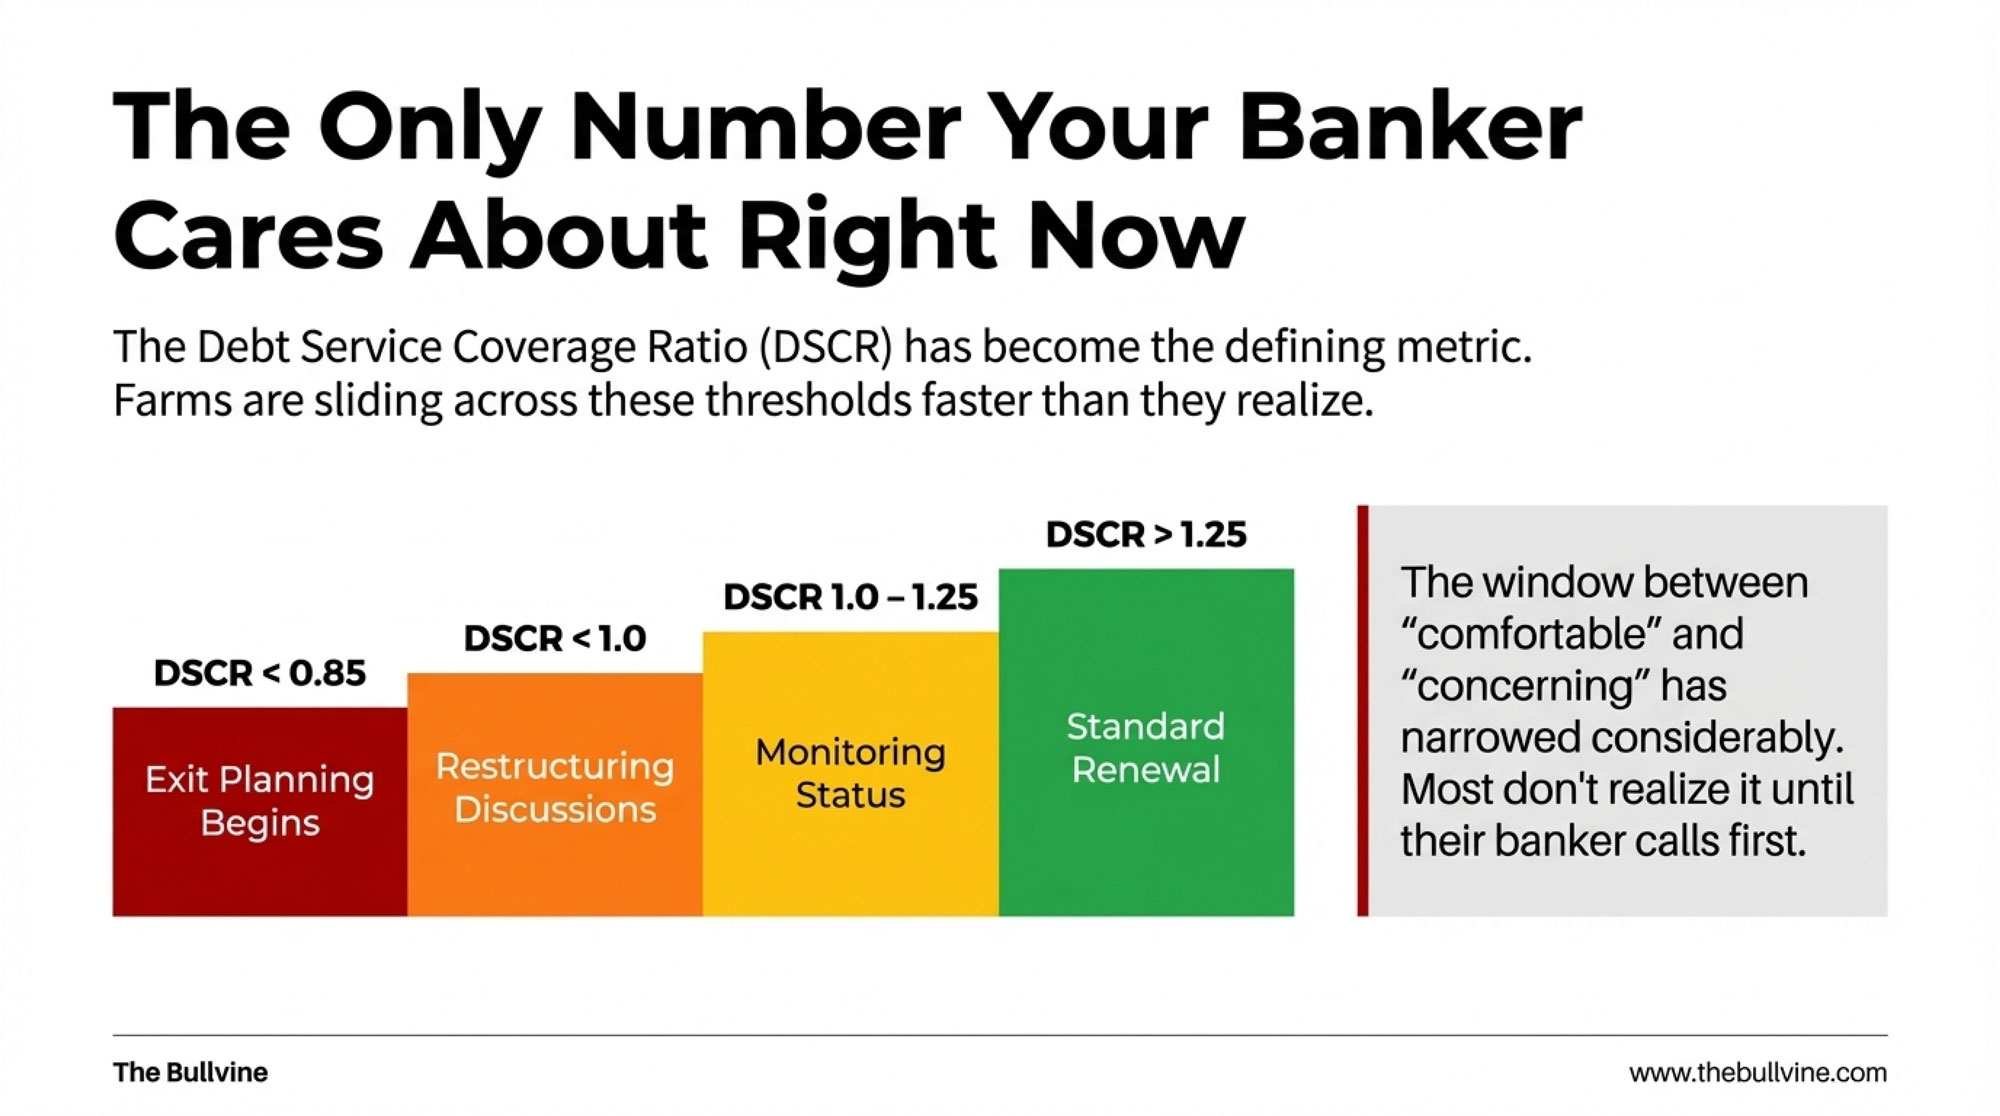
If you’re preparing for a January loan renewal, your lender’s probably already started their internal review. What’s particularly noteworthy is how the debt service coverage ratio has become the defining metric in these conversations.
Here’s what I’m generally seeing in terms of how lenders sort operations: A DSCR above 1.25 usually means straightforward renewal—your file moves through without much scrutiny. Between 1.0 and 1.25, you’re in monitoring territory. Renewal’s likely, but expect closer attention and perhaps some questions about your forward plan. Drop below 1.0, and restructuring discussions typically begin. Below 0.85? That’s when exit conversations often follow.
Quick Reference: DSCR Threshold Guide
| Your DSCR | What It Typically Means | Your Next Step |
| Above 1.25 | Standard renewal likely | Document your forward plan anyway |
| 1.0 – 1.25 | Monitoring status; closer scrutiny | Prepare detailed 2026 projections |
| Below 1.0 | Restructuring discussions likely | Initiate conversation proactively |
| Below 0.85 | Exit planning often begins | Explore all options with the advisor |
Why does this matter right now? Because the window between comfortable and concerning has narrowed considerably.
Tom Kriegl spent roughly 30 years with UW-Madison’s Center for Dairy Profitability, and he’s seen these cycles play out many times. The reality is that conversations change pretty quickly once you cross that 1.0 threshold. Lenders aren’t looking to push anyone out—that’s not the goal—but they have risk parameters they need to work within. The earlier a producer engages in that conversation, the more options tend to be available.
Here’s the uncomfortable truth: farms are sliding across these thresholds faster than anyone predicted—and most don’t realize it until their banker calls first. Mark Stephenson, who directs dairy policy analysis at UW-Madison, has observed that margins have compressed faster than many producers anticipated. Farms that looked comfortable 18 months ago are finding themselves in very different territory.
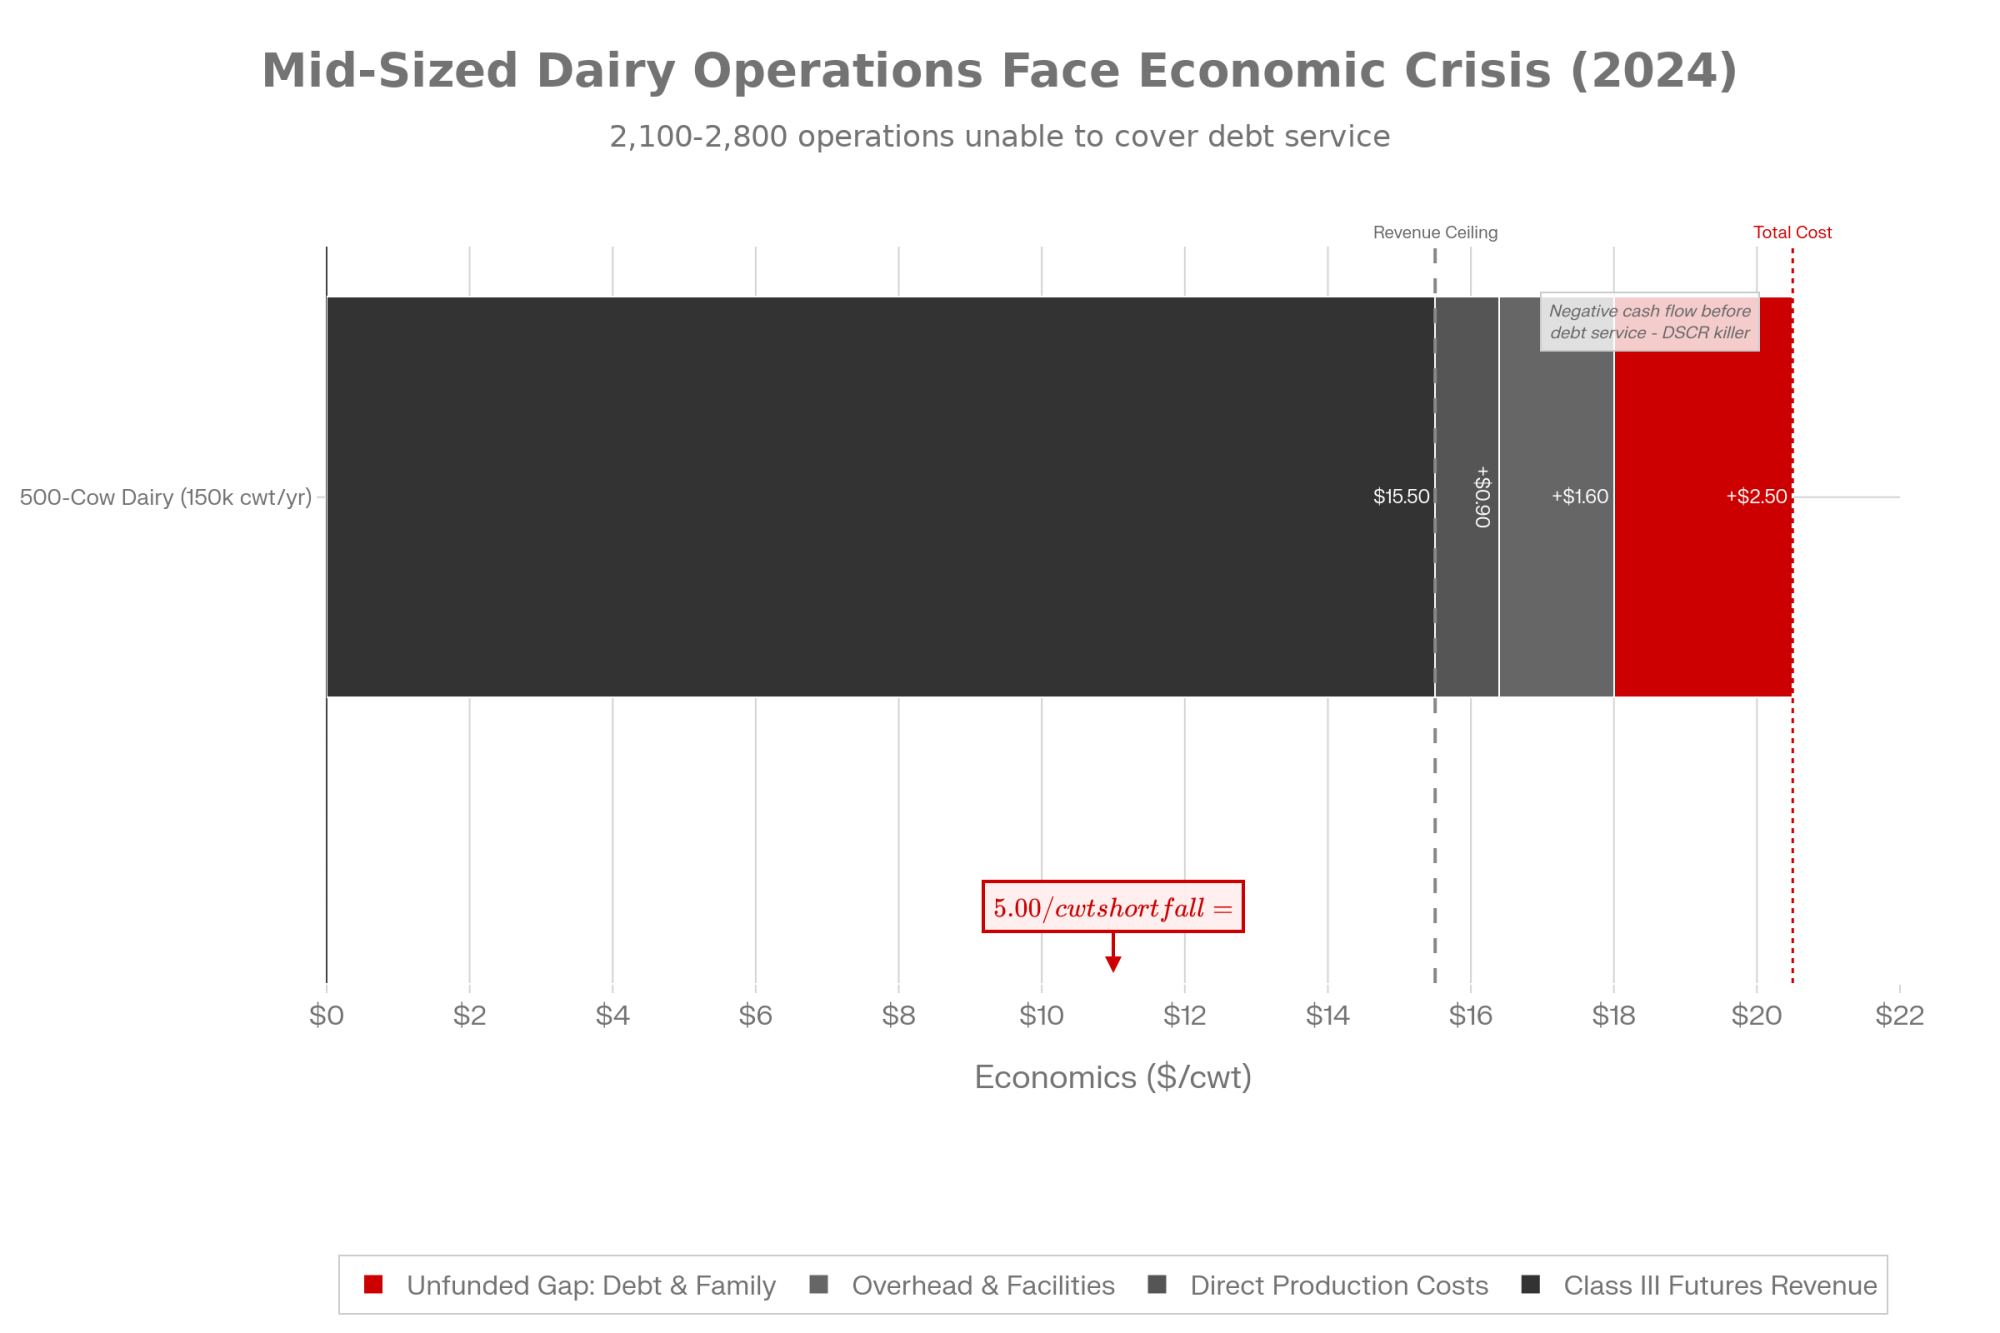
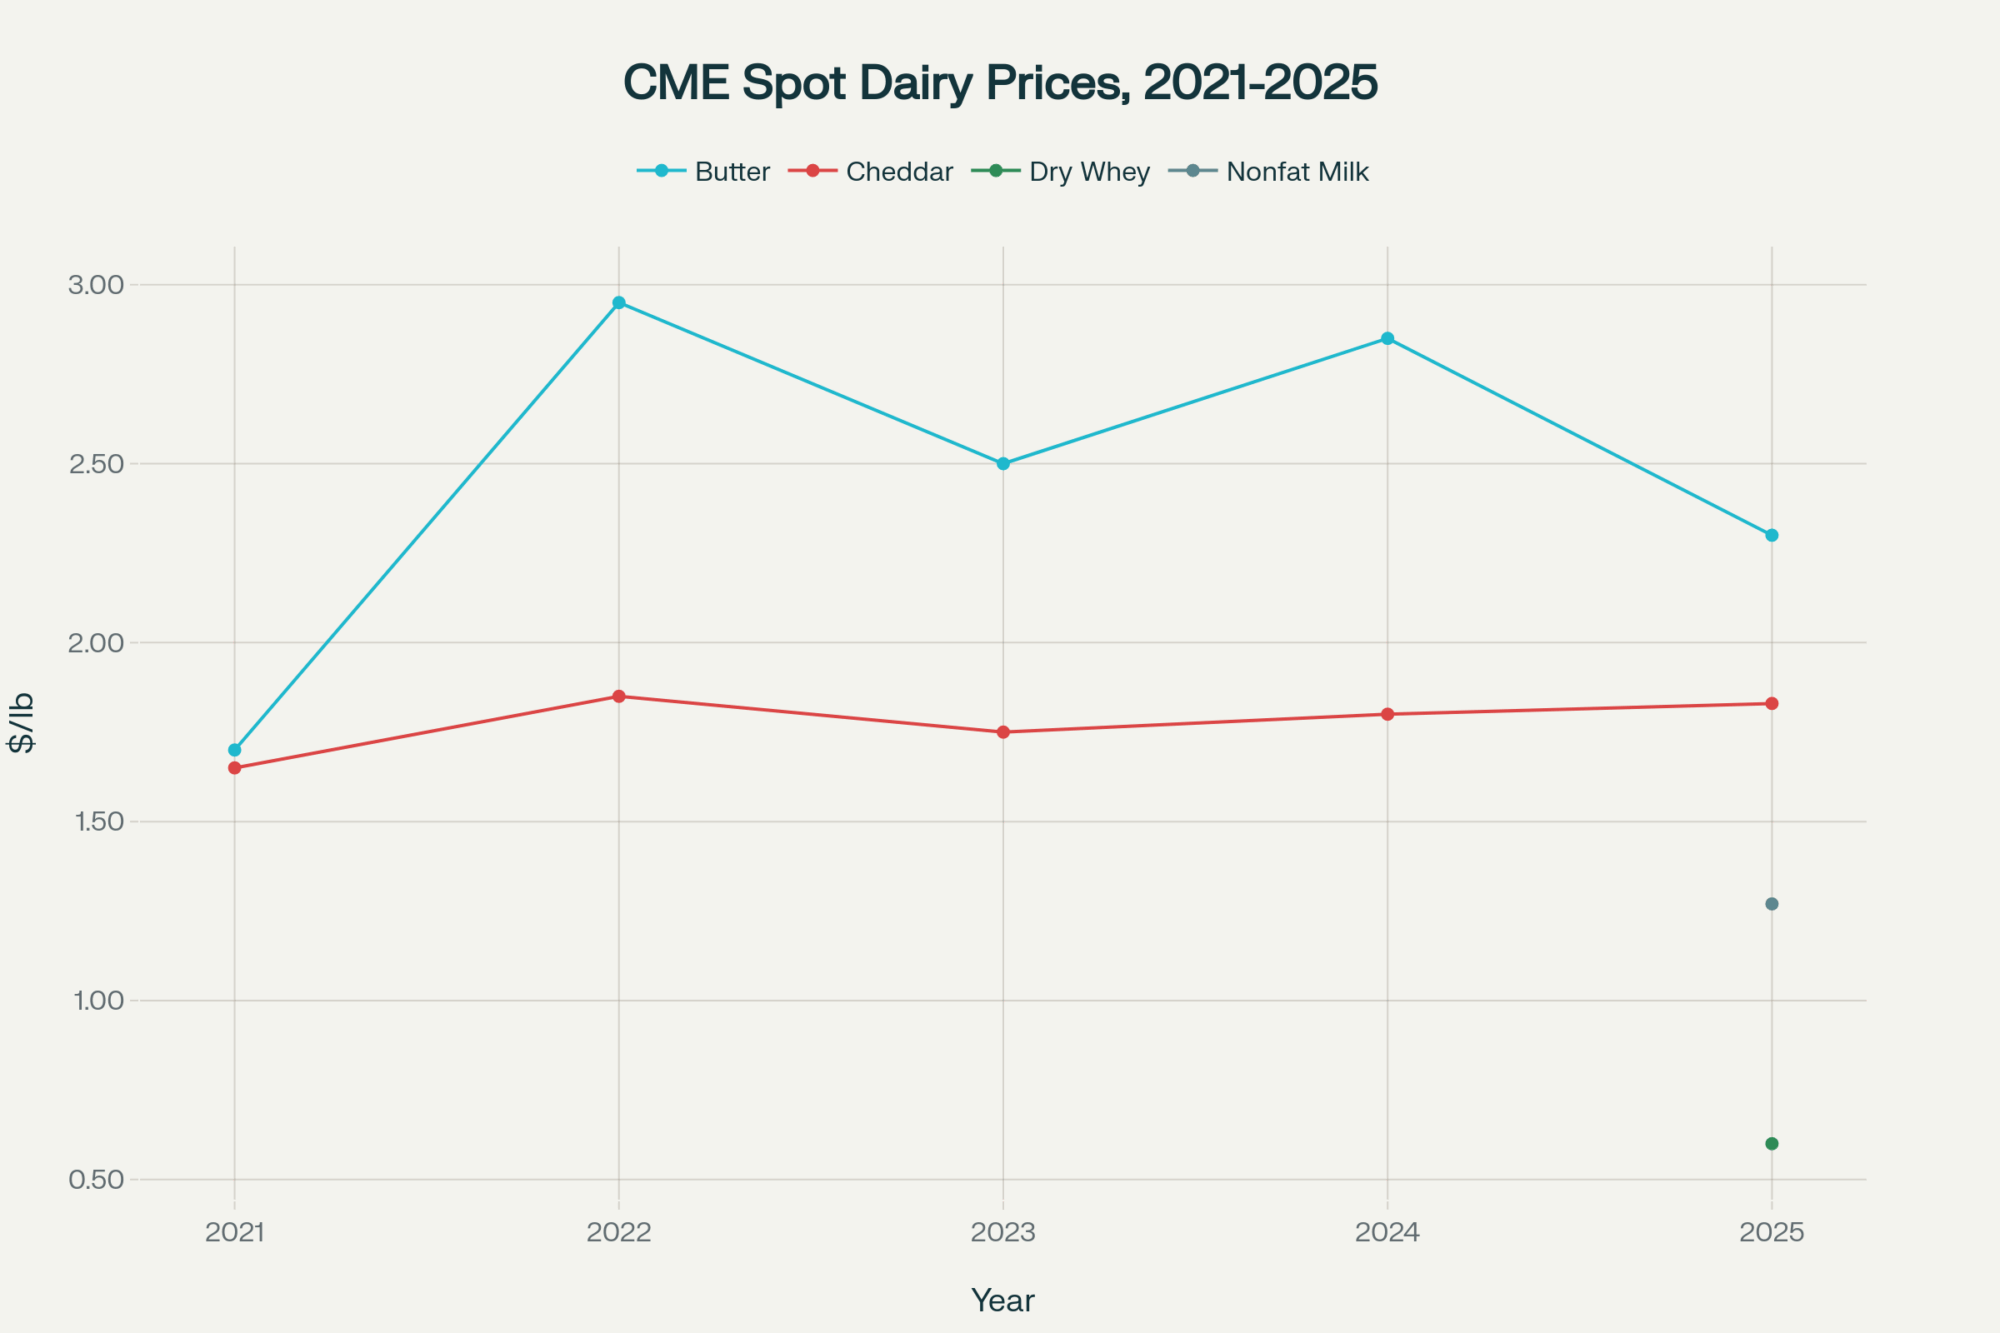
The math behind this is pretty unforgiving. With Class III futures for early 2026 trading in the mid-$15 range on the CME, and FINBIN data showing direct production costs around $16.25-16.43/cwt—with total costs including overhead running $19-21/cwt depending on operation size and efficiency—there’s essentially nothing left for debt service after covering basic costs for many mid-sized operations. While $19-21/cwt is the benchmark, your specific ‘lifestyle cost’ and ‘unpaid labor’ are the silent killers of your DSCR.
Checklist for Your Banker Meeting
Before you sit down for that loan renewal conversation, make sure you can answer these questions:
- [ ] What’s your actual cost of production per hundredweight? (Include everything—labor, family living, depreciation)
- [ ] What’s your current DSCR, and what was it 12 months ago?
- [ ] What percentage of your 2026 production is forward-contracted or covered by DRP?
- [ ] What are your bulk tank components, and how do they compare to premium thresholds?
- [ ] What’s your breeding program producing—volume or components?
- [ ] Do you have a written 12-month action plan addressing margin pressure?
- [ ] What’s your heifer inventory worth at current replacement prices ($3,010/head)?
Walk in with these numbers ready. Your lender will respect the preparation—and you’ll have better leverage in the conversation.

Why Your DMC Margin Doesn’t Match Your Checkbook
One thing that keeps coming up in conversations with producers is the disconnect between what their Dairy Margin Coverage statements show and what their checkbooks tell them. This isn’t a knock on the program—DMC was designed as a baseline safety net, and it’s served that purpose well for many operations. But understanding its limitations matters right now.
Here’s the issue. The DMC formula calculates margin as milk price minus feed costs, with feed costs limited to corn, soybean meal, and alfalfa hay, based on USDA Agricultural Marketing Service prices. Penn State’s extension dairy team has analyzed how much this approach misses in terms of actual operating expenses.
Labor costs generally run $2.00-3.00/cwt, depending on herd size and region—that’s not in the DMC calculation at all. Neither are facility and equipment costs, which add another $1.50-2.00/cwt. Then you’ve got cooperative deductions running maybe fifty cents to a dollar per hundredweight, plus the accumulated weight of utilities, vet bills, breeding costs, supplies… it adds up fast.
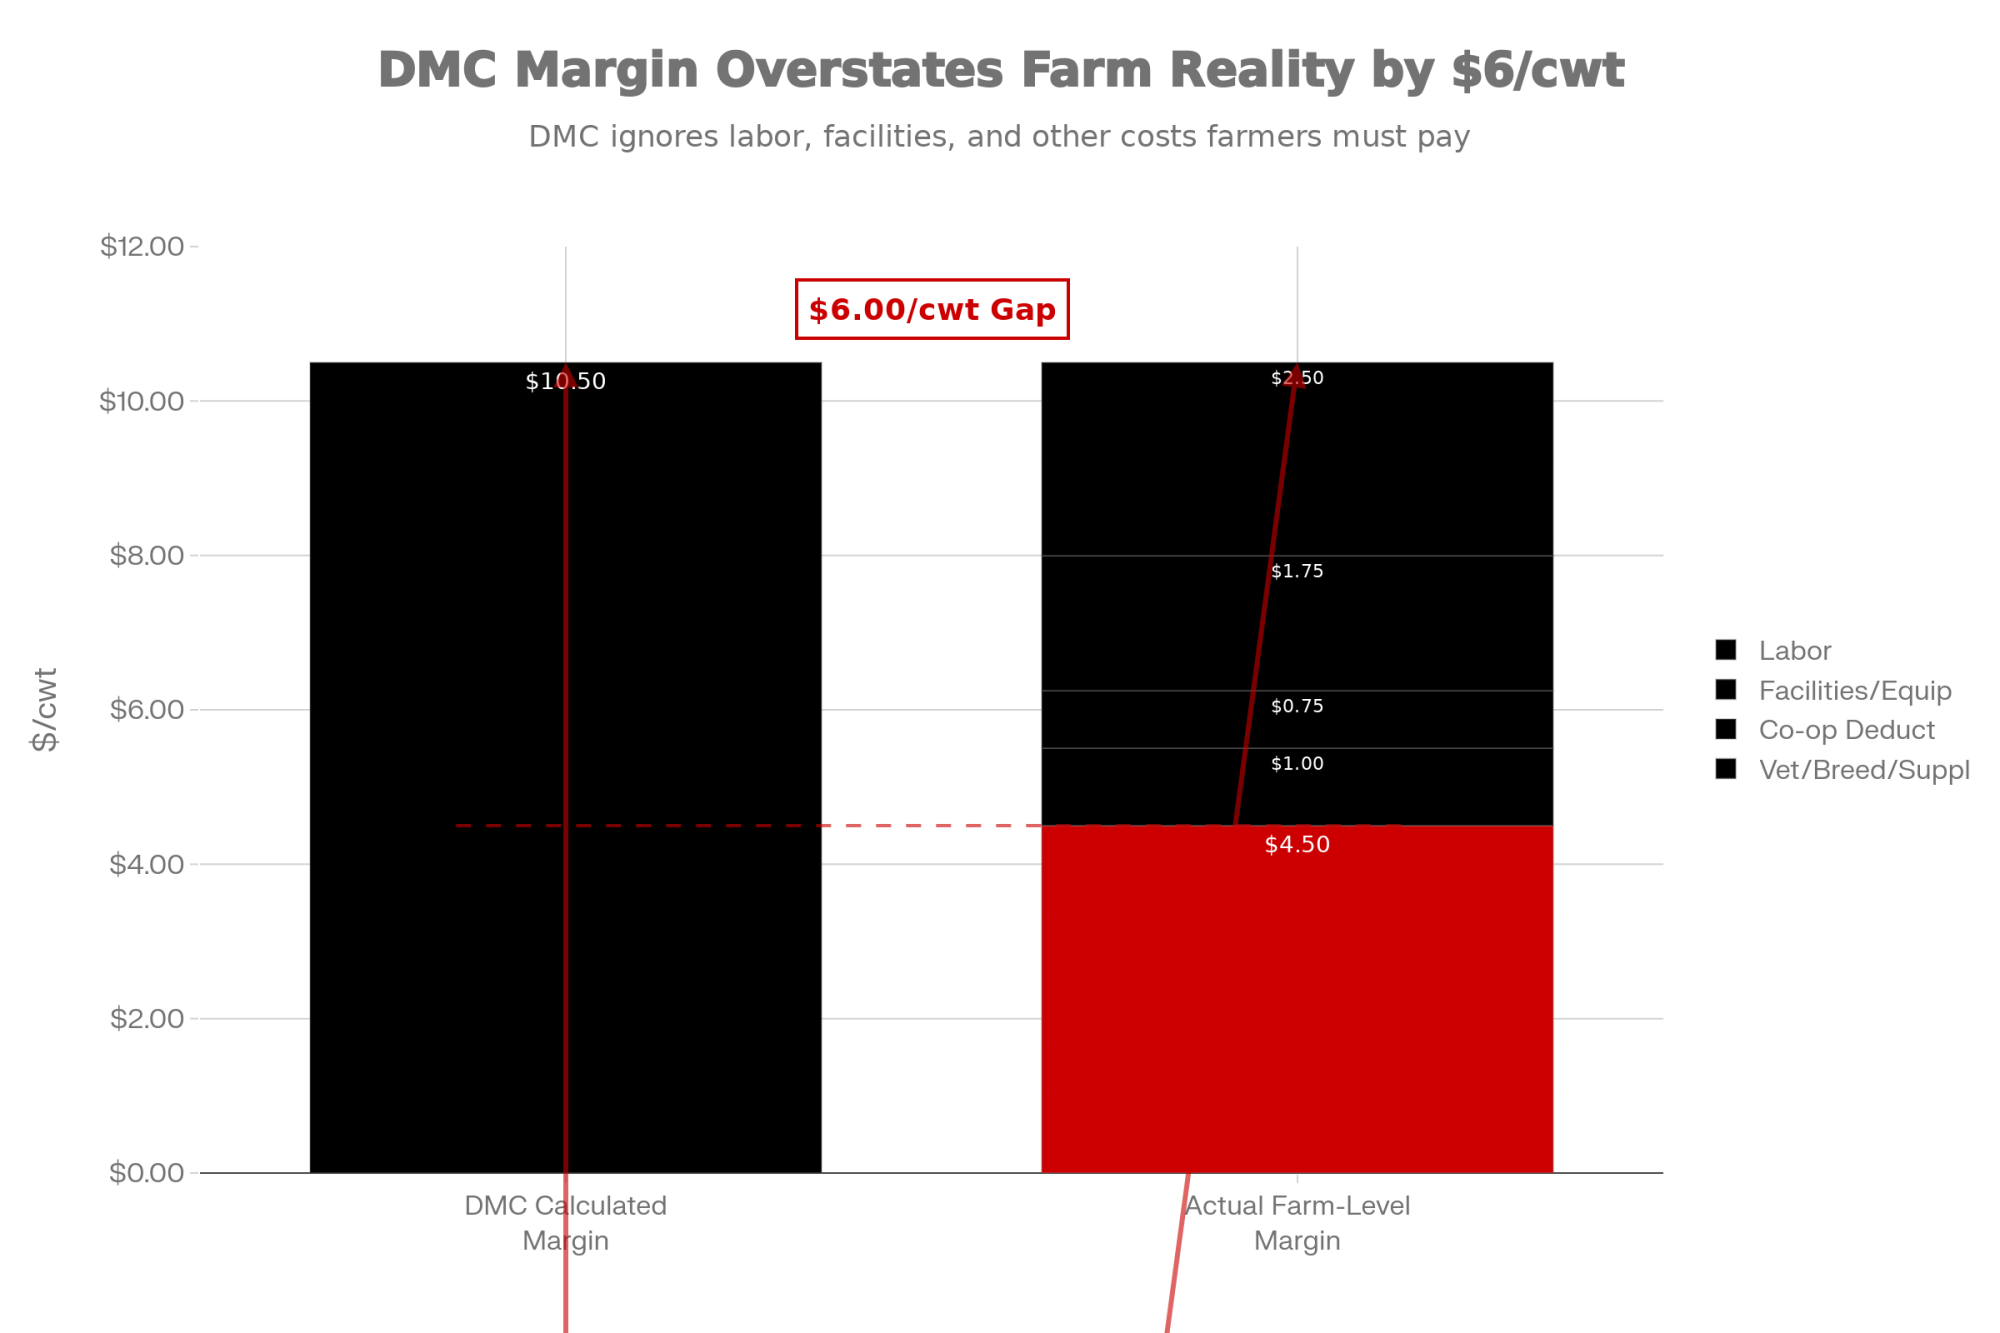
Danny Munch, an economist with the American Farm Bureau Federation, put it plainly in a recent interview: when crop prices are low, the DMC formula using those low prices “makes the milk margin under the DMC program look really high, and none of the triggers over that $9.50 margin are triggered.”
So when recent DMC calculations show margins above $10.50/cwt, the actual farm-level margin after everything might be $3.50-4.50/cwt. That’s the number that determines whether you renew or restructure. And trust me—your banker’s already calculated it. The gap between those two figures explains much of the frustration I’m hearing from producers who feel the safety net isn’t quite reaching them.
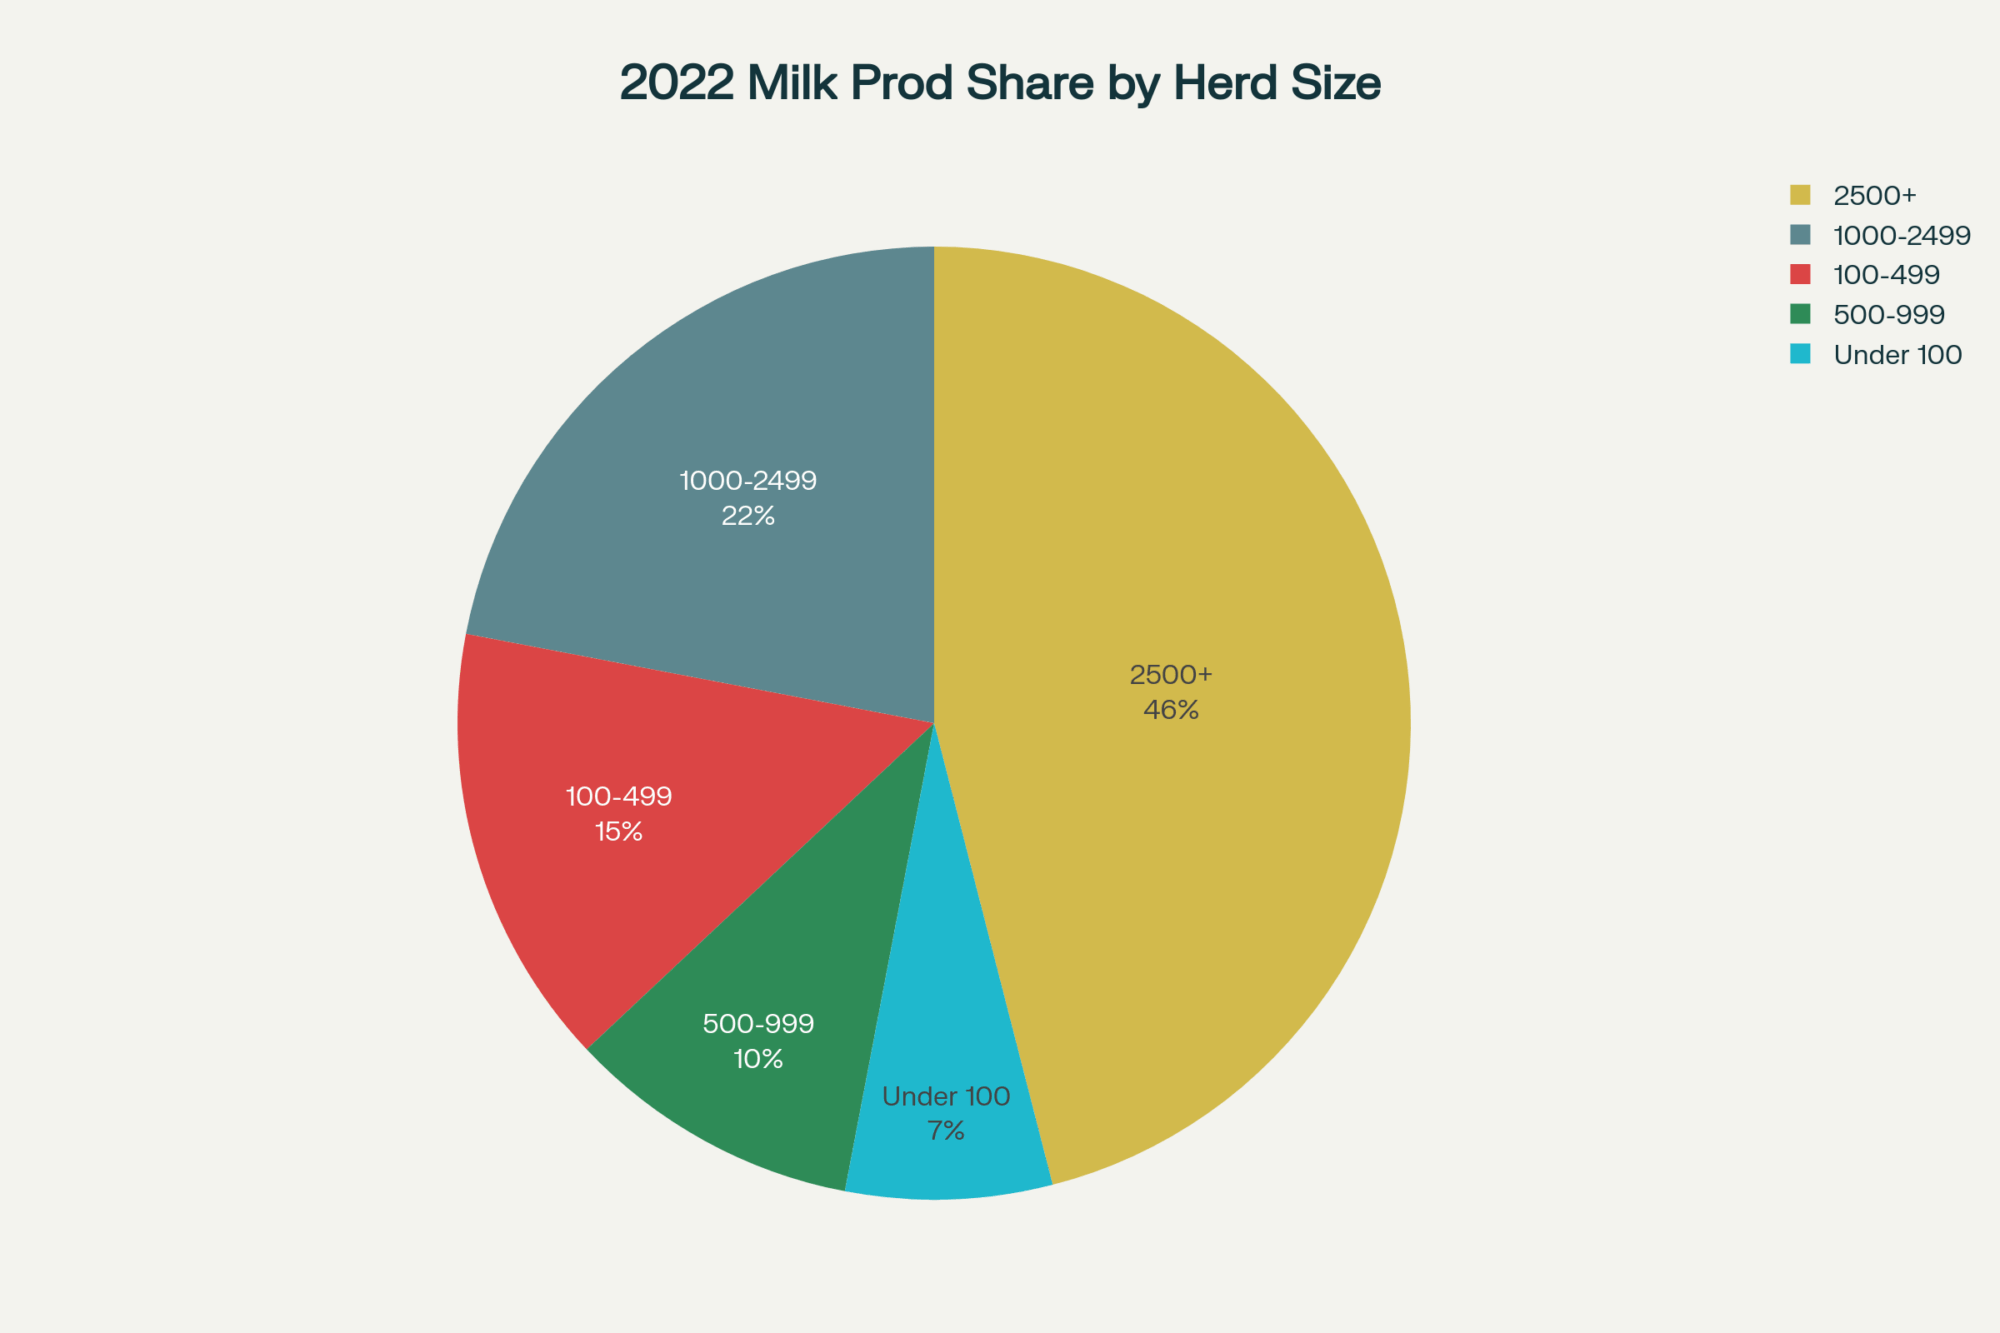
The Two-Track Dairy Industry: Where Does Your Operation Fit?
Here’s something I think we need to talk about directly: we’re watching more of a two-track industry develop, and which track you end up on will largely be shaped by decisions made in the next 12-18 months.
The International Dairy Foods Association reported in October that processors have invested a record $11 billion in new and expanded manufacturing capacity across 19 states—more than 50 individual building projects between 2025 and early 2028. That’s an enormous bet on American dairy’s future, and it signals real confidence in the sector’s long-term prospects.
But here’s what I find myself thinking about: much of this new capacity is being tied directly to large, consistent milk suppliers. In many cases, those are very large dairies with direct supply relationships. Now, cooperatives remain major owners and partners in processing—that’s important to note—but the pattern many of us see emerging is one in which the largest operations have greater direct access to premium outlets.
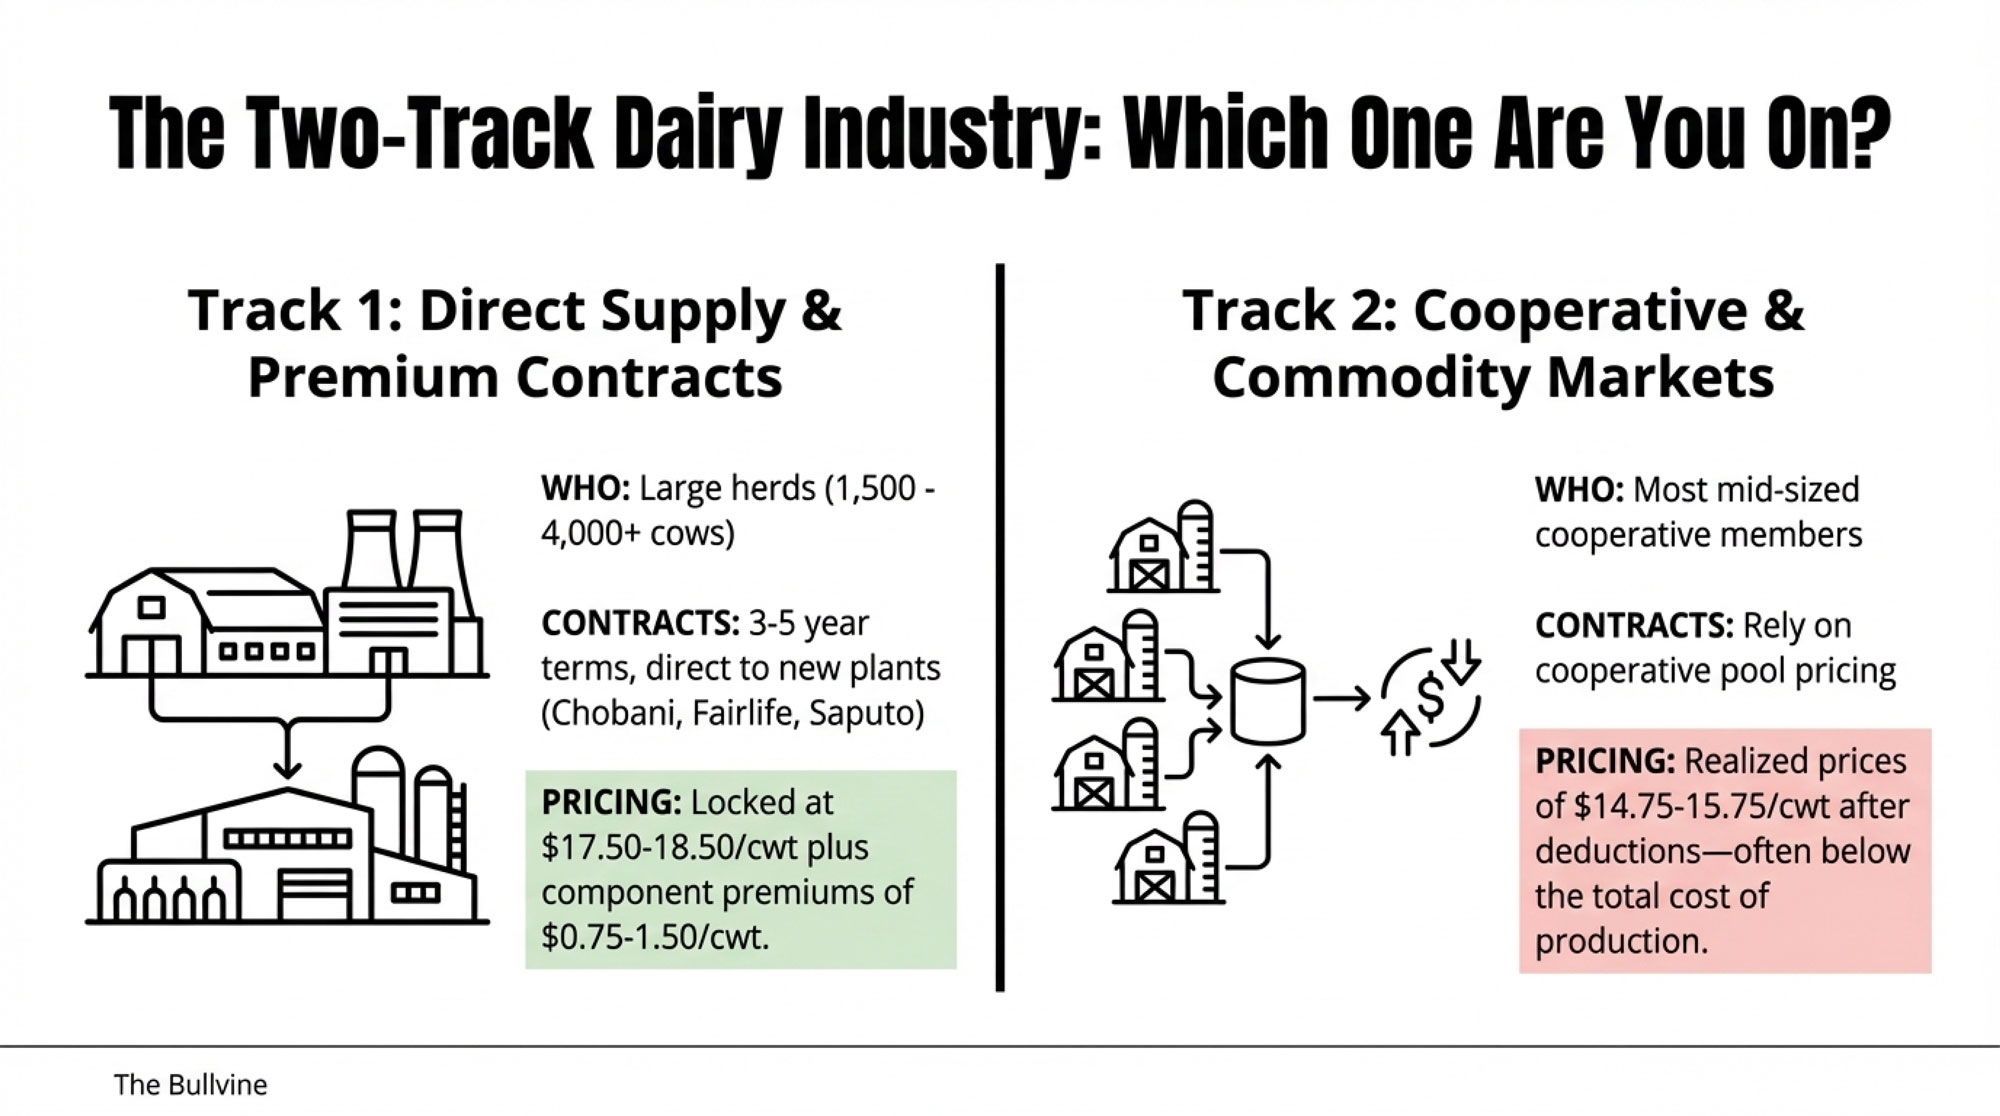
On one track, you’ve got large operations, typically running 1,500 to 4,000-plus cows, positioning themselves with direct supply contracts to these new facilities. Chobani broke ground in April 2025 on a $1.2 billion, 1.4 million-square-foot plant in Rome, New York. Coca-Cola announced a $650 million Fairlife facility in Webster back in 2023. Saputo’s expansion in Barron, Wisconsin, continues to add capacity. These processors need consistent, high-component milk in large volumes, and they’re signing multi-year agreements with operations that can deliver it.
What do those contracts look like? Based on conversations with cooperative leaders and industry contacts, we’re often seeing locked pricing in the $17.50-18.50/cwt range, with component premiums of $0.75-1.50/cwt for elevated butterfat and protein, plus quality bonuses for meeting specifications. Three- to five-year terms that provide real planning certainty.
The second track is everyone else—and that’s where most cooperative members find themselves. The remaining operations selling through cooperatives or spot markets at whatever price commodity trading sets. For many of these farms, realized prices of $14.75-15.75/cwt after deductions fall below the total cost of production.
| Contract Feature | Track 1: Large Operations with Direct Processor Supply | Track 2: Mid-Sized Operations via Cooperative Commodity Markets |
| Typical Herd Size | 1,500 – 4,000+ cows | 200 – 700 cows |
| Base Price ($/cwt) | $17.50 – $18.50 (locked multi-year) | $14.75 – $15.75 (commodity-linked, variable) |
| Component Premiums | $0.75 – $1.50/cwt for >4.0% butterfat, >3.3% protein | $0.15 – $0.40/cwt (varies widely by co-op) |
| Contract Term | 3 – 5 years with pricing certainty | Month-to-month or annual; minimal forward visibility |
| Quality Bonuses | $0.25 – $0.50/cwt for meeting specifications (SCC, bacteria) | Included in base or minimal additional |
| Realized Price After Deductions | $18.50 – $20.25/cwt | $14.75 – $15.75/cwt |
| Processor Relationship | Direct supply agreements with Chobani, Fairlife, Saputo, etc. | Cooperative pools with multiple commodity buyers |
| Volume Requirement | High; consistent large volume required | Flexible; but no guaranteed premium outlet access |
Now, I’m not saying cooperatives are failing their members—many co-ops have invested heavily in component-focused processing and are building strong relationships with premium buyers. But I am saying that some cooperatives have been more aggressive than others in positioning for this new reality, and their members are starting to see different outcomes as a result.
We explored some of these dynamics in our recent piece on the Lactalis 270-farm cuts—and the pattern holds: the dairies surviving aren’t necessarily the biggest, but they’re the ones who positioned earliest
What Cooperative Members Should Be Asking
For the majority of mid-sized operations shipping through cooperatives, the important question is this: What is your cooperative doing to position members for premium markets?
The good news is that some cooperatives have made significant moves. Land O’Lakes has invested substantially in butter capacity and component-focused products. Dairy Farmers of America has expanded its cheese processing operations across multiple regions. Several regional cooperatives in the Upper Midwest have built relationships with specialty cheese manufacturers that pay meaningful component premiums to their members. These are real examples of cooperatives adapting to where value is heading.
But not every cooperative has moved at the same pace. Edge Dairy Farmer Cooperative has been vocal about the need for federal milk pricing reform, and NMPF continues working on federal order modernization. The debate about how cooperatives should adapt is very much alive in the industry right now.
Questions worth raising at your next meeting or in conversations with your field rep:
- Component premiums: Does your cooperative offer meaningful premiums for high-component milk, or is pricing still primarily volume-based? What are the actual qualification thresholds, and how do they compare to what direct-supply operations are reportedly getting?
- Processing investments: Has your cooperative invested in component-focused processing capacity, or is it primarily in fluid milk and commodity manufacturing?
- Premium program access: What percentage of member milk is currently going to premium outlets versus commodity markets? Is that number increasing or decreasing?
- Forward pricing options: What risk management tools does the cooperative offer, and how do they compare to Dairy Revenue Protection or other alternatives?
- Equity timeline: For operations considering exit, what’s the realistic timeline and process for equity redemption—not just the official policy, but what’s actually happening?
The producers I’ve talked with who feel most confident about their cooperative relationship are the ones asking these questions in board meetings, not just accepting the quarterly newsletter. If your cooperative leadership can’t give you straight answers, that’s worth knowing.
47-Year Heifer Shortage: Hidden Leverage for Mid-Sized Dairies
Here’s something that doesn’t get enough attention in these financial discussions: we’re looking at replacement heifer numbers we haven’t seen in nearly half a century.
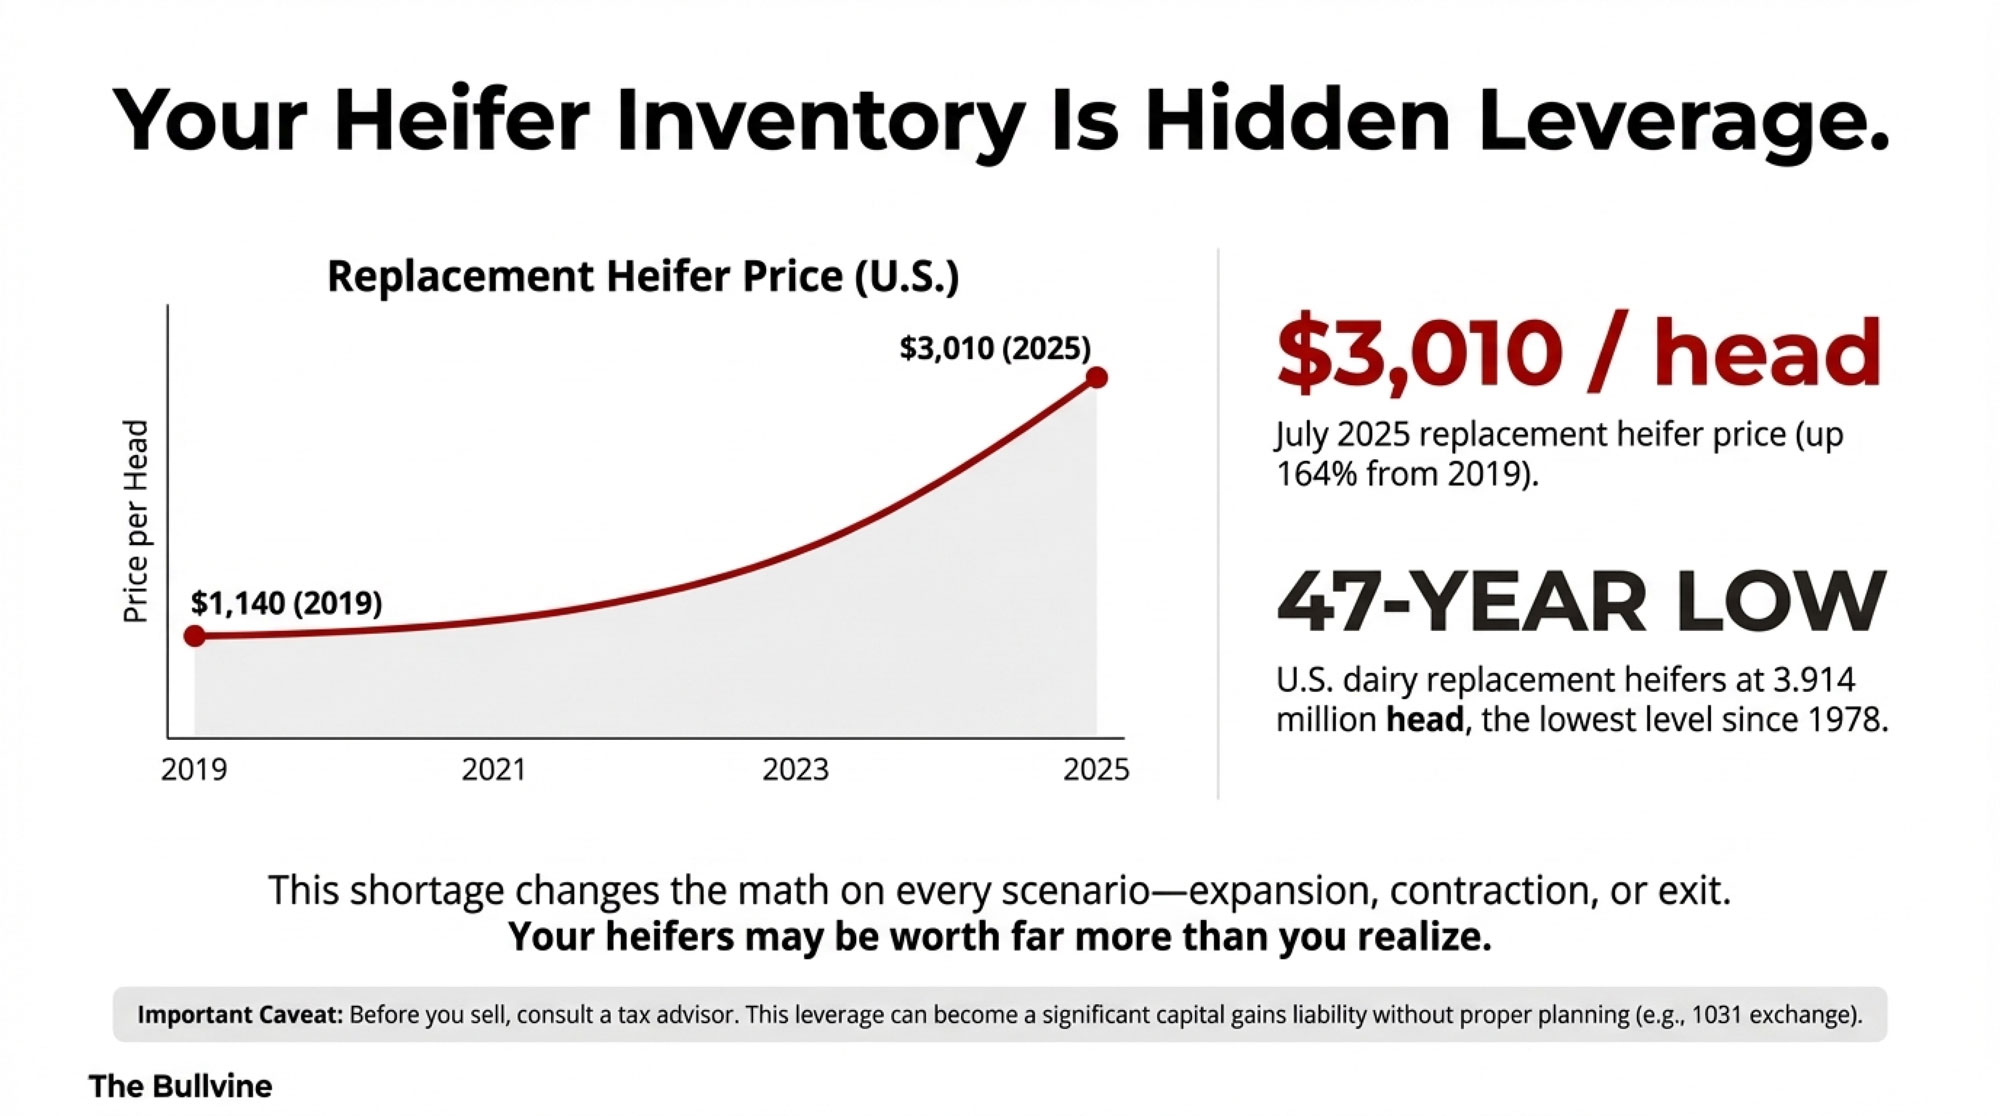
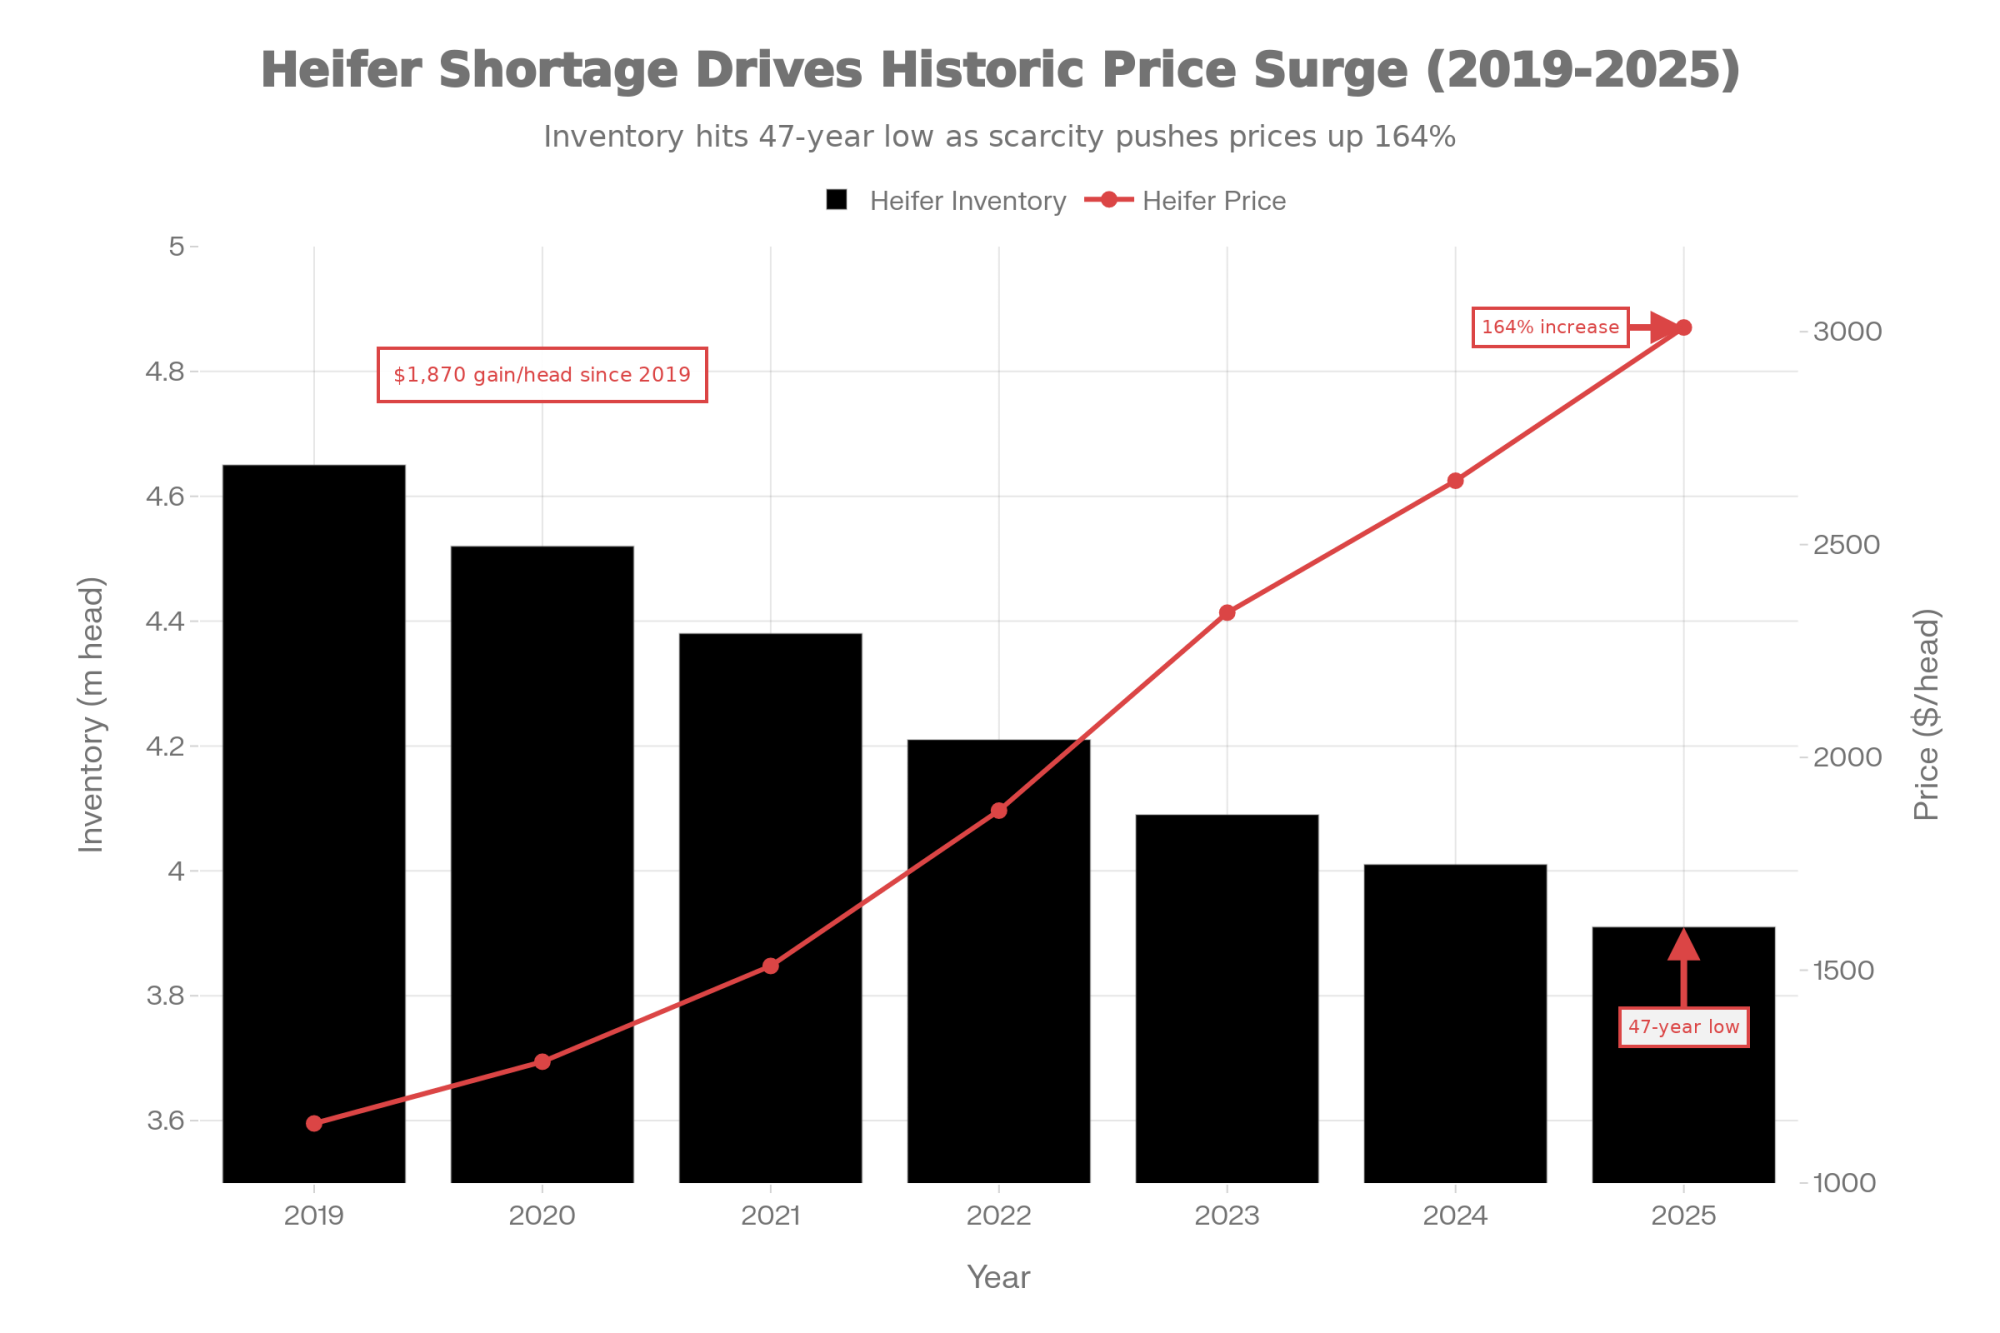
USDA’s January 2025 Cattle report puts dairy replacement heifers at 3.914 million head—the lowest level since 1978. That’s a 47-year low, and this matters quite a bit if you’re thinking about herd management decisions right now.
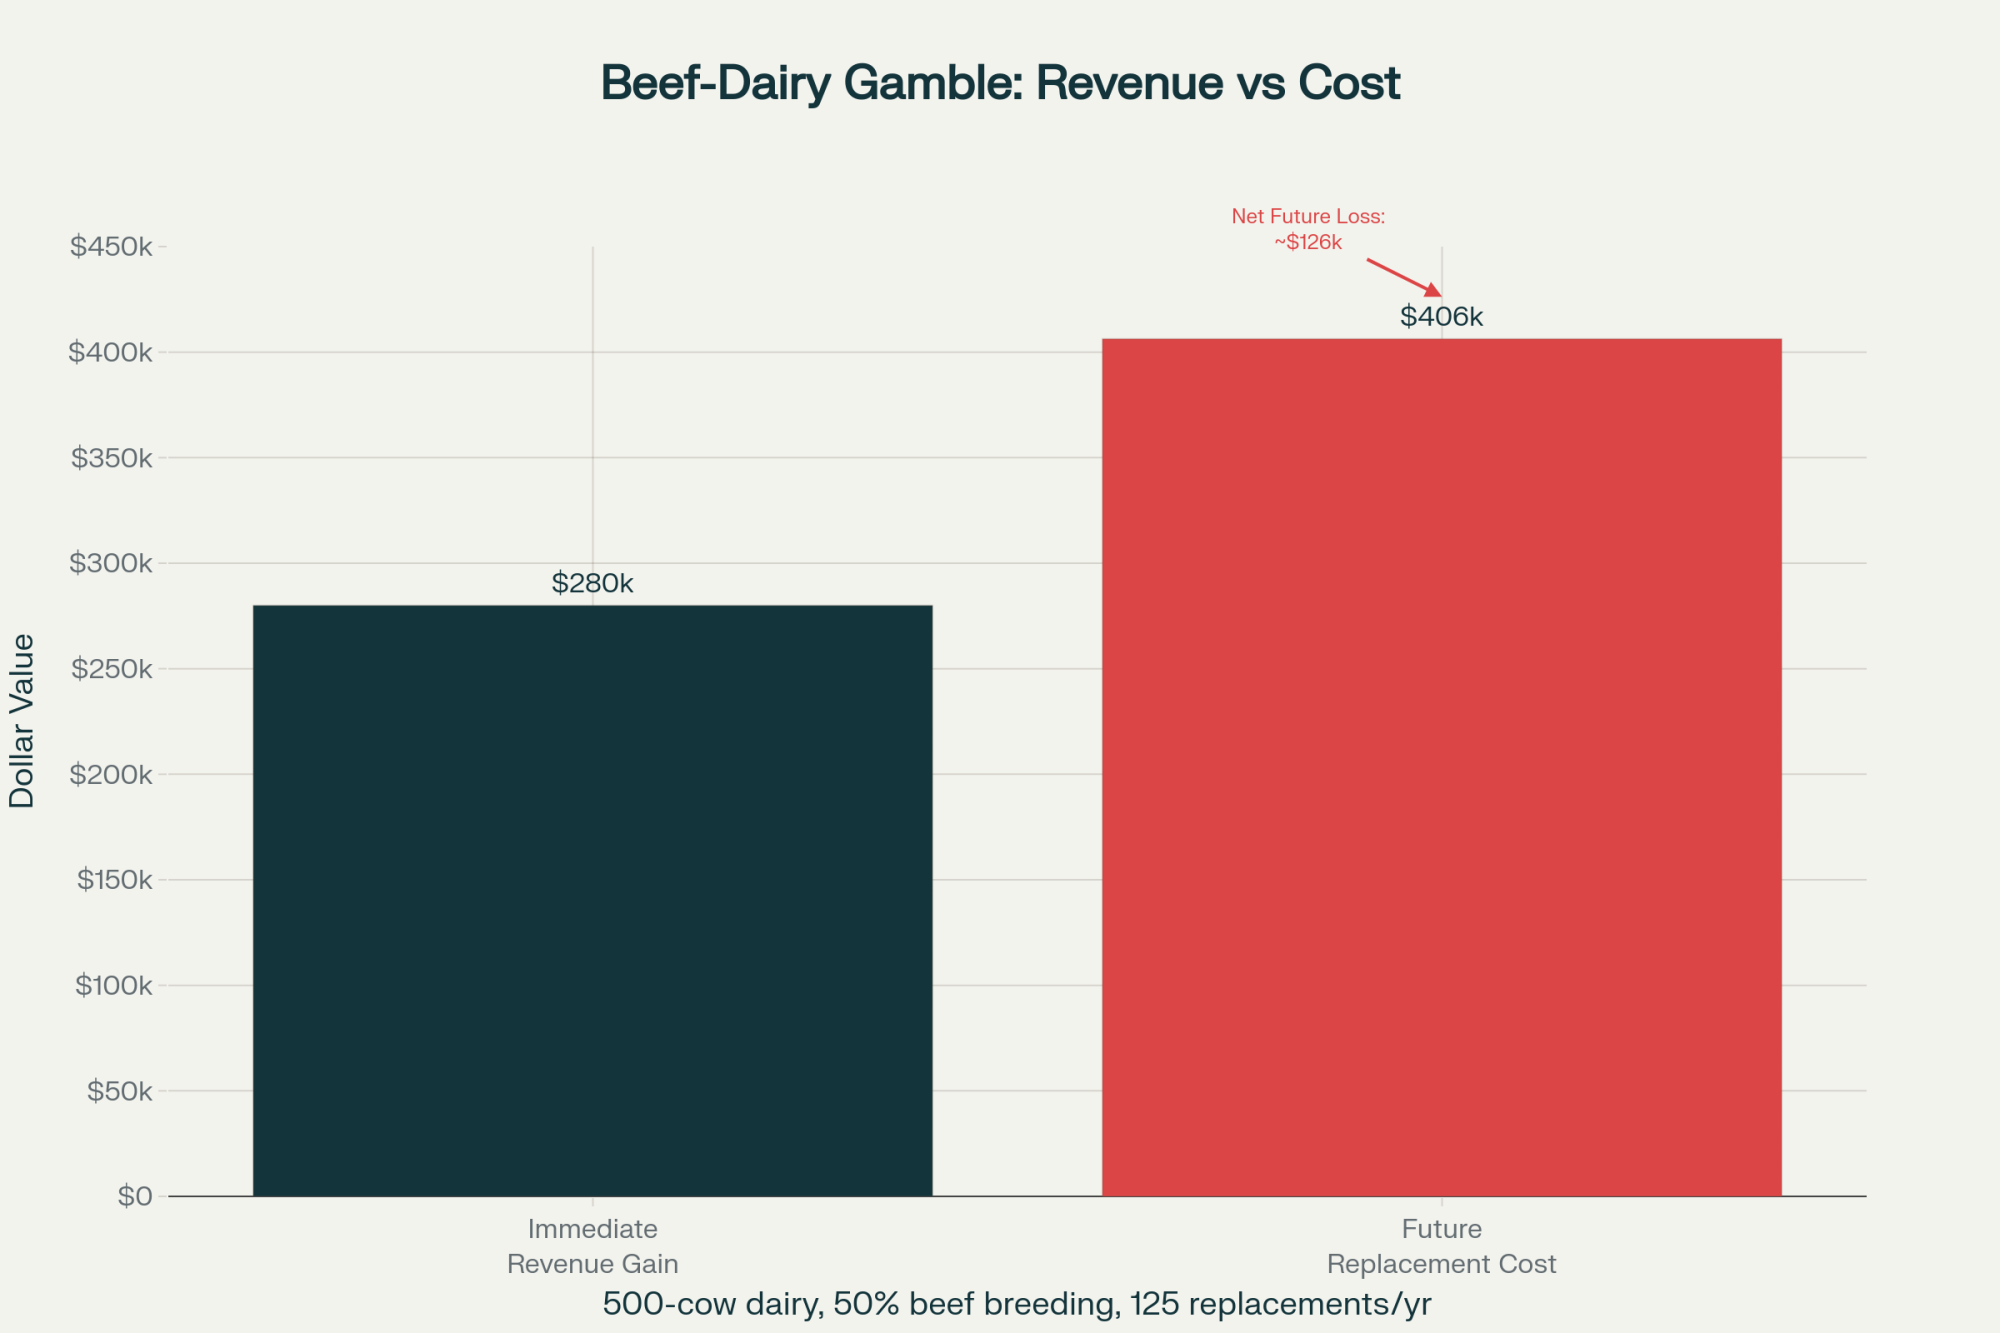
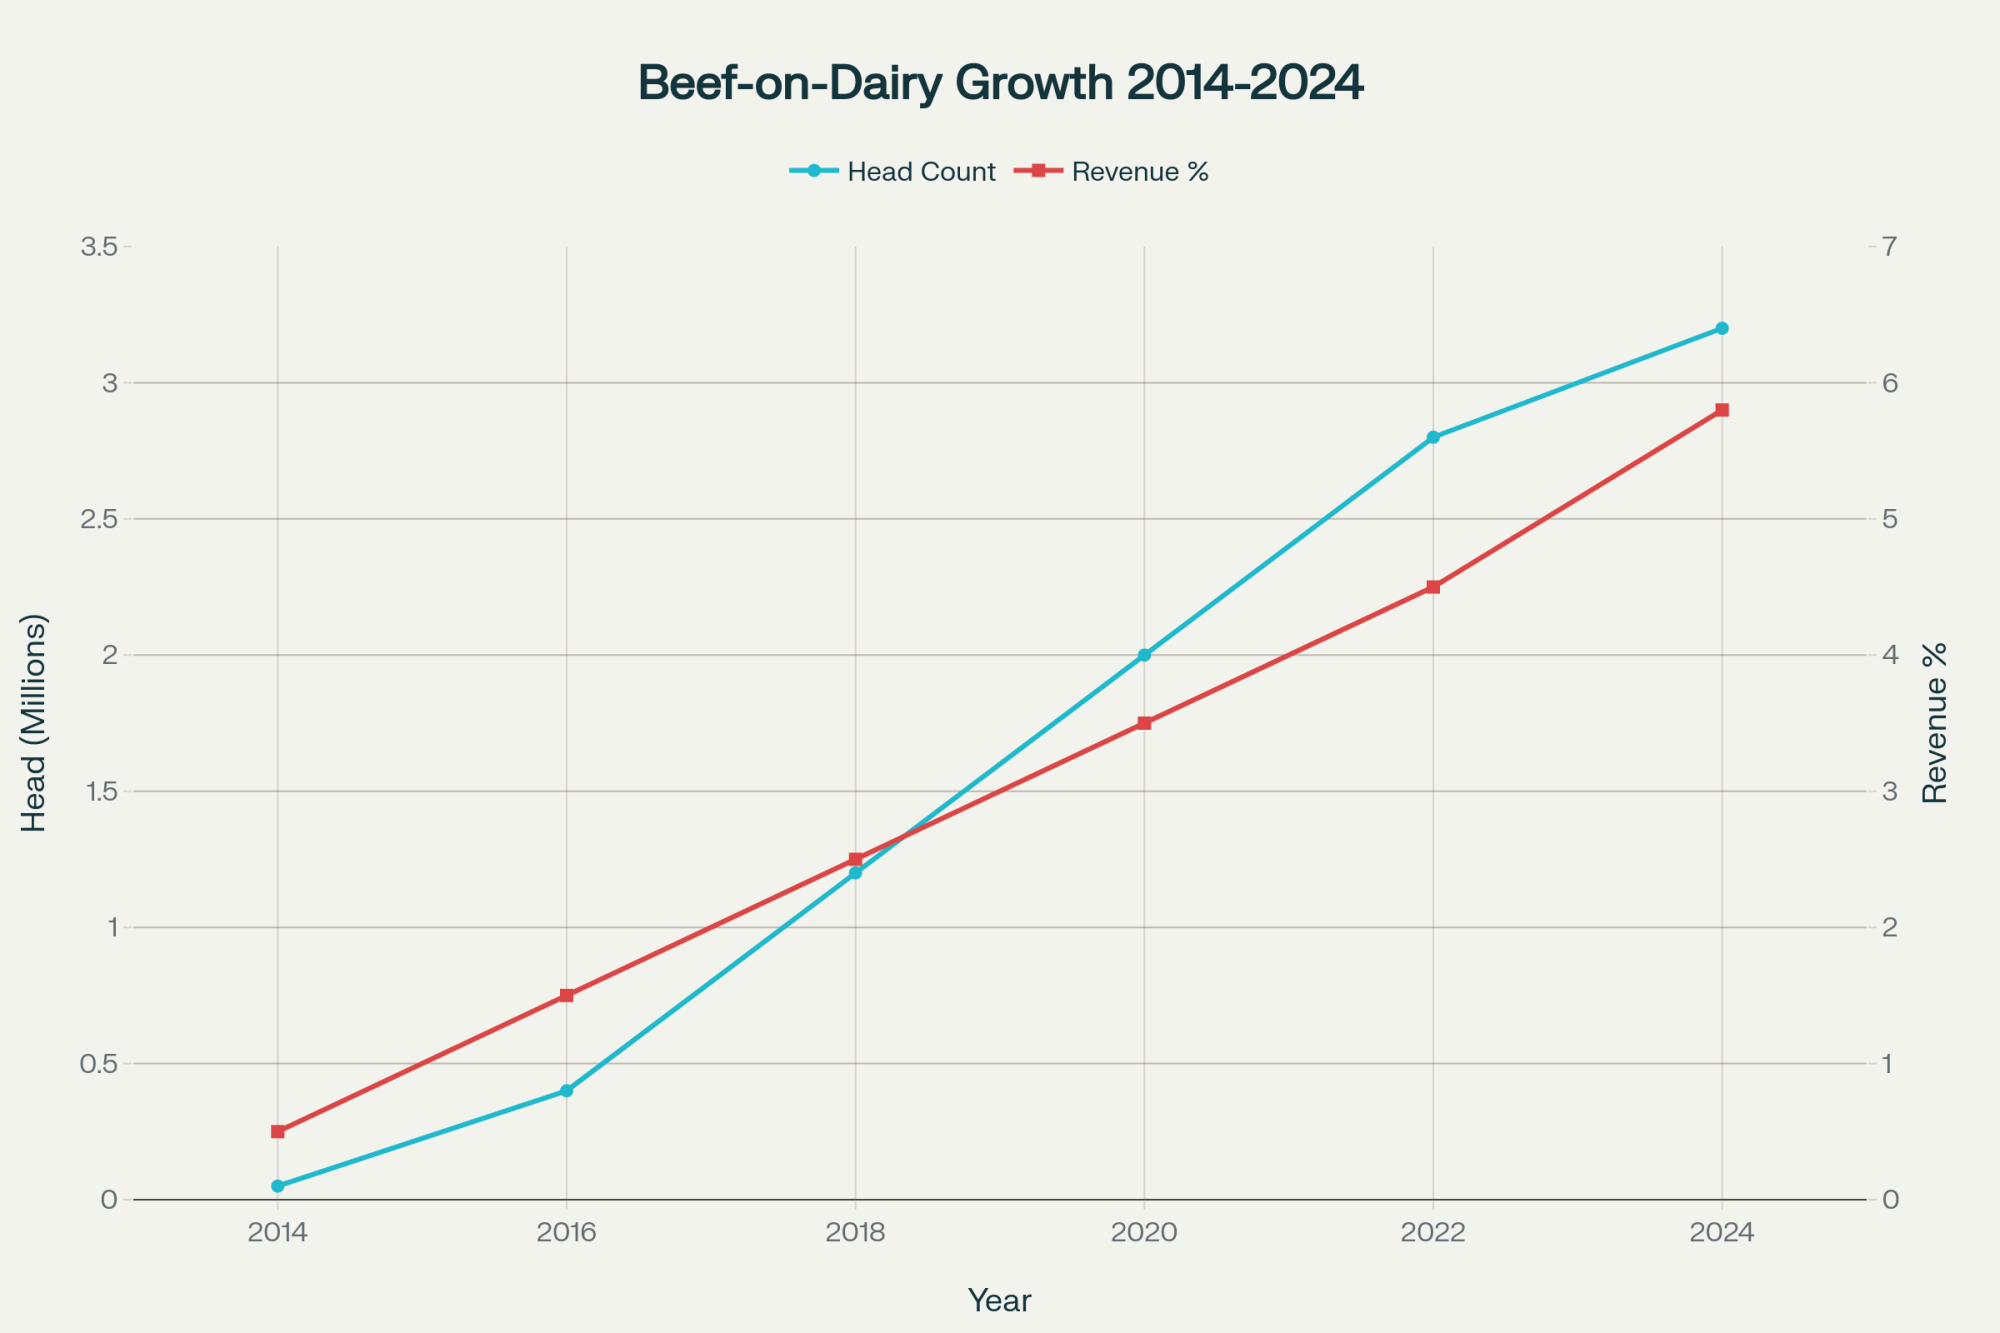
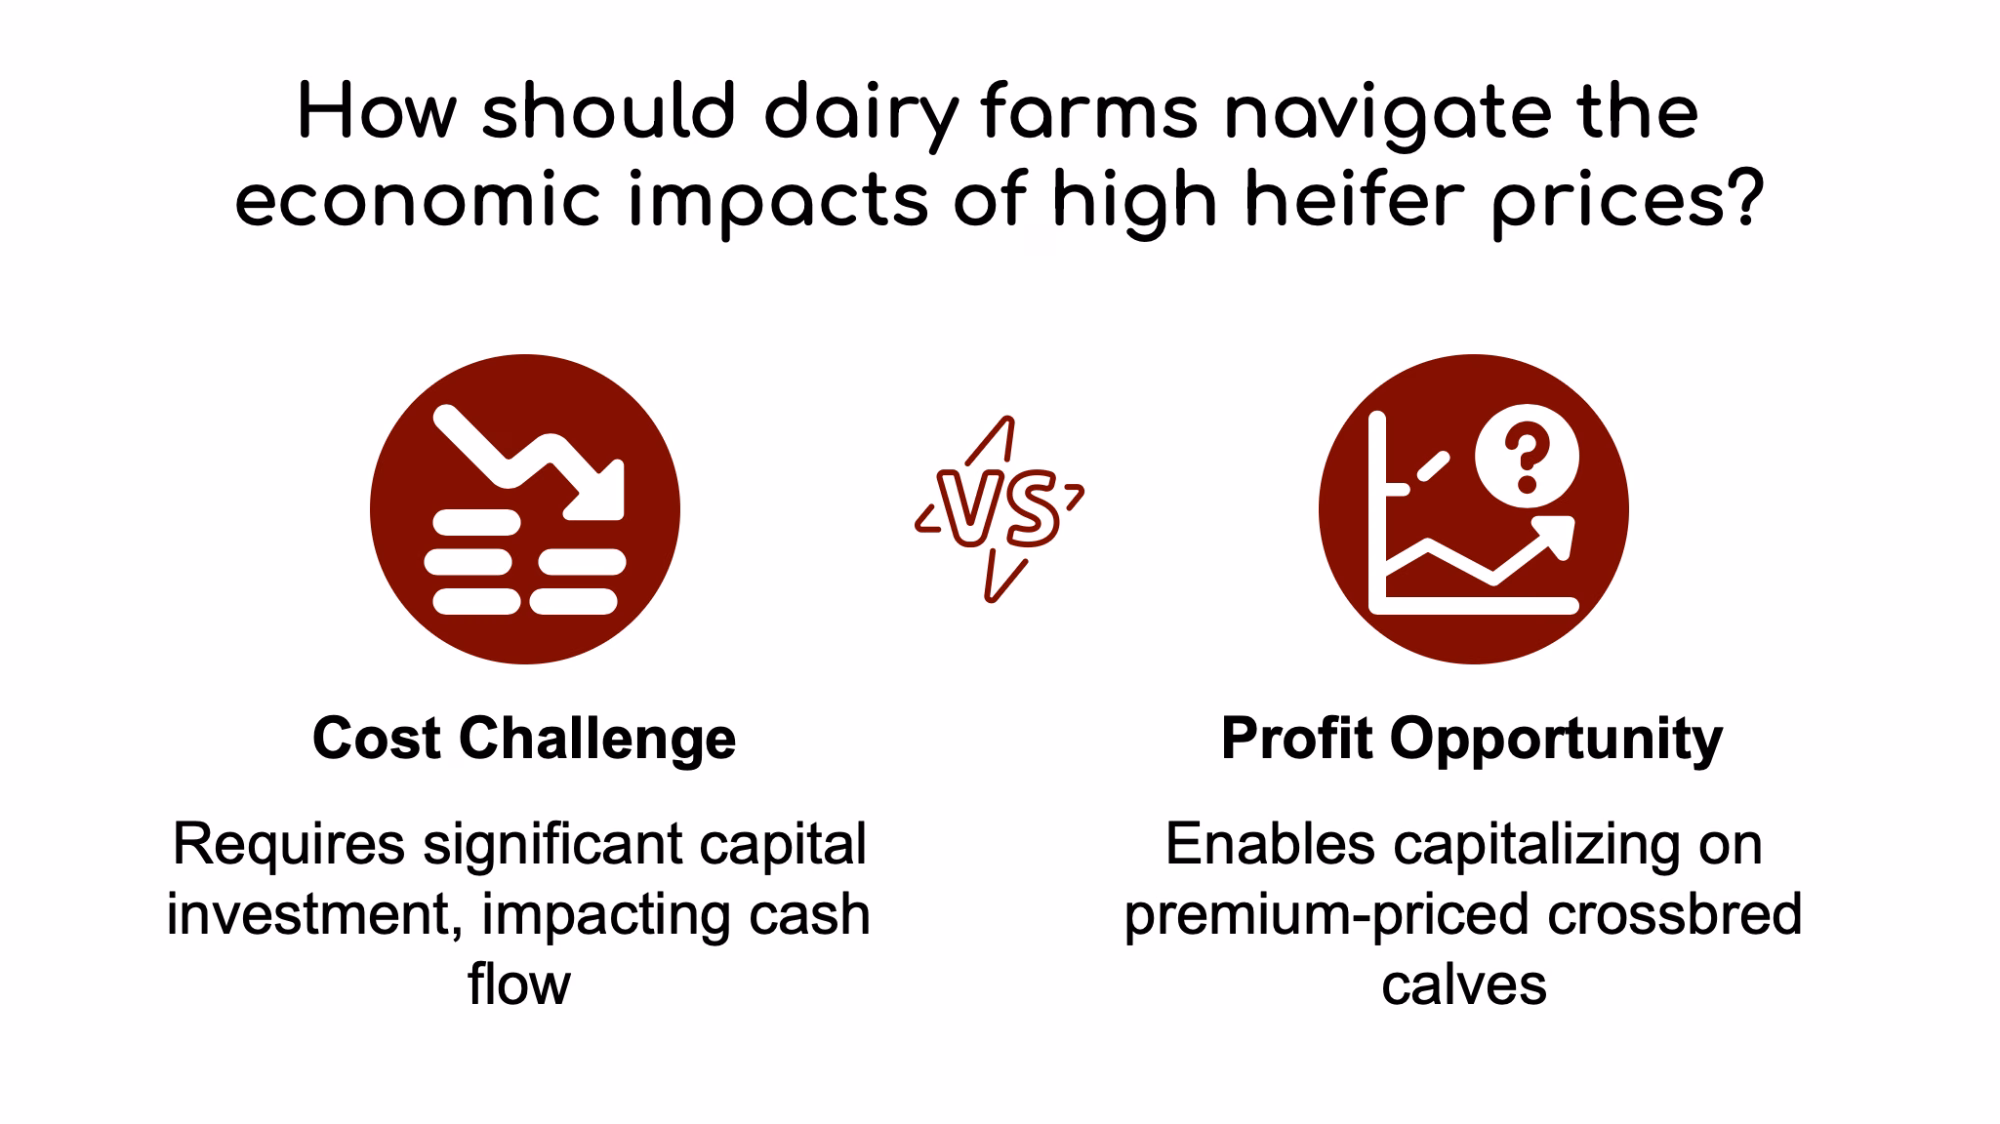
CoBank’s August 2025 analysis projects heifer inventories will shrink by an estimated 800,000 head over the next two years before beginning to rebound in 2027. The primary driver? Beef-on-dairy breeding trends that, you probably know this already, have fundamentally changed how many operations approach their breeding programs. The economics made sense when beef-cross calves were commanding substantial premiums—and for many operations, they still do. But the cumulative effect on replacement availability is now showing up in a meaningful way.
What this means for you: dairy replacement heifer prices have soared to historic levels, reaching $3,010 per head in July 2025—a 164% jump from the April 2019 figure of $1,140. I spoke with a Northeast producer last month who’s postponing an expansion specifically because heifer acquisition costs have thrown off his entire capital plan. For operations considering growth, that’s a significant barrier. For those considering exit strategies… well, your heifer inventory may be worth considerably more than you realize. Before you sell into this historic heifer market, consult your tax advisor; that ‘hidden leverage’ can quickly turn into a significant capital gains liability if not handled via a 1031 exchange or debt retirement strategy.
It’s worth noting that this heifer shortage creates a natural floor under herd liquidation decisions. Even if a producer decides to exit, the replacement economics make it attractive for other operations to absorb those animals rather than let them go to beef markets. That’s worth factoring into your decision.

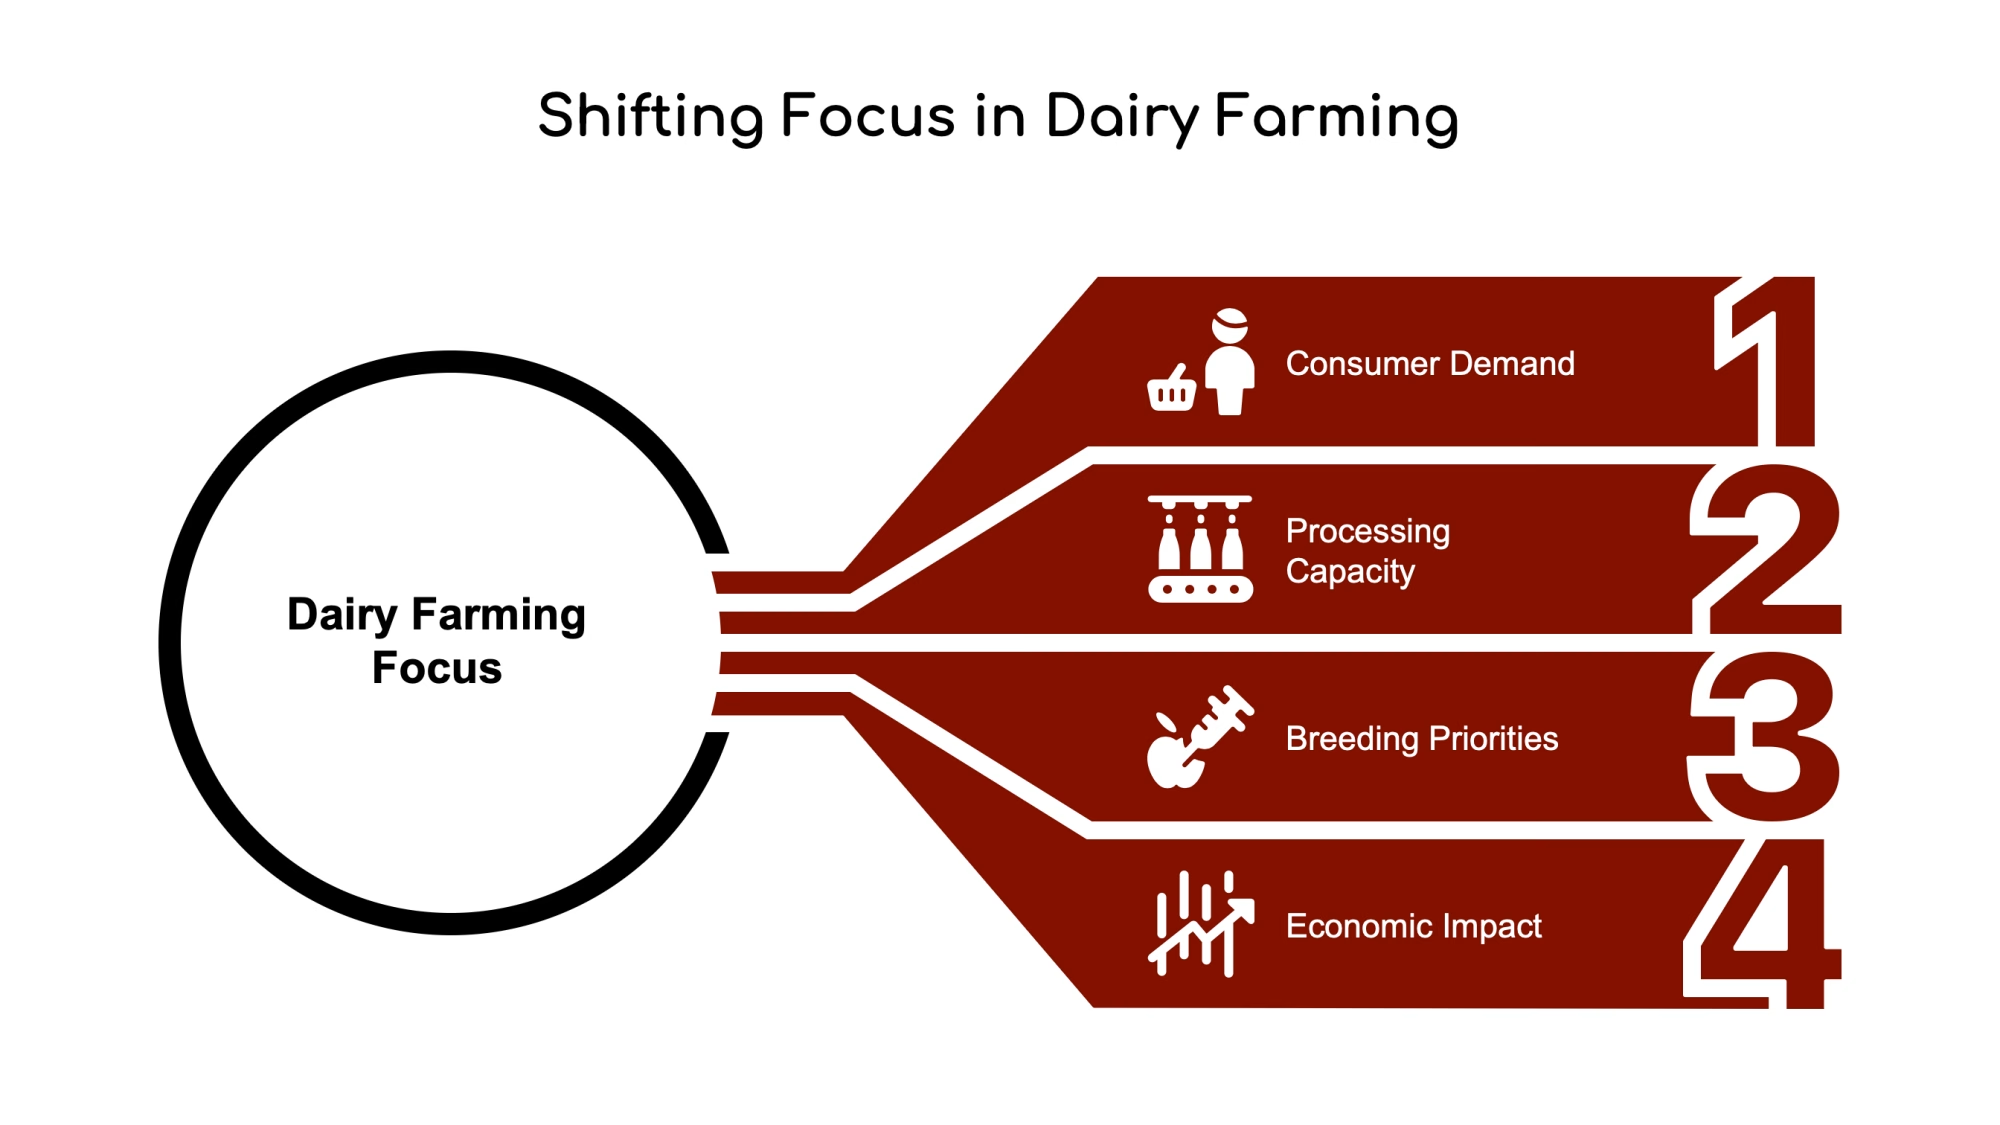
The Genetics Game Has Changed—Are You Playing the Right One?
This is where I want to get specific, because genetics is where mid-sized operations can actually compete—if they’re making the right breeding decisions.
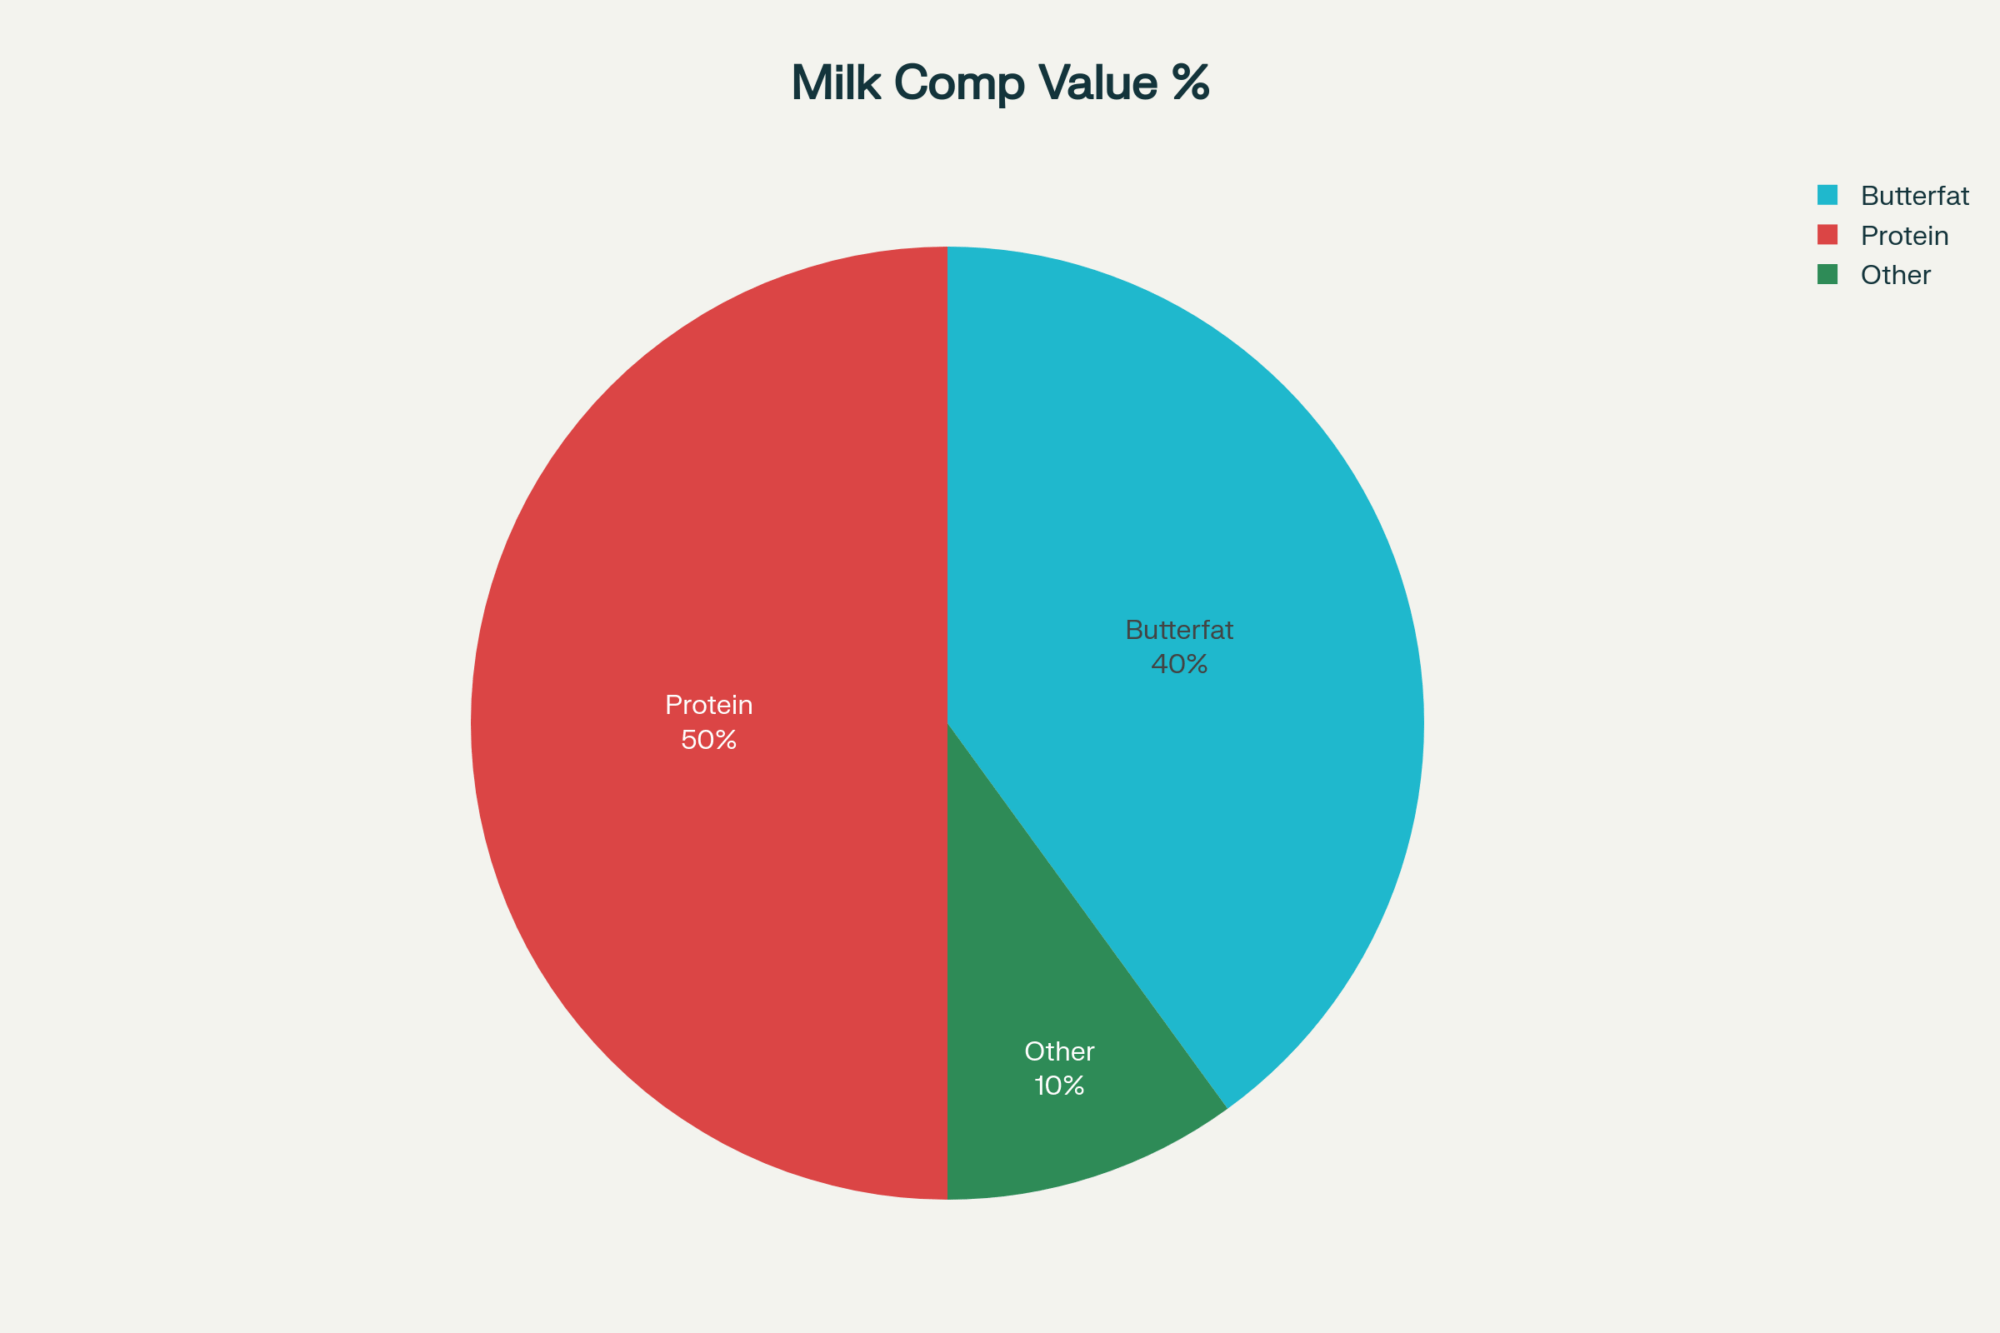
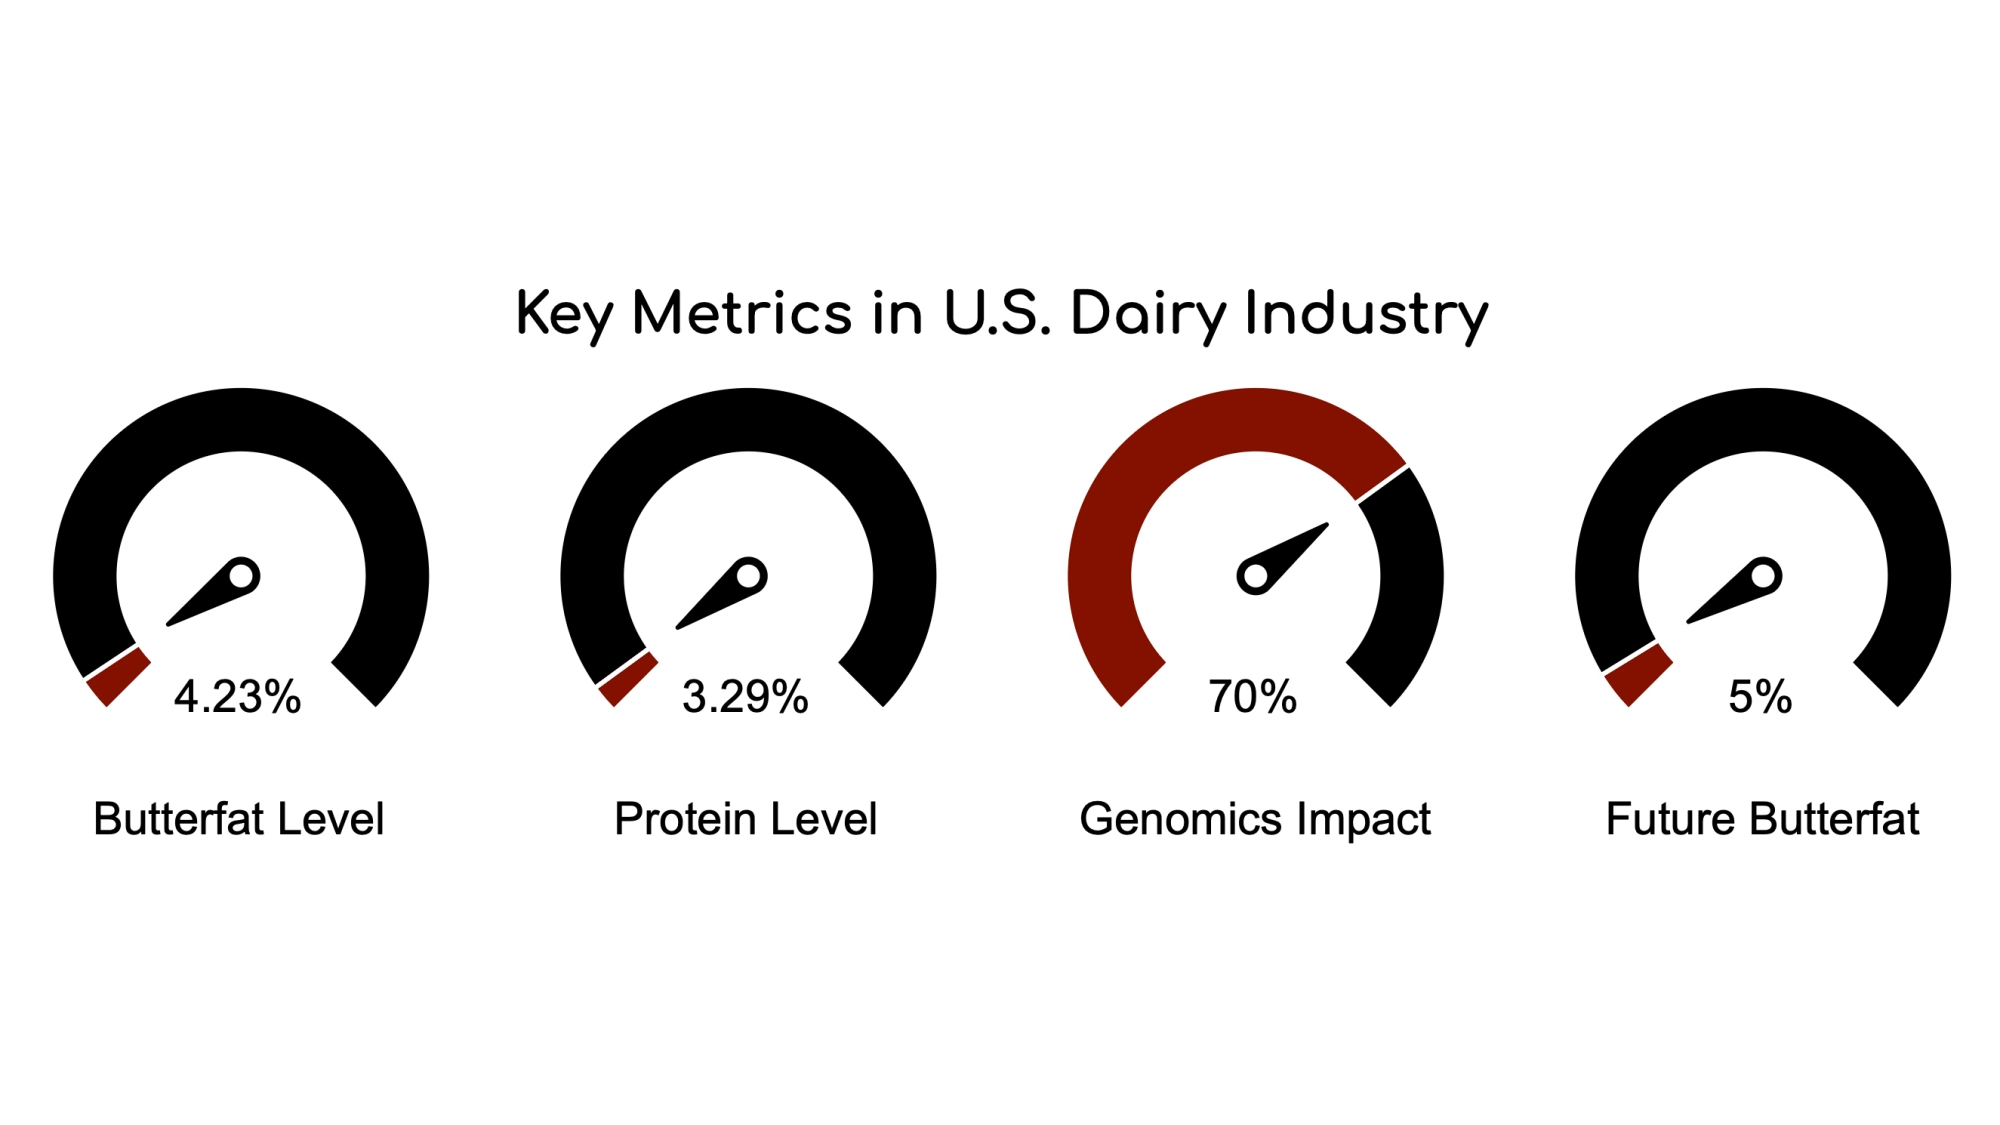
The Council on Dairy Cattle Breeding implemented major changes to the Net Merit index in April 2025, and the shifts tell you exactly where the industry is heading. According to USDA-ARS documentation on the 2025 revision, the emphasis on butterfat increased from 27% to nearly 32%, while protein emphasis dropped from about 20% to 13%. Feed efficiency emphasis jumped significantly, with Feed Saved moving from 12% to nearly 18% of the index.
Here’s what that means in plain language: bulls that looked like the right choice five years ago may not match where the money is today.
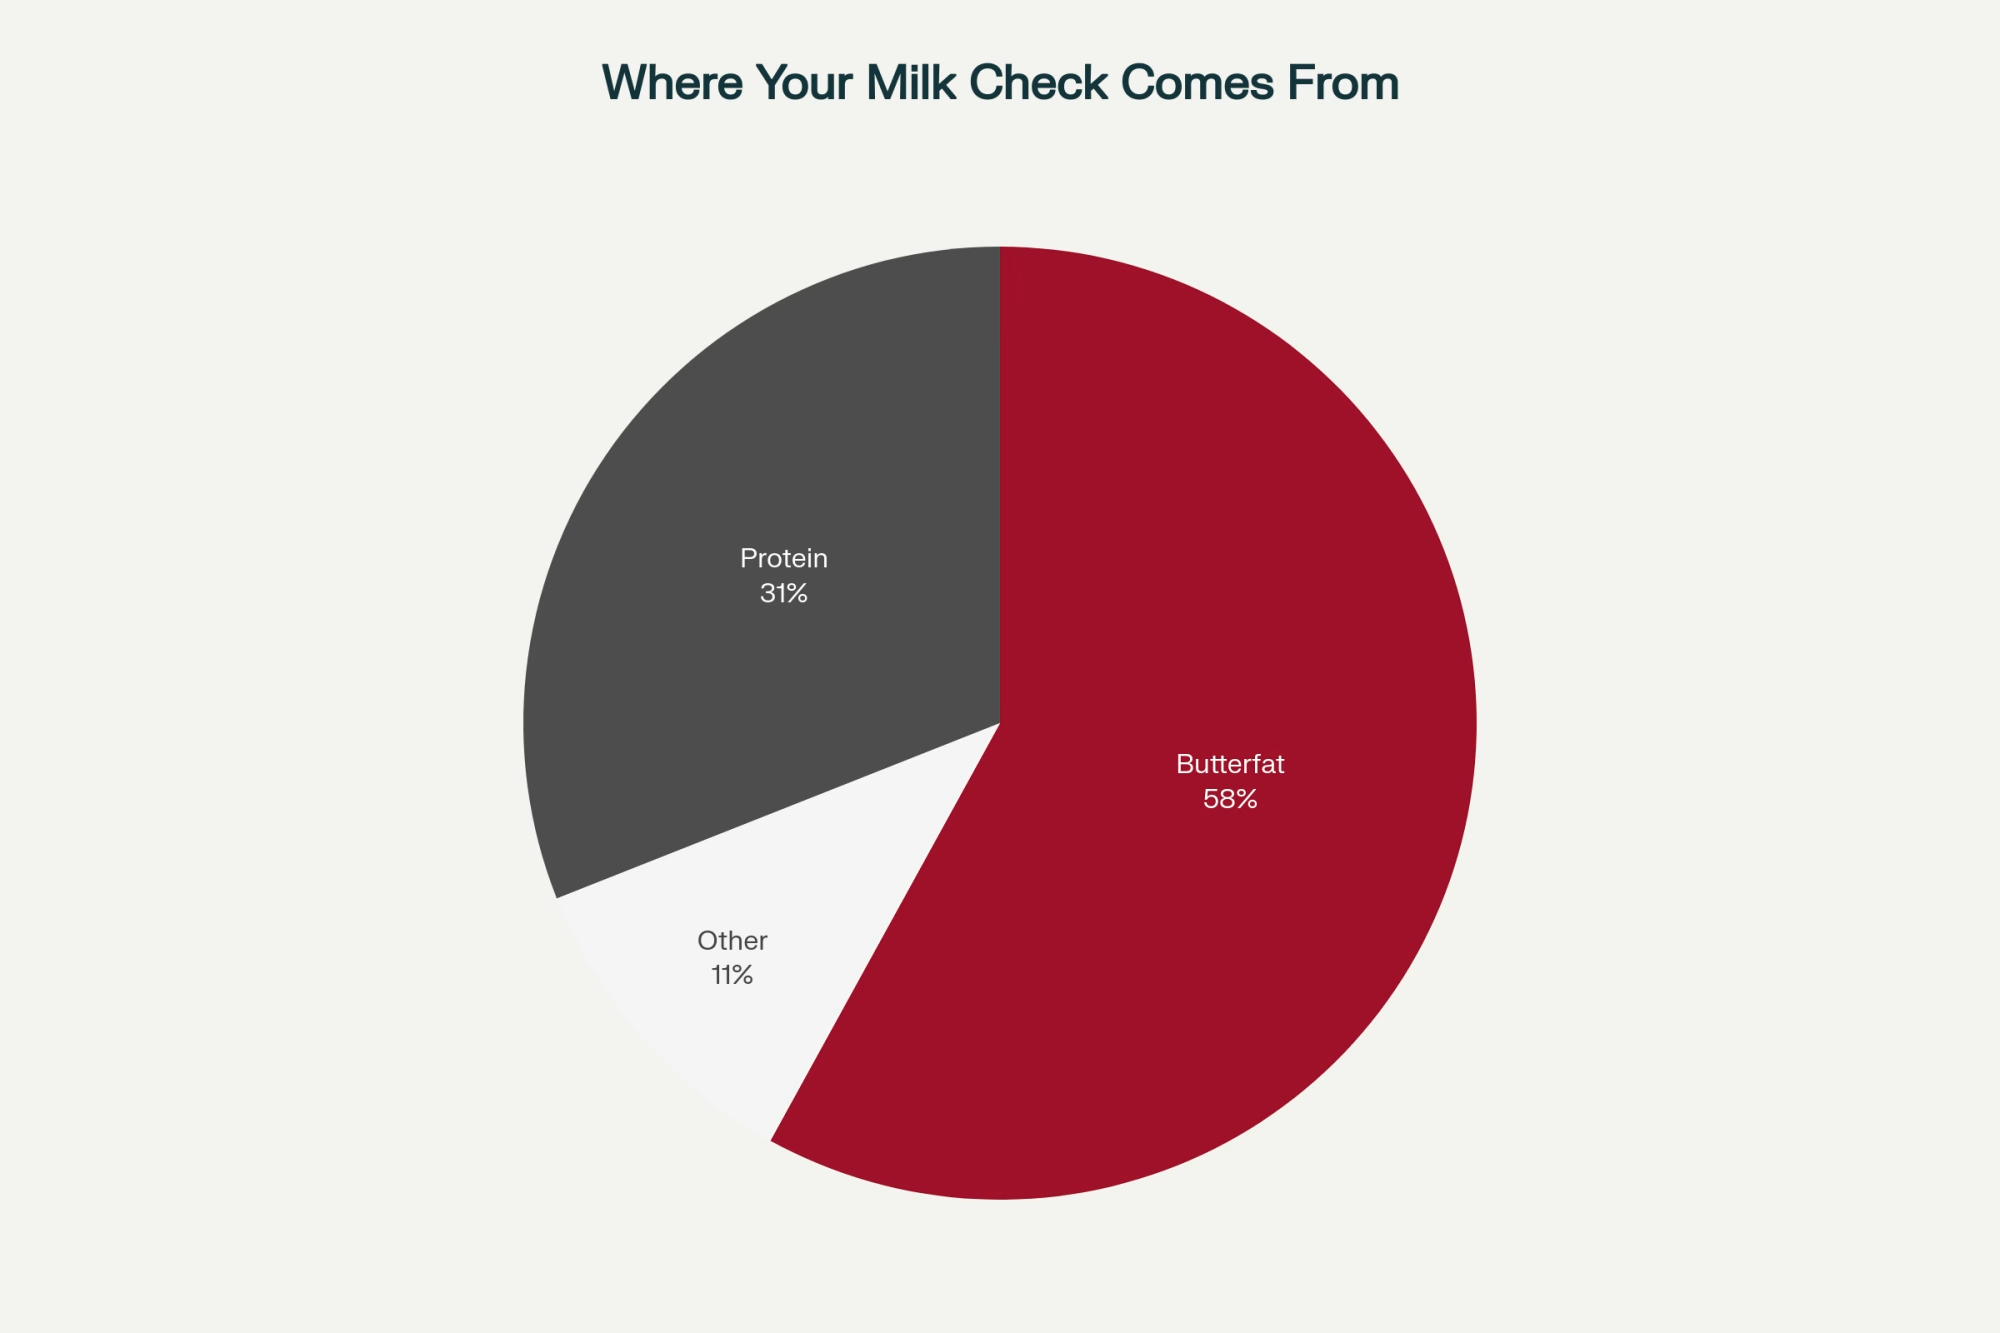
The demand side has shifted substantially. For roughly 30 years, breeders focused heavily on protein content. But now there’s strong demand for higher-fat cheese, Greek yogurt, and premium ice creams. Fat in milk isn’t considered a negative anymore—it’s where the premiums are.
The result? Holstein Association USA staff have noted in industry interviews that genetic trends for milk, fat, and protein production are extremely favorable, and that average herd butterfat has increased toward 4% as breeders respond to higher-value fat markets.
| Trait Category | Net Merit Emphasis (Pre-April 2025) | Net Merit Emphasis (April 2025 Revision) | Change | Why It Matters for Your Milk Check |
| Butterfat % | 27% | 32% | +5 points | Greek yogurt, premium ice cream, high-fat cheese demand; premiums now $0.75-1.50/cwt for >4.0% butterfat |
| Protein % | 20% | 13% | -7 points | Still valuable, but market shifted toward fat; protein premiums plateaued |
| Feed Saved (Efficiency) | 12% | 18% | +6 points | At $16.25/cwt feed costs, efficiency directly impacts margin; most overlooked trait |
| Milk Volume (lbs) | ~24% | ~22% | -2 points | Volume without components = commodity pricing; less emphasis reflects market reality |
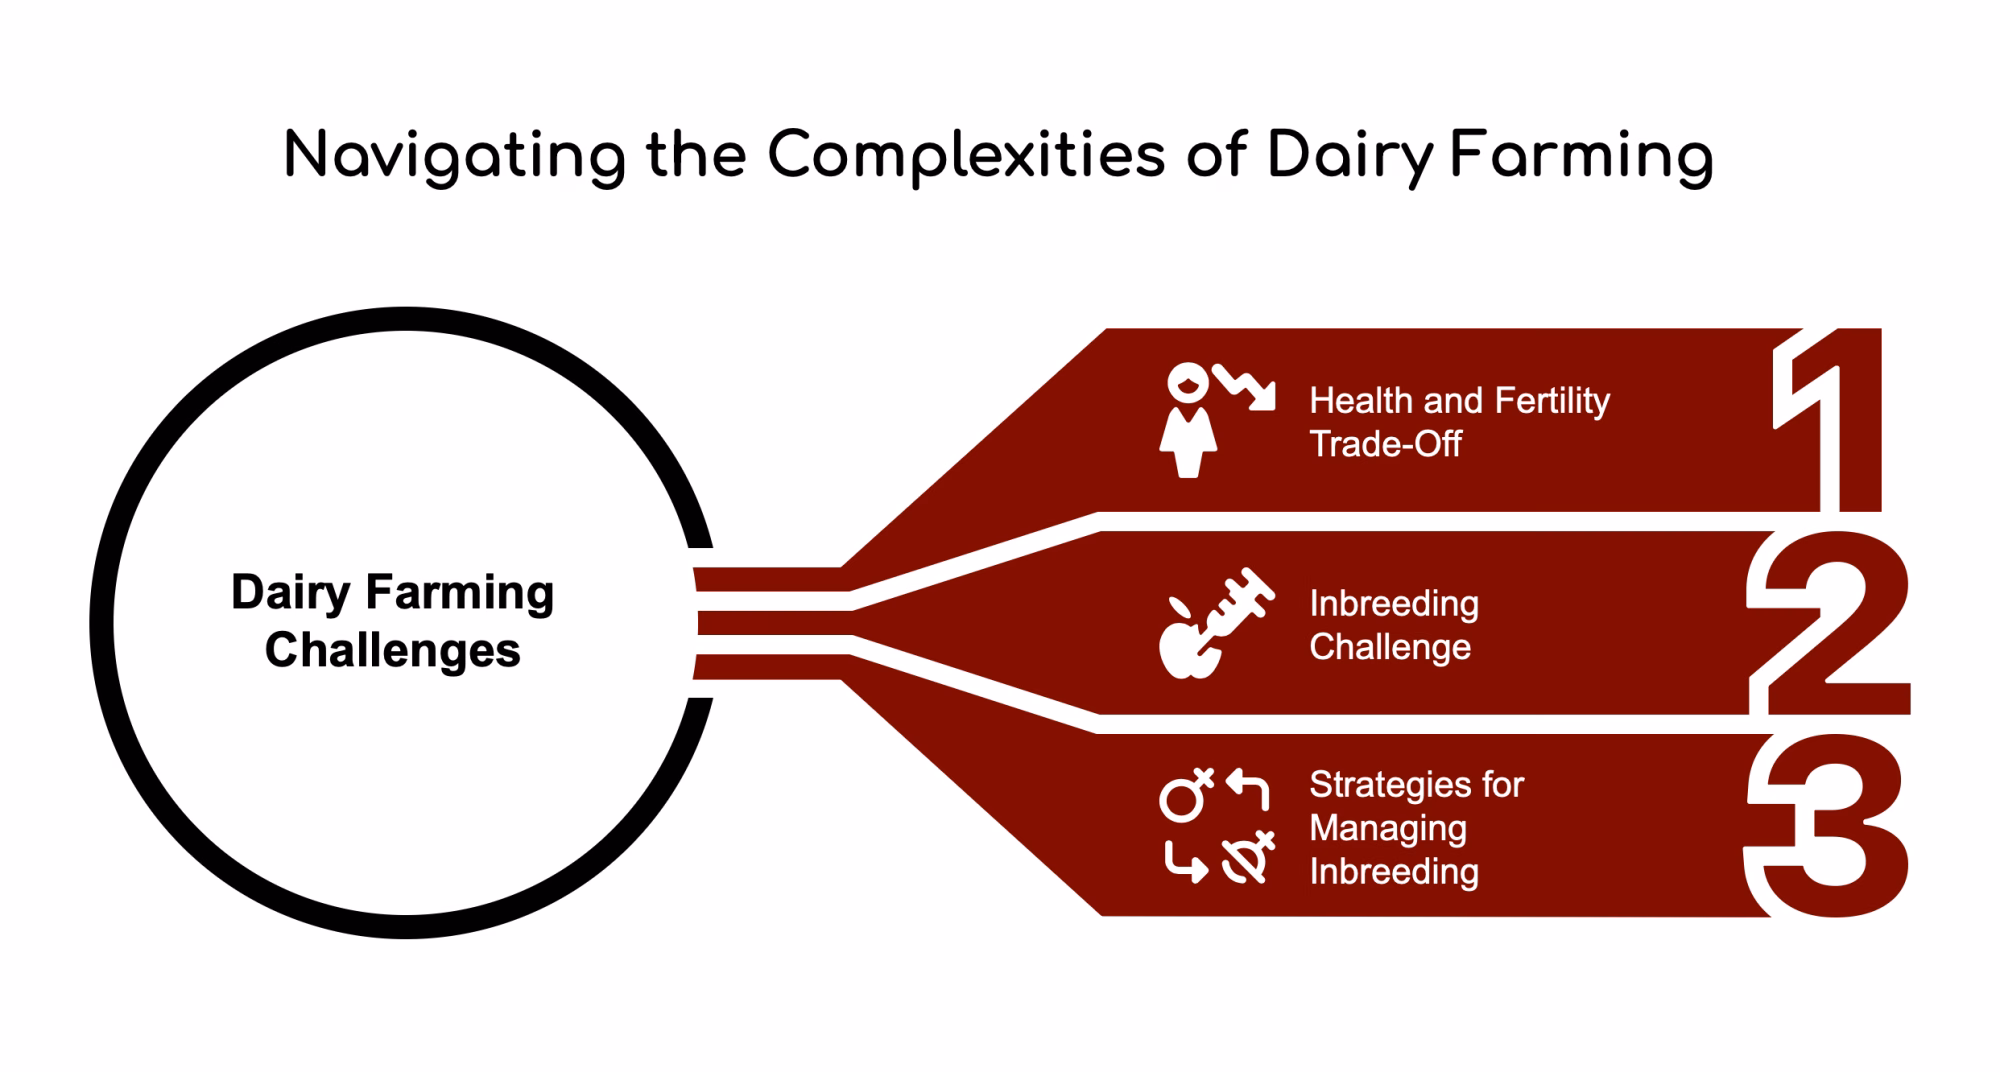
| Health & Fertility Traits | ~17% | ~15% | -2 points | Still important but slightly de-emphasized relative to production efficiency |
| Overall Base Change | 2020 baseline | 2025 baseline | 45-lb butterfat rollback, 30-lb protein rollback | Largest genetic base change in Holstein history; your “average” bulls are now above-average |
If you’re still selecting bulls primarily based on TPI or NM$ without considering the component breakdown, you might be optimizing for yesterday’s market.
For operations selling into cheese markets—which is where most of the premium processor demand is heading—Cheese Merit (CM$) deserves serious consideration. It places more weight on protein yield and milk quality traits that affect cheese production. Fluid Merit (FM$) emphasizes volume and butterfat for fluid milk operations, while Grazing Merit (GM$) focuses on fertility and adaptability for pasture-based systems.
The practical question: What’s your bulk tank butterfat running right now? If you’re at 3.7% and premium contracts require 4.0%, that’s not a gap you can close with feed changes alone. That’s a breeding program shift that takes 18-24 months to show up in the tank. Which means the decisions you make right now determine your position in the component in 2027.
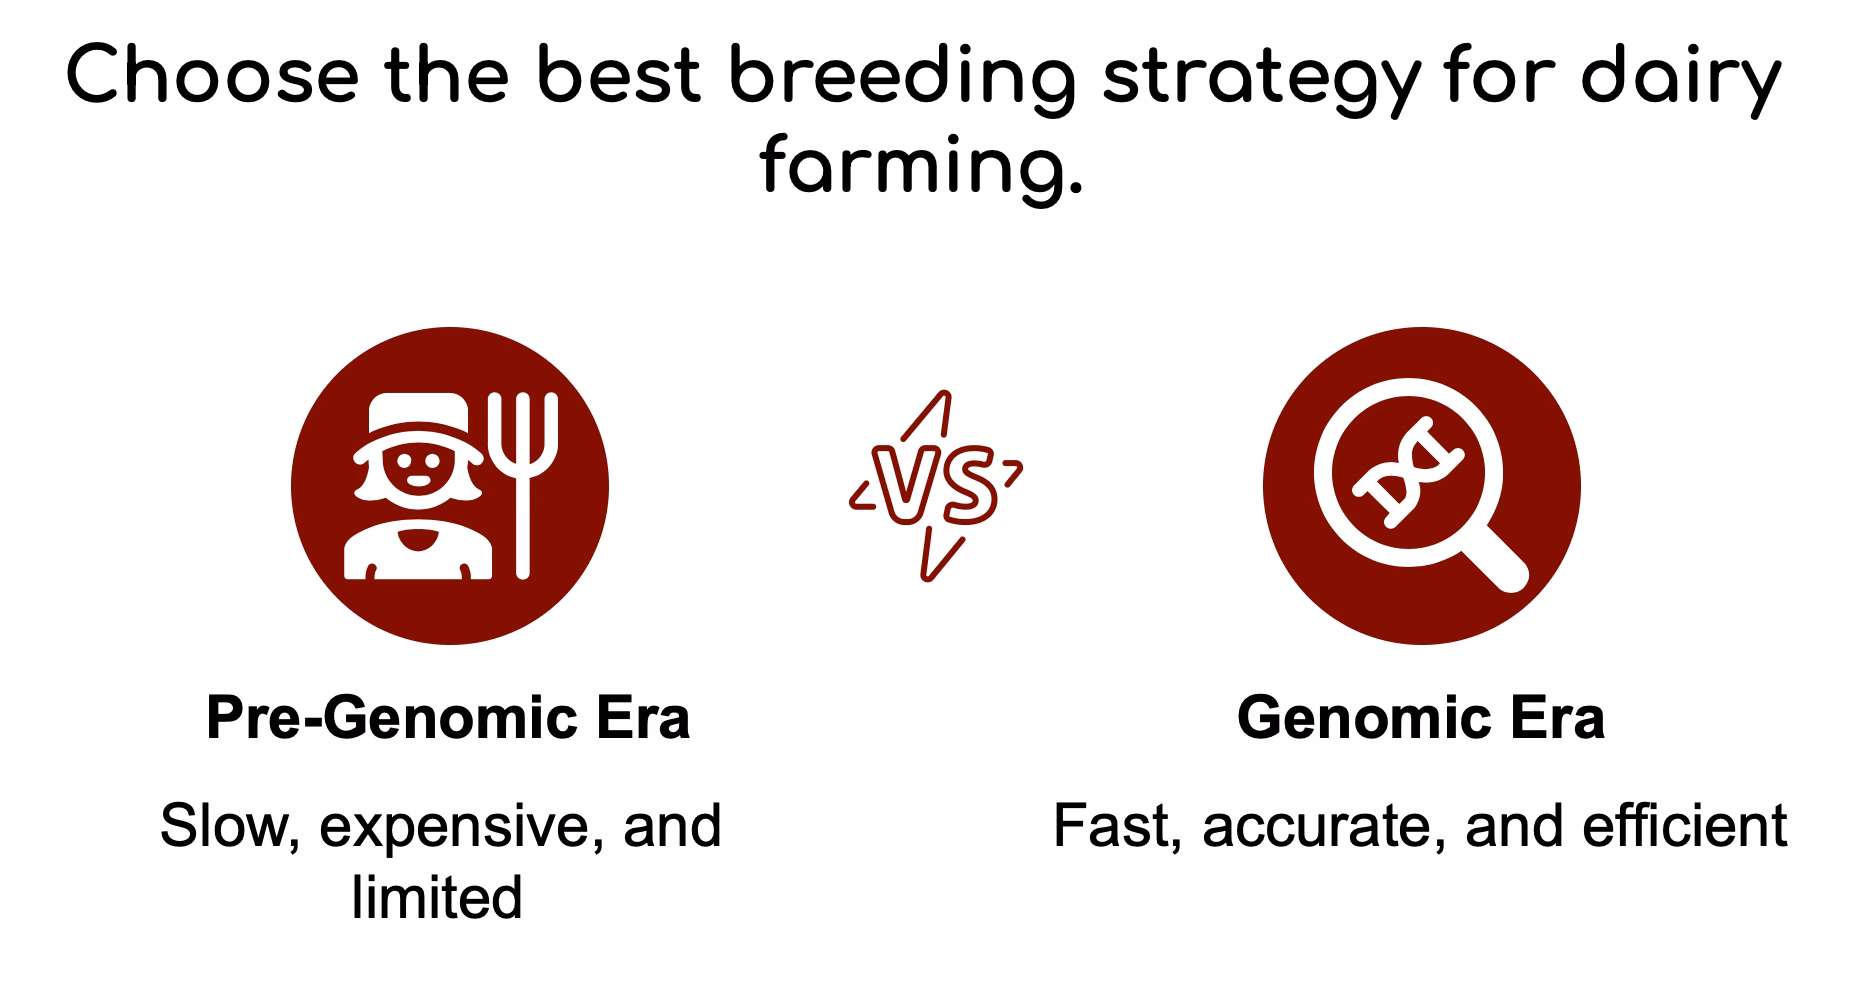
A CoBank dairy economist noted that when CDCB reset its genetic base in April 2025, Holsteins experienced the largest base change in their history—a 45-pound rollback in butterfat and a 30-pound rollback in protein. That’s substantial genetic progress that’s already showing up in bulk tanks across the country for operations that positioned early.
Chad Dechow, who’s been studying dairy cattle genetics at Penn State for more than two decades, wrote in Hoard’s Dairyman that these component gains represent “unprecedented” genetic progress. The question isn’t whether genetic progress is real—it is. The question is whether your breeding program is capturing it, or whether you’re paying for yesterday’s genetics while your neighbors cash tomorrow’s premiums.
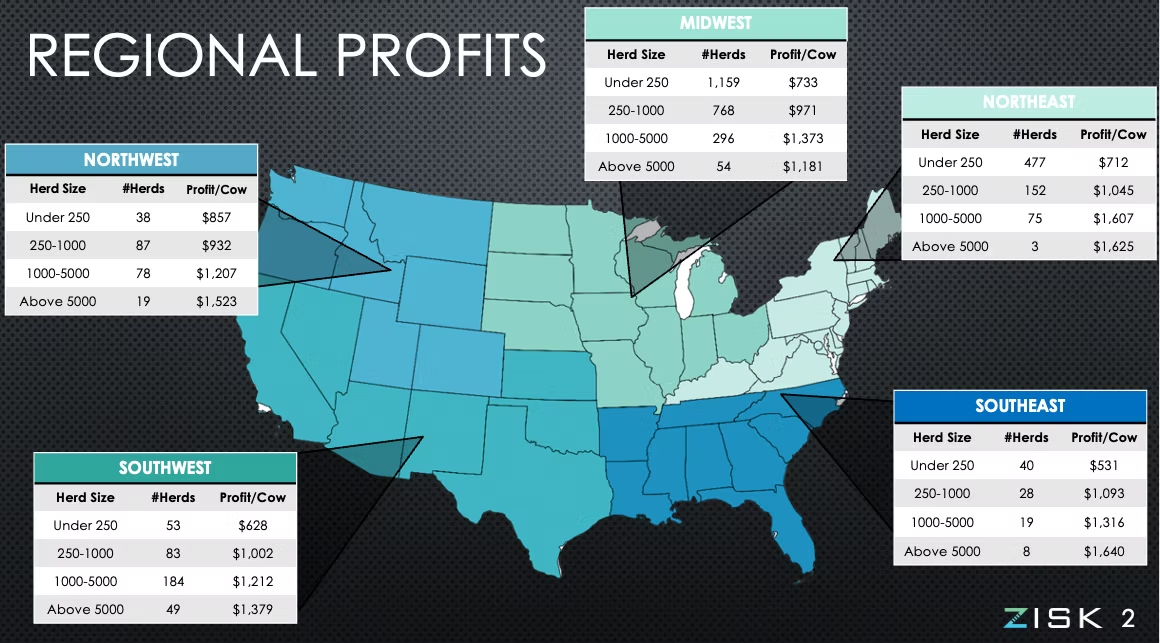
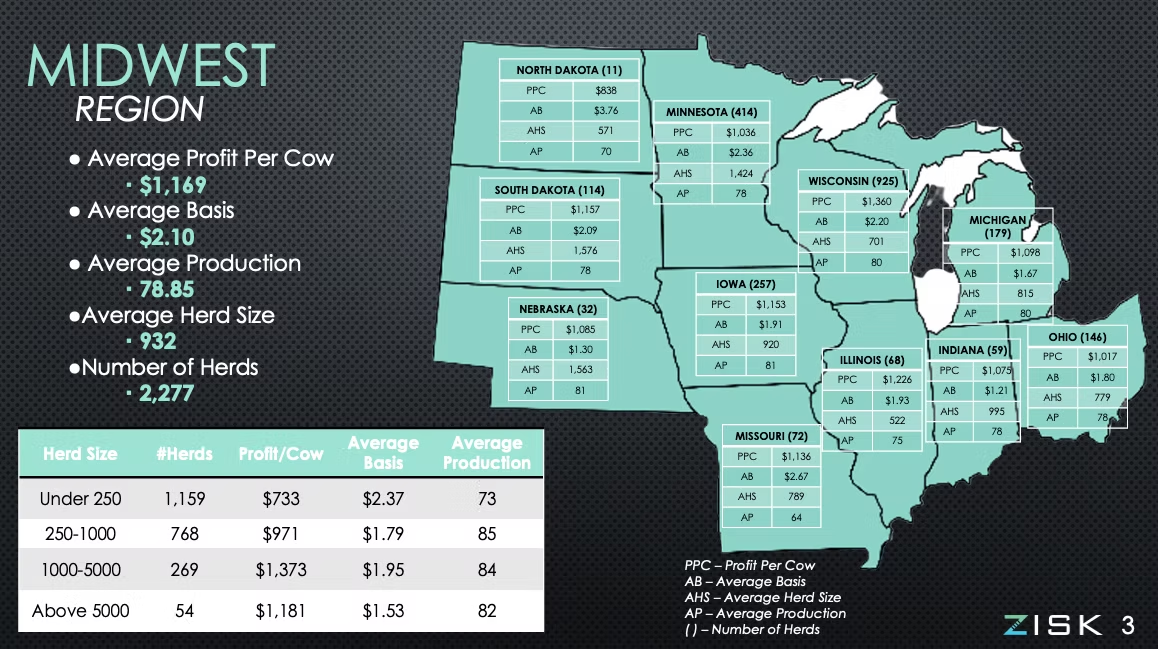
Regional Dynamics Worth Noting
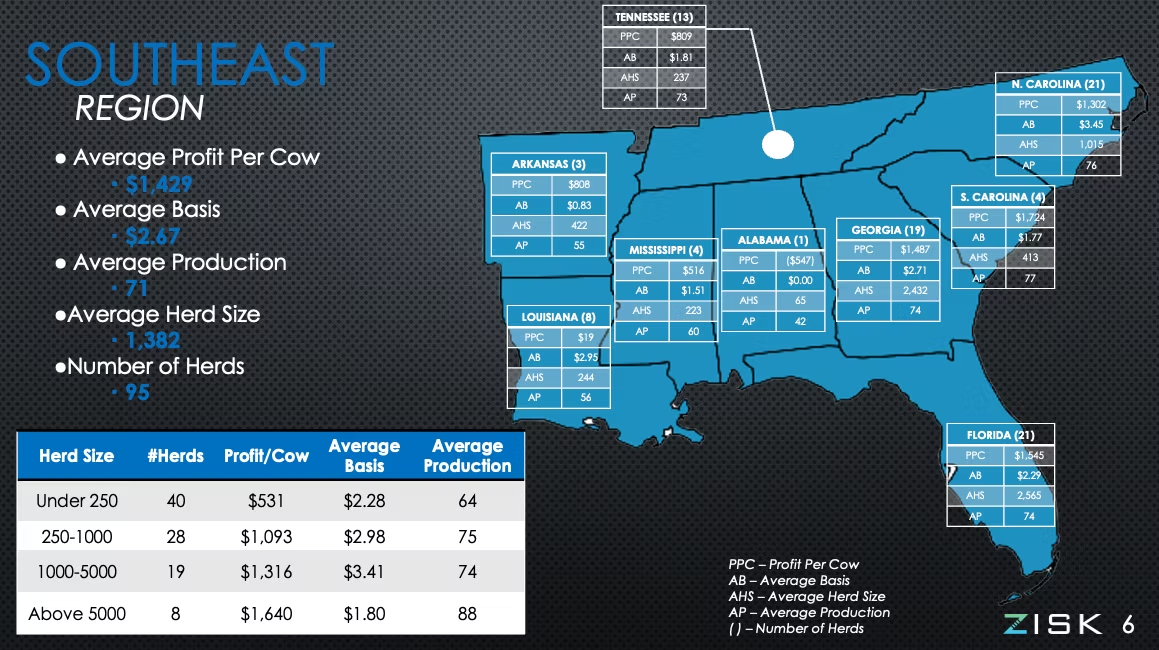
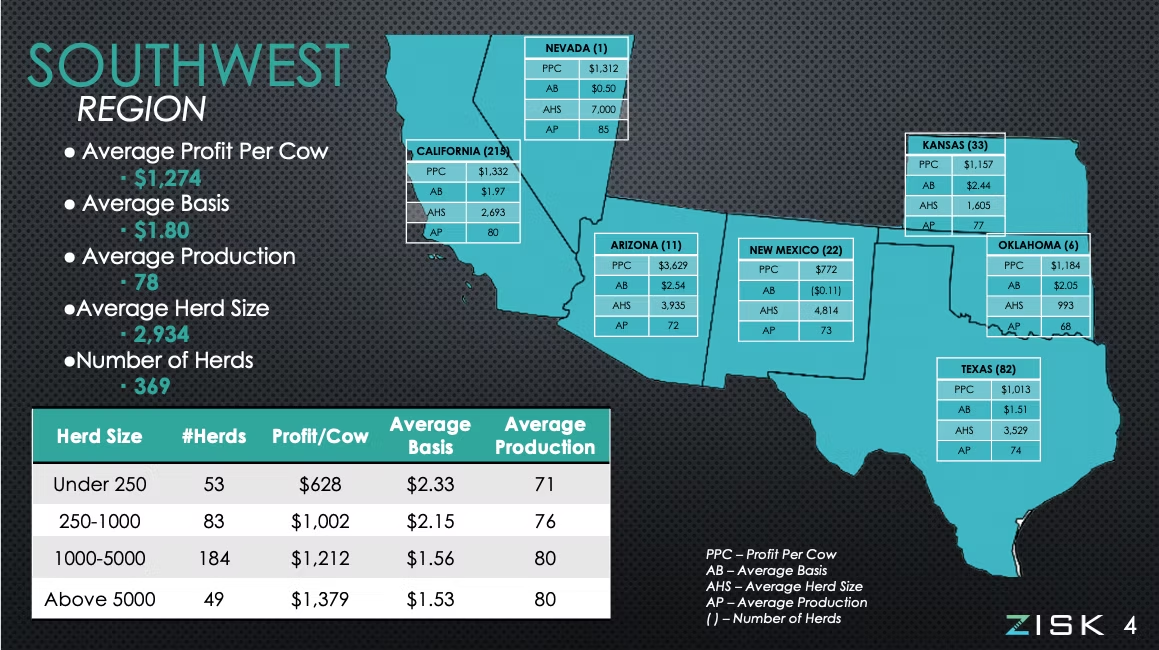
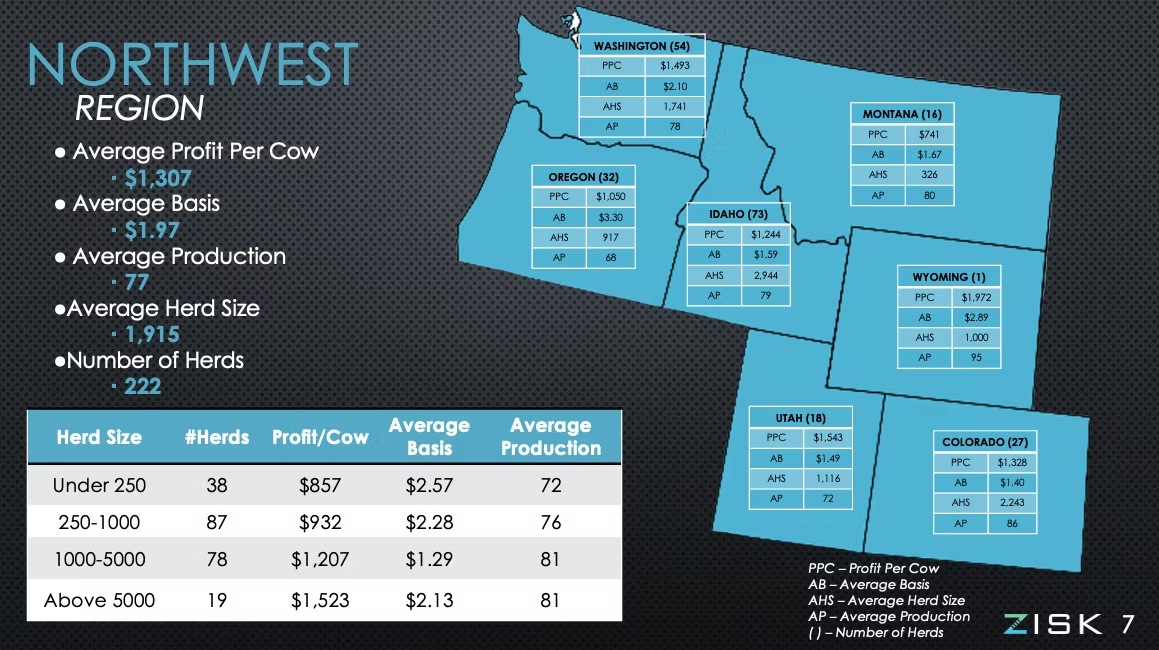
One thing I should mention: these pressures don’t hit every region the same way, and the solutions vary accordingly.
In Wisconsin and Minnesota, you’ve got different cooperative structures and processor relationships than in the Southwest. Many Midwest producers report that their cooperative relationships—while perhaps not offering the premium pricing of direct processor contracts—provide stability and market access that shouldn’t be undervalued in uncertain times.
California’s regulatory environment and water costs create their own distinct challenges. I’ve talked with producers in the Central Valley who are navigating pressures that simply don’t exist in other regions—environmental compliance costs, groundwater restrictions, labor market dynamics. Their calculations look quite different.
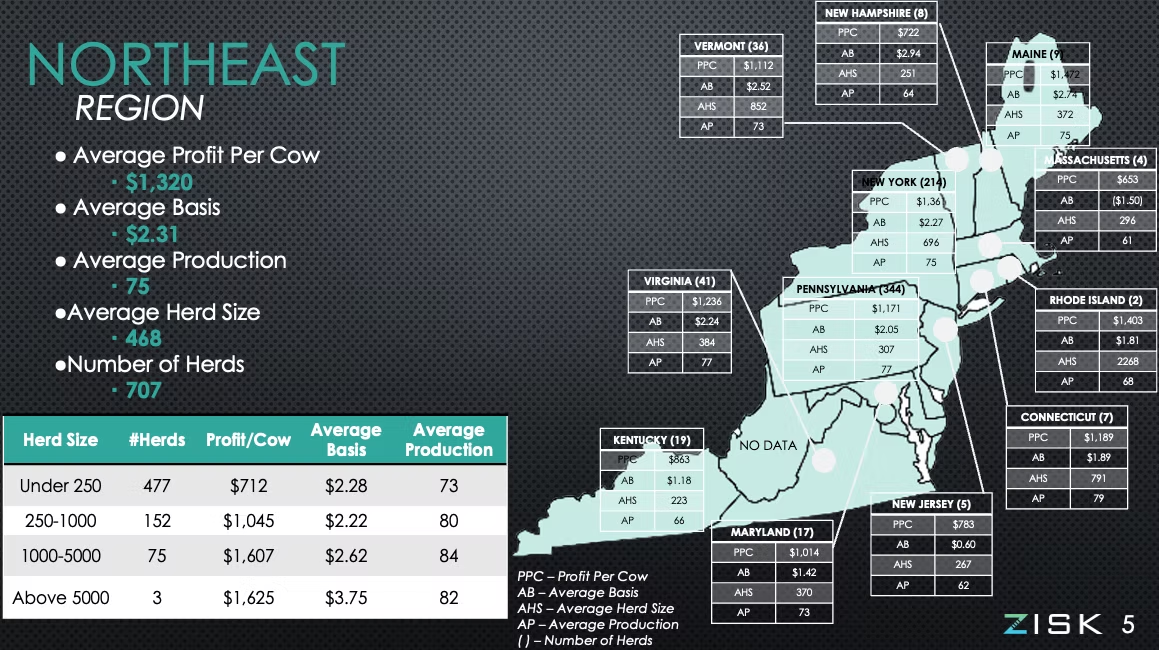
The Northeast, with new processing capacity coming online in New York, presents both opportunity and competitive pressure. Operations positioned to supply these facilities may find themselves with options that didn’t exist two years ago. Others may feel squeezed by changing milk shed dynamics.
What works in one region may not translate directly to another. The fundamentals I’m describing apply broadly, but the specific options available to any individual operation depend heavily on local processor relationships, cooperative membership, and regional market access. That’s worth keeping in mind as you evaluate your own situation.
Global Market Headwinds
And then there’s what’s happening internationally—because global markets affect domestic prices more than many producers realize.
Rabobank’s analysis shows China’s whole milk powder imports have essentially collapsed—from a 2018-2022 average of 670,000 metric tons down to just 430,000 metric tons in 2023. While data for 2024 and 2025 are still developing, the USDA’s December World Agricultural Supply and Demand Estimates don’t offer much hope for a recovery in 2026.
Why is this significant? When major importers pull back, that surplus milk has to go somewhere—and it often ends up pressuring domestic commodity markets. The U.S. dairy industry has become increasingly export-dependent over the past decade, creating opportunities in good times and exposure when global demand softens.
This builds on what we’ve seen in previous cycles, though the scale of China’s domestic production growth adds a new dimension. Chinese dairy production has expanded significantly, reducing their import needs in ways that may prove structural rather than cyclical. That’s something worth watching as you think about longer-term market positioning.
What’s Working for Operations That Are Gaining Ground
Talking with producers and advisors who are navigating this successfully, a few common threads keep emerging. These aren’t silver bullets—every operation is different—but they’re worth considering.
Risk management positioning stands out. Operations that locked forward contracts on 40-60% of their 2026 milk production during the third and fourth quarters of this year—when prices were more favorable—have built meaningful protection. Tools such as Dairy Revenue Protection, cooperative forward contracting programs, and managed futures strategies are attracting serious attention from mid-sized operations that historically avoided them.
The arithmetic works out clearly: say you’ve got a 500-cow dairy producing around 15 million pounds annually—that’s roughly 150,000 cwt if you’re running good production. If you locked 50% of that at $17.50/cwt while spot prices drop to $15.50/cwt, your blended realized price comes out around $16.50/cwt. On that volume, you’re looking at roughly $150,000 in protected margin compared to selling everything at spot. Not enough to transform a struggling operation, but meaningful—and potentially the difference between a straightforward renewal conversation and a difficult one.
The Path Forward
So, where does this leave the mid-sized producer facing a January loan renewal? A few thoughts, offered with the recognition that every operation’s situation is unique.
- Know your numbers cold. Not just your DMC margin, but your actual cost of production, including every line item—labor, repairs, depreciation, family living, debt service. Your banker certainly will. Walking into that conversation with a clear-eyed understanding of your breakeven and your path to profitability changes the dynamic considerably.
- Explore risk management now. If you haven’t looked at forward contracting or Dairy Revenue Protection for 2026 production, the window is closing. Talk to your cooperative, your risk management advisor, or your extension specialist this week—not next month. Even partial coverage changes your risk profile in ways lenders recognize.
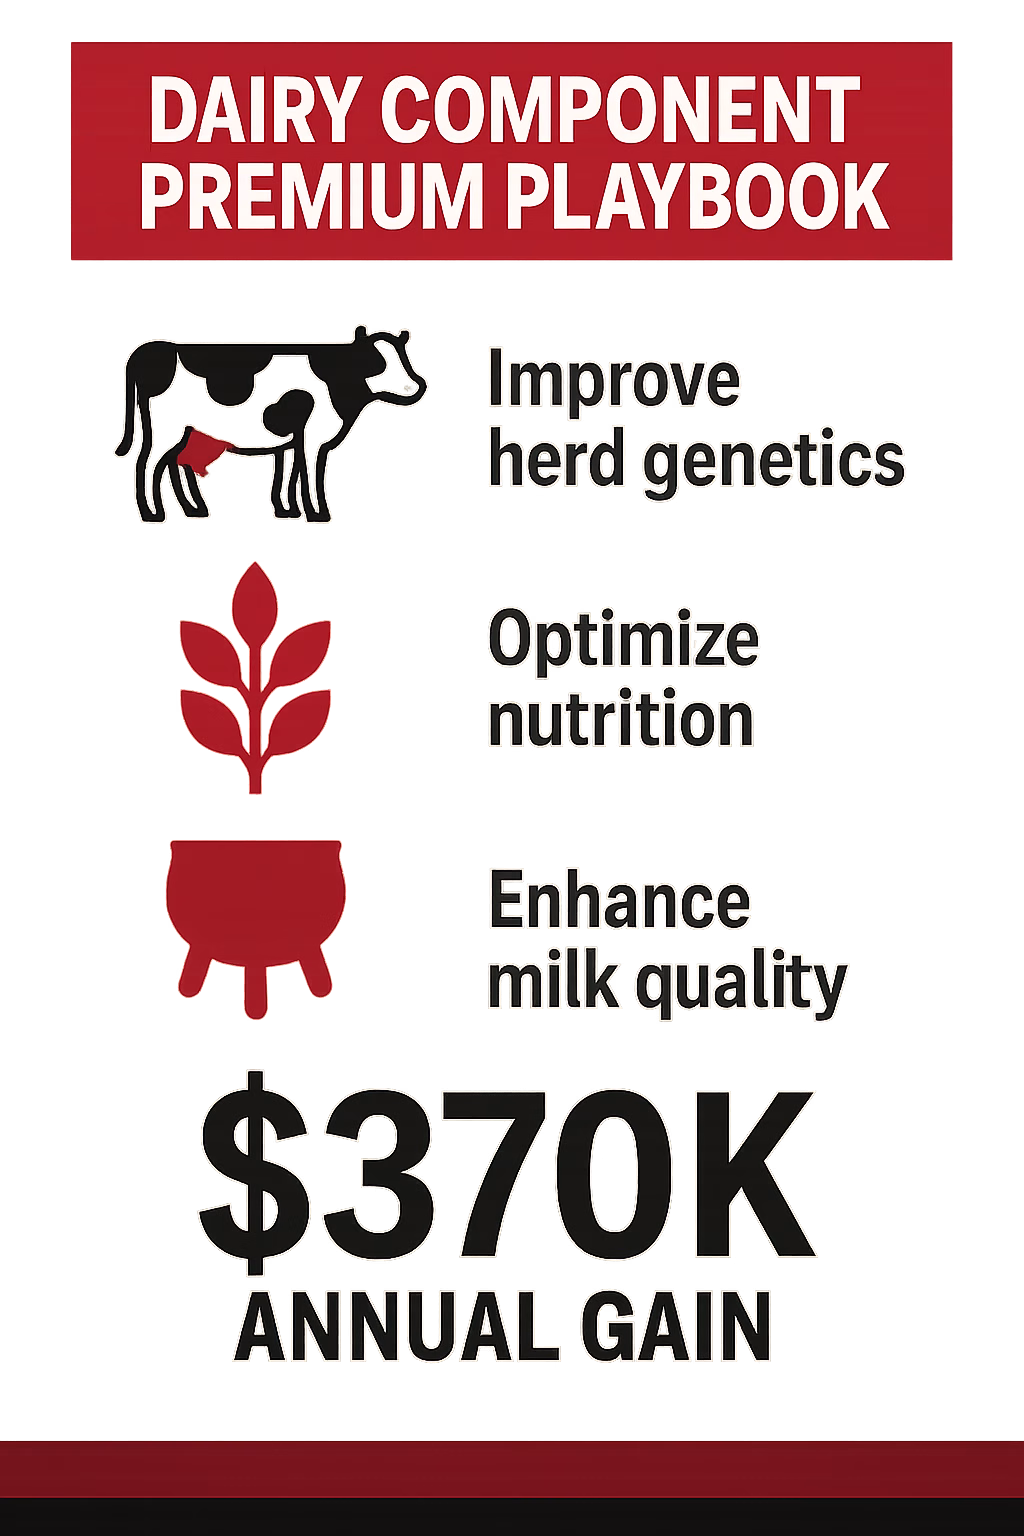
- Get your genetics aligned. Pull your bull lineup and look at the component breakdown—not just TPI or NM$, but fat and protein PTAs specifically. If you’re selling into cheese markets, Cheese Merit deserves a hard look. If your bulk tank is running below 4.0% butterfat, you need to understand why and whether your breeding program is moving you in the right direction.
- Engage your lender proactively. Don’t wait for your banker to start the conversation. If you’re anywhere near that 1.0 DSCR threshold, being proactive about discussing your situation—with documentation showing how you’re addressing challenges—puts you in a much stronger position than waiting to react. Lenders appreciate producers who demonstrate awareness and planning, even when the numbers are tight.
Resources for Further Planning
- FINBIN benchmarking data: finbin.umn.edu — Compare your cost of production against regional benchmarks
- DMC decision tools: fsa.usda.gov/dmc — Current margin calculations and program information
- Dairy Revenue Protection: Contact your crop insurance agent or visit rma.usda.gov
- CDCB genetic tools: uscdcb.com — Merit index details and trait information
- Extension support: Your state’s land-grant university extension service offers one-on-one consultations with a dairy specialist. In Wisconsin, contact the Center for Dairy Profitability at UW-Madison. In Pennsylvania, reach out to Penn State Extension’s dairy team. In New York, Cornell PRO-DAIRY provides similar support. Most states have dedicated dairy extension specialists—a quick search for “[your state] dairy extension” will connect you with local expertise.
The Bottom Line
The producers who come through this transition in strong shape won’t be the ones who waited to see how things played out. They’ll be the ones who moved thoughtfully—but moved first. For those willing to adapt—to get serious about risk management, genetics, and understanding where your cooperative fits in this changing landscape—there’s a path through this. But it requires honest assessment, timely action, and a willingness to ask good questions of the people and organizations you’re working with.
KEY TAKEAWAYS
- Your banker’s already running the numbers. If your DSCR is approaching 1.0, start the conversation now—waiting until they call means fewer options.
- This isn’t a downturn—it’s a restructuring. $11 billion in new processing capacity is sorting the industry into two tracks: premium contracts for large suppliers, commodity pricing for everyone else. Know which track you’re on.
- Your heifer inventory is hidden leverage. At $3,010/head and a 47-year supply low, replacement value changes the math on every scenario—expansion, contraction, or exit.
- Genetics have pivoted to components. Has your program? Net Merit 2025 pushed butterfat emphasis to 32%. If your tank runs 3.7% while premiums start at 4.0%, you’re leaving money in the bulk tank.
- The producers still milking in 2030 are making moves now. Lock in risk protection, realign your genetics, and walk into your lender’s office with a plan—not waiting to be handed one.
Complete references and supporting documentation are available upon request by contacting the editorial team at editor@thebullvine.com.
Learn More
- 2800 Dairy Farms Will Close This Year—Here’s the 3-Path Survival Guide for the Rest – Arms you with a three-track execution plan to protect your equity before market consolidation makes the decision for you. It breaks down the exact capital requirements and success rates for scaling up versus exiting with dignity.
- Cheap Milk Is Breaking the Farm: What’s Really Hollowing Out Dairy’s Middle Class – Exposes the structural vise-grip hollowing out the industry’s middle class and delivers the data you need to reposition. It reveals why traditional expansion playbooks are failing and how to pivot before the 2030 cliff.
- Bred for $3 Butterfat, Selling at $2.50: Inside the 5-Year Gap That’s Reshaping Genetic Strategy – This high-stakes analysis reveals the hidden “trap” in the April 2025 Net Merit revision and explains why your current breeding program might be chasing yesterday’s prices. It delivers a roadmap for aligning genetics with future premiums.
 Join the Revolution!
 Join the Revolution!
Join over 30,000 successful dairy professionals who rely on Bullvine Weekly for their competitive edge. Delivered directly to your inbox each week, our exclusive industry insights help you make smarter decisions while saving precious hours every week. Never miss critical updates on milk production trends, breakthrough technologies, and profit-boosting strategies that top producers are already implementing. Subscribe now to transform your dairy operation’s efficiency and profitability—your future success is just one click away.


 Navigate the volatile dairy market with our essential guide to farmer’s line of credit. Learn the crucial do’s and don’ts to keep your cash flow healthy.


