
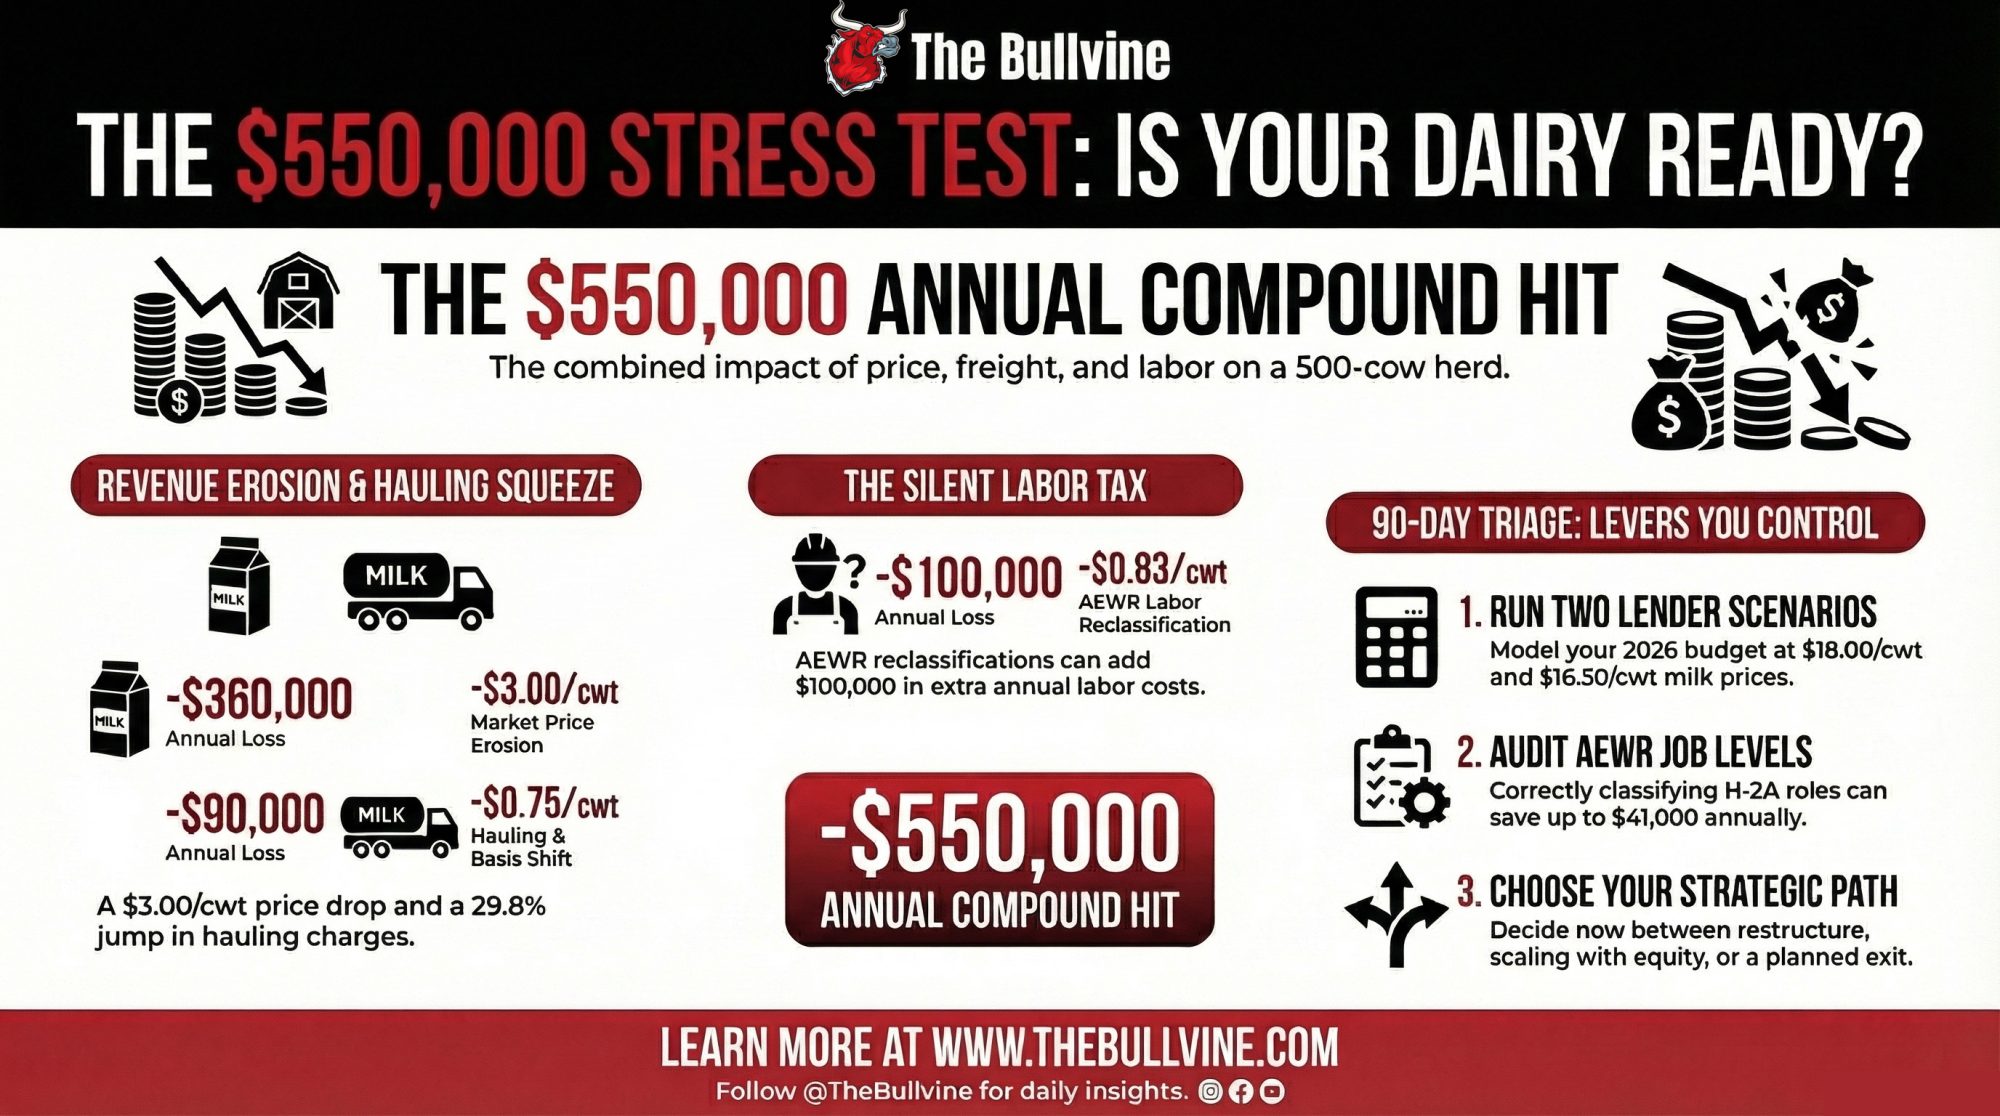
USDA cut $3/cwt off their 2026 forecast in six months. We ran the stress test on a 500-cow herd — price, freight, and labor hitting at once. The compound number is $550,000.
Executive Summary: USDA’s 2026 all-milk forecast has dropped $2.20/cwt since last August — on a 500-cow herd, that’s $176,000 in gross revenue gone before costs move. Costs are moving. The Holle family near Mandan, North Dakota, lost two processors in three years and now hauls milk five hours to a Minnesota plant; across FO30, hauling charges jumped 29.8% in one year. Stack that freight squeeze and the new AEWR labor reclassification on top of softer prices, and the compound hit on a 500-cow herd reaches $533,000–$550,000/year — with debt service, you’re modeling a $633,000–$710,000 shortfall before anyone draws a paycheck. We break down the barn math for each layer, walk through three paths (restructure, scale, or planned exit), and lay out a 90-day triage starting with your AEWR audit and two lender scenarios at $18 and $16.50/cwt. If your DSCR drops below 1.0 at either price, you’re not in a dip — you’re in a conversation your lender is already having on your file.
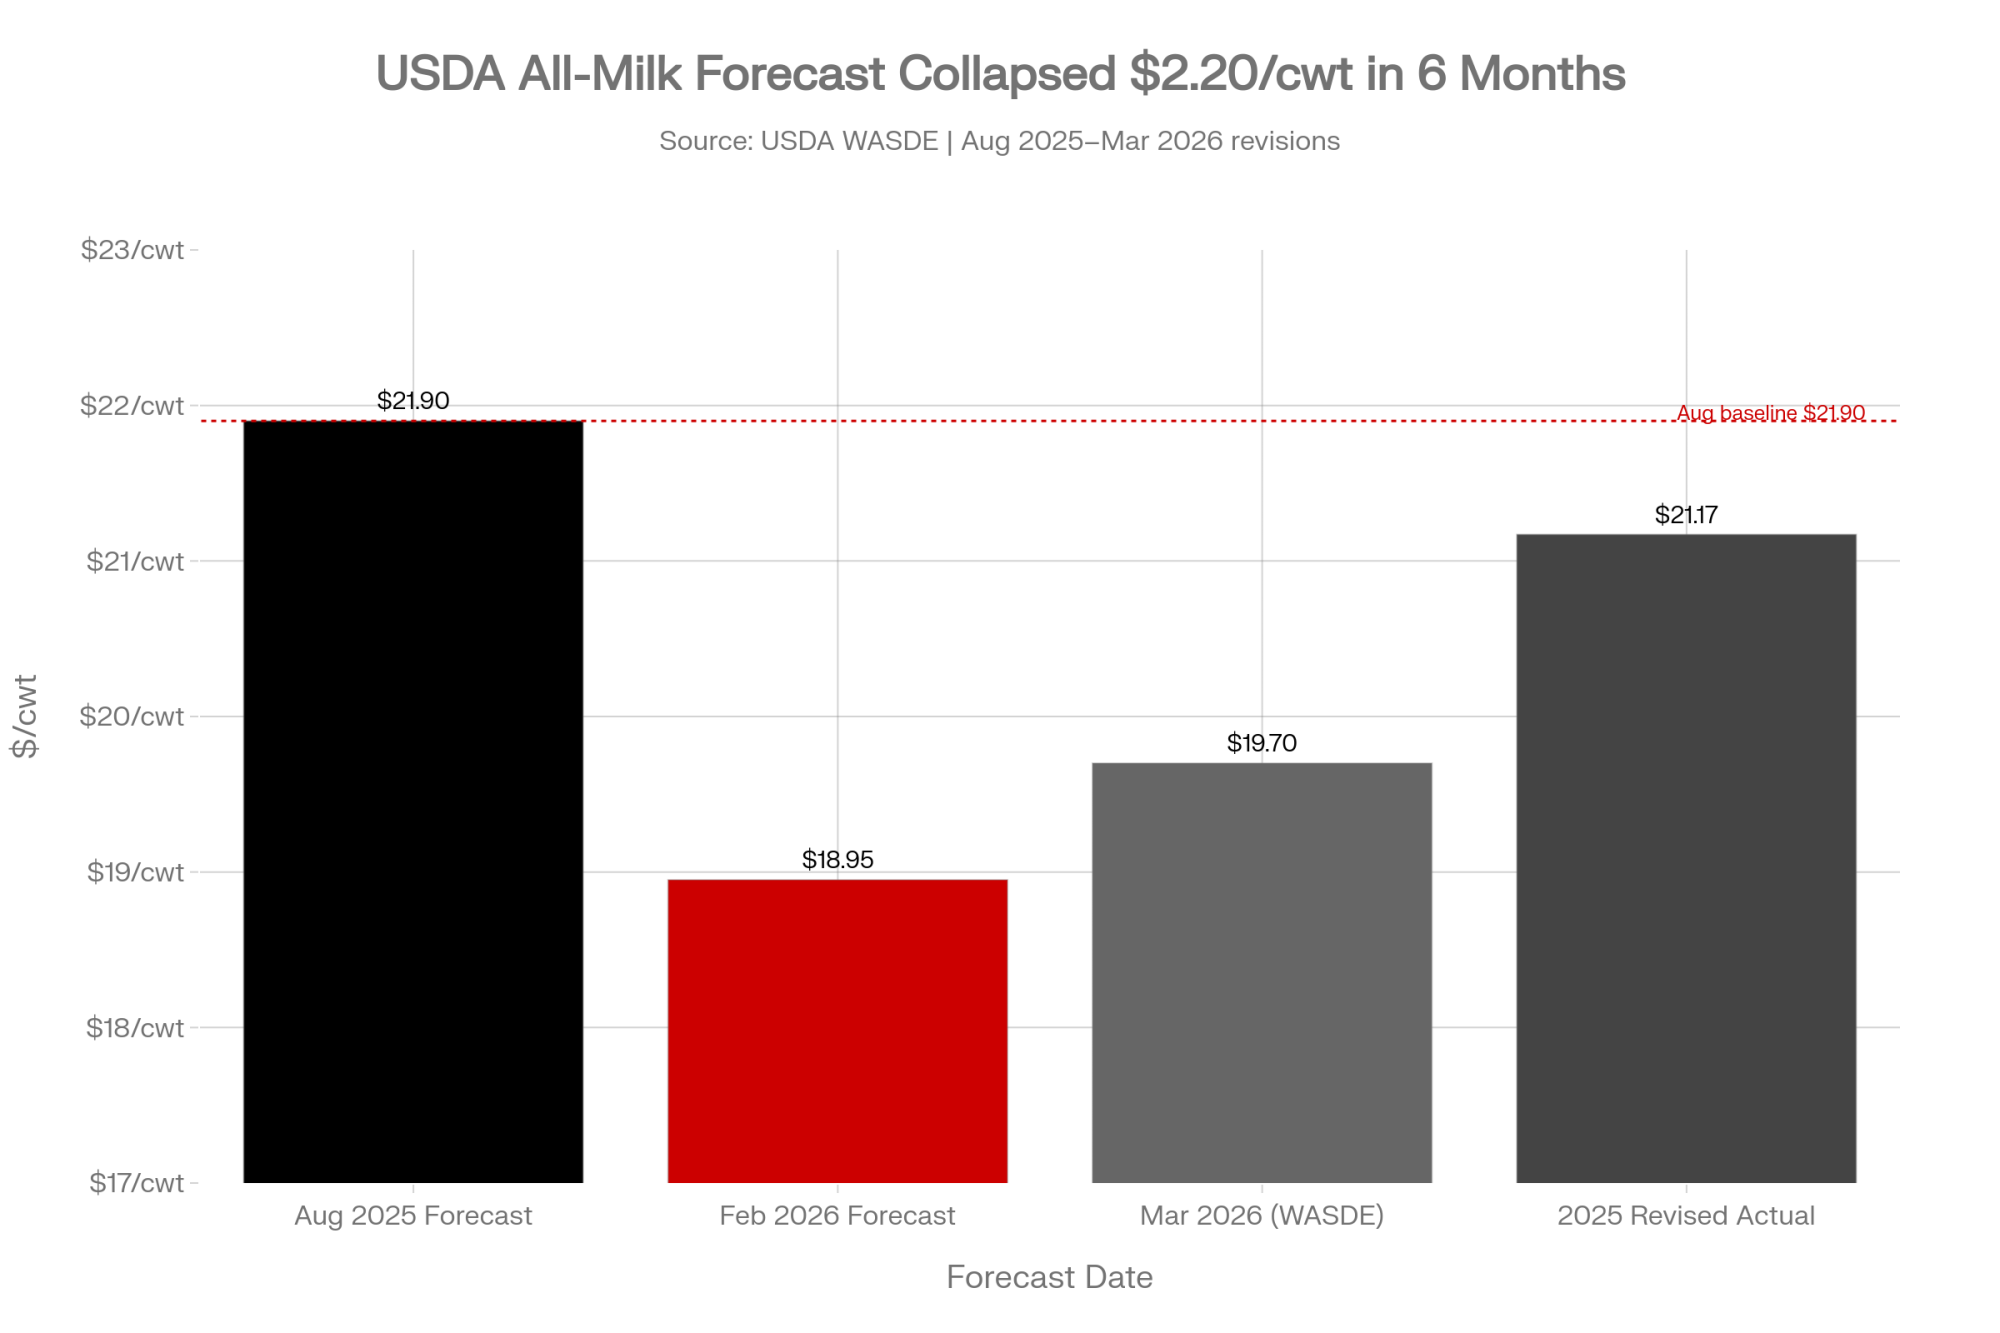
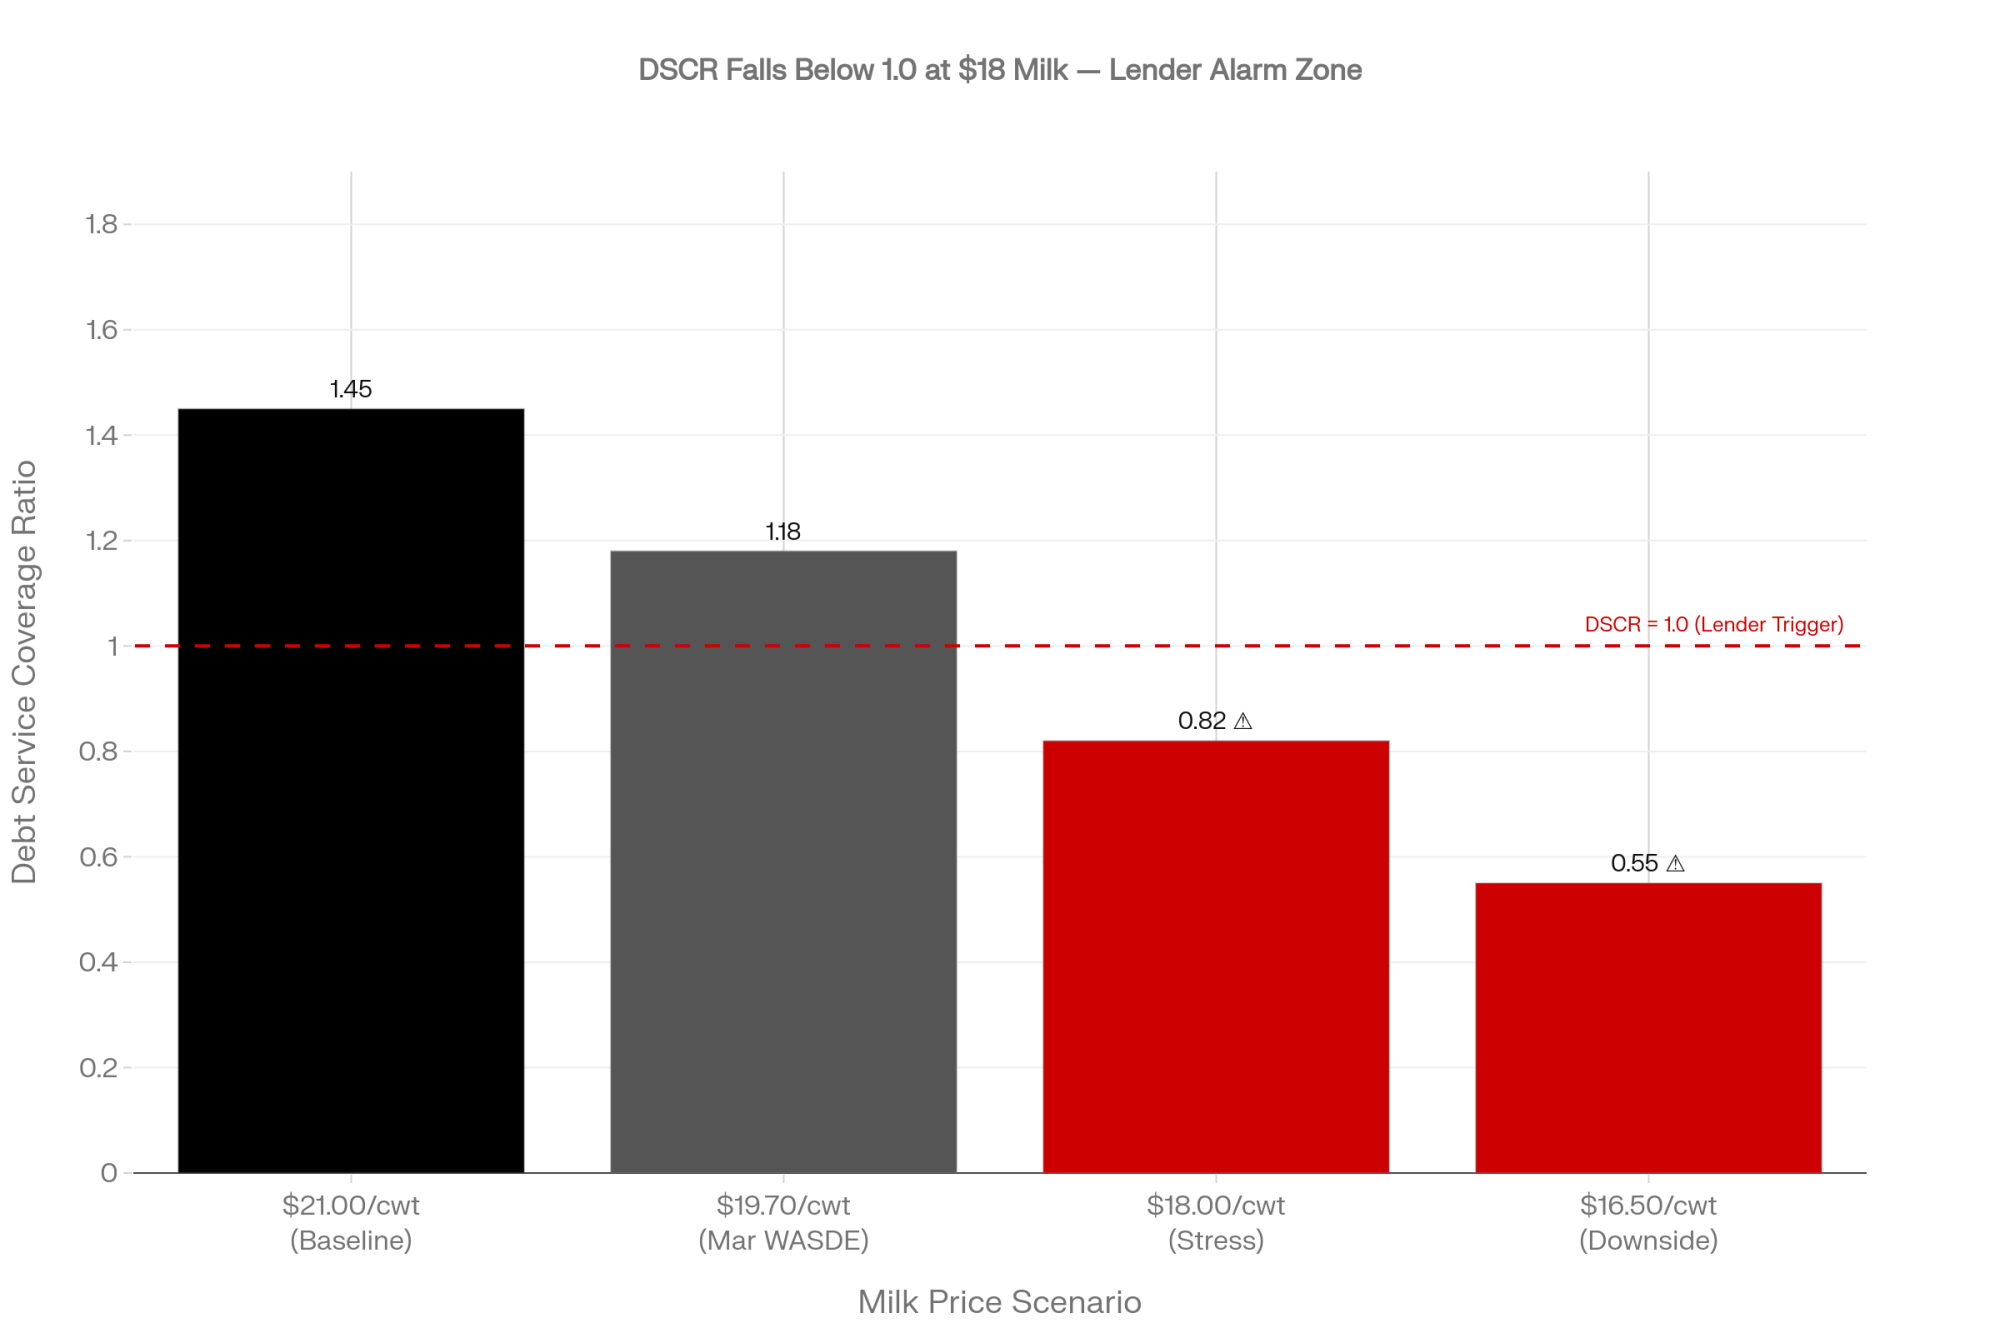
Last August, USDA projected 2026 all‑milk at $21.90/cwt. By February, they’d cut it to $18.95. The March WASDE bumped it back to $19.70 — still $1.47/cwt below the revised 2025 average of $21.17. On a 500‑cow herd shipping 120,000 cwt a year, that gap alone erases roughly $176,000 in gross milk revenue.
And that’s the optimistic number. January’s actual Class III settled at $14.59/cwt. CME futures for February pointed to roughly $15.16. The March WASDE left the 2026 Class III forecast unchanged at $16.65/cwt — higher cheese prices exactly offset lower whey. The back half of 2026 is doing all the heavy lifting on USDA’s spreadsheet. The question isn’t whether 2026 is a down year. It’s whether you’ve stress‑tested what happens when three cost shocks land on top of that softer price at the same time.
For the Holle family at Northern Lights Dairy near Mandan, North Dakota — about 1,000 Holsteins, now hauling five hours one way to a Bongards plant in Perham, Minnesota — the forecast revisions are background noise. Their real squeeze started the day their closest processor closed. It hasn’t let up since.
When Your Backup Plant Disappears — Twice
The Holles didn’t get a warning shot. In September 2023, Prairie Farms closed its Bismarck processing facility and converted it to distribution only. North Dakota Agriculture Commissioner Doug Goehring was blunt: “With no other processors nearby, those dairies will likely pay for shipping longer distances that will be deducted from their milk checks. This will have a dramatic impact on their bottom line.”
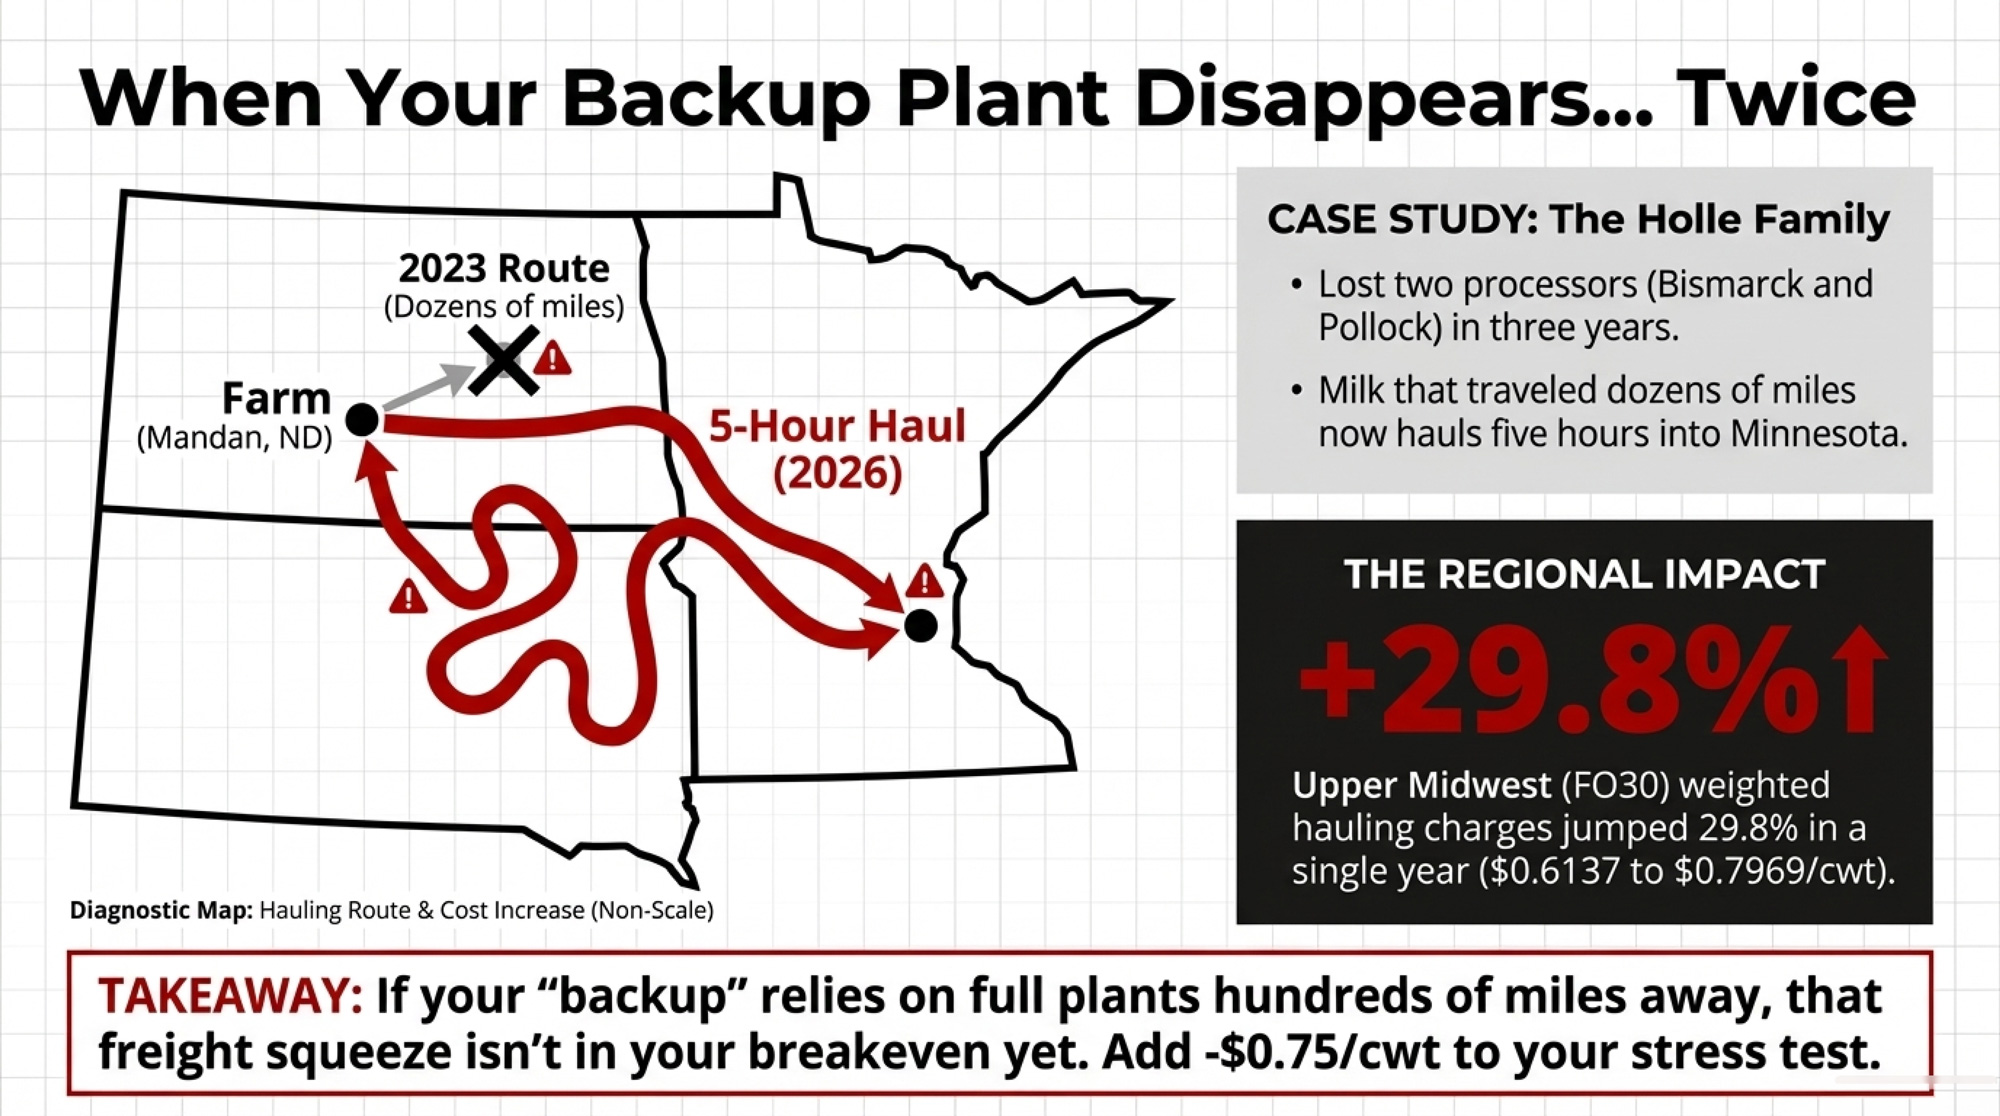
He wasn’t speculating. A producer about 50 miles northwest of Bismarck — identified in Dairy Star’s September 2023 reporting as Henke — saw his milk rerouted 151 miles to a DFA facility in Pollock, South Dakota, at an immediate freight surcharge of $0.55/cwt. He also had to buy an additional bulk tank for every‑other‑day pickup. Then, in July 2024, DFA announced it would close Pollock, too — a plant employing 33 full‑time and four part‑time workers — effective August 30. Suddenly, Henke’s backup was gone. The Holles’ backup was gone. Milk that used to travel dozens of miles was now traveling hundreds of miles into Minnesota plants, with no particular reason to pay a premium for distant, hard‑to‑route volume.
USDA’s Upper Midwest (FO30) data shows what that kind of map‑stretching does at scale. Weighted‑average hauling charges climbed from $0.6137/cwt in 2023 to $0.7969/cwt in 2024 — a 29.8% jump in a single year. Today, the only milk plant operating in North Dakota is Cass‑Clay’s facility in Fargo, pressed against the Minnesota border. For herds west of the Missouri, every extra mile comes straight off the check.
What Does a $3/cwt Drop Actually Do to a 500‑Cow Herd?
USDA’s March outlook at $19.70/cwt sounds like a sigh of relief after February’s $18.95. It isn’t. That forecast still has to be delivered through a first quarter where Class III opened at $14.59 and February futures pointed to $15.16. The March WASDE held the 2026 Class III forecast at $16.65/cwt. Where does your breakeven actually sit if the back half doesn’t deliver?
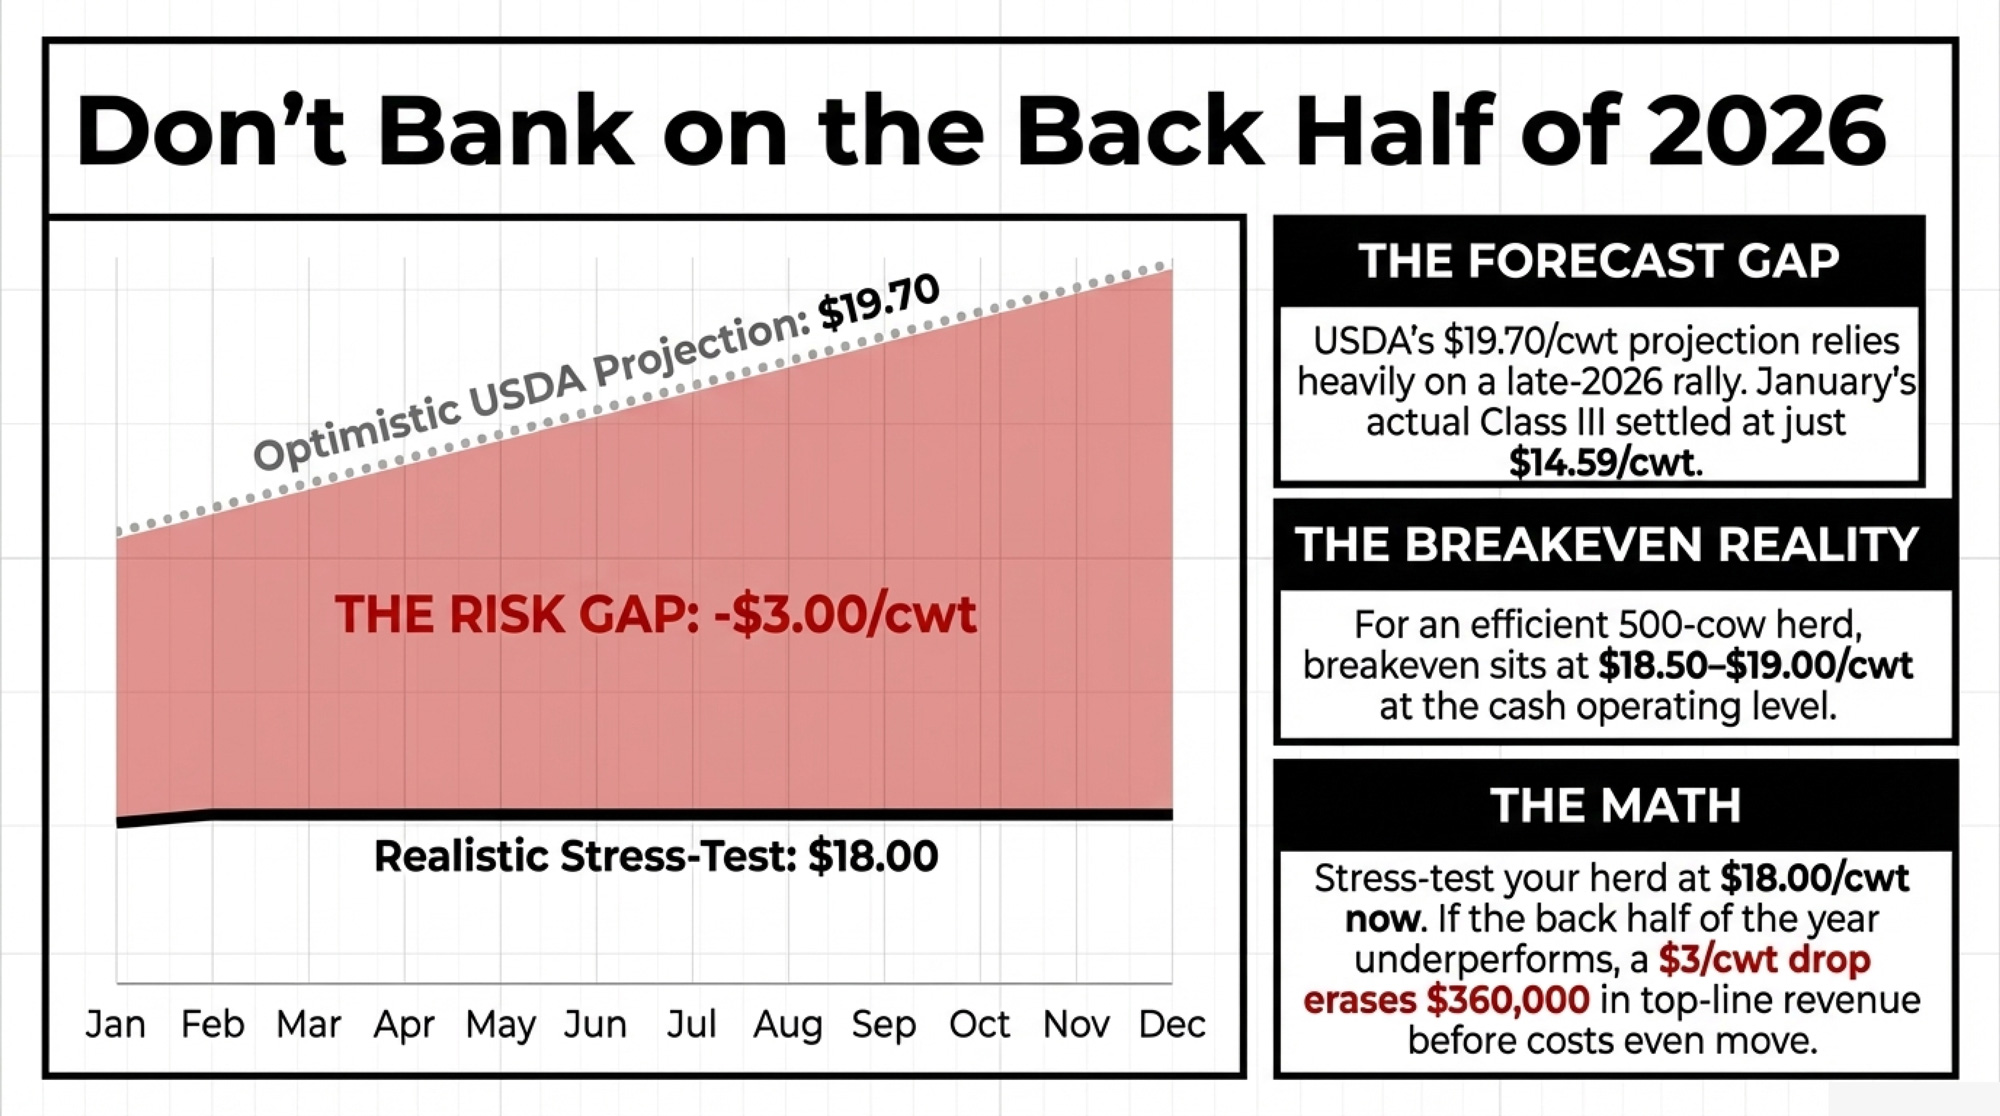
UW‑Madison’s July 2025 Dairy Enterprise Budget puts the cost of production — after co‑product revenue — at $18.68/cwt for its example operation. That lines up with Minnesota extension benchmarks in the same range. Call it $18.50–$19.00/cwt at cash operating level for a reasonably efficient 500‑cow herd shipping roughly 120,000 cwt — dropping unpaid family labor and some depreciation. That leaves a cash margin of $2.00–$2.50/cwt, or about $240,000–$300,000/year at a $21.00 mailbox.
Now stress‑test at $18.00/cwt — our realistic downside scenario if the back half underperforms USDA’s $19.70 forecast. That’s not the consensus. It’s where we think you should be testing.
Risk 1: Oversupply and Price Erosion
USDA’s March WASDE pegs 2026 production at 234.7 billion pounds, roughly 1.3% above 2025. If your effective mailbox averages $18.00/cwt instead of $21.00, that’s $3.00/cwt off your top line. On 120,000 cwt: –$360,000.
Risk 2: Processor Network and Hauling
FO30’s hauling jump is the baseline. Lose a plant or get rerouted — the way Henke and the Holles did — and it doesn’t take a disaster to lose another $0.75/cwt between basis and freight compared to recent history, on 120,000 cwt: –$90,000.
Risk 3: Labor and the New AEWR Rule
In October 2025, DOL split the Adverse Effect Wage Rate into Skill Level I and Skill Level II, tied to job duties. Cornell’s Ag Workforce team lays out how this hits dairy: a few words in a job description can move you from Level I to Level II. Nationally, CRS puts the Level I range at $7.35–$14.83/hour and Level II at $8.54–$21.16/hour — gaps of $1–$7+/hour depending on your state. In the upper Midwest dairy belt, that spread typically runs $4–$5/hour.
On a 500‑cow herd with roughly 20,800 paid hours/year (10 FTEs at 2,080 hours), a blended increase of $4.00–$4.80/hour — accounting for overtime, payroll burden, and housing — means $83,000–$100,000/year in extra labor cost.
Deep dive: The new AEWR labor math for dairy crews
The 500‑Cow Stress Test: Where $550,000 Vanishes
Here’s the math your lender may already be running on your file. We’re showing every input so you can plug in your own.
Baseline: 500 cows × 240 cwt/cow × $21.00/cwt = $2,520,000 revenue
Cash margin at $21.00: ~$2.00–$2.50/cwt → $240,000–$300,000/year
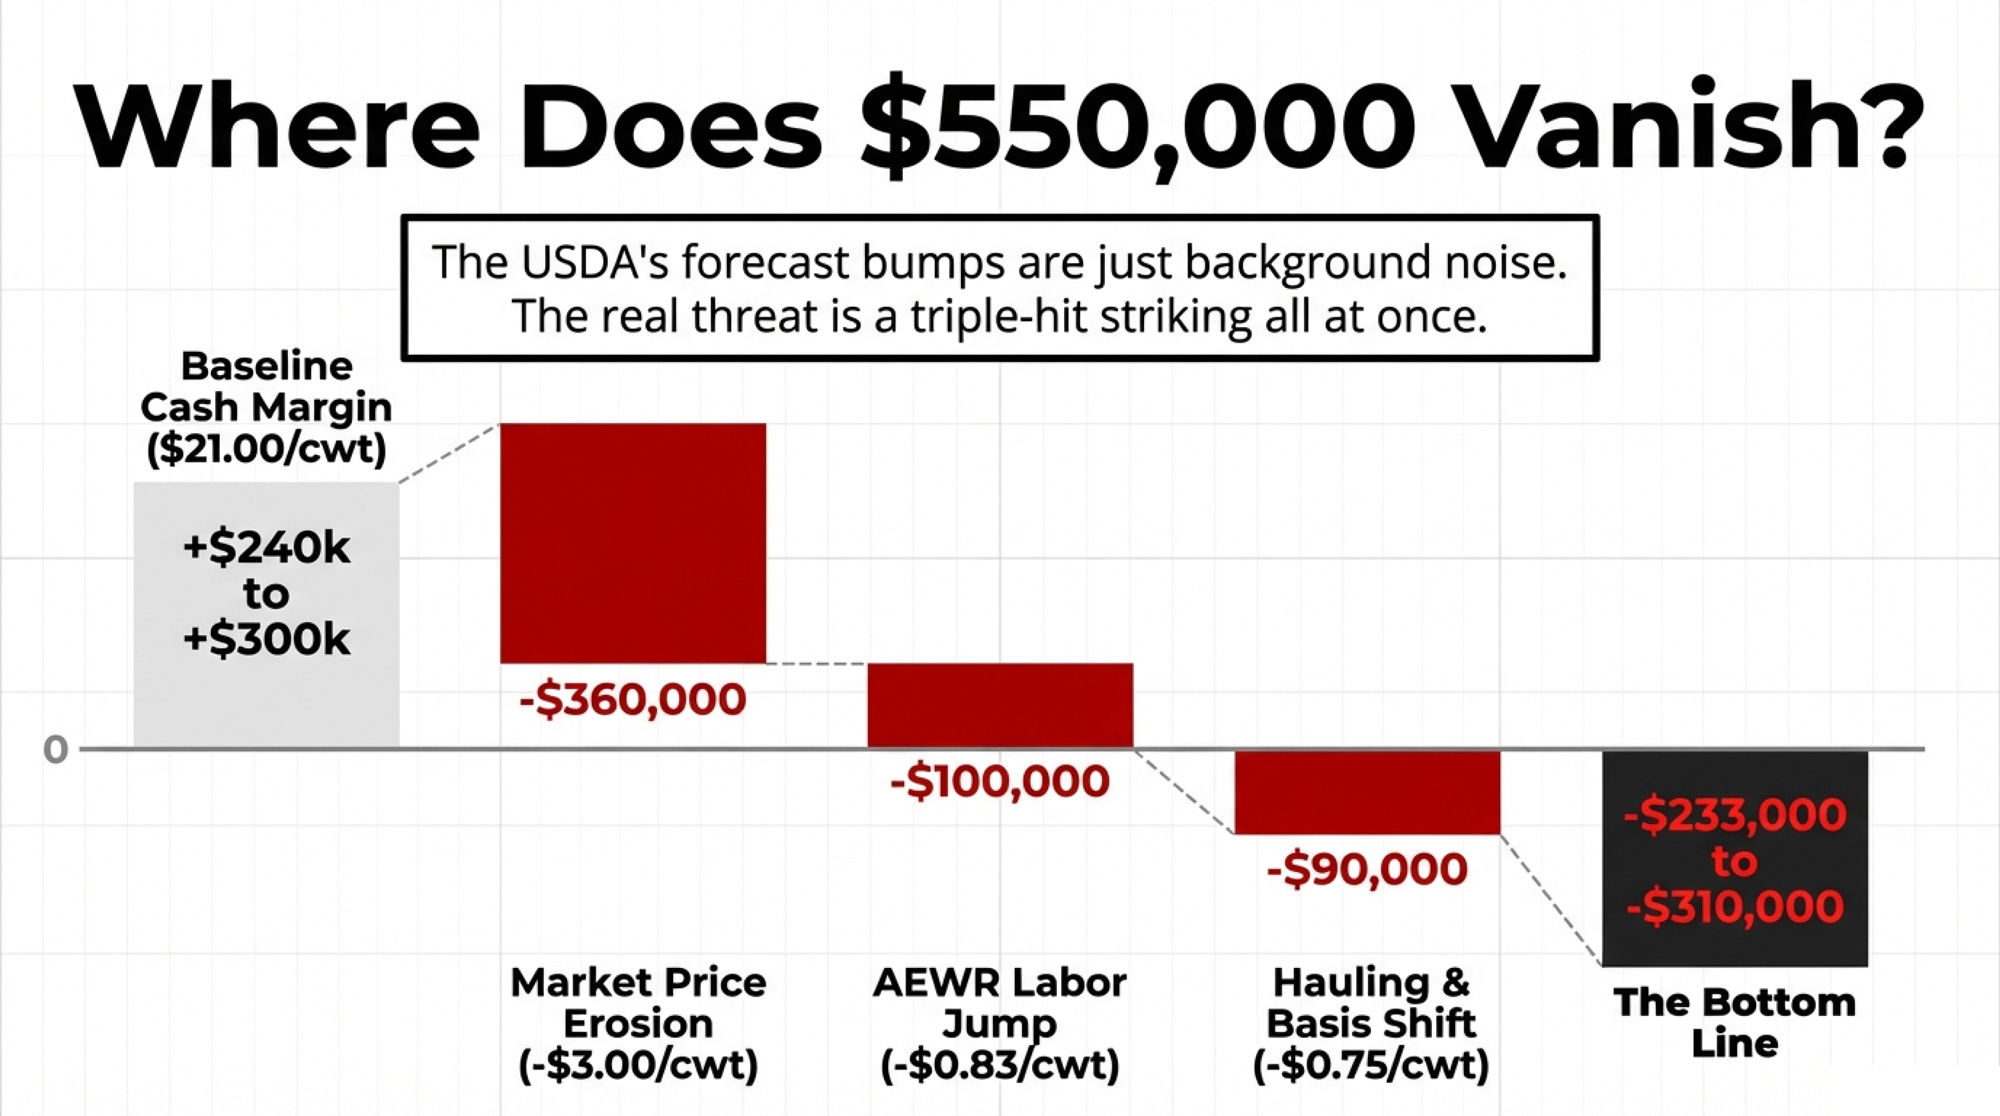
| Risk Factor | $/cwt Impact | Annual Loss (120k cwt) | Fixable by Producer? |
| Market price erosion (vs. $21 baseline) | –$3.00/cwt | –$360,000 | No — macro |
| Hauling & basis shift (FO30, +29.8%) | –$0.75/cwt | –$90,000 | Partial — processor mapping |
| AEWR labor reclassification (H-2A) | –$0.69 to –$0.83/cwt | –$83,000 to –$100,000 | Yes — job-duty audit |
| TOTAL COMPOUND HIT | –$4.44 to –$4.58/cwt | –$533,000 to –$550,000 | — |
| Baseline cash margin (at $21/cwt) | +$2.00 to +$2.50/cwt | +$240,000 to +$300,000 | — |
| Net modeled cash position | –$1.94 to –$2.58/cwt | –$233,000 to –$310,000 | — |
*AEWR hit converted to milk terms: $83,000–$100,000 ÷ 120,000 cwt = $0.69–$0.83/cwt.
Stack that against the baseline margin: best case, $300,000 minus $533,000 = –$233,000. Worst case: $240,000 minus $550,000 =– $310,000. Modeled cash margin: –$233,000 to –$310,000.
Now add debt service. A 500‑cow herd that expanded in the 2020–2023 cycle can easily carry $3–$5 million in term debt between facilities, equipment, and replacement stock alone — USDA AMS pegged the national average replacement dairy cow at $3,110/head as recently as October 2025, meaning the animal inventory on a 500‑cow herd represents north of $1.5 million before you count a single piece of concrete. At current rates and 15–20‑year amortizations, $3–$5M in term debt often pencils to $350,000–$450,000/year in principal and interest. Stack a working figure of $400,000 P&I on top of that negative cash margin, and you’re modeling a shortfall between –$633,000 and –$710,000/year before you pay yourselves a dollar.
That’s not a tight year. That’s a year where your lender is choosing which playbook you’re on.
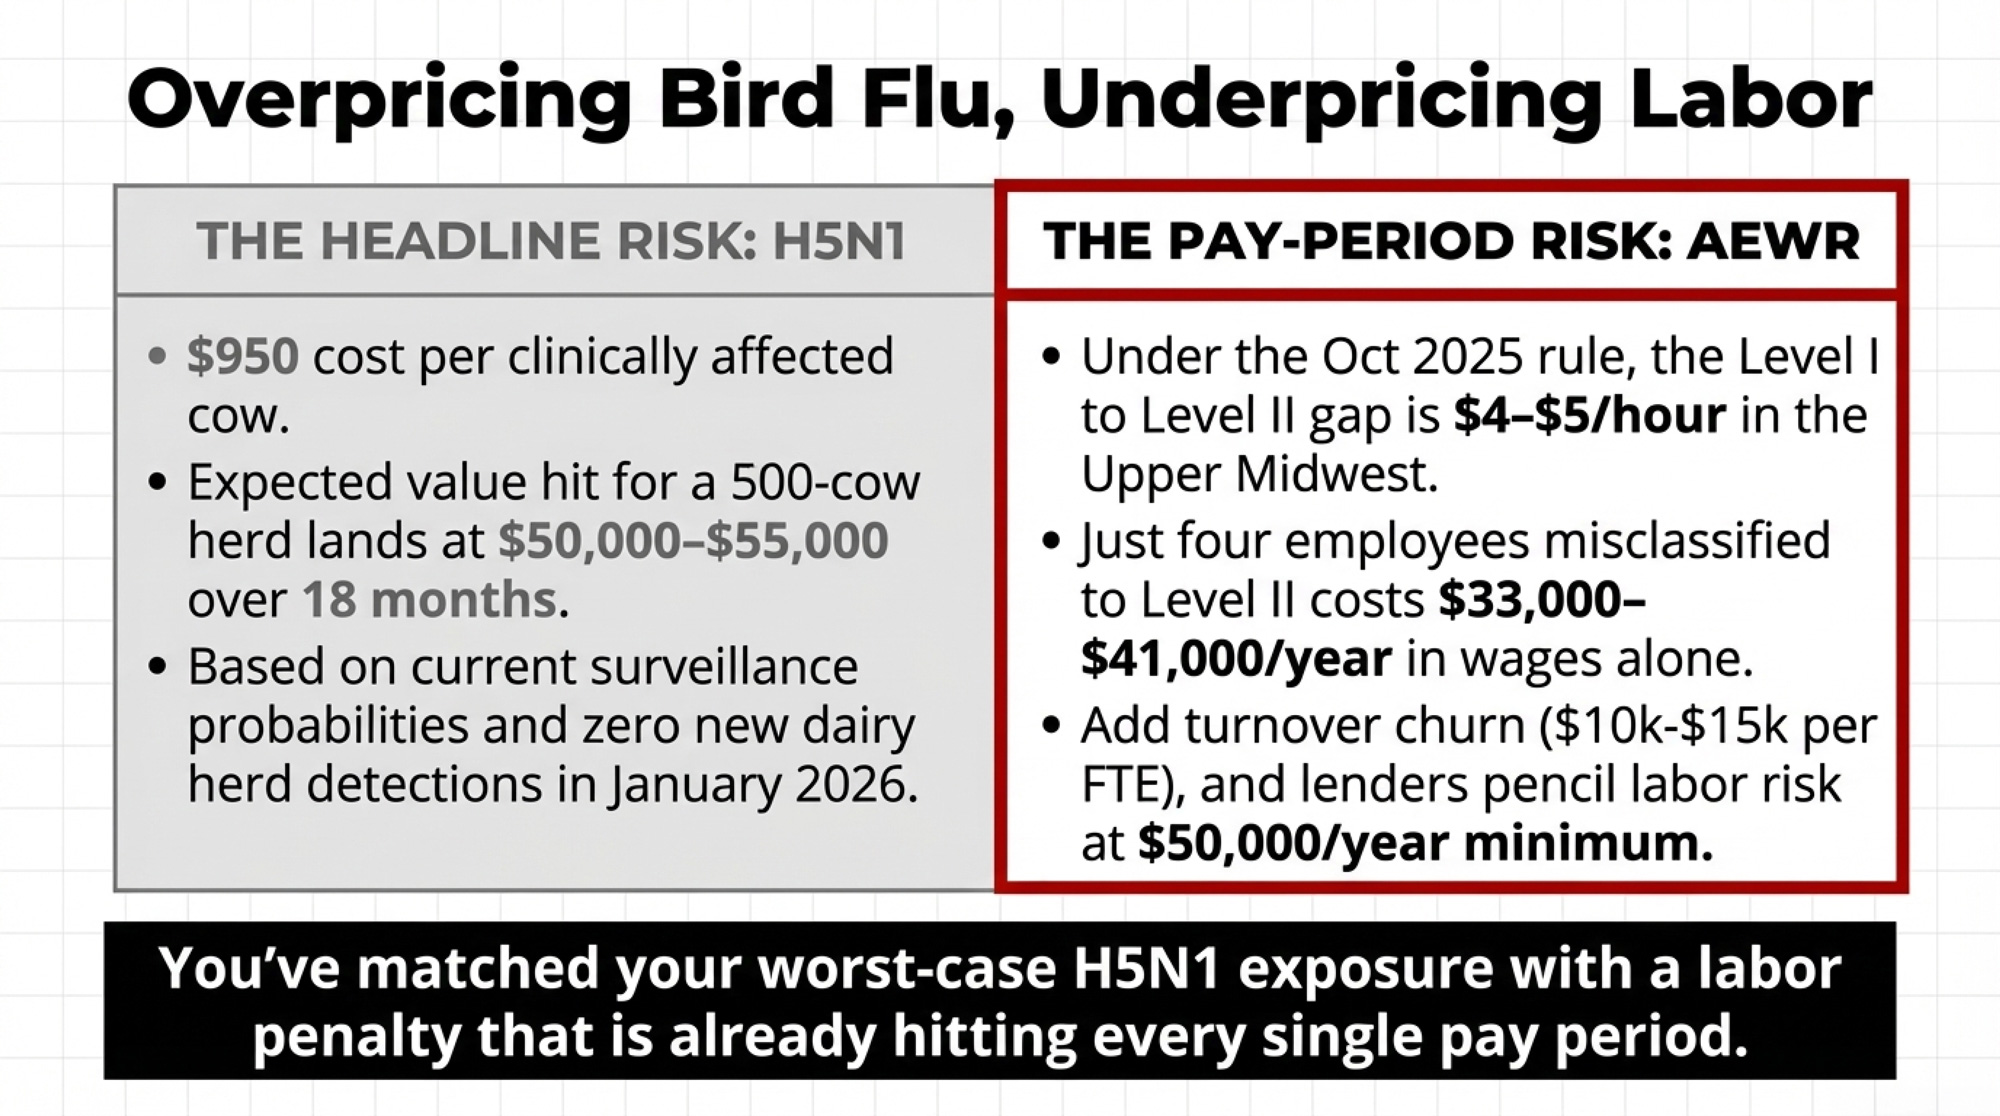
Are You Overpricing H5N1 and Underpricing Labor?
H5N1 grabs the headlines. The math says plan for it — but don’t let it crowd out the risk that’s already in your pay stubs.
| Risk Metric | H5N1 (HPAI) | AEWR Labor Reclassification |
|---|---|---|
| Best-case annual cost (500-cow herd) | ~$0 (no outbreak) | $33,000–$41,000 (4 mis-slotted FTEs) |
| Expected value (probability-weighted) | $50,000–$55,000 over 12–18 months | $83,000–$100,000/year (certainty if mis-classified) |
| Worst-case hit | $142,500–$166,250 (30–35% clinical rate) | $100,000+/year (10 FTEs, Level II gap) |
| Fixable this month? | No — biosecurity reduces, doesn’t eliminate | Yes — job-duty audit + Cornell AEWR checklist |
| Currently in your breakeven? | Rarely modeled | Almost never modeled |
| 2026 trajectory | Stabilizing (0 new dairy cases, Jan 2026) | Escalating — new DOL rule effective Oct 2025 |
| Per-cow annual exposure | $100–$333/clinically affected cow | $165–$200/FTE/year in wage gap |
A Cornell‑led team published results in Nature Communications from an Ohio dairy herd of 3,876 cows hit by HPAI in spring 2024. They counted 777 clinically affected cows — about 20% of the herd — with severe mastitis and steep production drops. Over 60 days, total losses: $737,500, or roughly $950 per clinically affected cow. As of early 2026, USDA APHIS data and AVMA tracking put cumulative confirmed H5N1 dairy infections at more than 1,000 herds across at least 17 states — California alone accounts for more than 750.
But here’s a detail that hasn’t made most farm papers: USDA reported zero new dairy herd detections in January 2026. The outbreak appears to have peaked during California’s fall 2024 wave. The National Milk Testing Strategy is now active in 45 states.
Scale the Cornell numbers to 500 cows if 20% are clinically hit at $950 each: $95,000. Push the clinical rate to 30–35%, and you’re in the $142,500–$166,250 range. Weight those outcomes by rough probability — heavy event at ~10%, moderate at ~40%, minimal at ~50% — and the expected value for a 500‑cow herd lands around $50,000–$55,000 over the next 12–18 months. Those probability weights are our assessment based on current surveillance trends, not the USDA’s.
Now put that beside labor. Under the 2025 AEWR rule, four FTEs misclassified from Level I to Level II cost about $33,000–$41,000/year in wages alone — that’s 4 workers × 2,080 hours × $4–$5/hour. Add one FTE’s churn cost — mistakes, training, yield drag — and lenders will quietly pencil labor risk at $40,000–$50,000/year. You’ve matched your H5N1 expected value with exposure that’s already hitting every pay period.
The Holles spent 2025 worrying more about where their milk was going and whether they could hold a crew than whether a virus would cross their fence line. Line up the math, and that instinct looks smart.
Deep dive: What the H5N1 data actually says about herd‑level cost
The Lender Meeting Your Milk Check Is Writing
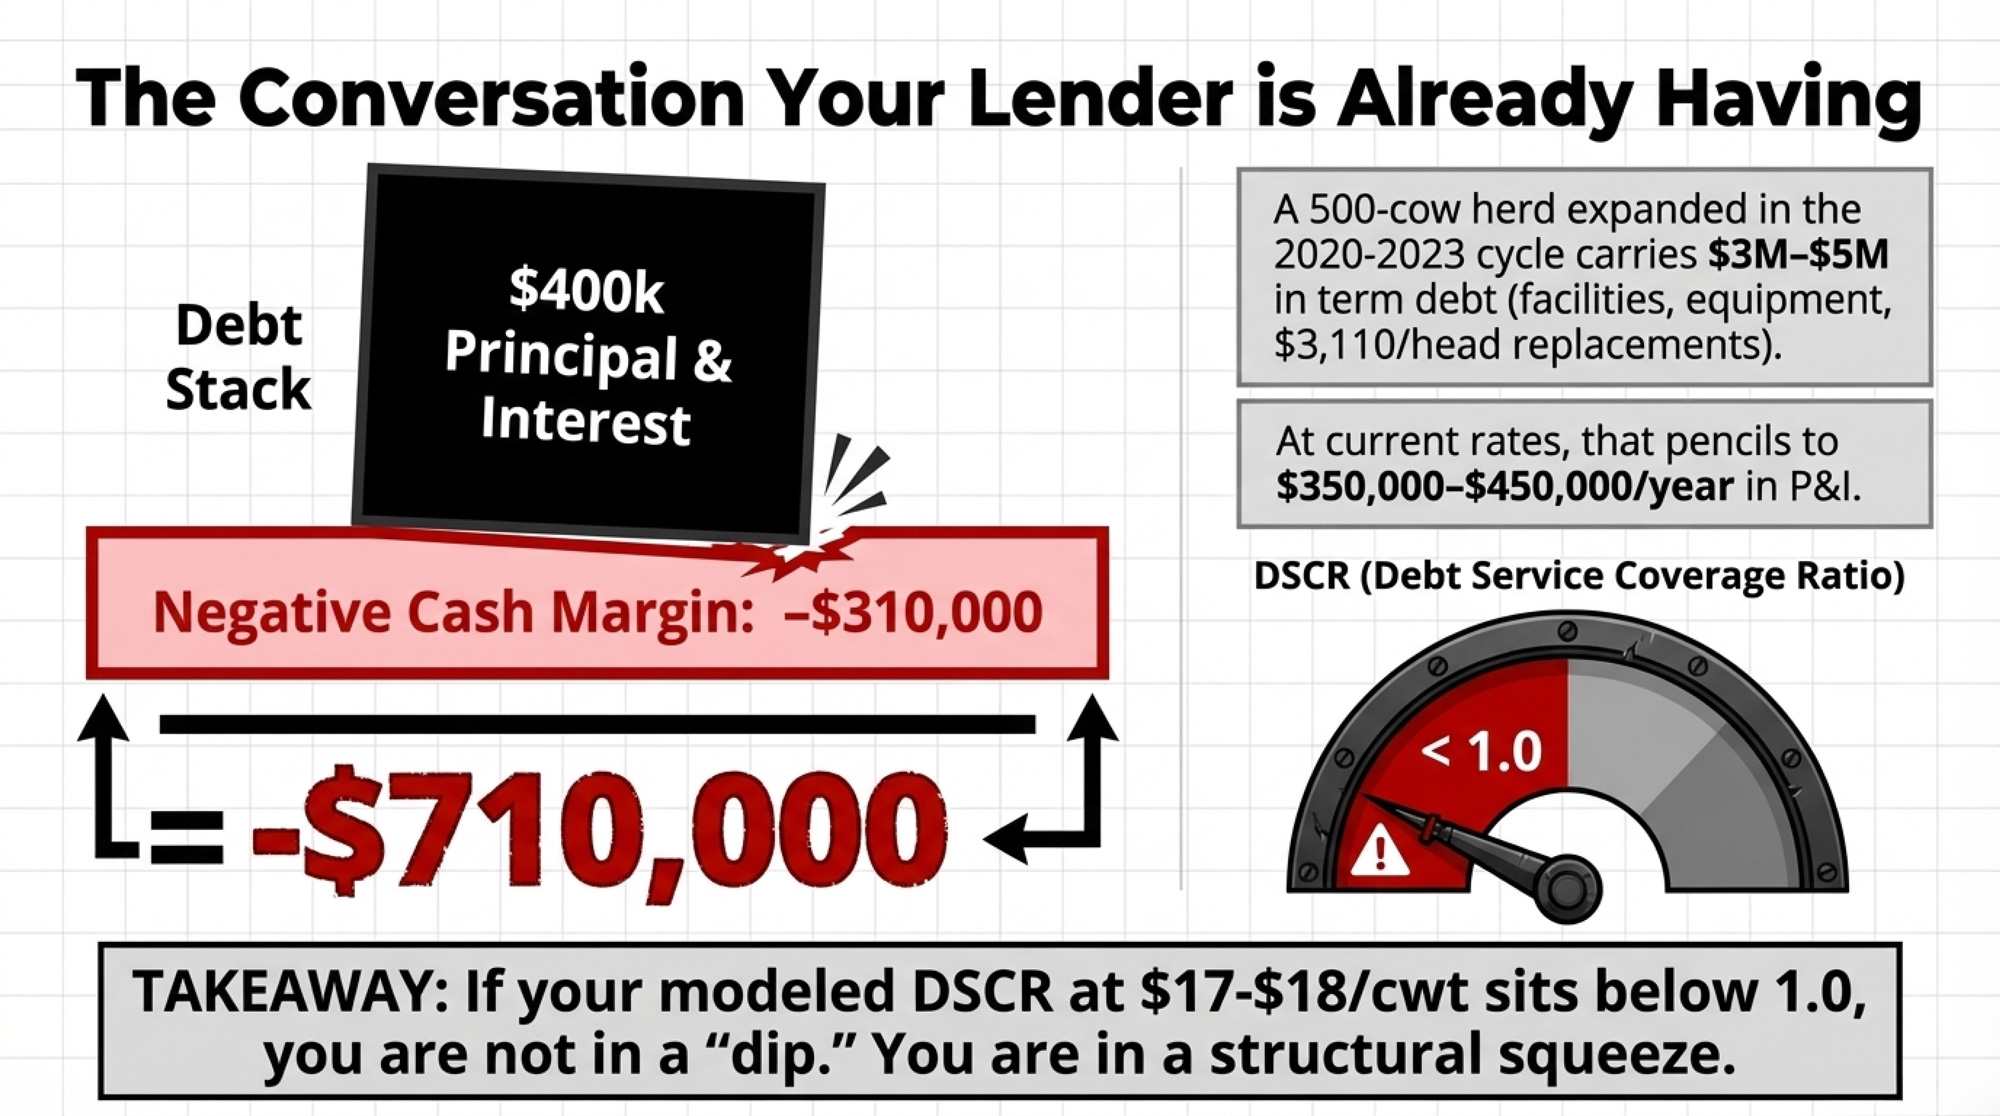
When a herd staring at a modeled –$633,000 to –$710,000 gap sits across the desk from a lender, nobody’s leading with forage quality. The real question: Is there a believable path back to positive cash flow in 12–24 months?
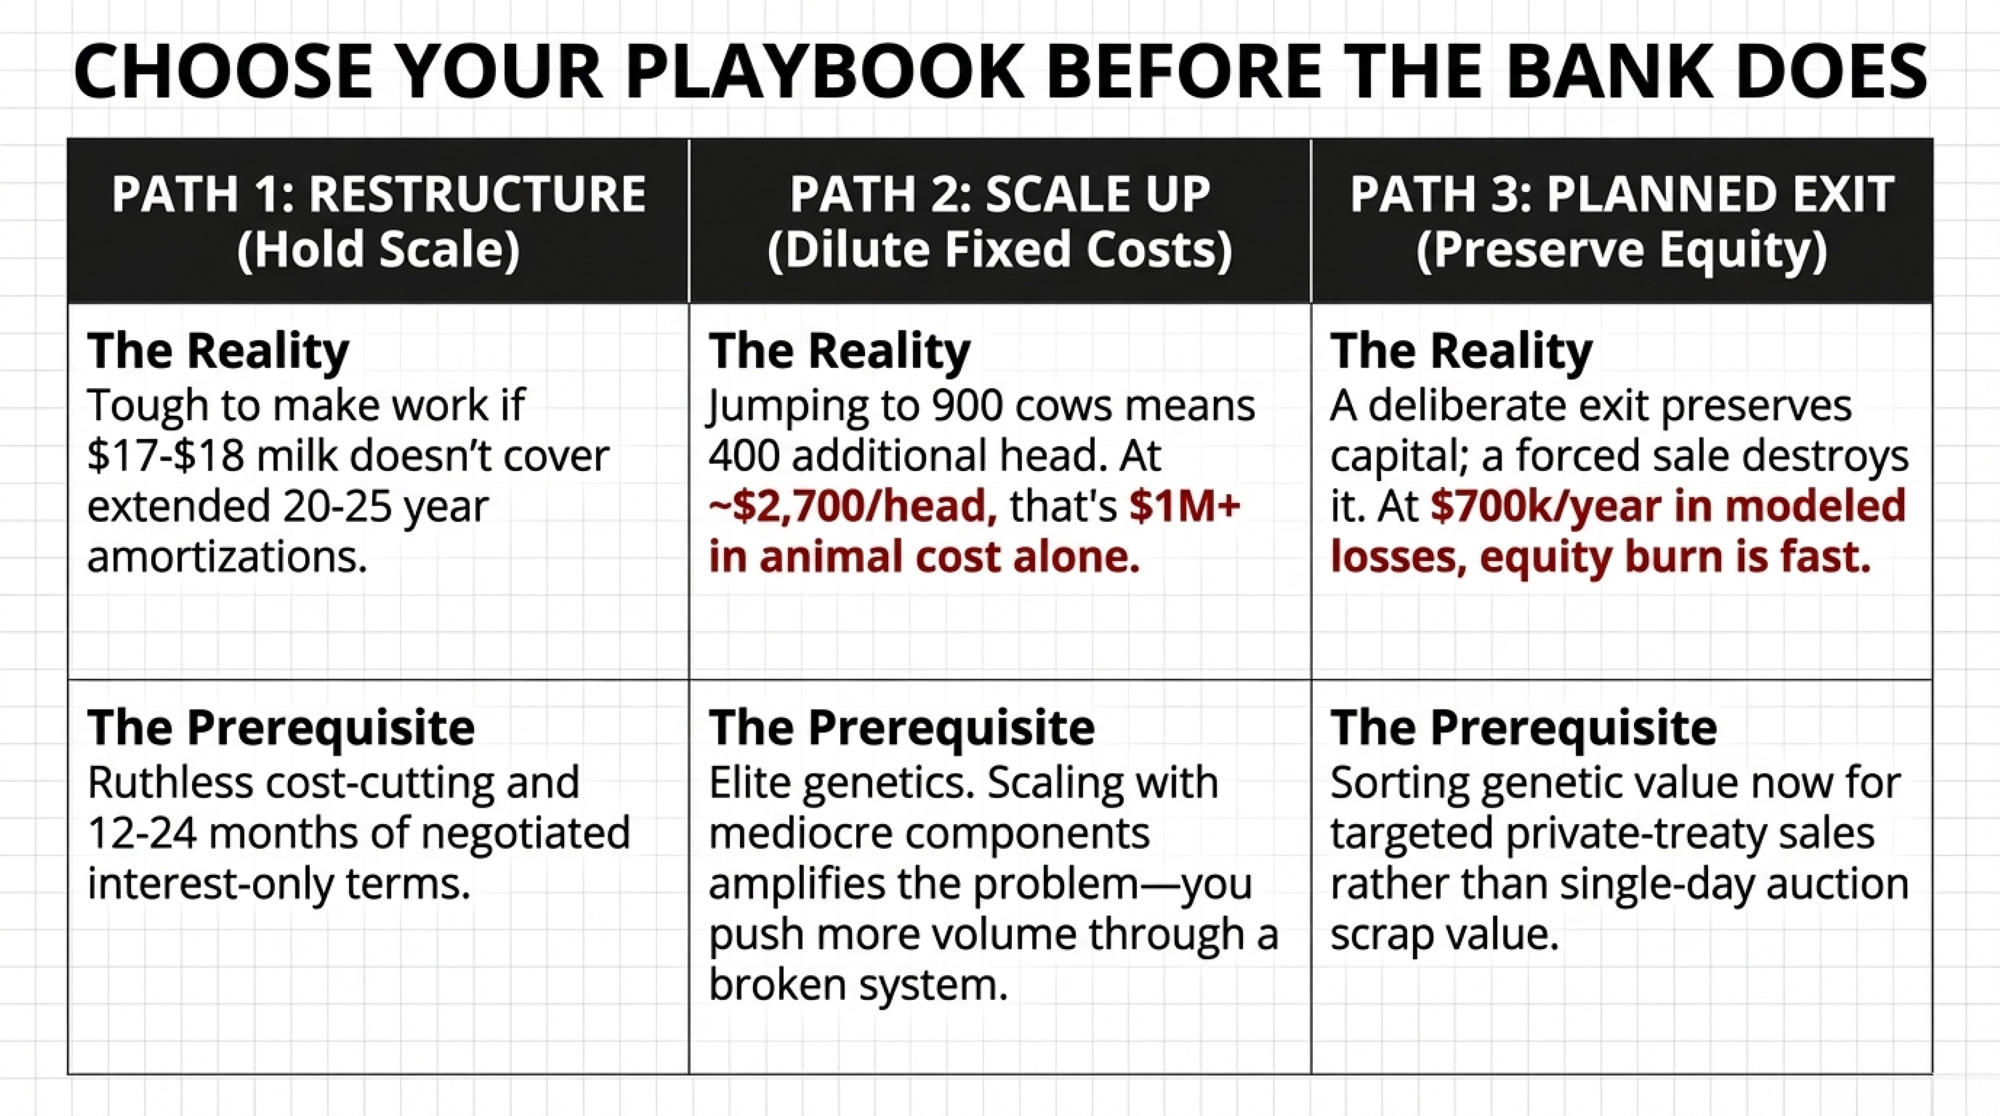
Path 1 — Restructure at today’s scale. Stretch terms to 20–25 years, negotiate interest‑only for 12–24 months, and sell non‑essential assets. It only works if a 2027 budget at $17.00–$18.00/cwt still reaches breakeven on realistic costs. For herds in the Holles’ geography — one in‑state plant at Fargo, longer hauls, fewer competing buyers — that’s a tough line to draw.
Path 2 — Scale up to dilute fixed cost. Jumping from 500 to 900 cows means ~400 additional head. USDA AMS data from October 2025 put the national average replacement dairy cow at $3,110/head, with premium genetics running $4,000+ at auction in California, Minnesota, and Pennsylvania. By the February 2026 National Dairy Comprehensive Report, average fresh‑cow prices had eased to around $2,700/head — but that’s still north of $1 million in animal cost alone for 400 head, before facilities. If 2026 milk ends up closer to $17–$18/cwt, those extra cows don’t magically fix two‑year cash flow. You gain scale. You put more equity on the table.
And if you’re thinking Path 2, the cows you add can’t just be black‑and‑white lawn ornaments. In a $17–$18/cwt world, you need animals that turn feed into components, hit pregnancy targets, and stay out of the sick pen. Scaling with mediocre genetics amplifies the problem — you push more volume through a system that still doesn’t pay its bills.
Path 3 — Plan an exit while you still have a say. At $600,000–$700,000/year in modeled losses, equity burn is fast. That’s maybe two or three bad years before the balance sheet no longer lets you choose how the story ends. A deliberate exit — cows first, then iron, then land — preserves more capital than a forced sale.
If you’re leaning toward Path 3, your genetic equity is your last paycheck. The top end of your herd — high‑component, trouble‑free, exportable cow families — often pays better through targeted private‑treaty sales than by sending everything on the same trailer on the same day. Sorting that value ahead of time is how you turn 20 years of breeding decisions into actual exit dollars instead of scrap value.
The point of this math isn’t to push anyone into Path 3. It’s to drag the conversation into Q2, while you still have options, rather than into Q4, when your lender writes the plan.
The 90‑Day Triage: Levers You Actually Control
Clean Up AEWR Exposure — This Month
Download Cornell’s October 2025 AEWR overview and match every H‑2A position to DOL’s Level I vs. Level II duty definitions — not the labels you’ve always used. In the upper Midwest dairy belt, that spread typically runs $4–$5/hour. Four mis‑slotted FTEs cost roughly $33,000–$41,000/year in wages. That’s the same order of magnitude as the modeled H5N1 expected value we just walked through — and it’s a lever you control with a pen and a clear job list.
Run Two Breakevens With Your Lender Before June 30
Build one 2026 budget at $18.00/cwt and a second at $16.50/cwt, using your actual cost structure. If your pro‑forma DSCR comes in below 1.0 in either scenario, you’re in path territory, not ride‑it‑out territory. Above 1.3, you’ve got breathing room. Between 1.0 and 1.2, small misses matter. Two quarters under 1.0, and someone else starts drawing the map.
Go After Turnover and Inputs
- Plug one FTE of churn. The real cost of a churned dairy FTE — training, mistakes, production drag — runs $10,000–$15,000/year.
- Pick a nitrogen trigger. DTN’s late‑January survey had urea at $583/ton, roughly 13–14% above the $514/tona year earlier. StoneX’s Josh Linville flagged Persian Gulf risk as a fertilizer wildcard. If local urea drops within ~5% of last year’s level, lock in at least a third of your 2026 N.
- Pick one micro‑automation project with a sub‑18‑month payback. At a loaded labor cost of nearly $19.50/hour, saving 1,000 hours/year frees up about $19,500. Against ~$25,000 installed, that’s a 15‑month payback.
For herds in the Holles’ position — one plant option, five‑hour hauls, limited buyer competition — the processor‑mapping bullet below isn’t theoretical. It’s their Tuesday.
Three Signals That Could Rewrite This Math
Not all of this has to land. Here’s what changes the picture — in either direction.
USDA’s production line. March’s projection of 234.7 billion pounds is already above 2025. If actual output runs meaningfully lower — tighter base penalties, faster culling, a shorter heifer pipeline — oversupply risk eases and the price outlook improves. If USDA revises upward again, the $16.50 scenario gets more likely, not less.
H5N1 trajectory. Cumulative detections sit above 1,000 herds, but zero new dairy cases in January 2026 and an active testing program in 45 states suggest the outbreak has stabilized. If herd prevalence rebounds or movement restrictions tighten at the marketing‑area level, H5N1 moves back up the risk radar. If the current trend holds, it’s a biosecurity discipline issue, not a budget emergency.
The USMCA review. Article 34.7 mandates the first joint review by July 1, 2026. If it triggers tariff changes, quota shifts, or retaliation that trims U.S. dairy exports, those extra domestic pounds need a home. That leans your budget toward $16.50, not $18. A clean review, on the other hand, removes a significant overhang.
And the upside case? If actual 2026 all‑milk lands at $20.50 — plausible if production underruns the forecast and export demand holds — the same 500‑cow herd picks up roughly $96,000 in gross revenue vs. the $19.70 base case. That’s not transformative on its own. But it’s the difference between Path 1 working and Path 1 failing.
What This Means for Your Operation
- Build two 2026 budgets with your lender before June 30 — one at $18.00/cwt, one at $16.50/cwt. If DSCR is under 1.0 in either, you’re choosing between restructure, scale, or exit, whether you say it aloud or not.
- Quantify your own triple‑hit. Multiply your shipped cwt by $3.00 for price, then by $0.75 for basis/hauling, then add your state’s AEWR gap times your labor hours. If that combined number exceeds last year’s operating margin, you’re in a structural squeeze — not a cyclical one.
- Audit every H‑2A job level in writing this month. Four mis‑slotted FTEs cost $33,000–$41,000/year,depending on your state’s gap, for zero extra production.
- Map your processor risk on paper. List your primary plant, realistic backups, miles to each, and expected basis in each scenario. If your “backup” relies on full plants hundreds of miles away, that risk isn’t in your breakeven yet.
- If you’re considering Path 2 (scale), sort your genetics first. Every cow you add at $17–$18 milk needs to earn her way on components and fertility, not just fill a stall. At $2,700–$3,100/head for replacement stock, that’s real capital riding on whether she pays her own way.
- If you’re considering Path 3 (exit), sort your genetics first, too. Targeted sales of high‑component, high‑index cow families before a dispersal can capture breeding value that a single‑day auction won’t.
- Set a 365‑day marker. By March 2027, you should know whether you’re on a three‑year rebuild, an expansion track, or an orderly exit — and have that documented in writing with your lender.
Key Takeaways:
- If your 2026 budget only works above $19–$20/cwt, you’re already in the risk band where a 500‑cow herd can model a $633,000–$710,000/year shortfall once price, freight, labor, and debt stack.
- A realistic “downside but not disaster” scenario is $18.00/cwt milk, –$3.00/cwt price erosion, –$0.75/cwthauling/basis, and $0.69–$0.83/cwt AEWR labor — together stripping $533,000–$550,000 from a 500‑cow herd’s annual margin.
- Four mis‑slotted H‑2A positions can quietly cost $33,000–$41,000/year in wages; that’s roughly the same order of magnitude as your expected H5N1 hit, and it’s fixable this month with a clean job‑duty audit.
- If your pro‑forma DSCR drops below 1.0 at $18.00 or $16.50/cwt, you’re not “riding out a rough year” — you’re choosing between restructure, scale with real equity, or planning an exit while you still control the timing.
- Your best 90‑day moves are boring, not heroic: run two lender scenarios at $18.00 and $16.50/cwt, quantify your own triple‑hit per cwt, map real backup plants and miles, and write down a 365‑day plan you’d be willing to put in front of your banker.
The Bottom Line
If your 500‑cow budget only works above $19–$20/cwt with today’s cost and debt structure, you’re already in the risk band this stress test describes — whether or not USDA’s March revision to $19.70 felt like good news.
If your modeled DSCR at $17–$18/cwt sits below 1.2, you’re not trimming fat. You’re in a structural conversation, your lender is already having internally.
The Holles are five hours from their plant, down two processors in three years, and still milking. That’s grit. But grit doesn’t fix a –$633,000 gap. Math does. And the math starts with knowing your own number before someone else runs it for you.
 The Sunday Read Dairy Professionals Don’t Skip.
 The Sunday Read Dairy Professionals Don’t Skip.
Every week, thousands of producers, breeders, and industry insiders open Bullvine Weekly for genetics insights, market shifts, and profit strategies they won’t find anywhere else. One email. Five minutes. Smarter decisions all week.
Learn More
- Dairy Labor on a Knife Edge: 70% Undocumented, $52.8B at Risk, and the 500‑Cow Choice Between Wages, Robots, or Exit – Gain a bulletproof labor survival plan that delivers a 30-day checklist for auditing your true costs. This breakdown exposes the $30,000 monthly hit from crew disruptions and arms you with immediate strategies to secure your parlor.
- Why Dairy Markets Can’t Self-Correct Anymore: The Hidden Forces Reshaping the Dairy Industry’s Future – Secure your long-term position by mastering the multi-revenue shift that is currently consolidating the industry. This analysis reveals how energy and beef-on-dairy premiums protect your balance sheet when traditional milk markets fail to self-correct.
- Genetic Correlations Upended: Why Sticking with Old Breeding Indices Could Cost Your Dairy $486 Per Cow – And What the Data Really Proves – Reveals a hidden $486 per cow profit opportunity by exploiting the 2025 genetic base changes. This analysis exposes why traditional breeding kills profit in a tight market and delivers the component-heavy selection strategy required to offset input costs.
Complete references and supporting documentation are available upon request by contacting the editorial team at editor@thebullvine.com.