


A 90¢/cwt FMMO cut, $3,010 heifers, and DMC at $9.50. Are your 2026 plans actually built for this math?
Executive Summary: USDA’s June 2025 FMMO changes cut 85–93¢/cwt from class prices and $337 million from producer pool revenues in 90 days, effectively shifting many herds’ breakevens into the $18.75–$19.00/cwt range. For a 300‑cow, 7,500‑lb herd, that’s roughly $19,000–$21,000 gone from annual milk income before feed or futures even enter the conversation. CoBank’s latest work adds another pressure point: replacement heifer inventories at a 20‑year low, projected to shrink by 800,000 head while $10 billion in new processing capacity comes online and average replacements hit about $3,010/head. U.S. cheese and butter exports are booming only because they’re cheap—cheddar 40–60¢/lb under the EU and butter $1.09/lb lower—so that “good news” can flip fast if spreads close. This article lays out four hard‑nosed moves: rebuild your breakeven off 2025 milk checks, use $9.50 Tier 1 DMC as a structural margin tool, close 2027 replacement gaps before pushing more beef semen, and stress‑test your buyer and export exposure before basis and premiums do it for you.
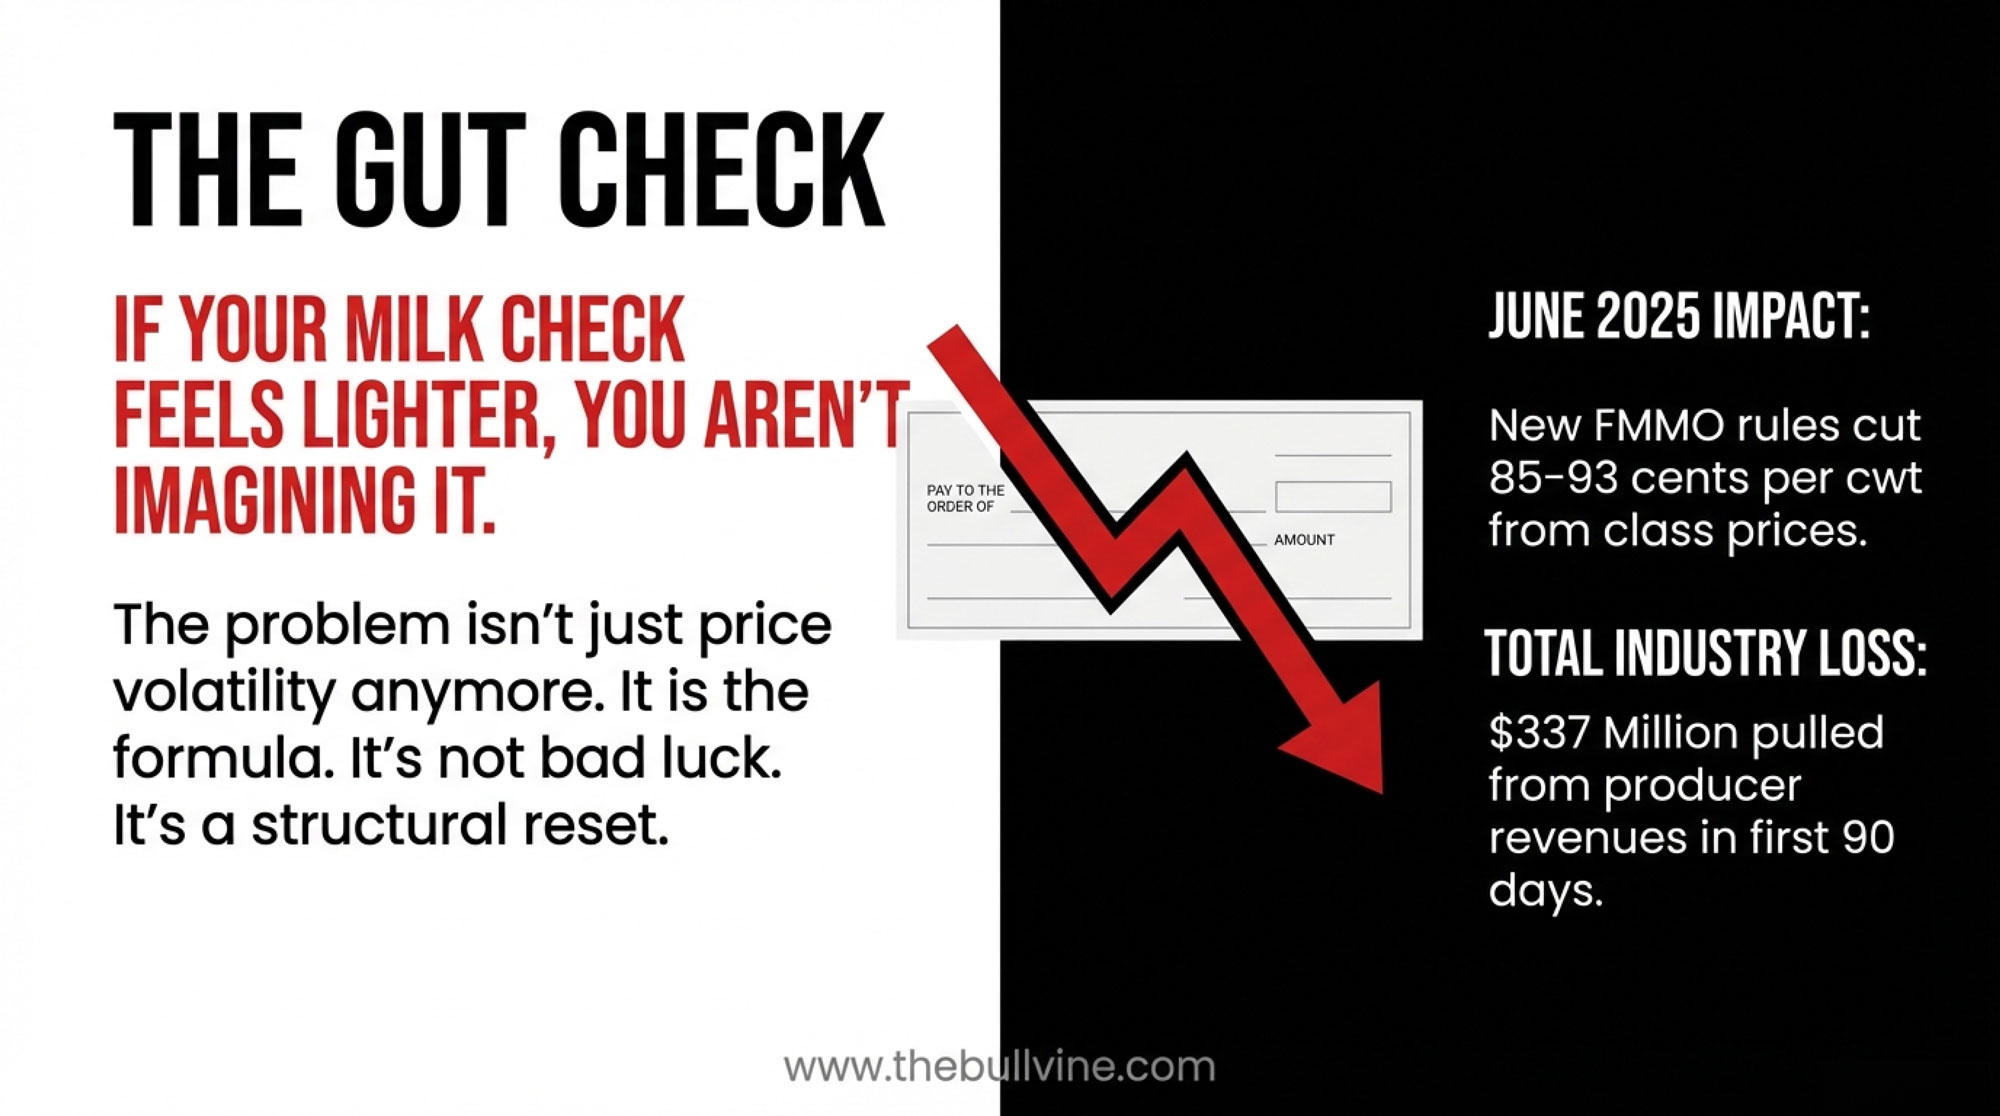
If your milk check feels lighter than your markets suggest, you’re not imagining it. The problem isn’t just price volatility anymore. It’s the formula.
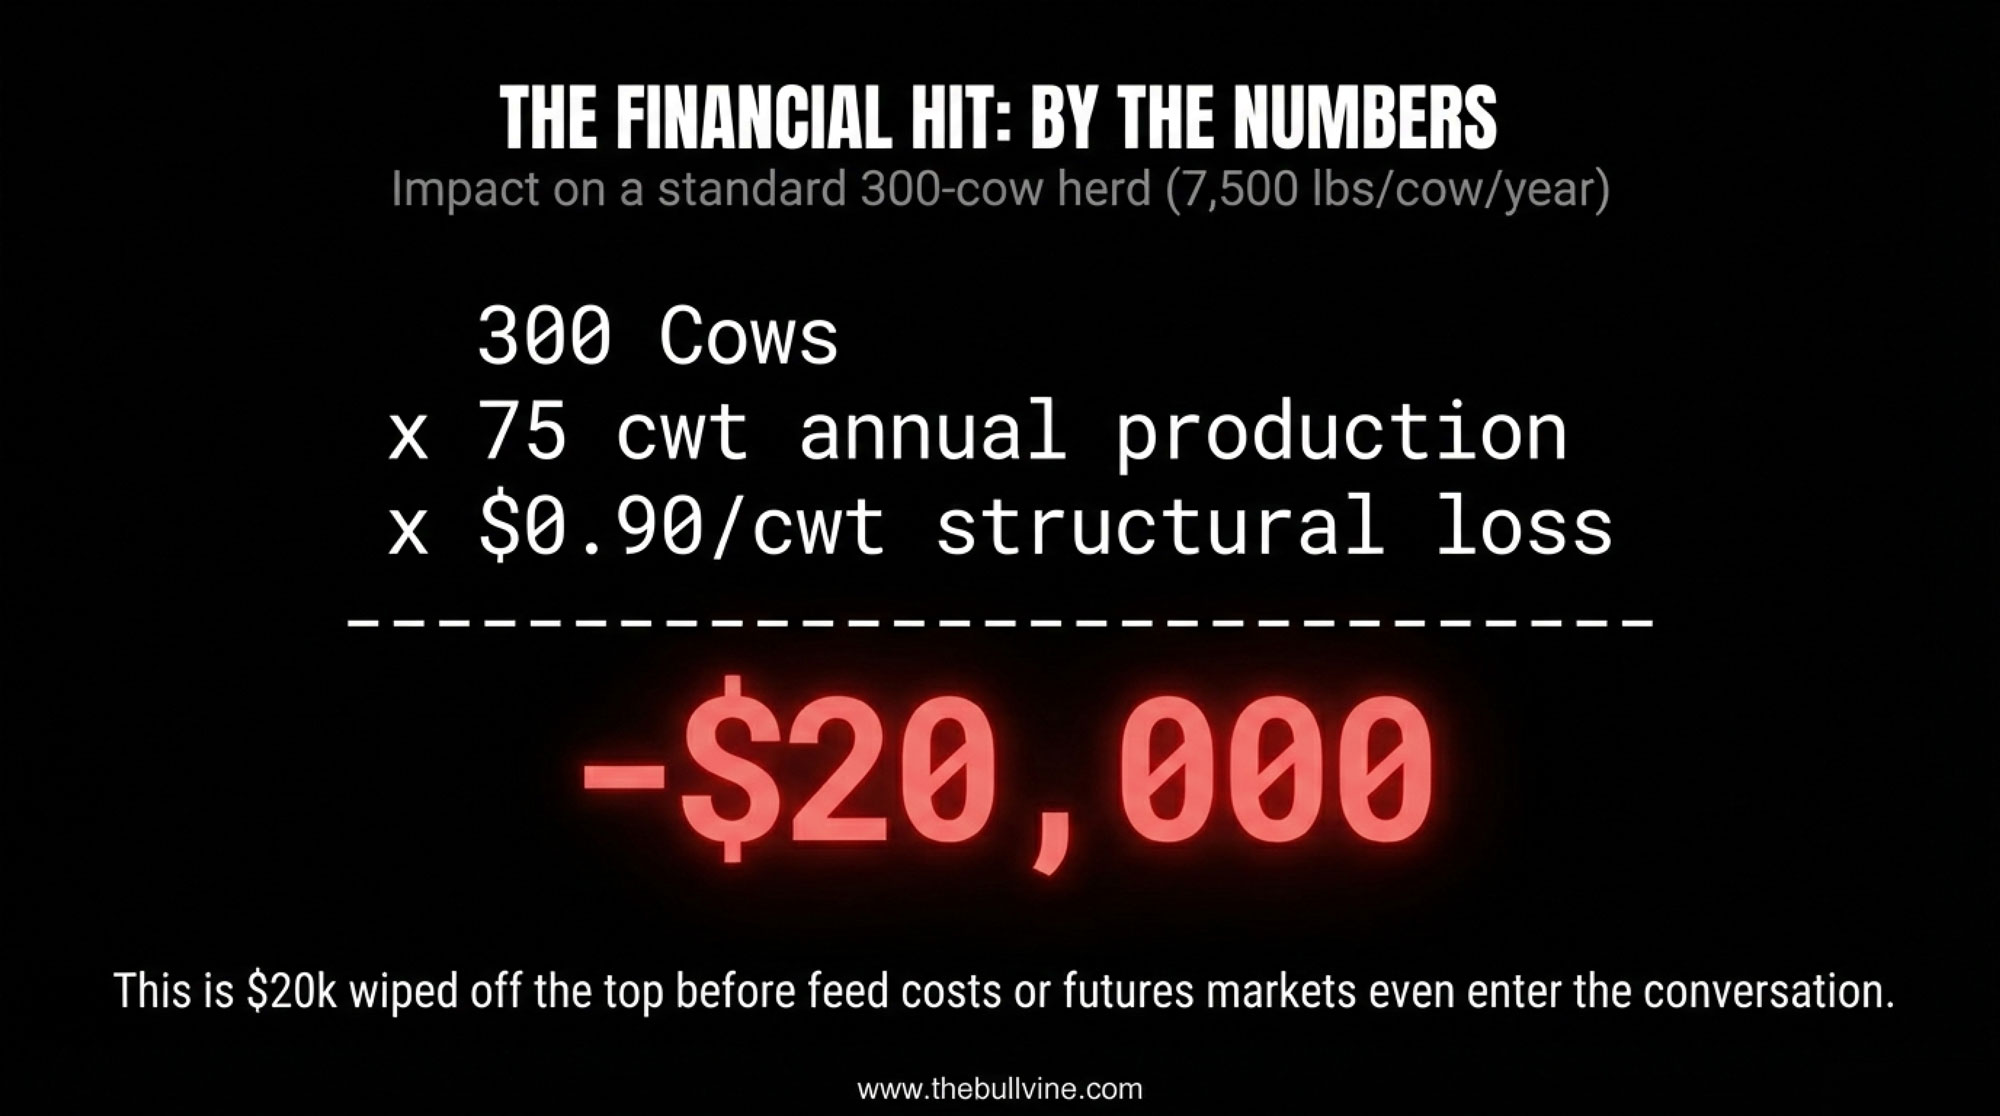
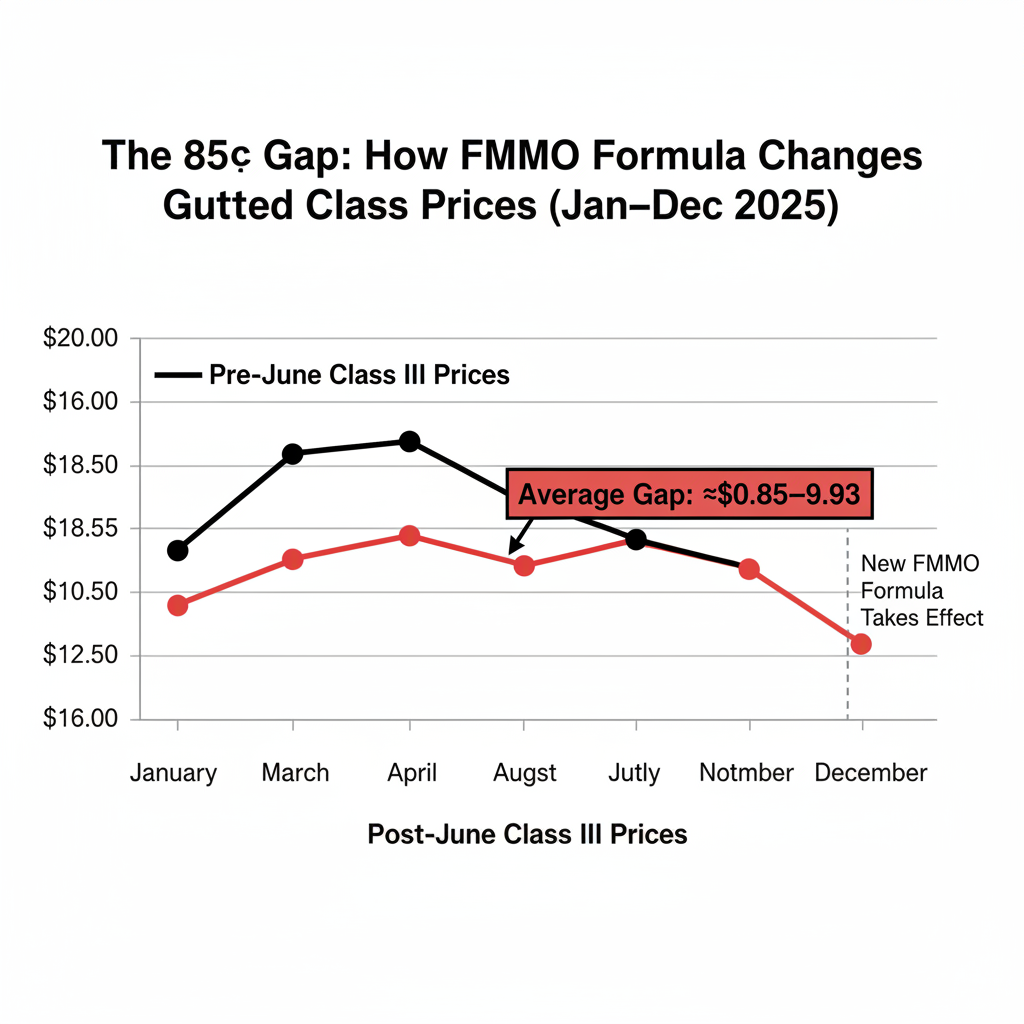
June 2025 didn’t just tweak how milk prices are calculated. It pulled 85–93 cents per hundredweight out of U.S. class prices in the first three months under the new Federal Milk Marketing Order rules, cutting about $337 million from nationwide pool revenues for farms shipping into U.S. FMMOs, according to American Farm Bureau Federation Market Intel’s “Three Months In: Early Impacts of FMMO Amendments” (September 21, 2025). For a 300‑cow herd averaging 7,500 pounds per cow per year—about 22,500 cwt—that single structural shift works out to roughly $19,125–$20,925 less annual revenue.
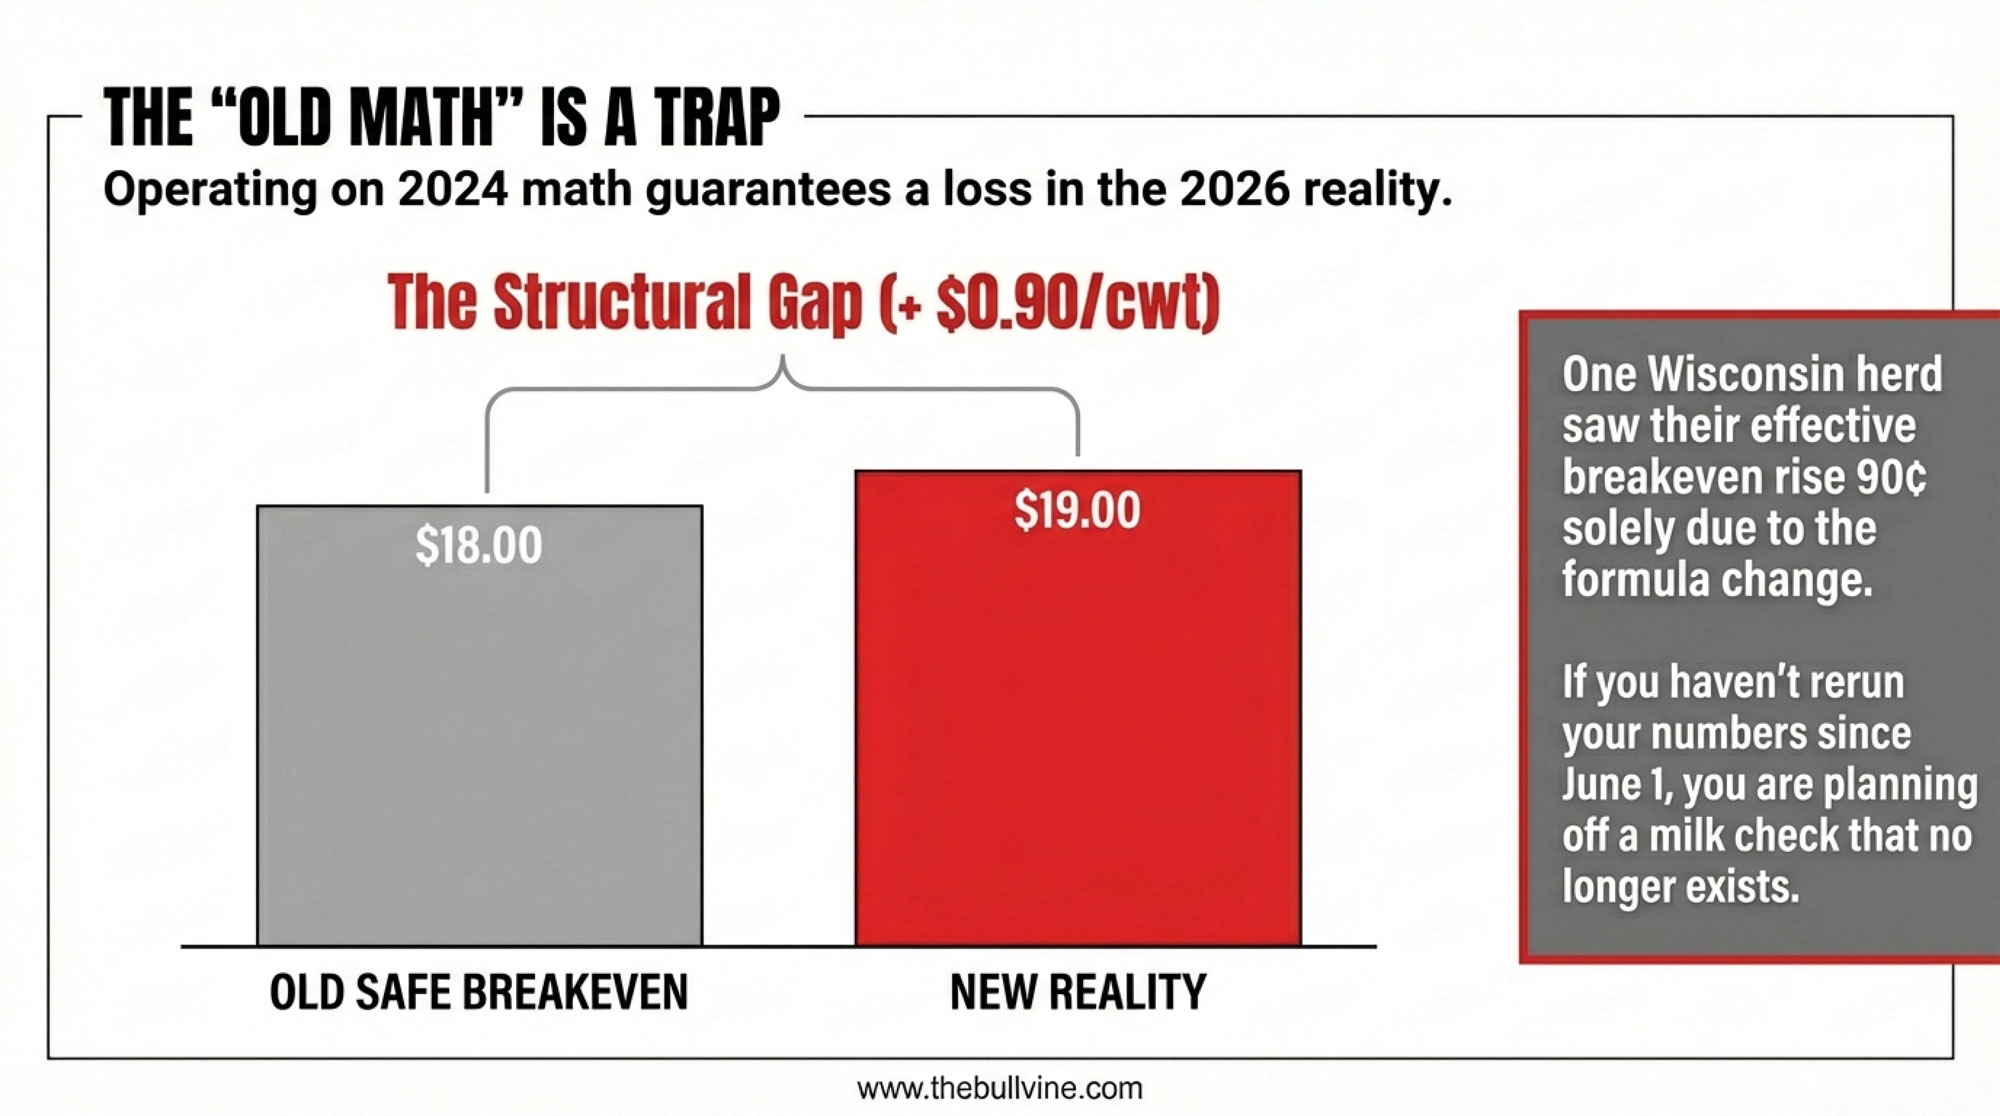
One 350‑cow Wisconsin herd that sat down with their advisor and two stacks of milk checks—January through May vs. July through December—watched their effective breakeven move from about $17.90 to $18.80/cwt. Same Class III levels on paper. Nearly a dollar less landing in the tank. If you haven’t rerun your own numbers since the June 1 change, you’re planning off a milk check that no longer exists.
What Changed in June 2025 FMMO Pricing
For the first time since 2000, USDA’s Agricultural Marketing Service raised the make allowances used to calculate Class III and IV prices in all 11 U.S. FMMOs. These are the built‑in processing cost deductions that come off wholesale product prices before any value flows back into the pool.
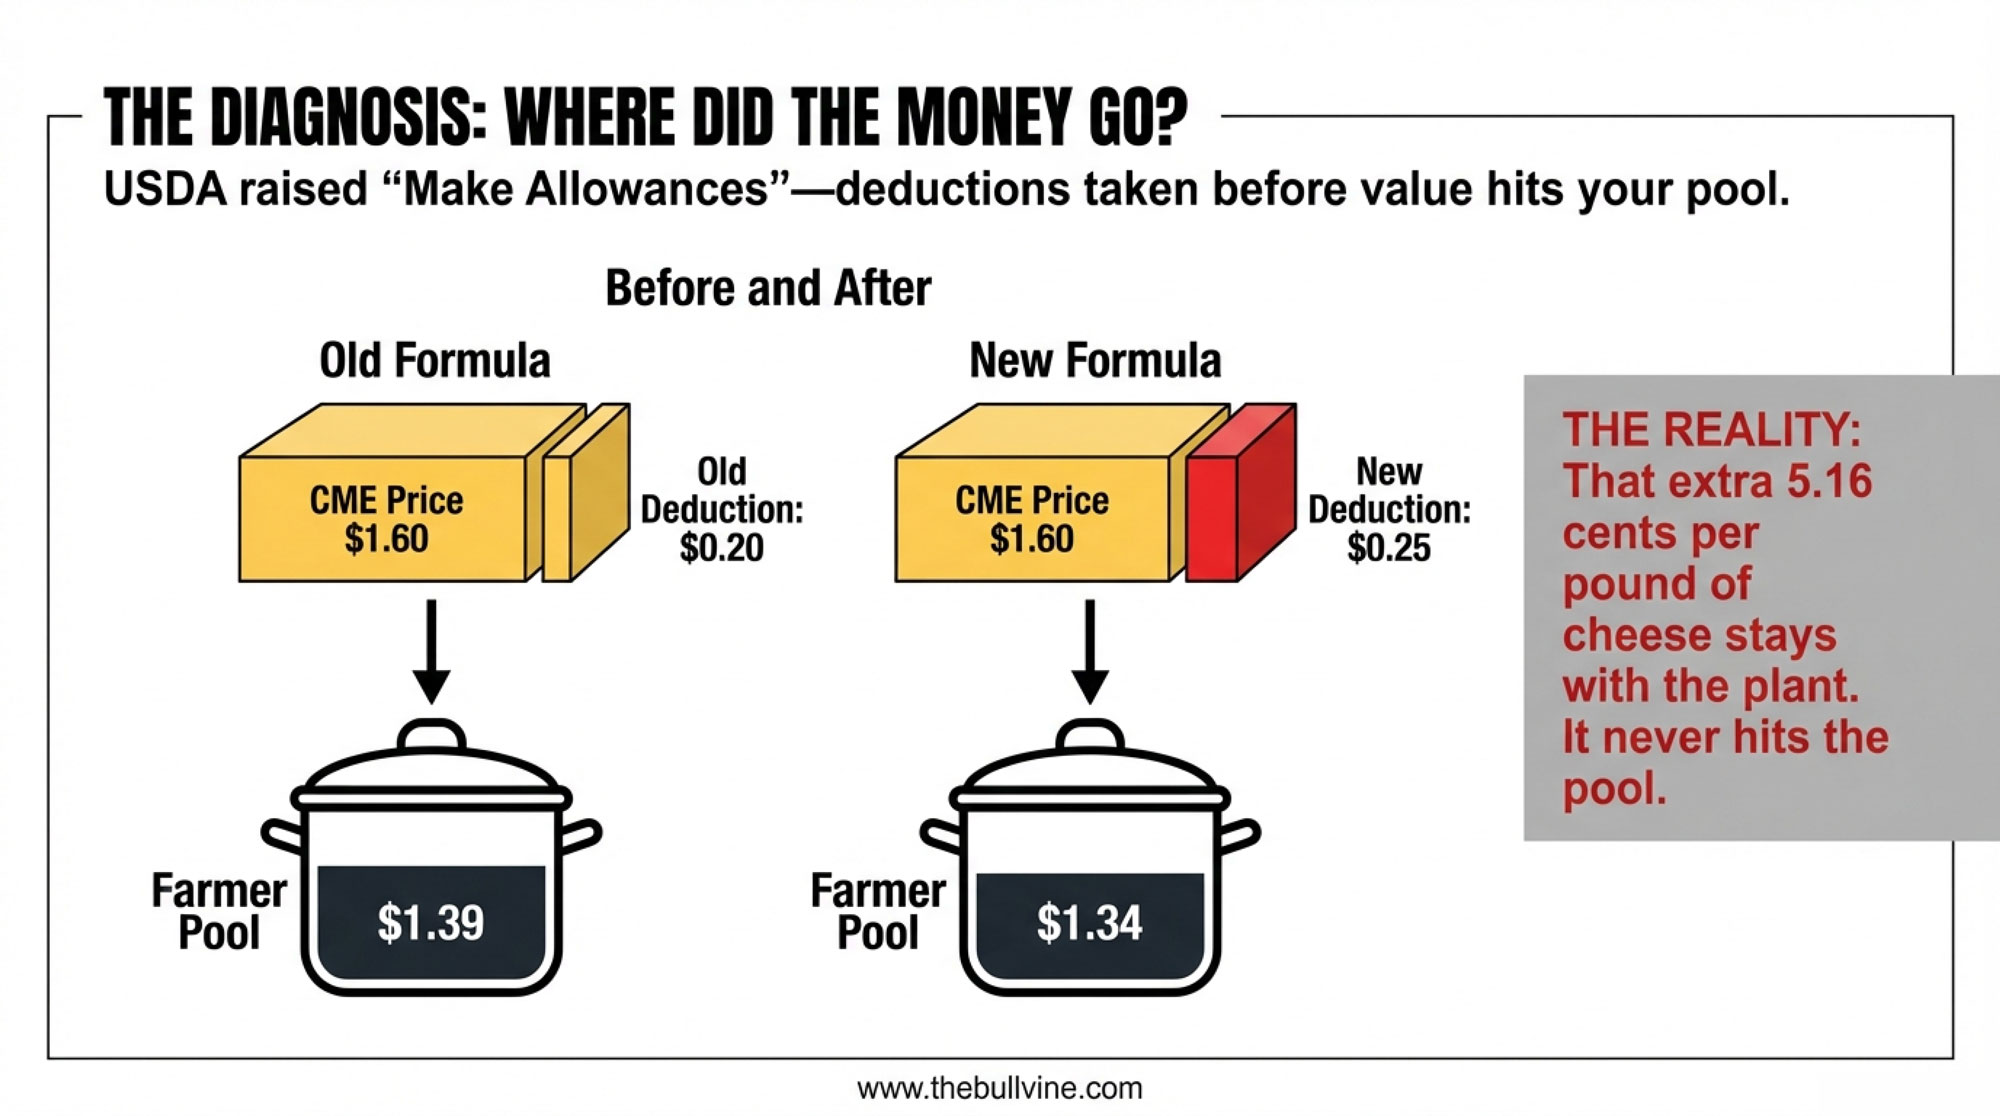
Under USDA’s final decision, effective June 1, 2025, the key make allowances moved from:
- Cheese: $0.2003/lb → $0.2519/lb (+5.16¢)
- Butter: $0.1715/lb → $0.2272/lb (+5.57¢)
- Nonfat dry milk: $0.1678/lb → $0.2393/lb (+7.15¢)
- Dry whey: $0.1991/lb → $0.2668/lb (+6.77¢)
Take cheese at $1.60/lb CME blocks as a simple example:
- Old formula: $1.60 − $0.2003 = $1.3997 flows into Class III component values.
- New formula: $1.60 − $0.2519 = $1.3481 flows in.
| Product | Old Make Allowance ($/lb) | New Make Allowance ($/lb) | Increase (¢/lb) | Impact on Class Prices |
| Cheese | $0.2003 | $0.2519 | +5.16¢ | Class III down ~$0.92/cwt |
| Butter | $0.1715 | $0.2272 | +5.57¢ | Class IV down ~$0.85/cwt |
| Nonfat Dry Milk | $0.1678 | $0.2393 | +7.15¢ | Class IV down ~$0.85/cwt |
| Dry Whey | $0.1991 | $0.2668 | +6.77¢ | Class III down ~$0.92/cwt |
| Combined Impact | — | — | 5–7¢/lb avg | −$0.85–$0.93/cwt |
That extra 5.16 cents per pound of cheese never hits the pool. It stays with the plant as cost recovery.
AFBF’s early‑impacts analysis of June–August 2025 found:
- Average Class I prices were $0.89/cwt lower.
- Class II down $0.85/cwt.
- Class III down $0.92/cwt.
- Class IV down $0.85/cwt.
That’s roughly a 4–5% drop in class prices driven solely by higher make allowances, pulling about $337 million out of combined pool revenues in just three months. The largest dollar losses occurred in the Upper Midwest ($64M), the Northeast ($62M), and California ($55M), where more milk runs through manufacturing classes.
If your local Class III and IV prices in late 2025 look a lot like early 2025, but your milk check is down close to a dollar per cwt, that’s not bad luck. That’s the formula change doing what it was designed to do.
How the New Formulas Show Up in DMC
Dairy Margin Coverage was built as disaster insurance. You bought it for the years when milk cratered or feed blew up. Higher make allowances are slowly turning it into something else.
AFBF’s math shows the new formulas alone lowered class prices by 85–93¢/cwt in the first three months after June 1. That structural gap sits on top of whatever the market throws at you. fb
USDA FSA’s DMC margin series for 2024 shows several months where the national margin came uncomfortably close to $9.50/cwt, even without a full‑blown crisis. Now imagine one of those months under the new formulas:
- All‑Milk price not far below $19/cwt.
- Feed cost index near $9.50/cwt.
- DMC margin scraping around $9.50/cwt.
If you take that 85–93¢/cwt impact and simply “add it back” to see what things might have looked like under the old make allowances, you’d be looking at a margin over $10/cwt in that same environment—comfortably above the Tier 1 trigger. That’s back‑of‑the‑envelope, not an official USDA series, but it tells you something important:
DMC is now catching structurally thinner “normal” years as well as train‑wreck years.
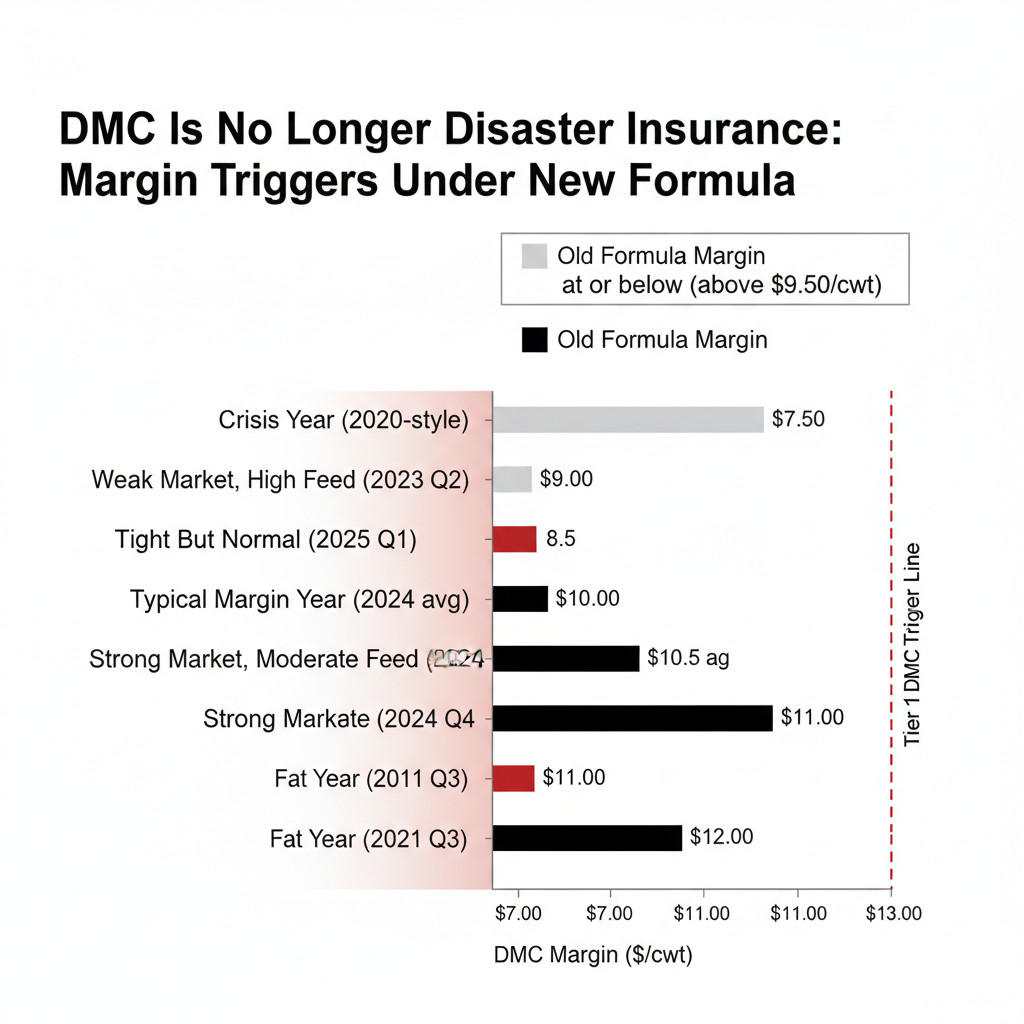
Katie Burgess, dairy analyst at Ever.Ag, expects real payouts in 2026: “Our model right now is showing payouts of more than $1 per hundredweight for January through April, and then some smaller payments for May through July as well.” William Loux at NMPF “certainly expect[s] to see some DMC payments here through the first quarter and probably through the first half of the year.”
For a lot of Tier 1‑eligible herds, $9.50 coverage is drifting from “catastrophe coverage” toward baseline margin backstop.
Rerunning Your Breakeven with 2025 Milk Checks
If your 2026–2028 plan still assumes $18/cwt is a safe breakeven because that used to work, you’re flying on old instruments.
You don’t need a fancy model to fix that. You need your milk checks and 20 minutes.
Step 1 – Two windows of checks
- January–May 2025: pre‑reform.
- July–December 2025: fully under the new formulas.
For each window, figure out:
- Average net pay price per cwt (after hauling, co‑op fees, assessments).
- Average Class III and/or IV values (USDA announced prices).
Step 2 – Compare like for like
Pick months where Class III/IV levels are similar before and after June. Then ask: how much lower is my net pay in the post‑June window?
If your Class III/IV values match but your net is 80–90¢/cwt lower, that’s the policy shift, not just “a bad month,” and lines up with AFBF’s 85–93¢/cwt range.
On herds that have walked through this math with their advisors, the pattern often looks something like this:
- A pre‑June “safe” breakeven around $18.00/cwt.
- A post‑June reality that needs closer to $18.75–$19.00/cwt to land the same margin once you factor in the structural hit.
For that 300‑cow, 7,500‑lb/cow example:
- Annual production: about 22,500 cwt.
- Structural shift: $0.85–$0.93/cwt.
- Annual revenue loss: $19,125–$20,925.
| Herd Size (cows) | Avg Production per Cow (lbs/year) | Total Production (cwt/year) | FMMO Revenue Loss @ $0.85/cwt | FMMO Revenue Loss @ $0.93/cwt |
| 100 | 7,500 | 7,500 | −$6,375 | −$6,975 |
| 300 | 7,500 | 22,500 | −$19,125 | −$20,925 |
| 500 | 7,500 | 37,500 | −$31,875 | −$34,875 |
| 750 | 7,500 | 56,250 | −$47,813 | −$52,313 |
| 1,000 | 7,500 | 75,000 | −$63,750 | −$69,750 |
You don’t have to like that number. You do have to plan off it—on budgets, on debt service, and on any expansion or robot that depends on your next five years of milk checks.
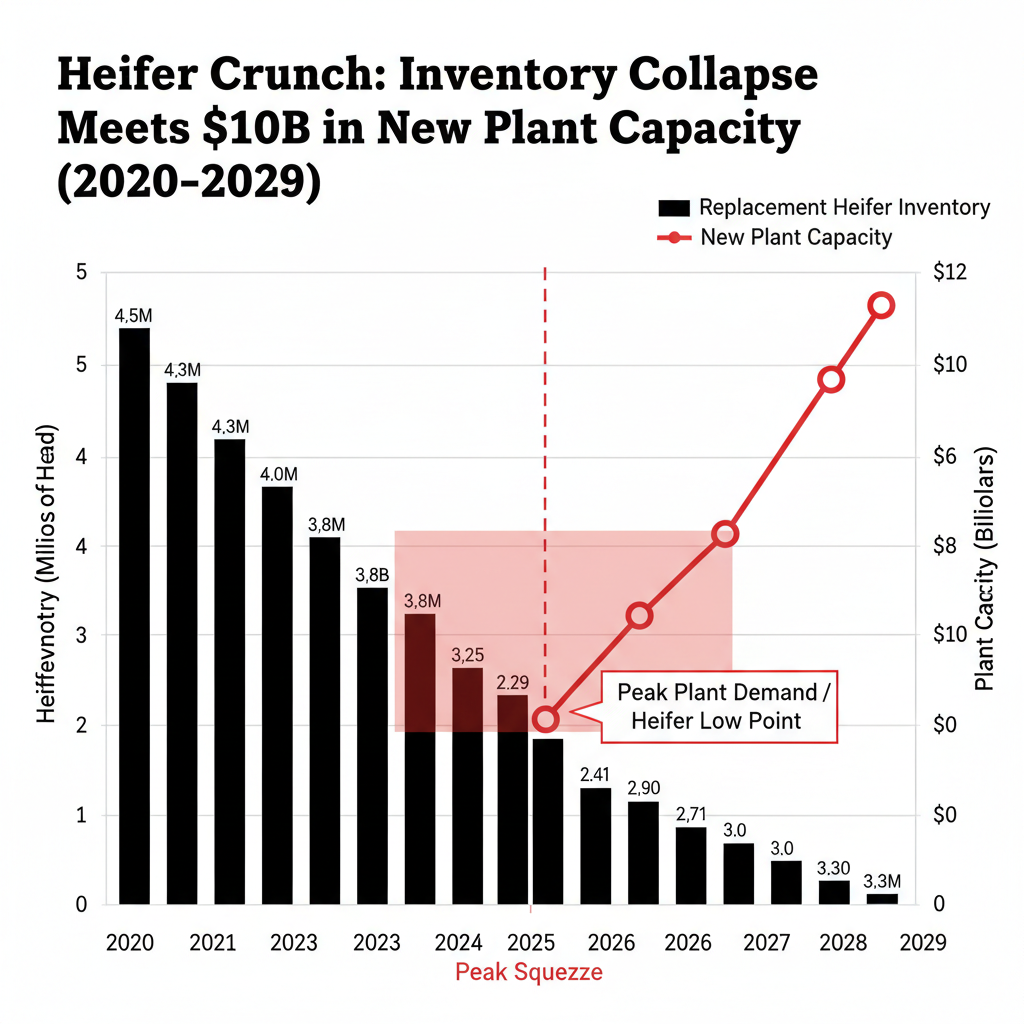
A 20‑Year‑Low Heifer Inventory Colliding with $10B in New Plants
While the FMMO formulas were changing, semen guns were rewriting the supply side.
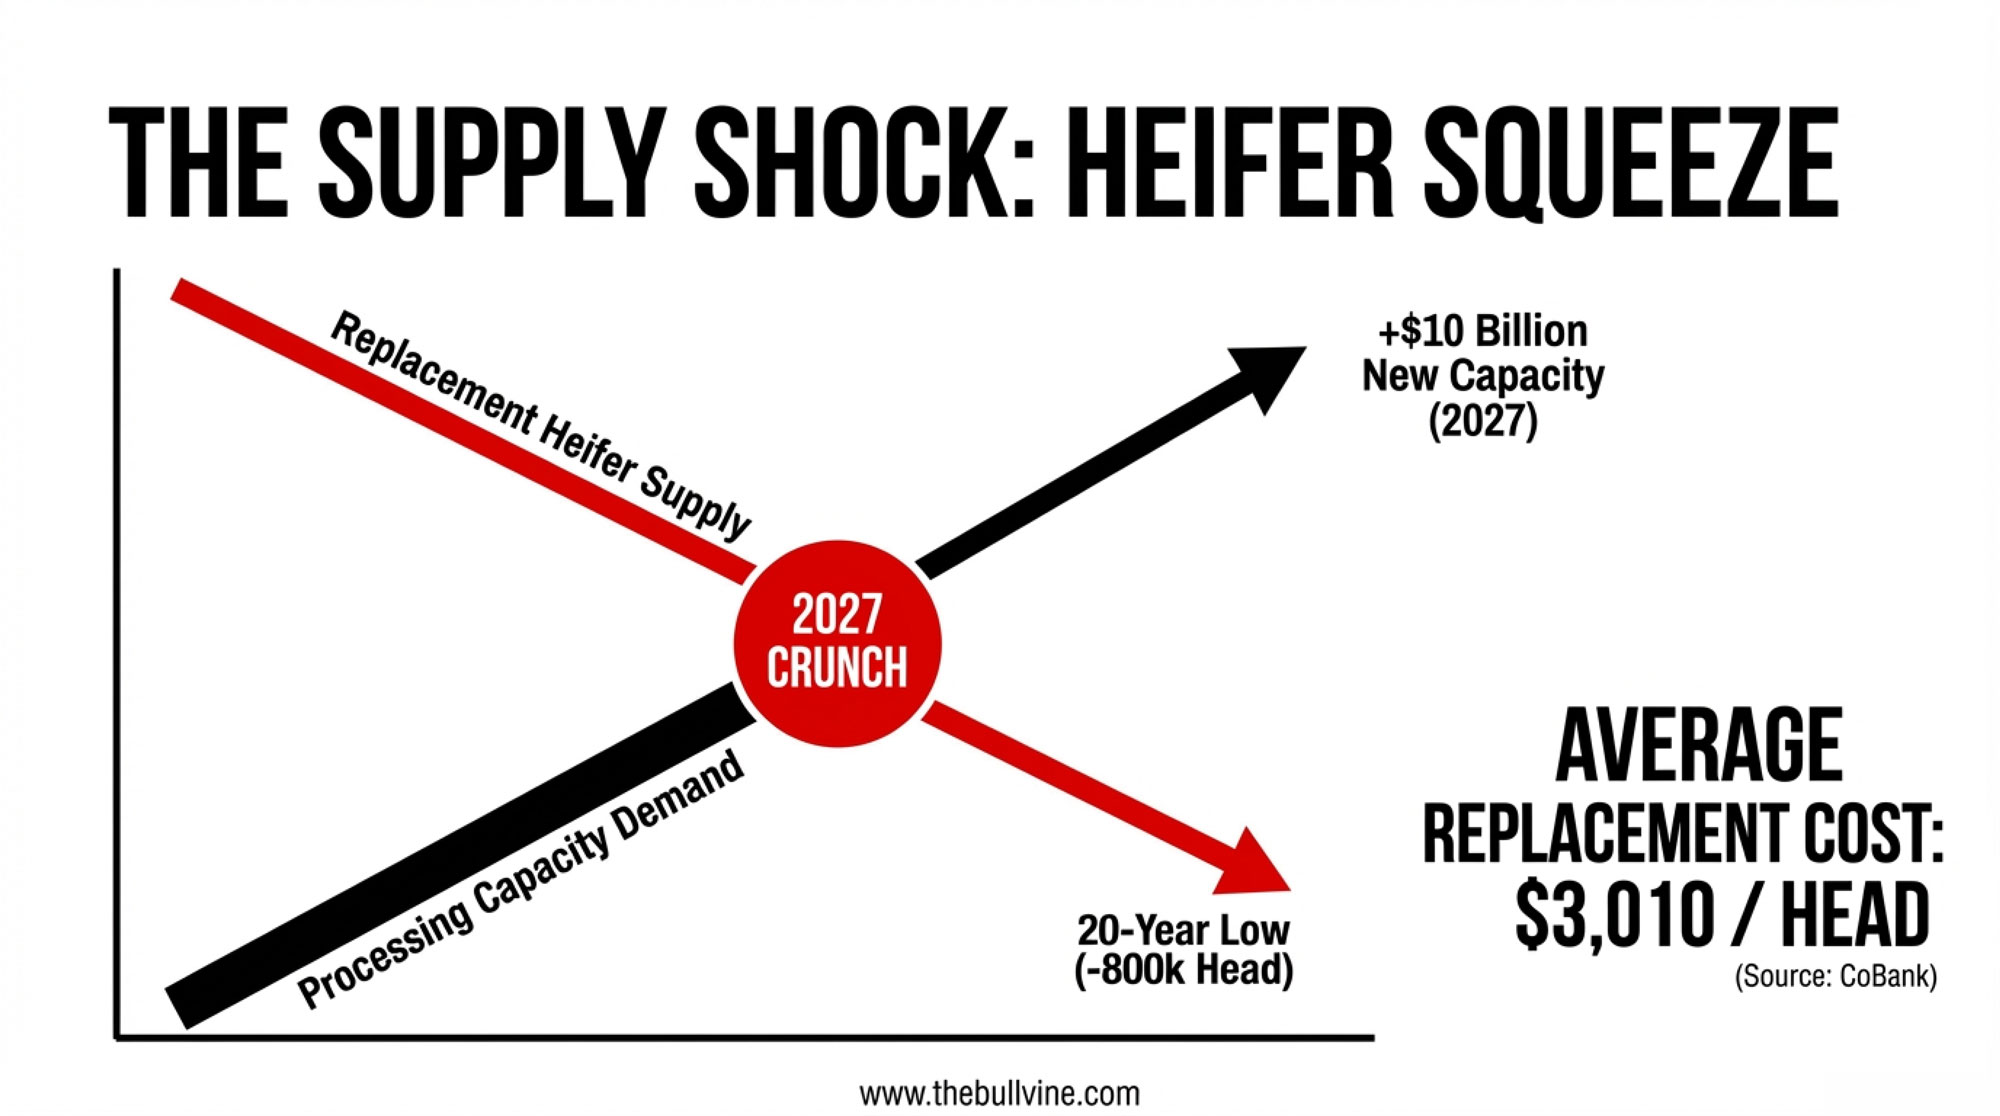
CoBank’s August 27, 2025, analysis, Dairy heifer inventories to shrink further before rebounding in 2027, puts the U.S. replacement heifer supply at a 20‑year low. They project inventories will shrink by about 800,000 head over the next two years and only start to rebound in 2027 as breeding strategies adjust.
At the same time, CoBank flags a $10 billion wave of new U.S. dairy processing investment, much of it scheduled to be running at full speed by 2027. As CoBank senior dairy economist Corey Geiger puts it: “The short answer is that it will be tight. Those dairy plants will require more annual milk and component production, largely butterfat and protein. And it will take many more dairy heifer calves in future years to bring the national herd back to historic levels.”
Driving the heifer squeeze:
- Strong beef prices pulled more beef semen into dairy herds.
- Straight dairy heifer calves often didn’t pencil when bred heifers were cheap, and rearing costs were high.
- Sexed dairy semen focused replacements on the top genetics but didn’t fully replace the volume lost to beef‑on‑dairy.
That logic made sense when beef‑on‑dairy calves were hot and USDA “Ag Prices” showed average replacement values in the neighborhood of $1,700/head, with many bred heifers trading somewhere in the $1,500–$2,000 range in local markets.
It looks a lot riskier in a world where CoBank shows average replacement prices climbing to about $3,010/head and warns they could go “well above $3,000 per head” in a tight market.
And the biology doesn’t care about your budget:
- Breed a heifer in early 2025 → she freshens in 2027.
- Those decisions are locked in.
The heifers that will fill the 2027 plant capacity are already on feed, or they were left as beef‑cross calves. You can still fix your 2028 and 2029 pipeline. You can’t go back and create 2027 heifers that were never conceived.
Why U.S. Cheese and Butter Are Moving—and Vulnerable
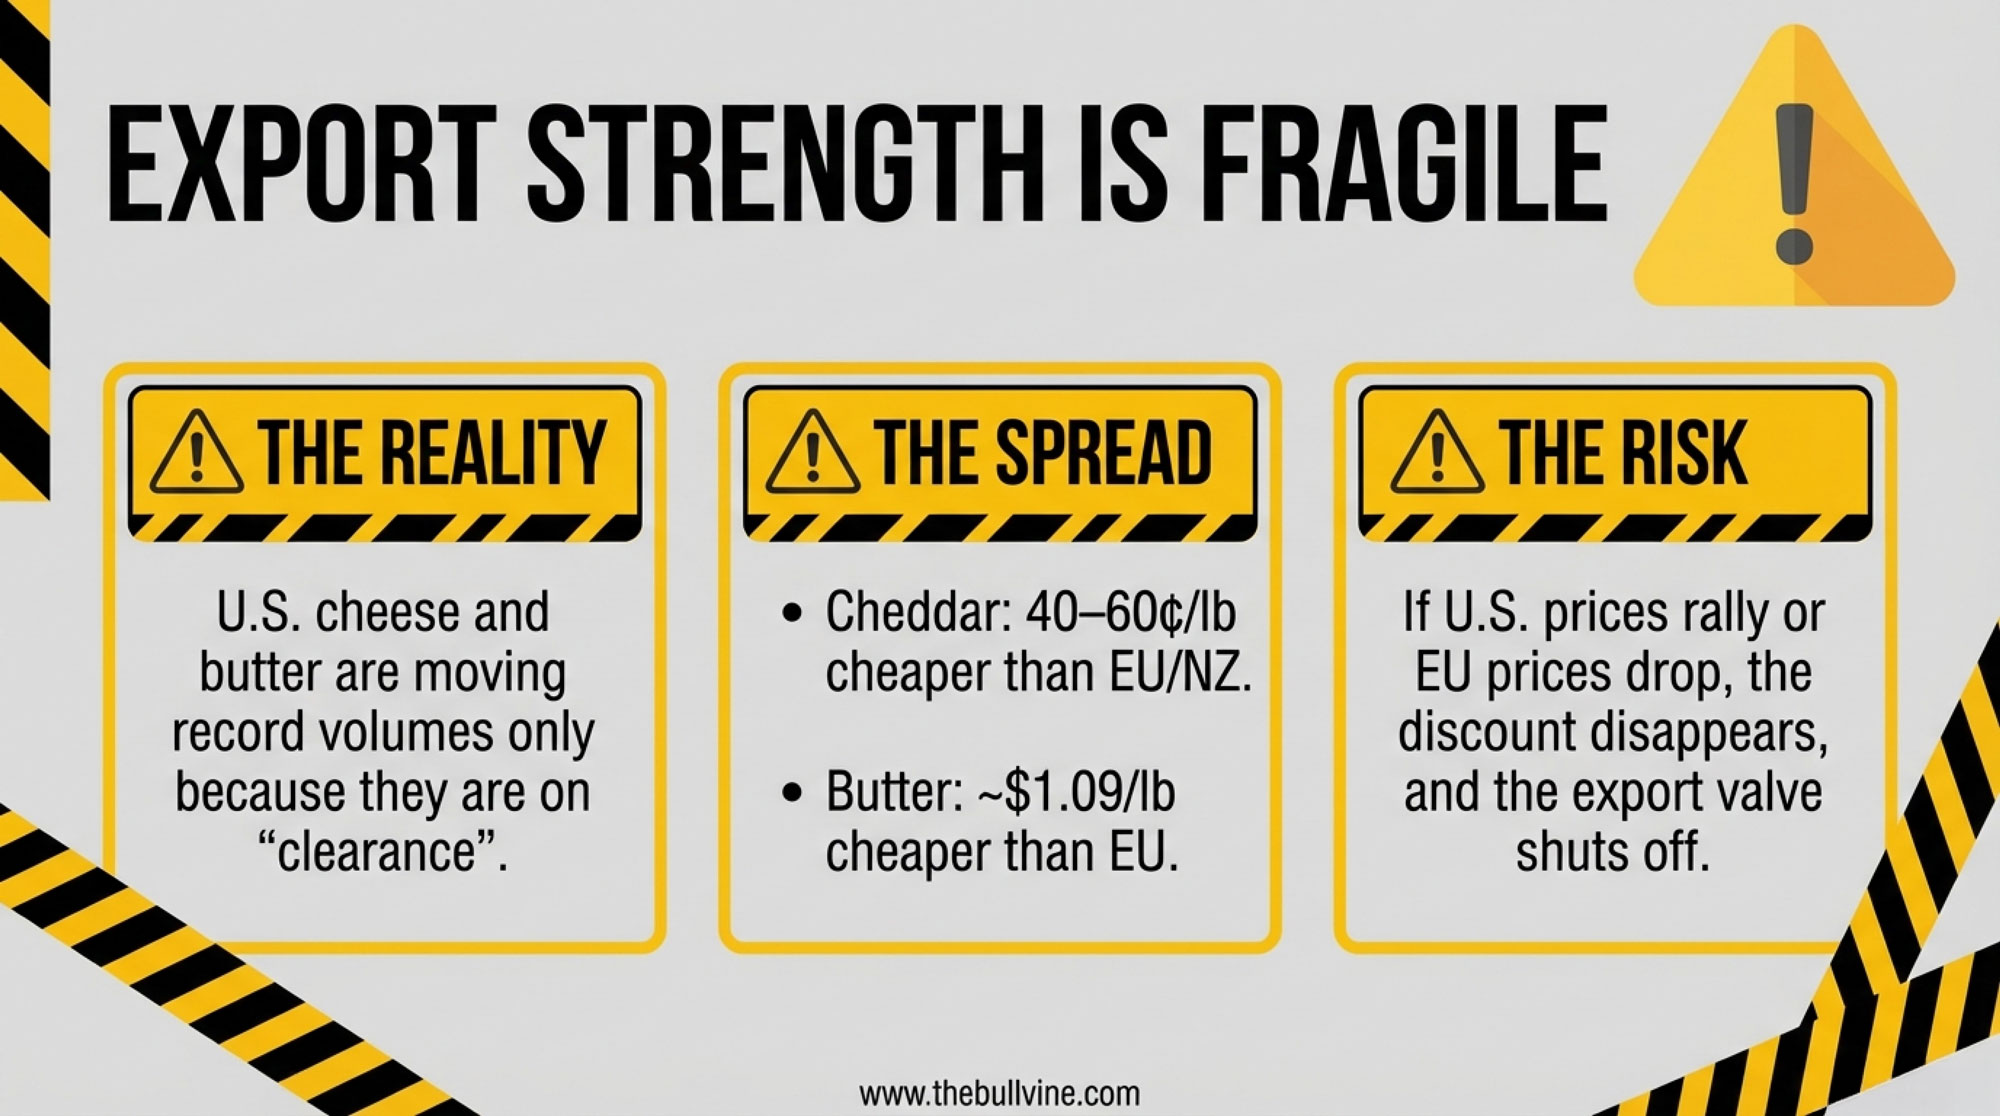
Exports have been the good‑news line on a lot of market calls. It’s worth looking under the hood. U.S. cheese and butter are moving because they’re cheaper than EU and New Zealand product. Using USDEC and USDA data, they show:
- U.S. cheese exports through October 2024 hit about 941 million pounds, and were on pace to surpass the previous annual export record.
- Butterfat exports reached 80 million pounds through October, up 18.6% (about 13 million pounds) year‑over‑year.
The price spreads are doing the heavy lifting:
- In January and March 2024, U.S. cheddar was roughly 40–50¢/lb cheaper than EU and New Zealand cheese.
- By November–December, that spread widened to about 45–60¢/lb.
- In early December, EU butter sat around $3.62/lb, while U.S. butter had slipped to about $2.53/lb—a $1.09/lbU.S. price advantage.
That’s great for exports. It’s also fragile.
If U.S. prices rally 15–20% on domestic factors while EU/Oceania values sit still—or if EU/NZ soften while U.S. prices hold—those spreads can shrink fast. As discounts narrow, importers in Mexico, Asia, and the Middle East have less reason to choose U.S. products.
At that point:
- Cheese meant for export stays domestic.
- American‑type cheese inventories—which Hoard’s noted were already elevated relative to where many traders thought prices should be—could build further.
- U.S. prices may have to drop enough to re‑open the export valve.
One simple rule‑of‑thumb some risk‑managers use for export‑exposed herds: when the U.S.–EU cheddar discount shrinks below about 25¢/lb for more than a month, it’s a yellow light to start paying closer attention to what that means for your plant’s export book and your basis.
| Month | U.S. Cheddar ($/lb) | EU/NZ Cheddar ($/lb) | U.S. Butter ($/lb) | EU Butter ($/lb) |
| Jan 2024 | $1.55 | $2.05 | $2.45 | $3.50 |
| Mar 2024 | $1.58 | $2.10 | $2.50 | $3.55 |
| Jun 2024 | $1.62 | $2.15 | $2.60 | $3.65 |
| Sep 2024 | $1.70 | $2.25 | $2.68 | $3.70 |
| Nov 2024 | $1.75 | $2.30 | $2.55 | $3.60 |
| Dec 2024 | $1.78 | $2.38 | $2.53 | $3.62 |
| Feb 2025 (hypothetical tightening) | $1.95 | $2.20 | $2.85 | $3.15 |
| Avg Spread (2024) | — | 45–60¢/lb U.S. discount | — | $1.05–$1.15/lb U.S. discount |
Export “strength” built on deep price discounts is a useful buffer. It isn’t a guarantee.
Four Concrete Moves in a $0.90/Cwt World
You can’t change Washington’s formulas or CoBank’s heifer math. You can change how your own numbers line up.
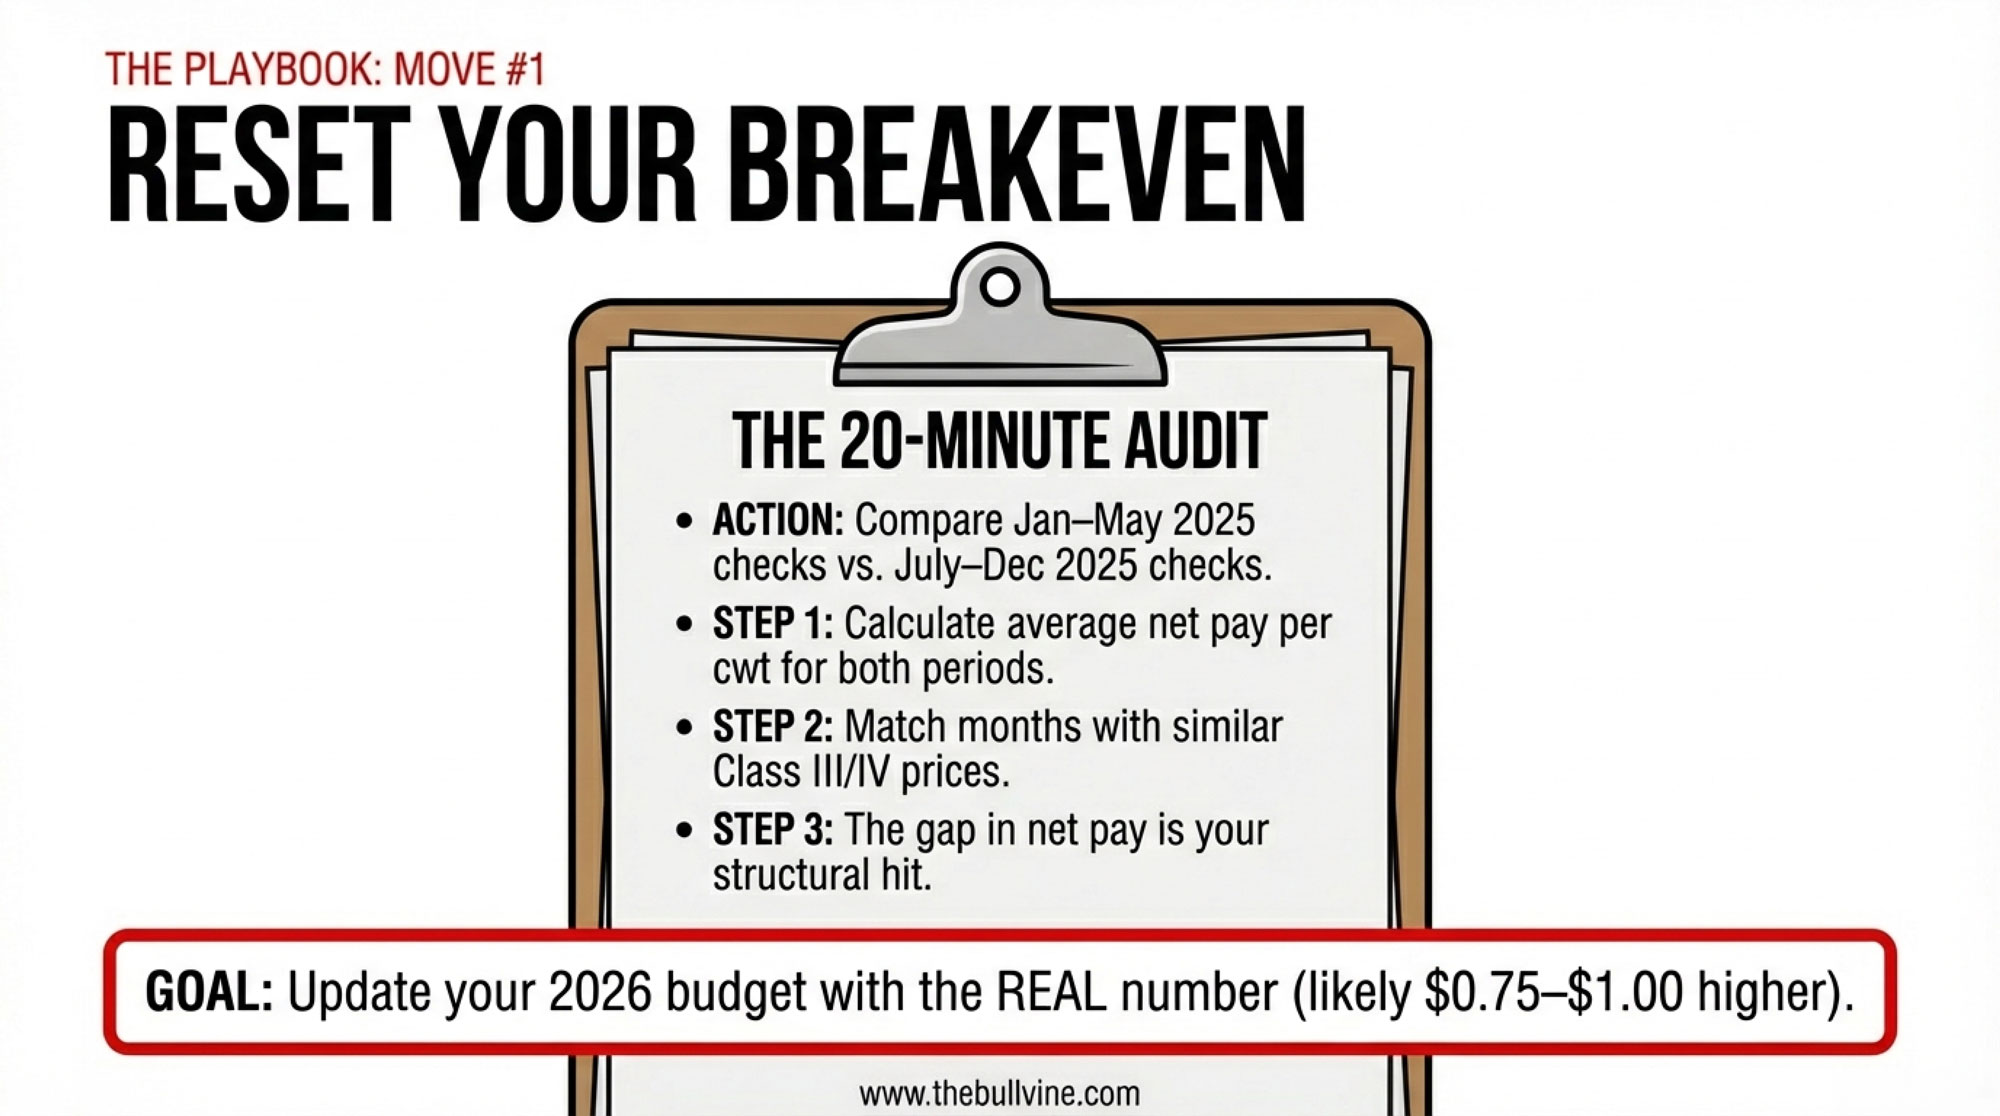
1. Reset Breakeven Off Your 2025 Checks
This one applies to every U.S. herd shipping into an FMMO.
- Pull your milk checks for January–May 2025 and July–December 2025.
- For each period, calculate average net pay per cwt and average Class III/IV prices from the USDA.
- Match months where Class III/IV were similar before and after June.
- The gap in net pay is your structural hit from the new rules, in the same ballpark as AFBF’s 85–93¢/cwt estimate.
If that math shows your realistic breakeven has climbed $0.75–$1.00/cwt compared with pre‑June, that’s the number you should plug into 2026–2028 cash‑flow plans, debt‑service conversations, and any capital decisions on barns, robots, or land.
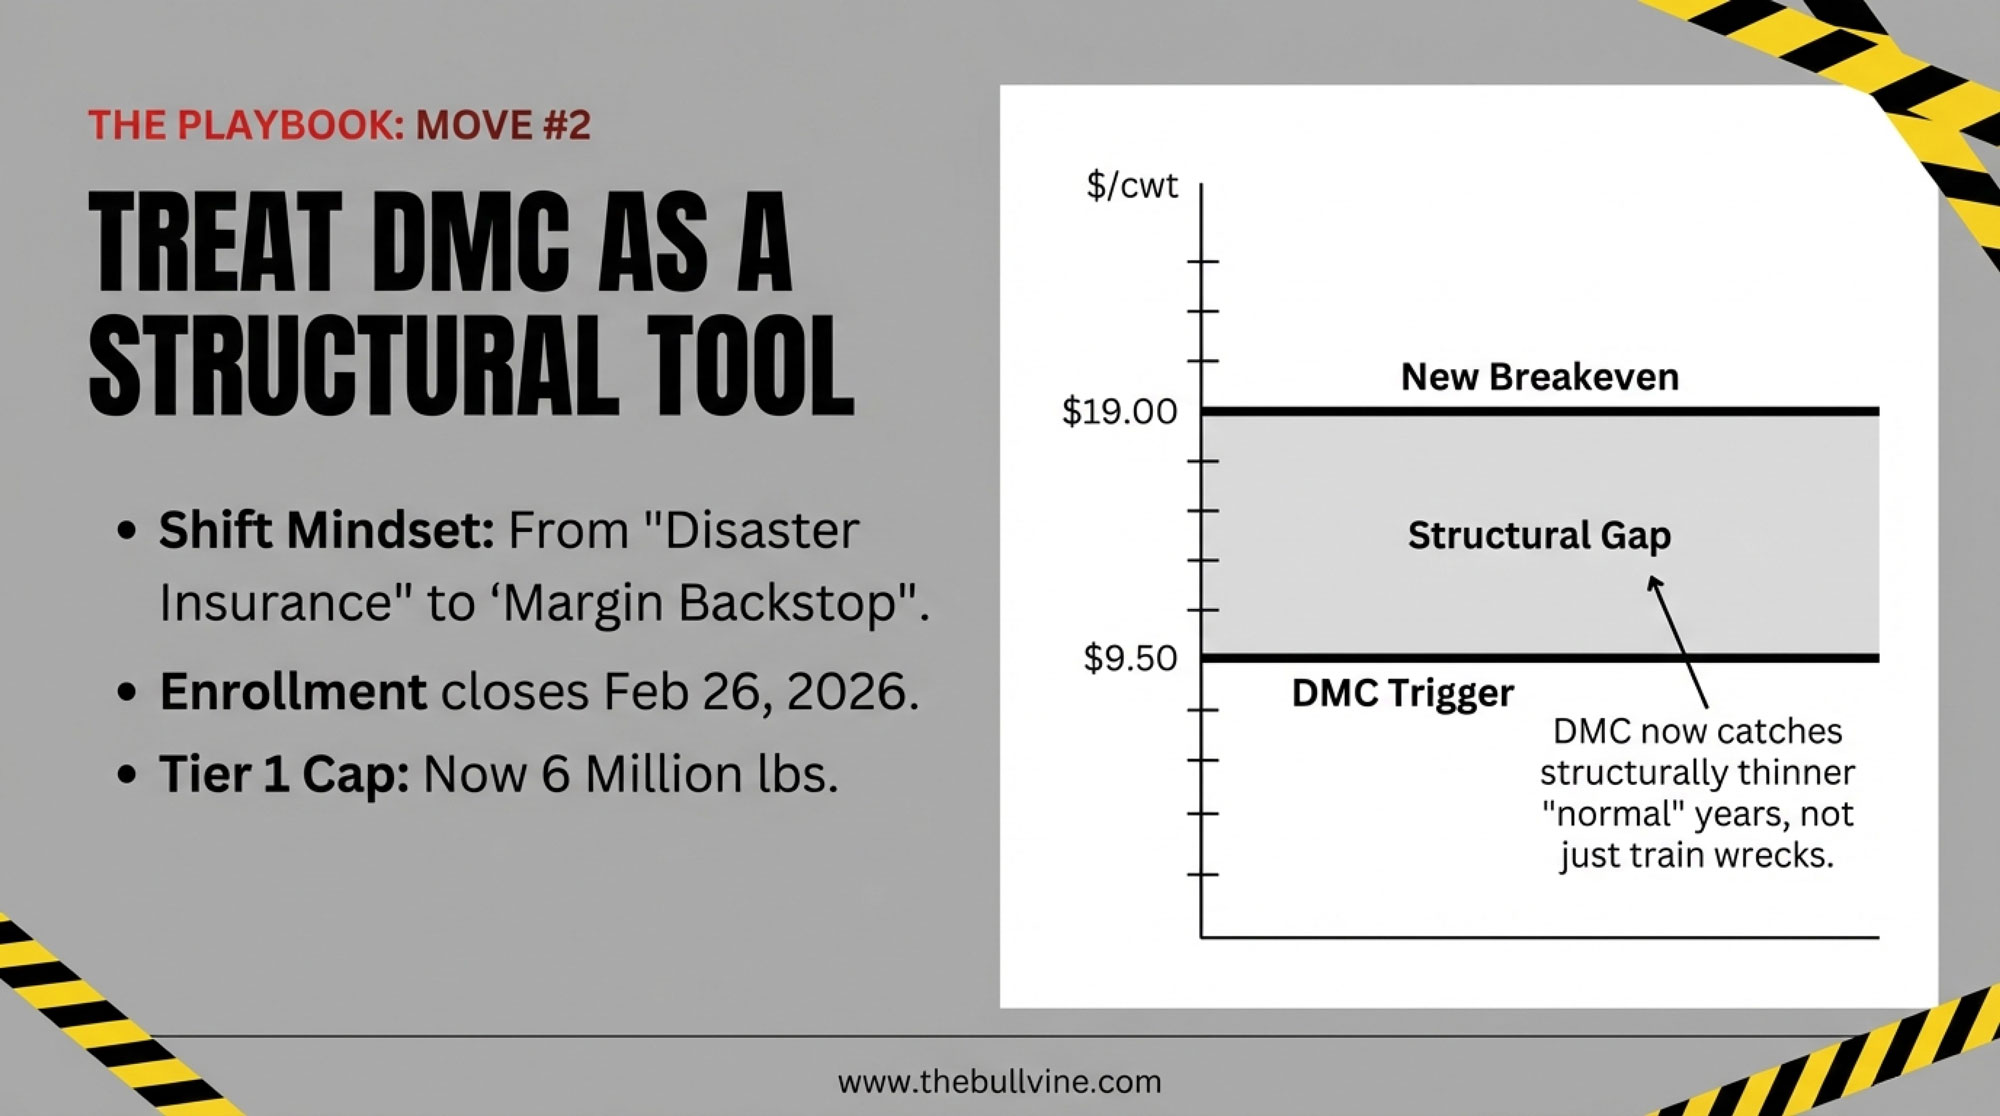
2. Treat $9.50 DMC as a Structural Margin Tool
Best fit: herds under the Tier 1 pound cap, especially in cheese‑heavy or basis‑noisy orders.
Tier 1 DMC covers a capped chunk of your production history—and for 2026, that cap jumped from 5 million to 6 million lbs per year under recent farm‑bill changes. At the $9.50/cwt coverage level, Tier 1 premiums run $0.15 per cwt, according to USDA FSA’s current premium schedule. Enrollment for 2026 coverage closes February 26, 2026, and producers who lock in coverage through 2031 receive a 25% premium discount.
If your updated breakeven is $18.75–$19.00/cwt and the margin outlook hangs close to $9.50, then $9.50 Tier 1 isn’t a lottery ticket; it’s a structural margin backstop.
The trade‑off is straightforward: in fat years, premiums feel like a waste; in thin structural years, DMC payments won’t erase the 85–93¢/cwt hit—but they can plug a meaningful slice of the gap.
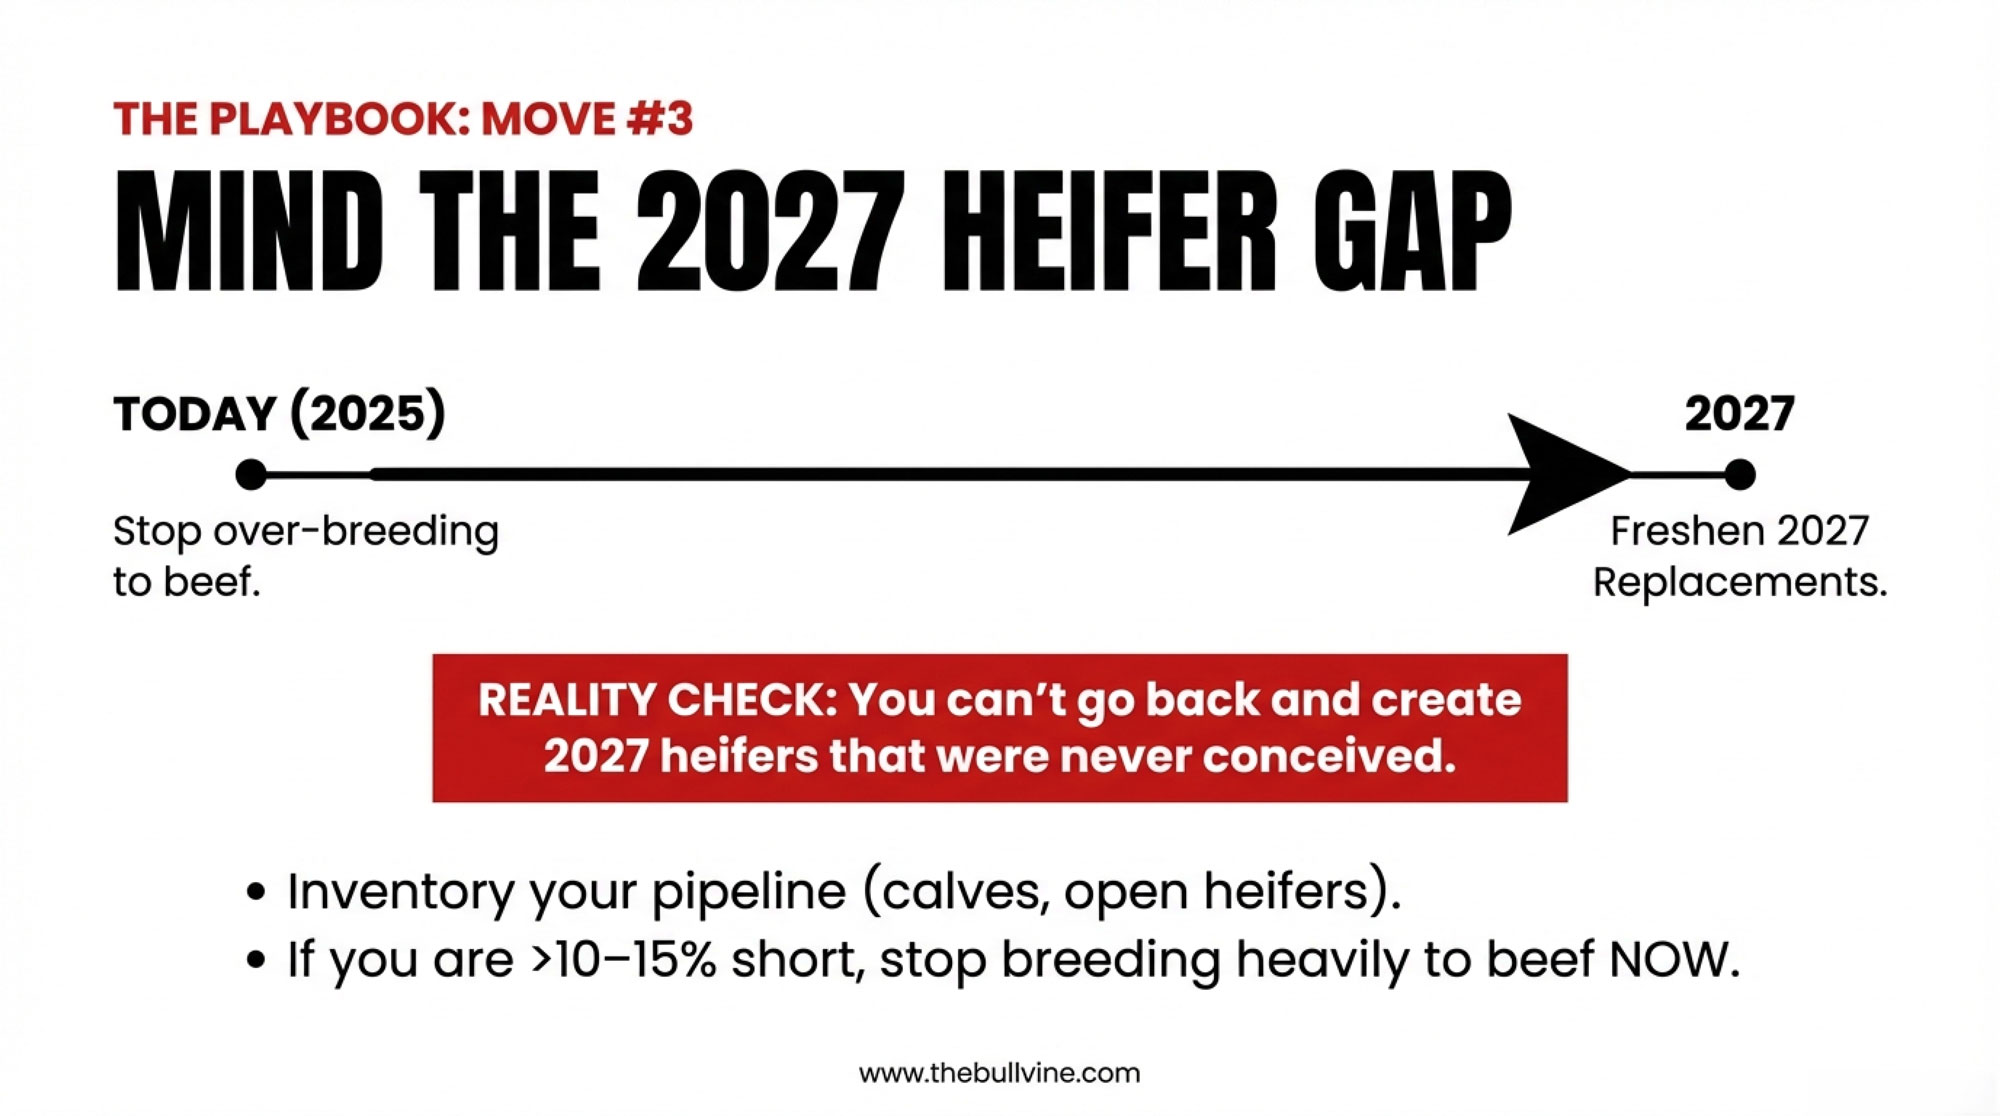
3. Check Your 2027 Replacement Gap Before More Beef Semen
Best fit: herds where a majority of services are going to beef semen.
Step 1 – Inventory your pipeline: cows in milk by lactation, bred heifers with due dates, open heifers by age class, and heifer calves on the ground.
Step 2 – Run 2027 replacement math: target annual replacements = herd size × target cull rate (many herds land between 30–38%). Estimate how many heifers will freshen in 2027 based on current pregnancies and heifer numbers. Compare projected 2027 fresh heifers to replacement needs.
If your projection is more than roughly 10–15% short, you’ve got a built‑in problem that most lenders and advisers would flag sooner rather than later.
Step 3 – Adjust semen mix, not just cull rate: problem cows and bottom genetics → beef semen; middle group → conventional dairy; top cows and heifers → sexed dairy.
If your records show 60+ percent of services going to beef semen, it may be worth dialing that back to a 30–40% banduntil your 2027 replacement gap closes. You give up some real beef‑cross calf cash now. In return, you reduce the odds of buying replacements “well above $3,000 per head” in a tight market or shrinking faster than you planned because you simply run out of heifers.
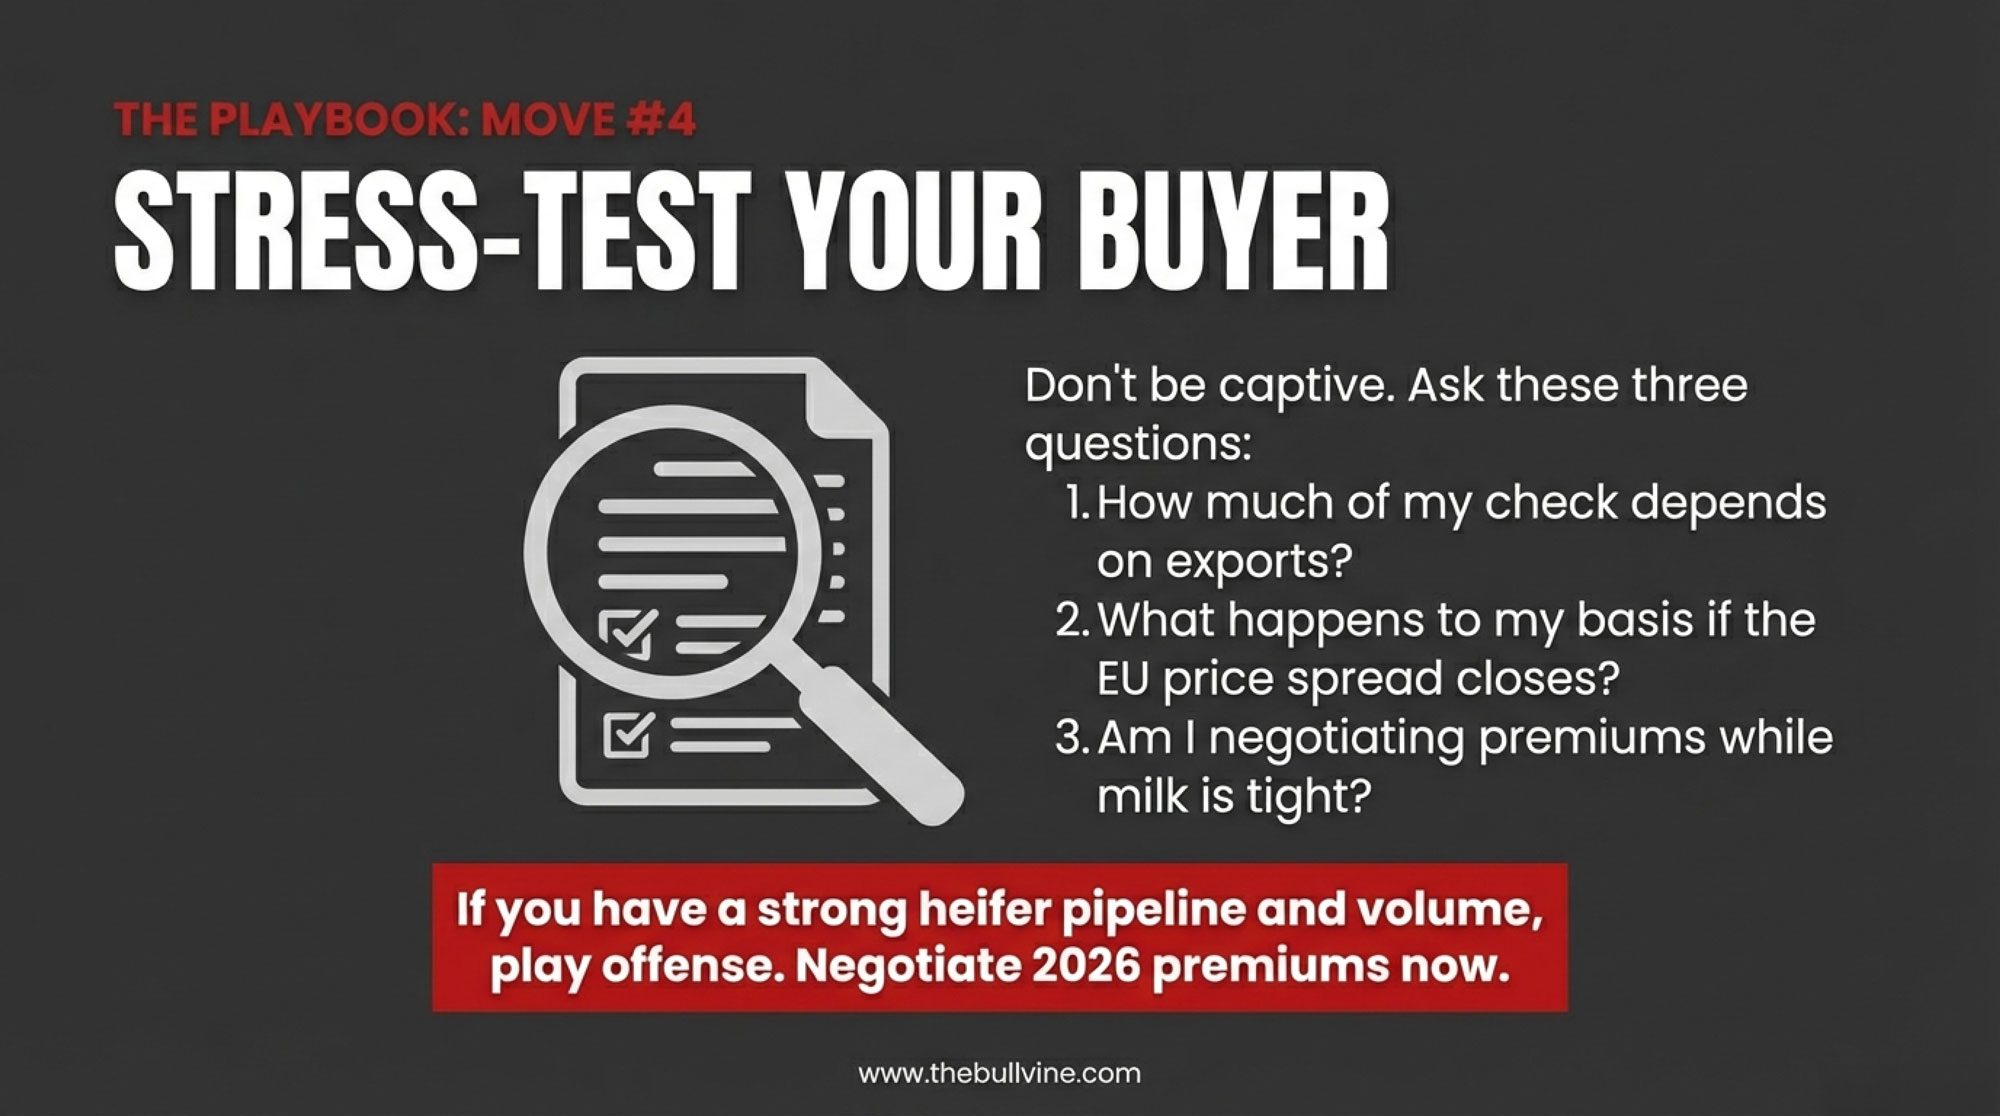
4. Stress‑Test Your Plant and Export Exposure
Best fit: herds shipping into export‑oriented cheese and butter plants in the Southwest, Pacific Northwest, Upper Midwest, or similar regions.
Ask yourself three questions:
- How much of my milk check depends on my buyer’s export book?
- What happens to my basis and premiums if U.S. cheese and butter lose a big part of their discount to the EU and Oceania?
- Do I have more than one serious buyer, or am I effectively captive to a single plant?
Practical moves:
- Track U.S. vs EU/New Zealand butter and cheddar price spreads monthly using public series from USDEC, USDA, and market summaries.
- Use DRP, forward contracts, and basis tools anchored to your updated breakeven, not the old one.
- If you have multiple buyers, don’t wait for a crisis—start talking now about 2026–2027 volumes and premiums. When heifers and milk are both tight, plants don’t treat all suppliers the same.
What This Means for Your Operation
You don’t control FMMO formulas, CoBank’s heifer math, or EU butter prices. You do control how honestly your own numbers line up with them.
- Rebuild your breakeven using pre‑ and post‑June 2025 checks. If that exercise shows your true breakeven has crept into the $18.75–$19.00/cwt range and you’re still planning off $18.00, that’s a silent risk your lender will spot before you do.
- Look at Dairy Margin Coverage as a structural tool, not a Hail Mary. If your costs sit near $19/cwt and the national margin now scrapes $9.50/cwt more often, Tier 1 coverage at $9.50—now up to 6 million lbs with a $0.15/cwt premium in 2026—belongs in the core of your risk toolkit, not the “maybe” pile. Enrollment closes February 26, 2026.
- Run a 2027 replacement gap check before another heavy beef‑on‑dairy year. If your math shows a deficit of more than 10–15% on 2027 replacements and you’re running high beef semen percentages, pulling back now may be cheaper than buying very expensive bred heifers or losing scale later in a 20‑year‑low heifer environment.
- Watch spreads and plant behavior, not just export headlines. Record exports driven by big discounts can flip fast. Pay more attention to U.S.–EU/NZ spreads and what your plant does with premiums and basis than to national export tonnage alone. hoards
- Monitor these signals going forward: U.S.–EU cheddar spreads narrowing below 25¢/lb for more than a month; bred heifer prices pushing past $3,200–$3,500/head in your region; and any DMC margin prints below $9.00/cwt that would trigger larger payouts than current projections.
- If you have a strong heifer pipeline and more than one serious buyer, you’re in rare company. That’s a chance to play offense: negotiate better premiums, selectively expand, or lean harder into components while other herds are stuck just hanging on.
Key Takeaways
- The 85–93¢/cwt hit from the new FMMO make allowances is structural until policy changes again. It’s built into the formulas and shows up even when CME prices look “normal,” with an estimated $337M pulled from pools in the first three months alone (AFBF, Sept. 2025).
- Dairy Margin Coverage is drifting from disaster insurance toward a structural margin backstop. With class prices permanently trimmed and margins regularly near $9.50/cwt, DMC is more likely to trigger in tight but “normal” years, not just in blow‑ups.
- Replacement heifers are at a 20‑year low and projected to shrink by another ~800,000 head before rebounding in 2027 (CoBank, Aug. 2025). That makes your replacement strategy and semen mix real risk‑management levers, not just breeding preferences.
- U.S. export “strength” in cheese and butter is running on price discounts. Hoard’s and USDEC data show U.S. cheese and butter winning business because they’re 40–60¢/lb and more than $1/lb cheaper, not because demand is bulletproof.
The Bottom Line
The rules changed faster than most budgets, breeding plans, and risk strategies. You can either recalibrate now while you still have choices—or wait until your milk check, your heifer buyer, or your plant forces the decision for you.
Where does your post‑June breakeven actually sit?
Complete references and supporting documentation are available upon request by contacting the editorial team at editor@thebullvine.com.
Learn More
- The $15,800 DMC Wake-Up Call: Tier 1 Just Jumped to 6 Million Pounds. Don’t Sign ‘Same as Last Year.’ – Gain a tactical checklist to capture the expanded 6-million-pound Tier 1 cap; this guide delivers the math needed to prevent a five-figure revenue leak before the February 26 enrollment deadline closes.
- Biology Repriced Dairy: $4,000 Heifers Created a 90-Day Window When You Have Leverage, Not Processors– Secure the upper hand in processor negotiations by identifying your 90-day leverage window; this analysis exposes the strategic moves required to navigate the structural heifer shortage and plant capacity surge through 2030.
- FMMO Reality Check: Why 2025’s $2.3 Billion Dairy Pricing Revolution Exposes the Fatal Flaw in American Milk Marketing – Exploit the new pricing rules to accelerate your technology ROI; this deep dive reveals how automated milking and precision feeding now deliver a permanent competitive advantage for herds chasing high-value protein premiums.
 The Sunday Read Dairy Professionals Don’t Skip.
 The Sunday Read Dairy Professionals Don’t Skip.
Every week, thousands of producers, breeders, and industry insiders open Bullvine Weekly for genetics insights, market shifts, and profit strategies they won’t find anywhere else. One email. Five minutes. Smarter decisions all week.


