


What if 4:30 AM milkings can’t save your farm? At $25/cwt cost against $21 milk, they won’t. The math is structural. Your next move is strategic.
EXECUTIVE SUMMARY: Four dairy farms close every day in America. Total milk production? Still growing. This isn’t an industry in decline—it’s an industry choosing survivors. The economics are structural: a 300-cow operation at $25/cwt cost loses $75,000-$100,000 annually at current milk prices, no matter how early the family starts milking. Regional pressures compound the math—Wisconsin cropland at $6,800/acre competes against Kansas at $3,100, while billions in new processing capacity flows to Texas and Idaho rather than traditional dairy states. Here’s what’s changing the calculus: beef-on-dairy programs now generate $100,000+ in additional annual revenue, genomic testing enables precision breeding strategies, and four distinct pathways remain viable for operations willing to act. The cost of indecision is quantifiable—every year of “wait and see” erodes $75,000 to $150,000 in family equity. For mid-size dairies, the next 18 months are decisive: choose your path or let the market choose for you.
A west-central Wisconsin dairy producer—we’ll call him Mark—has run the numbers more times than he can count. Each time, they come back telling him the same thing.
His 420-cow operation has been profitable for three generations. Strong genetics, solid herd health protocols, and a family that understands the rhythm of dairy work. But sitting at his kitchen table last October—spreadsheets covering every inch of the surface, a cold cup of coffee pushed to one side—the 54-year-old dairyman found himself facing a question his father never had to consider.
The economics that made this farm viable for decades may not hold for another ten years.
“It’s not that we’re failing,” he told me. “It’s that the game changed while we were busy milking cows.”
He’s far from alone in that realization.
The Number That Defines This Moment
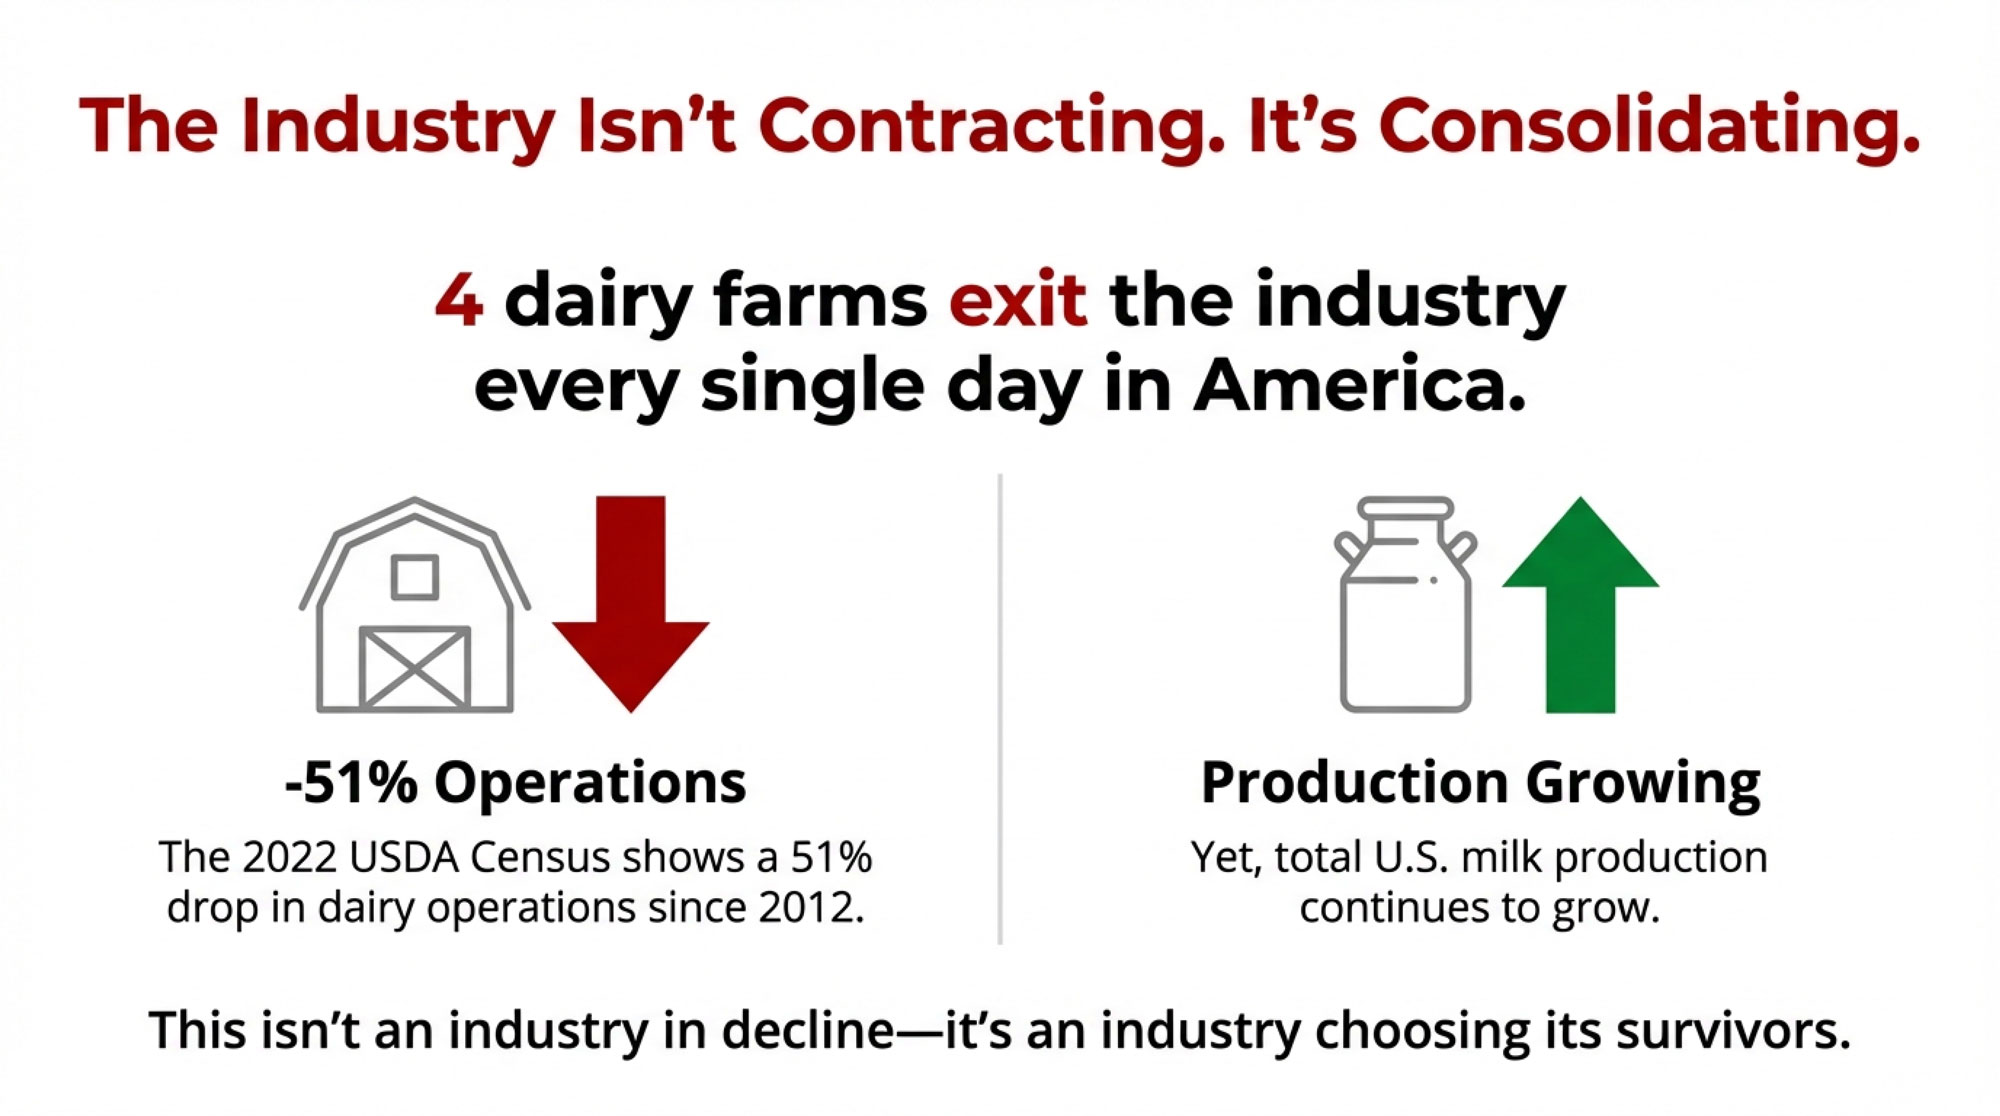
Four dairy farms exit the industry every single day.
The 2022 USDA Census of Agriculture counted 24,082 dairy operations—down 51% from 2012 levels. That works out to roughly 1,400 exits annually, or nearly four farms per day of the year. Yet total milk production hasn’t declined. It’s actually grown.
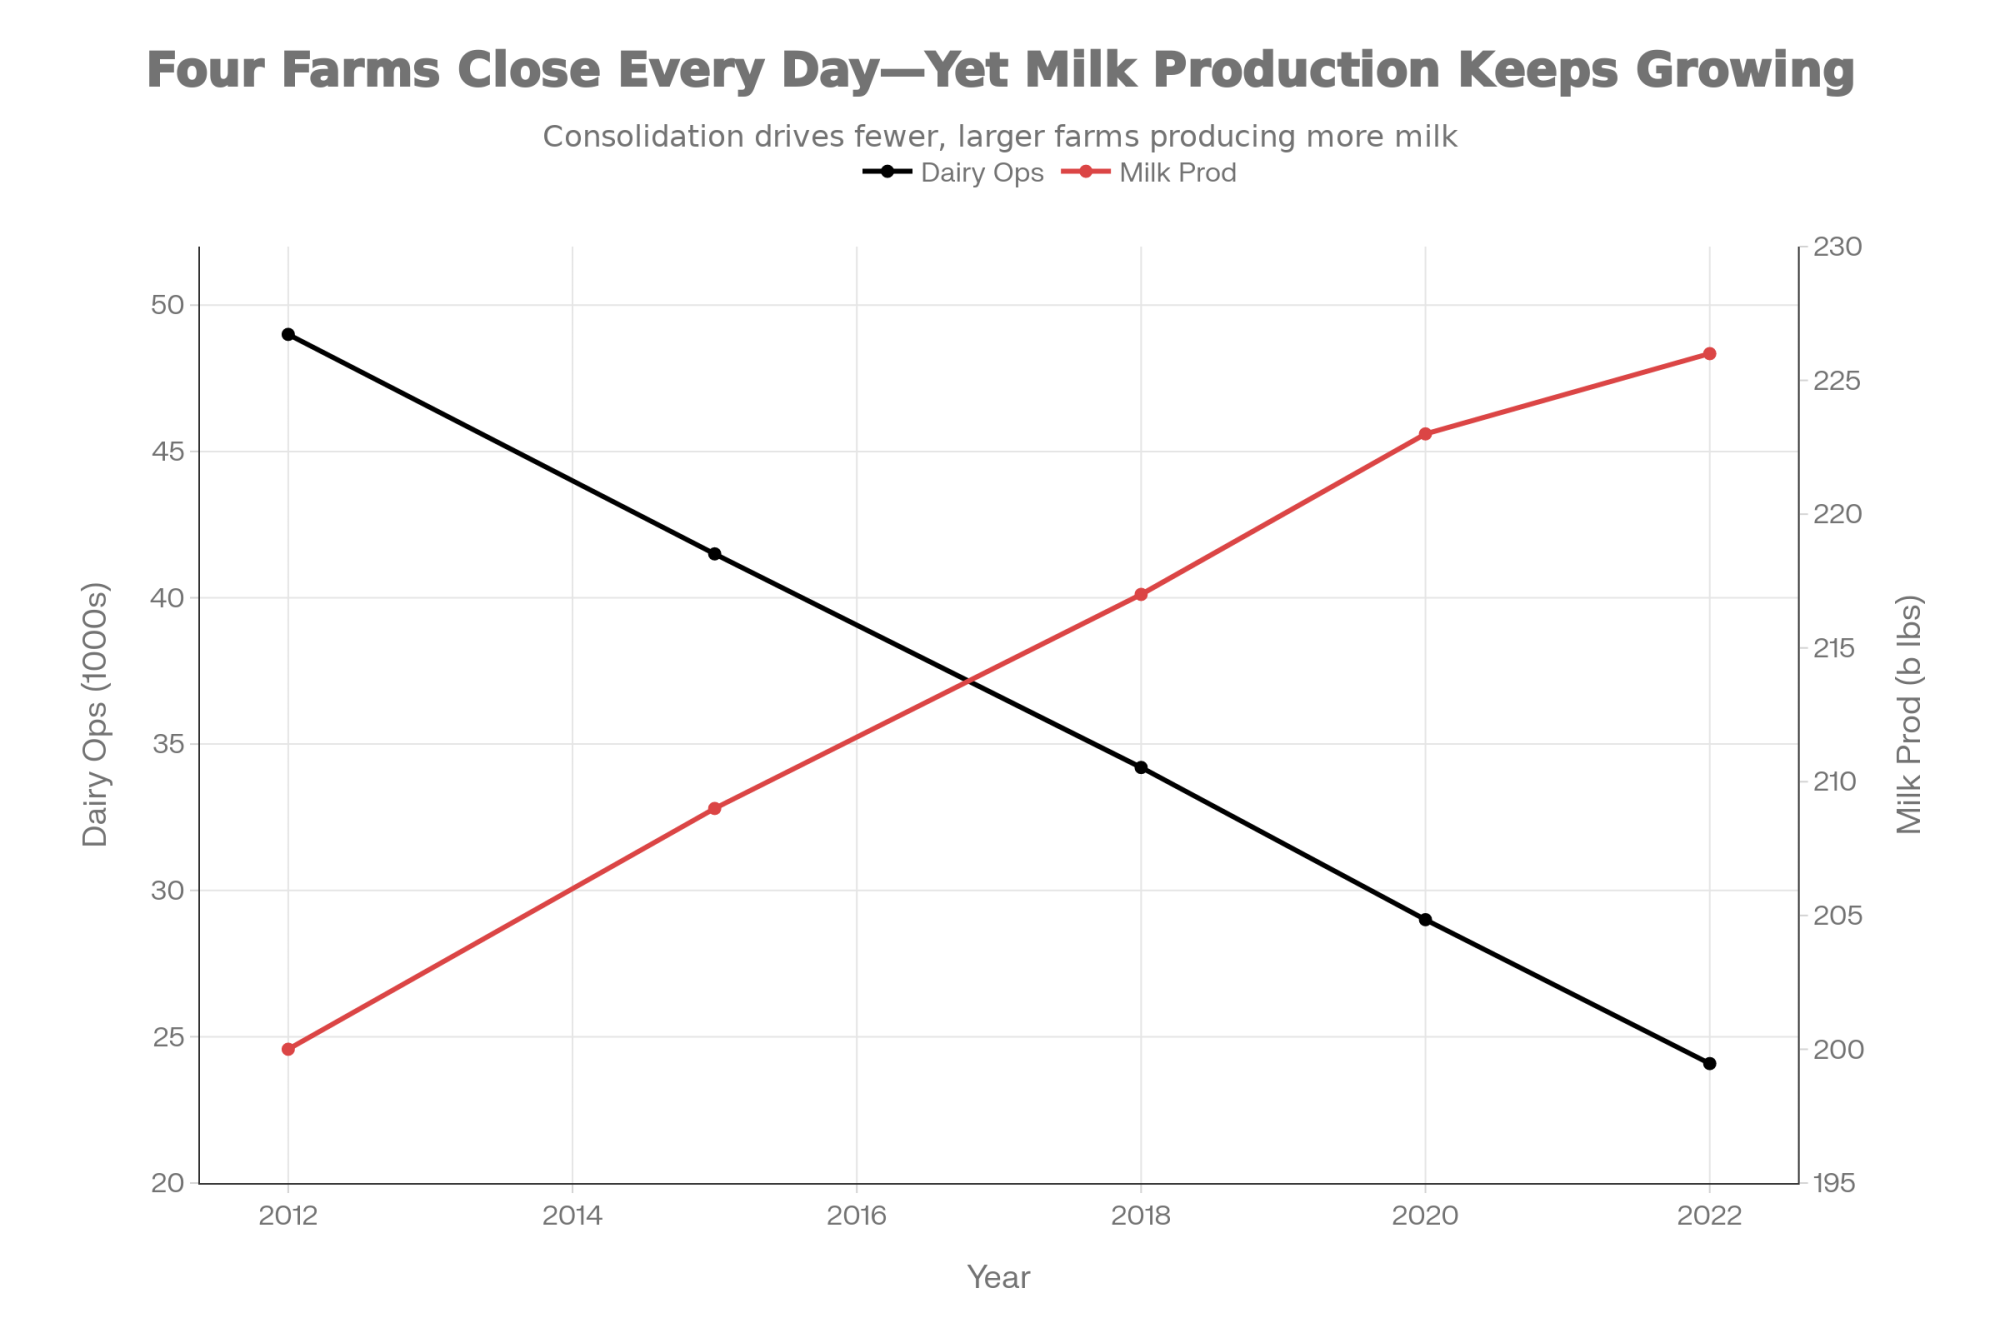
The industry isn’t contracting. It’s consolidating.
Understanding how that consolidation works, which operations it tends to favor, and what realistic options remain for those navigating the middle ground—well, that’s become one of the most important conversations happening in dairy circles today.
What’s striking is how this pattern extends well beyond our borders. Every major dairy-producing region is experiencing some version of the same structural shift:
| Region | Approximate Decline | Timeframe | Source |
| United States | 51% of operations | 2012-2022 | USDA Census |
| Great Britain | ~53% of producers | 2010-2025 | AHDB |
| European Union | ~33% of farms | 2005-2023 | Eurostat |
| New Zealand | ~21% of farms | 2000-2024 | DairyNZ |
The forces at work appear to be structural rather than regional, which tells us something important about what we’re dealing with. Different policy environments, different production systems, different market structures—yet remarkably similar consolidation trajectories.
Understanding the Cost Dynamics
I’ve spent considerable time examining why consolidation follows such consistent patterns, and the findings have been instructive.

Whether you’re looking at Upper Midwest grazing operations, California dry lot systems, or Texas mega-dairies, the underlying economics follow similar principles. It comes down to structural cost advantages that scale tends to create—advantages that have widened noticeably since around 2015.
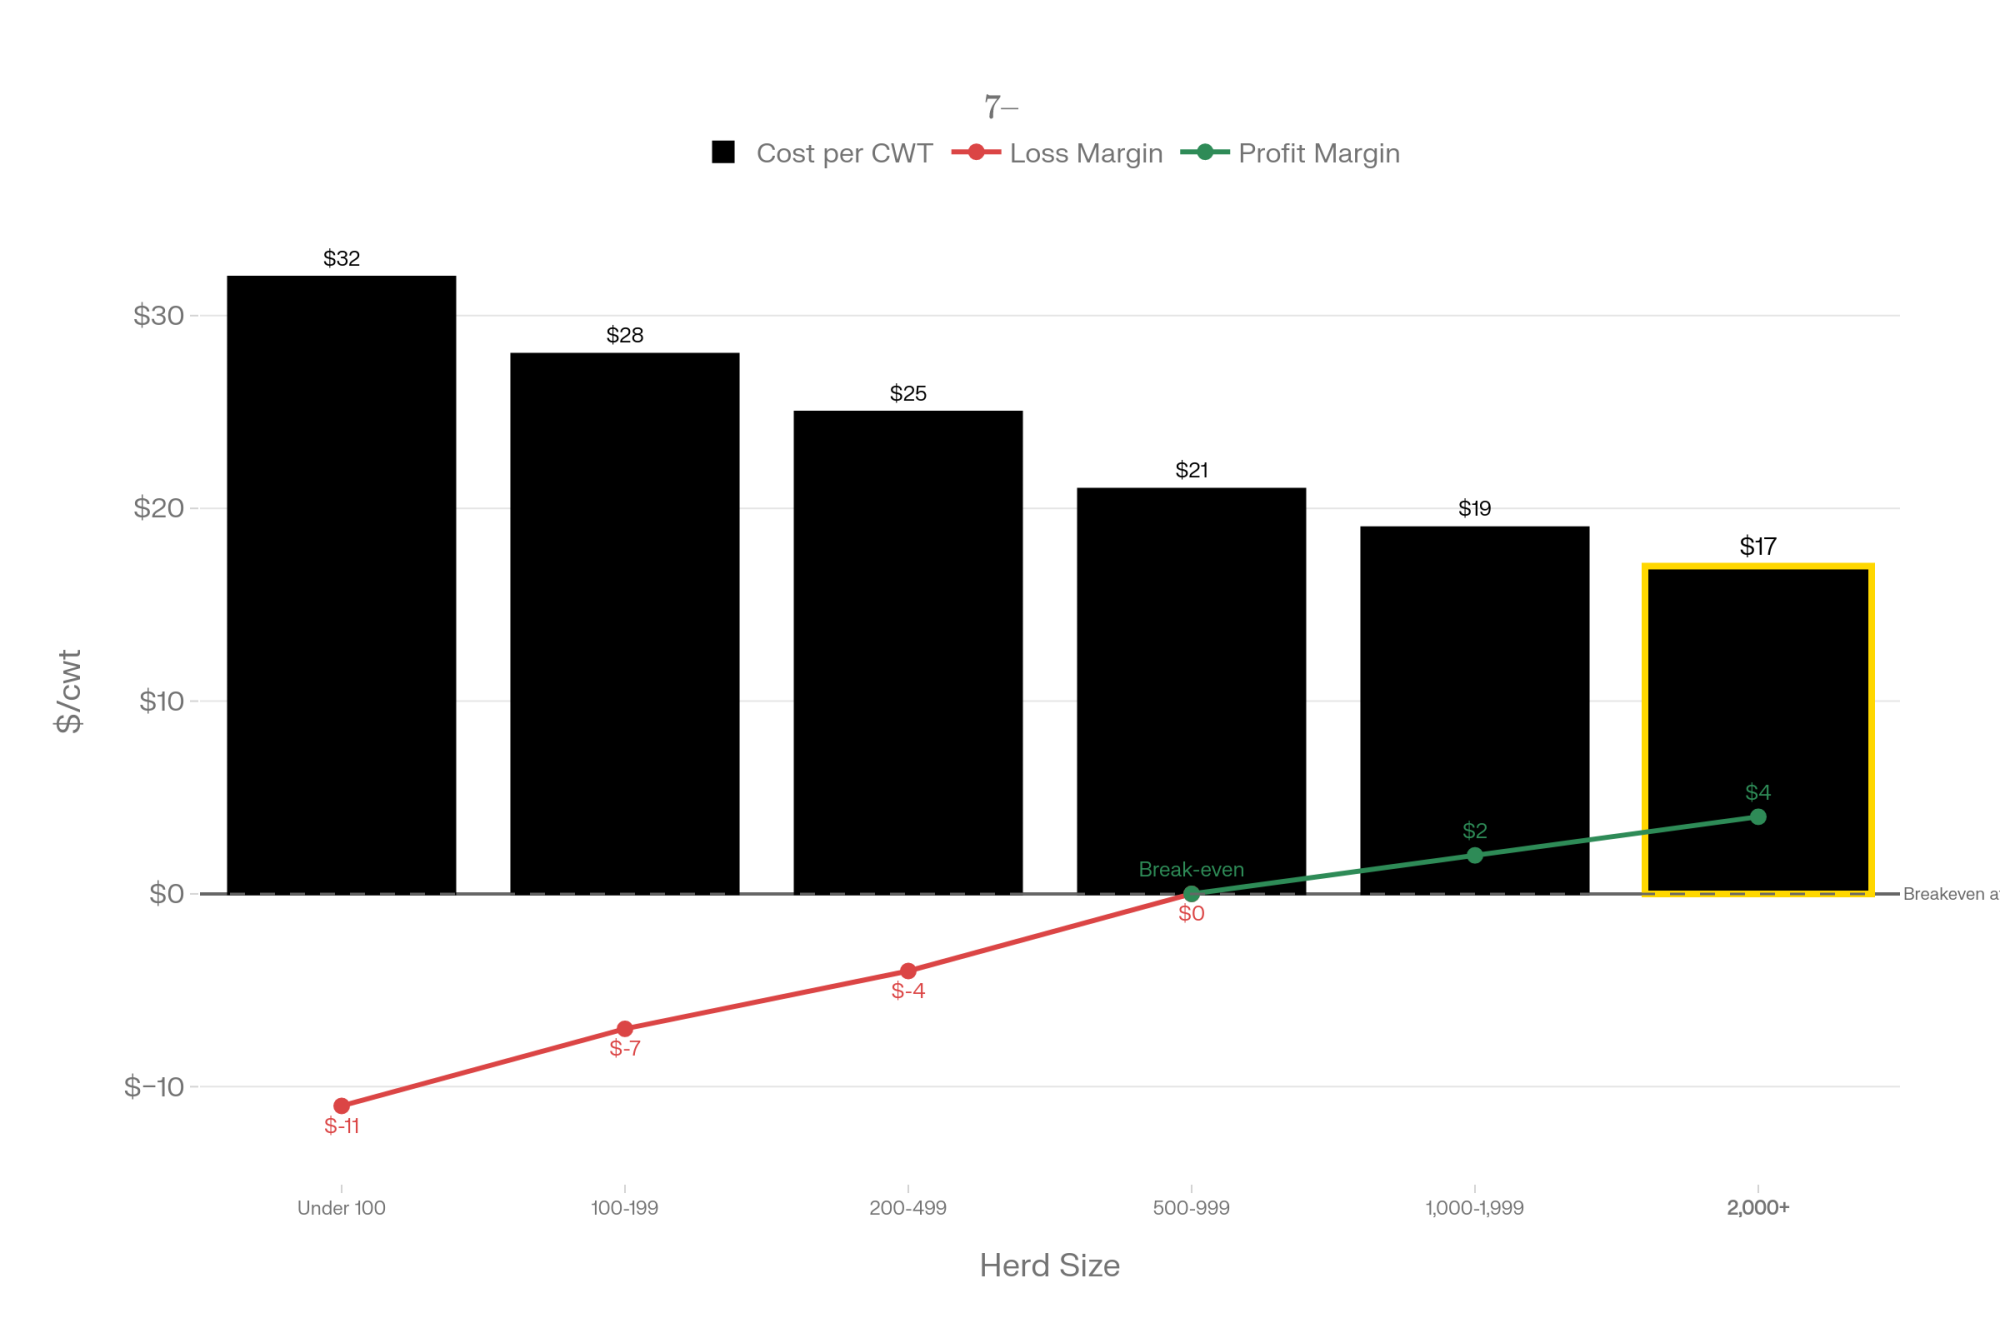
The numbers from the University of Wisconsin Extension and the USDA Economic Research Service analysis paint a clear picture:
| Herd Size | Cost per CWT | Margin at $21 Milk | Annual Impact (300 cows, 25K lbs/cow) |
|---|---|---|---|
| Under 100 cows | $31–$34 | -$10 to -$13 | -$187K to -$244K |
| 100–199 cows | $27–$29 | -$6 to -$8 | -$112K to -$150K |
| 200–499 cows | $24–$26 | -$3 to -$5 | -$56K to -$94K |
| 500–999 cows | $20–$22 | -$1 to +$1 | -$19K to +$19K |
| 1,000–1,999 cows | $18–$20 | +$1 to +$3 | +$19K to +$56K |
| 2,000+ cows | $16–$18 | +$3 to +$5 | +$56K to +$94K |
Consider what these numbers mean when milk prices sit around $21-22 per hundredweight, which has been our general range through 2024-2025.
A 2,500-cow operation producing at $17/cwt operates with a comfortable $4-5/cwt margin. A 300-cow operation at $25/cwt faces a $3-4/cwt shortfall at that same milk price.
Same market conditions. Same milk check calculations. Very different financial outcomes.
THE UNCOMFORTABLE TRUTH
The Myth: “If we just work harder and tighten up management, we’ll make it through.”
The Math: A 300-cow operation producing at $25/cwt faces structural losses of $3-4 per hundredweight regardless of management intensity when milk prices sit at $21/cwt. At 2.5 million pounds of annual production, that’s $75,000-$100,000 in annual losses—not from poor management, but from cost structures that scale determines.
The gap isn’t effort-driven. It’s scale-driven. Understanding this distinction is essential for making sound decisions.
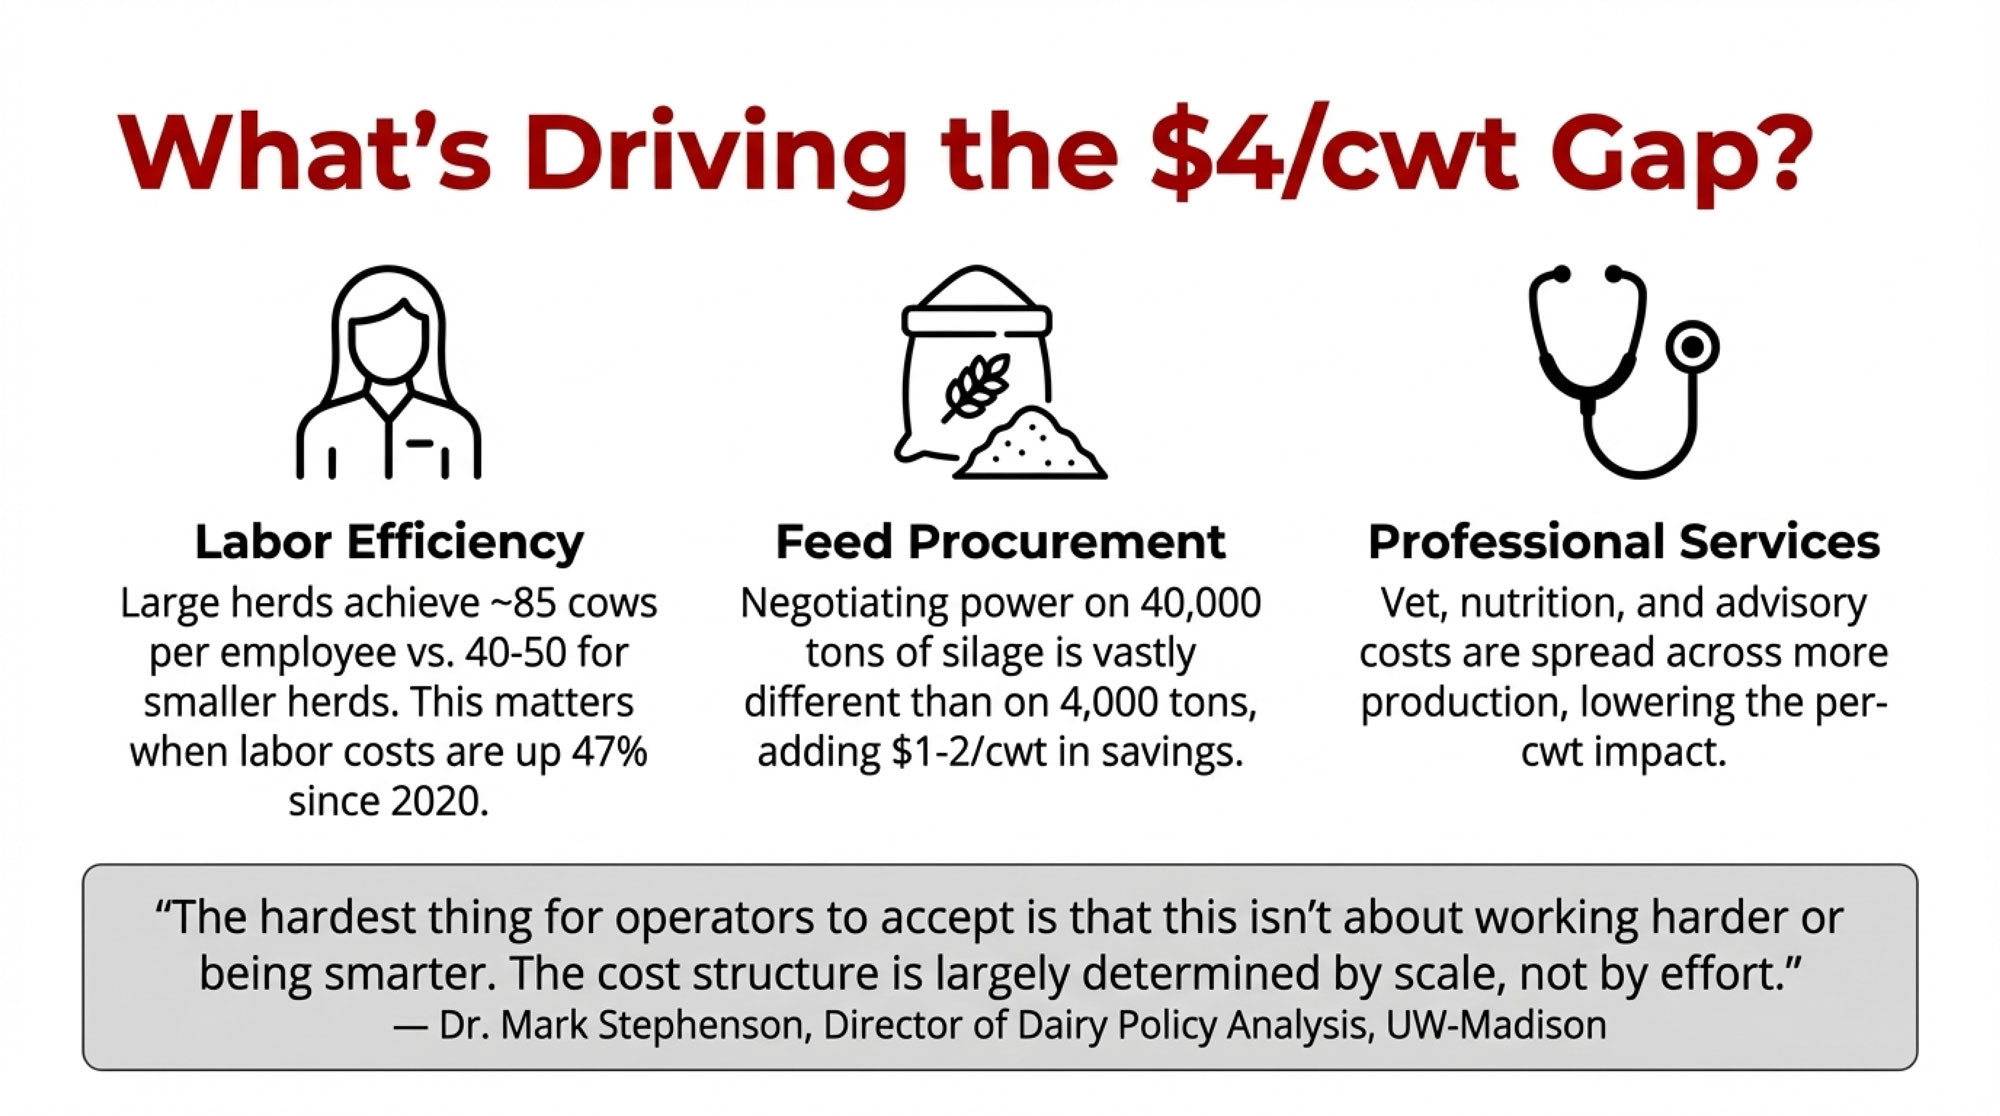
What’s Driving the Gap?
This is where the conversation gets nuanced, because it’s emphatically not about management quality. Anyone who’s spent time in this industry knows exceptional operators running 200-cow dairies.
The advantages stem from structural factors:
Labor efficiency accounts for perhaps the largest piece. University of Minnesota Extension benchmarking shows top-quartile large herds achieving around 85 cows per employee through specialized roles and optimized parlor protocols.
Smaller operations, even well-managed ones, typically run closer to 40-50 cows per employee. That’s not a reflection of management skill—it’s the practical reality of maintaining coverage across all shifts, managing time off and illness, and handling the baseline fresh cow monitoring and feeding protocols that exist regardless of herd size.
Here’s something that makes this even more challenging: labor costs have increased 47% since 2020, according to USDA data. That pressure hits smaller operations harder because labor represents a larger share of their cost structure.
Feed procurement adds another $1-2/cwt. When you’re contracting 40,000 tons of corn silage equivalent annually, the negotiating dynamics differ substantially from purchasing 4,000 tons at harvest.
Professional services—veterinary care, nutritional consulting, financial advisory work—carry similar fixed costs whether you’re milking 200 cows or 2,000. Distributed across greater production, the per-hundredweight impact diminishes considerably.
Dr. Mark Stephenson, who directs dairy policy analysis at UW-Madison, framed it this way: “The hardest thing for operators to accept is that this isn’t about working harder or being smarter. The cost structure is largely determined by scale, not by effort.”
That’s a difficult message to hear. But understanding it clearly seems essential for making good decisions.
The Revenue Side: Components Matter More Than Ever
While the cost picture favors scale, the revenue equation has shifted in ways that create opportunity for well-managed herds of any size—if you’re paying attention to what processors actually want.
Component pricing has become increasingly important. Federal order data shows butterfat values have strengthened significantly through 2024-2025, with Class III component prices reflecting strong demand for milkfat. You can track current values through USDA-AMS Dairy Market News weekly reports at ams.usda.gov.
What this means practically: a herd averaging 4.2% butterfat versus 3.8% butterfat can capture meaningful additional revenue at current component prices—potentially $80,000-$120,000 in additional annual milk income for a 400-cow operation producing 25,000 pounds per cow, depending on market conditions.
The shift toward component value creates one of the few areas where mid-sized operations can partially offset their cost disadvantage through management intensity and genetic focus. It’s not a complete solution to the structural gap, but it’s meaningful.
The Regional Dimension
One factor that deserves more attention than it typically receives is the significant role geography plays in dairy economics.
A 500-cow operation in Wisconsin faces fundamentally different structural conditions than an equivalent operation in the Texas Panhandle—and these differences tend to compound over time.
I was talking with a fourth-generation Minnesota dairyman last spring who put it memorably: “My grandfather competed against the farm down the road. My father competed against farms across the state. I’m competing against operations in Texas that pay half what I do for land and a third of my regulatory costs.”
That’s a different game entirely.
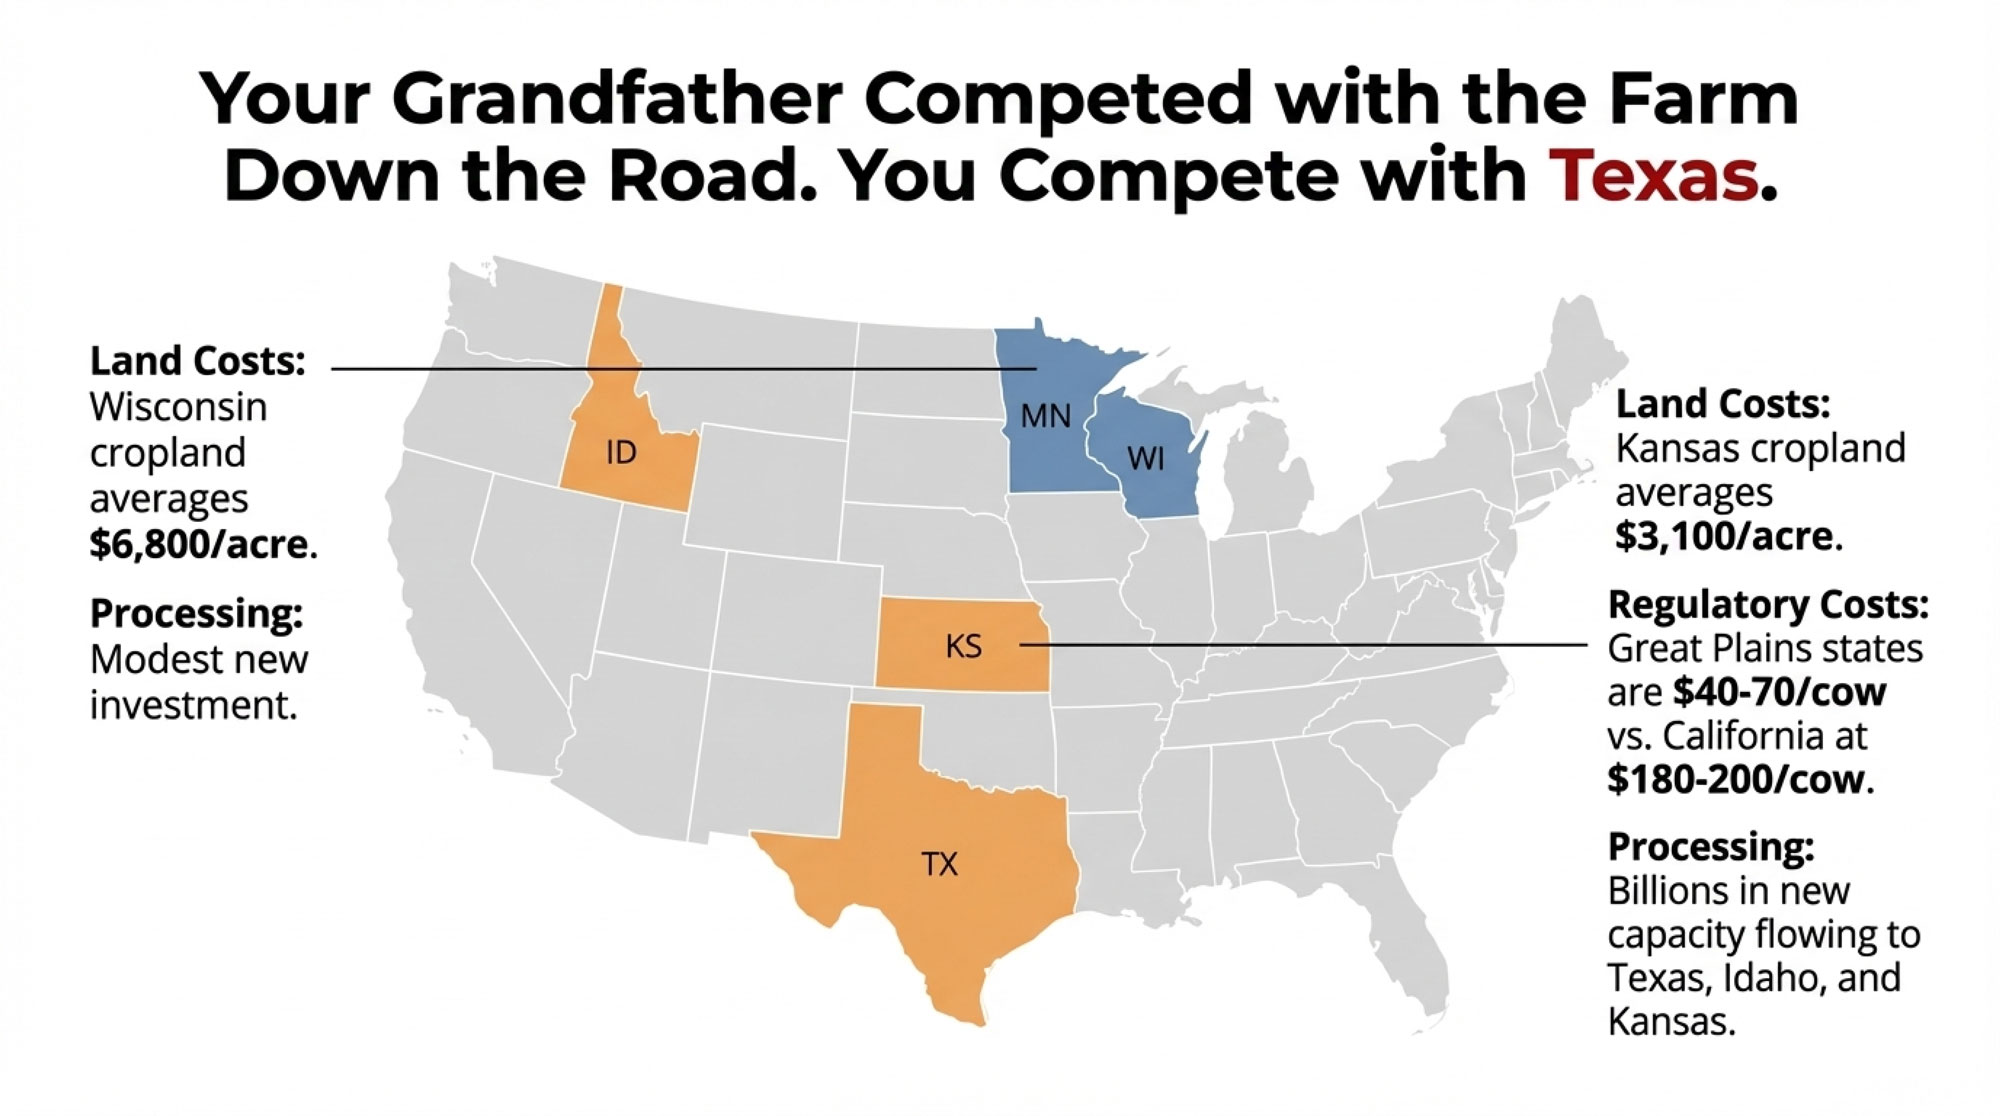
Land Costs
Land costs present the most visible differential.
The USDA’s August 2024 Land Values Summary shows Wisconsin cropland averaging $6,800 per acre statewide. In traditional dairy counties with strong infrastructure and competition for acres, prices run considerably higher—often well above $10,000 per acre for quality dairy-supporting land.
Great Plains agricultural land typically runs $2,500-4,000 per acre according to USDA state-level data. Kansas cropland averaged $3,100 per acre in the same 2024 summary.
For an operation requiring 1,500 acres of land base, those regional differentials represent millions of dollars in capital requirements before purchasing a single animal.

Regulatory Frameworks
Regulatory frameworks vary considerably across states, and this warrants thoughtful discussion.
California operations face documented compliance costs of $180-200 per cow annually, according to UC-Davis research—covering groundwater regulations, methane-reduction requirements, and labor law compliance.
Great Plains states report regulatory costs in the $40-70 per cow range based on land-grant university analysis.
It’s worth being clear: these California regulations address legitimate environmental and worker protection concerns. The Central Valley faces real groundwater challenges. Methane reduction serves genuine climate goals.
The question isn’t whether these objectives matter—they do. The question is how cost differentials affect where dairy production concentrates over time.
Processing Infrastructure
Processing infrastructure increasingly favors certain regions.
Industry reports indicate billions of dollars in announced dairy processing capacity since 2020, with a substantial majority targeting Texas, Idaho, Kansas, and Colorado.
Wisconsin, despite maintaining more licensed dairy farms than any other state, has seen relatively modest new processing investment.
The practical implication for mid-sized Wisconsin operators considering expansion: securing processing capacity for additional milk volume has become genuinely challenging in many areas.
The Processing Relationship
Conversations with producers consistently raise questions about processor dynamics, though many farmers remain cautious about discussing them publicly.
One central Minnesota operator captured the sentiment with characteristic dry humor: “I’ll tell you exactly what I think about our marketing situation—right after I retire.”
Processing consolidation has been substantial. When Dean Foods entered bankruptcy in 2019, and Dairy Farmers of America acquired 44 processing facilities, the industry landscape shifted meaningfully.
DFA now handles approximately 30% of U.S. milk production according to industry analysis and Rabobank’s Global Dairy Top 20 rankings, operating as both the nation’s largest dairy cooperative and one of its largest processors.
“The relationship between farmers and processors has fundamentally changed over the past two decades. We’ve gone from numerous regional options to, in many areas, one or two realistic choices. That changes the nature of every conversation.” — Midwest dairy economist, requesting anonymity due to industry relationships
Multiple Perspectives
This dual role creates interesting dynamics worth examining from multiple angles.
From the processor and cooperative perspective—and this deserves fair consideration—scale creates efficiency benefits that can ultimately support farmer returns. Consolidated processing enables better market access, more sophisticated risk management tools, and infrastructure investment that might not otherwise materialize.
From the producer perspective, limited alternatives constrain negotiating position. When your potential buyers understand your alternatives are limited, the dynamics of those conversations shift accordingly.
A southeastern Wisconsin producer I spoke with recently described trying to find a new home for his milk after his cooperative restructured routes:
“I called six processors. Three didn’t return my call. Two said they weren’t taking new suppliers. One offered terms that would’ve cost me money to accept. That’s the market reality we’re operating in.”
FMMO Impact
The June 2025 Federal Milk Marketing Order adjustments offer another useful illustration.
Updated make allowances increased processor cost recovery—cheese make allowances rose from $0.20 to approximately $0.25 per pound, with similar increases for butter, nonfat dry milk, and dry whey, according to USDA-AMS. These changes shift meaningful dollars from farmer payments to processor cost coverage across the federal order system.
Mike Yager, a Wisconsin producer who has studied FMMO mechanics extensively, offered this observation to Wisconsin State Farmer last November: “Farmers probably aren’t talking about it because they don’t physically see the individual deductions worked into the formulas. And honestly, concern about processor relationships is another reason people stay quiet.”
The Succession Question
One pattern from industry surveys and farm family conversations has stayed with me: a substantial majority of dairy farmers approaching retirement age report having no identified successor for their operation.
Consider what that represents. These aren’t predominantly struggling operations—many remain technically profitable.
This is an entire generation of dairy families concluding that the transition to the next generation doesn’t make practical sense.
Having talked with numerous farm families about this, I can tell you it’s not about work ethic or commitment among younger generations.
The sons and daughters who grew up on these operations understand dairy work intimately. They’ve experienced the 4:30 AM milkings, the seven-day weeks, the income volatility tied to commodity markets.
They’ve also evaluated alternative career paths.
A Next-Generation Perspective
One young woman’s story illustrates the calculation many in her generation are making.
Her family operates a 380-cow dairy in upstate New York. She completed her degree in agricultural economics at Cornell three years ago and now works in agricultural lending.
“I love this farm,” she told me. “Spent every summer of my childhood here. But I ran the numbers on what it would take to buy out my parents, expand to a competitive scale, and generate reasonable returns on that investment.”
“The math didn’t work—not unless I was prepared to stake everything on commodity markets I can’t influence.”
Her parents understand the reasoning. They’re disappointed, certainly, but the analysis is sound.
A Wisconsin operator in his late fifties, who asked that I not use his name, reflected similarly: “We always assumed the kids would take over. But watching them work through what they’d need to invest against what they could reasonably expect to earn… they’re being rational. Hard to argue with their conclusions.”
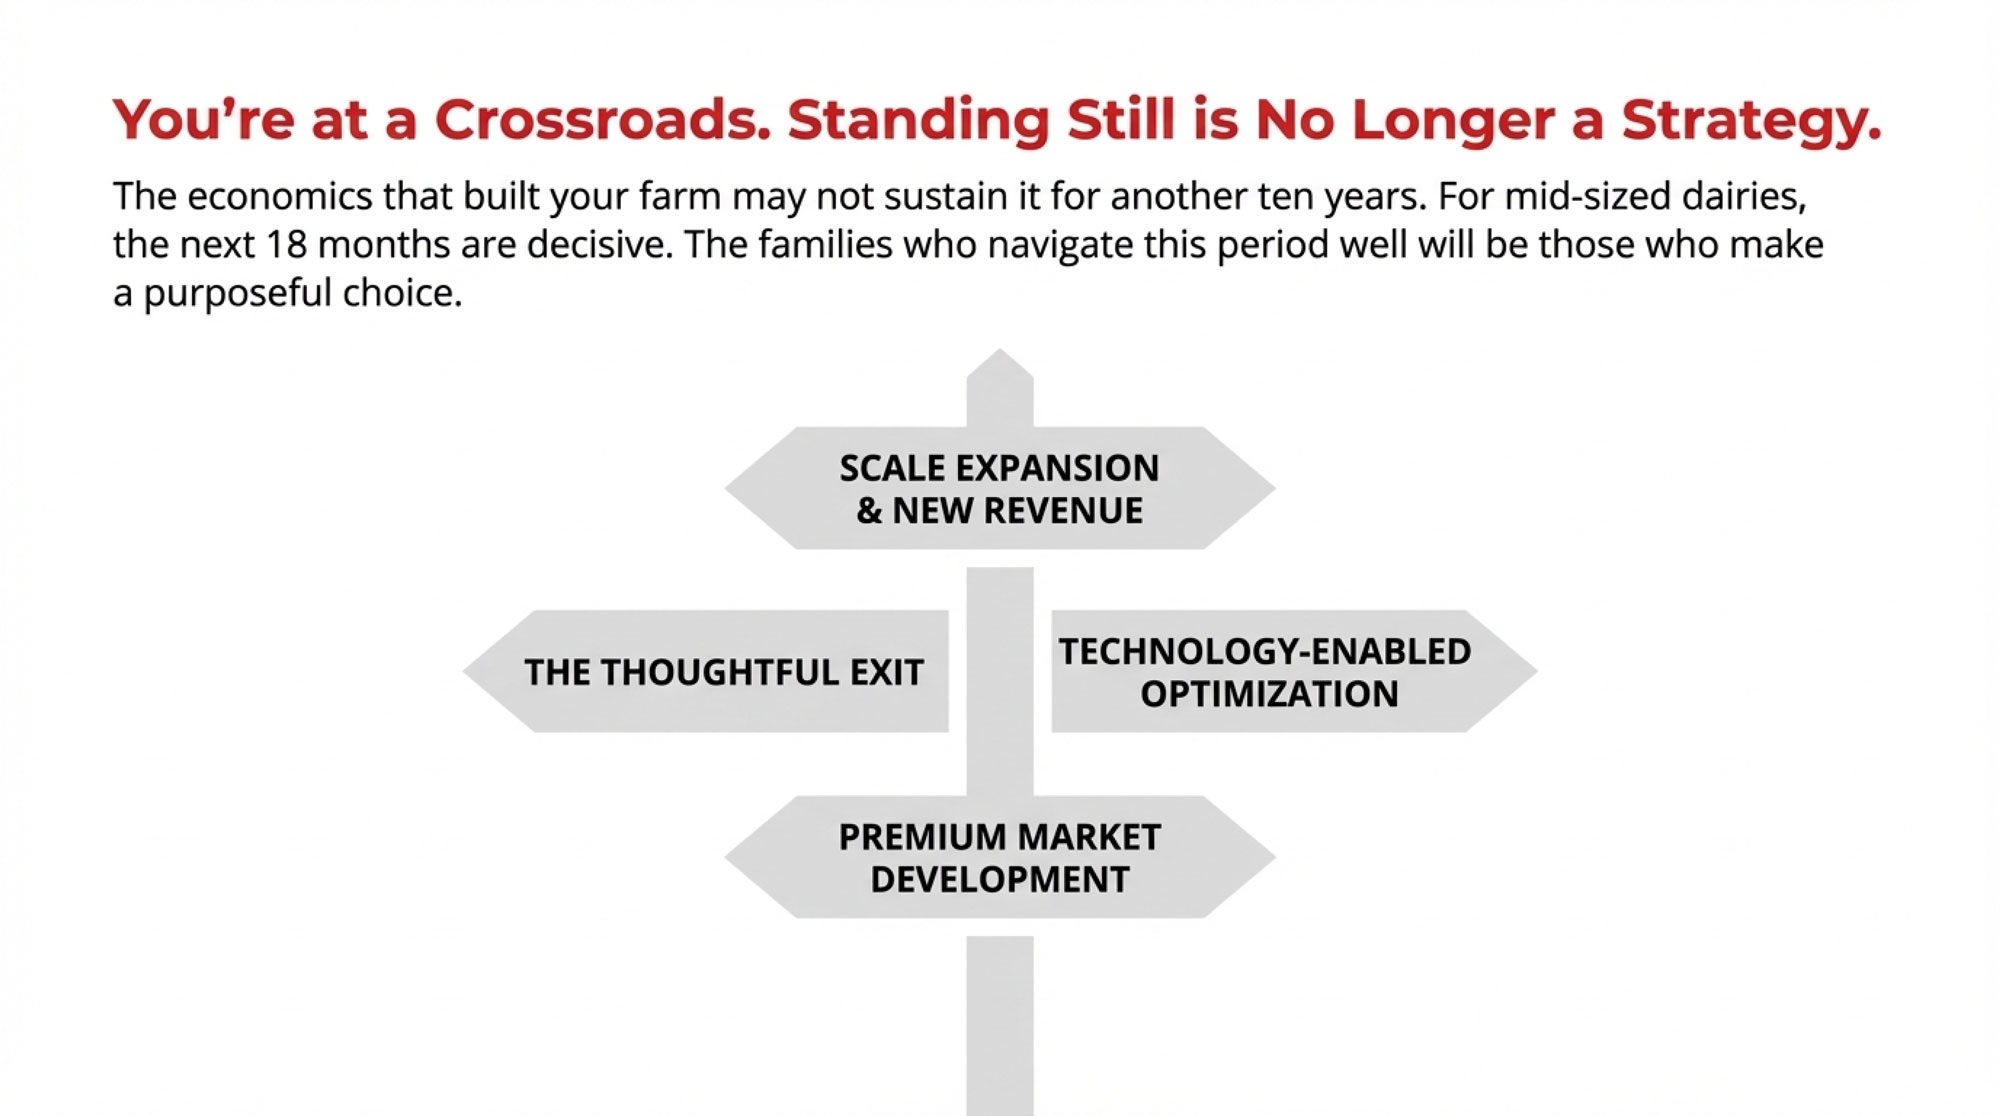
Pathways Worth Considering
For mid-sized operations evaluating their positioning, several realistic pathways emerge from the data and from conversations with farm families and advisors.
None represents a universal solution. Each fits particular circumstances and family goals—and increasingly, each fits particular geographies.
Questions Worth Asking Yourself
Before evaluating specific pathways, honest answers to these questions can help clarify direction:
- Do we have family members genuinely interested in continuing the operation—and have we actually asked them directly?
- What does our processor relationship look like over the next 5-10 years?
- How does our cost structure compare to the benchmarks?
- What’s our debt position, and how does it affect our flexibility?
- If we’re honest about our energy levels, how many more years of 60-hour weeks feel sustainable?
- What does “success” look like for our family—is it continued farming, or family prosperity that might take different forms?
Scale Expansion
Some operations are pursuing growth to reach cost structures where commodity production pencils out—typically targeting 1,000+ cows.
Capital requirements run $4-6 million for meaningful expansion. Current interest rates in the 6.5-7.5% range create substantial debt service obligations.
Michigan State University analysis offers a useful perspective: farms that tripled in size using forage-based production models achieved stronger debt-to-asset ratios over 10-year horizons than those that emphasized capital-intensive automation investments.
Farm Credit lending data suggests that a meaningful minority of major dairy expansions achieve intended financial outcomes without restructuring—a reminder that expansion carries genuine risk alongside opportunity.
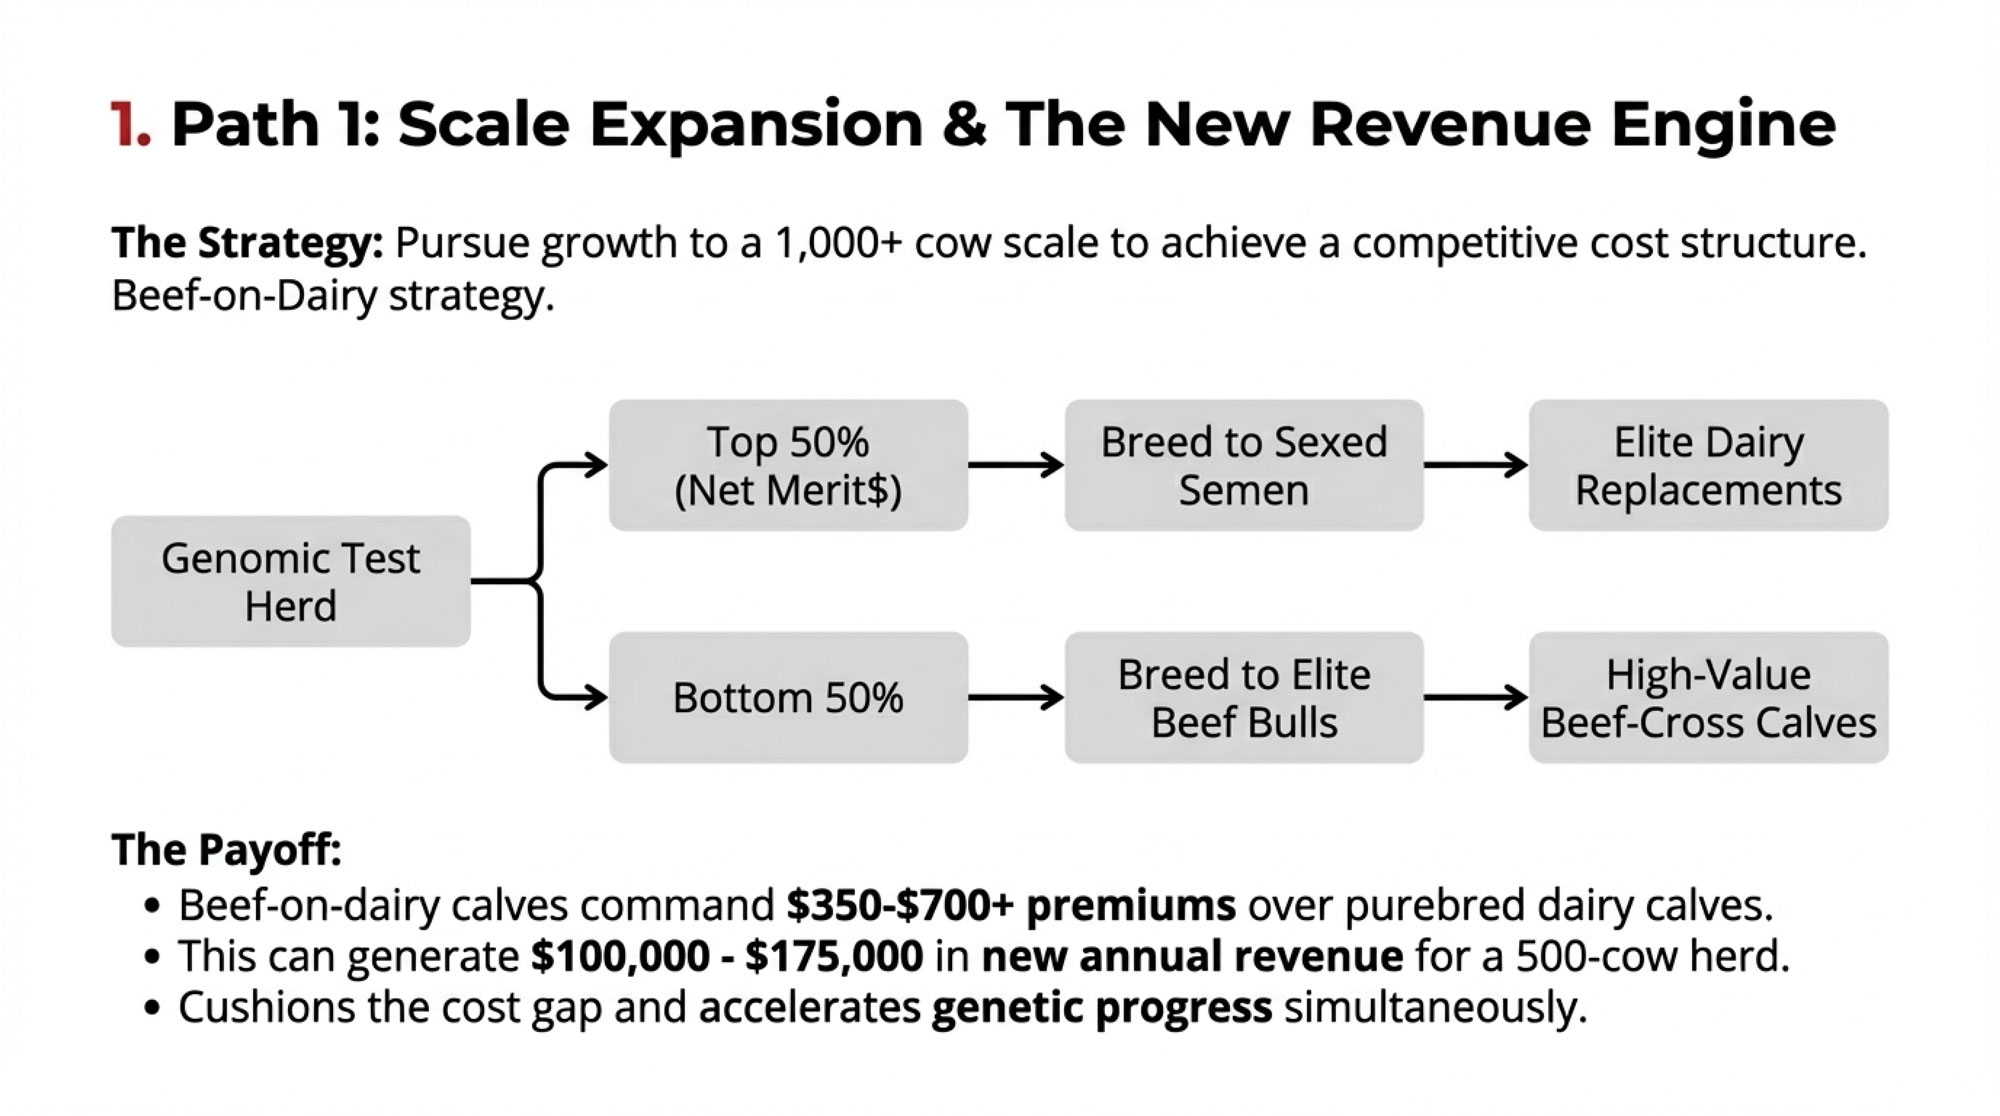
Genetic Tools Creating New Revenue Streams
Here’s something that’s quietly changing the expansion calculus: beef-on-dairy programs combined with genomic testing are creating secondary revenue streams that help offset those challenging cost structures.
The National Association of Animal Breeders reported beef-on-dairy semen sales grew by 317,000 units in the U.S. in 2024 alone—clear evidence of widespread adoption. Industry surveys suggest the majority of U.S. dairy operations now incorporate some level of beef-on-dairy crossbreeding.
The economics are compelling. Market reports indicate beef-on-dairy calves command $350-700 per head premiumscompared to purebred dairy calves, with strong crossbred calves bringing $800-1,000 at current market levels, according to livestock auction data.
Here’s what’s worth noting about timing: Operations that implemented beef-on-dairy programs in 2023 are now generating meaningful additional annual revenue that late adopters won’t fully realize for another year or two. Early movers have captured additional cash flow while building the genetic foundation and market relationships that compound over time.
The strategy works like this: use sexed dairy semen on your highest-genomic-merit cows to produce replacement heifers, then breed the bottom half of your herd to beef bulls. You’re simultaneously accelerating genetic progress in your milking string while generating substantial calf revenue.
How do you identify which cows belong in which group? Genomic testing enables precision breeding. CDCB confirms over 1 million animal genotypes are now submitted annually—that number has roughly doubled every five years since 2011.
For practical sorting, most operations use Net Merit (NM$) or similar composite indexes. Cows ranking in the top 50% of your herd on NM$ should receive sexed dairy semen for replacement production. Cows in the bottom 50%—particularly those with unfavorable health trait profiles—become candidates for beef-on-dairy breeding.
Some operations refine this further by also considering Daughter Pregnancy Rate (DPR), Somatic Cell Score (SCS), and specific component traits. A cow with marginal NM$ but excellent DPR might still merit dairy breeding; one with acceptable NM$ but chronic elevated SCS might not.
Research indicates genomic selection for feed efficiency and other traits can deliver meaningful annual savings per cow, with lifetime values potentially exceeding $200-250. Meanwhile, genomic testing has roughly halved generation intervals—enabling genetic improvements that compound annually.
For a 500-cow operation implementing both beef-on-dairy and genomic-driven selection, the math can shift meaningfully: $100,000-$175,000 in additional annual calf revenue under current market conditions. That won’t entirely close the $4/cwt cost gap, but it provides a meaningful cushion.
| Herd Size | Cows Bred to Beef | Avg. Premium per Calf | Annual Calf Revenue | 3-Year Cumulative |
|---|---|---|---|---|
| 300 cows | 150 (bottom 50%) | $525 | $78,750 | $236,250 |
| 500 cows | 250 | $525 | $131,250 | $393,750 |
| 750 cows | 375 | $525 | $196,875 | $590,625 |
| Early Adopter (2023 start) | — | — | Already banking | 3 years of revenue |
| Late Adopter (2026 start) | — | — | Zero to date | $0 (3-year opportunity cost) |
This pathway generally fits younger operators with extended time horizons, operations with committed processor relationships in regions maintaining available capacity, and families with financial reserves to navigate the expansion and stabilization period.
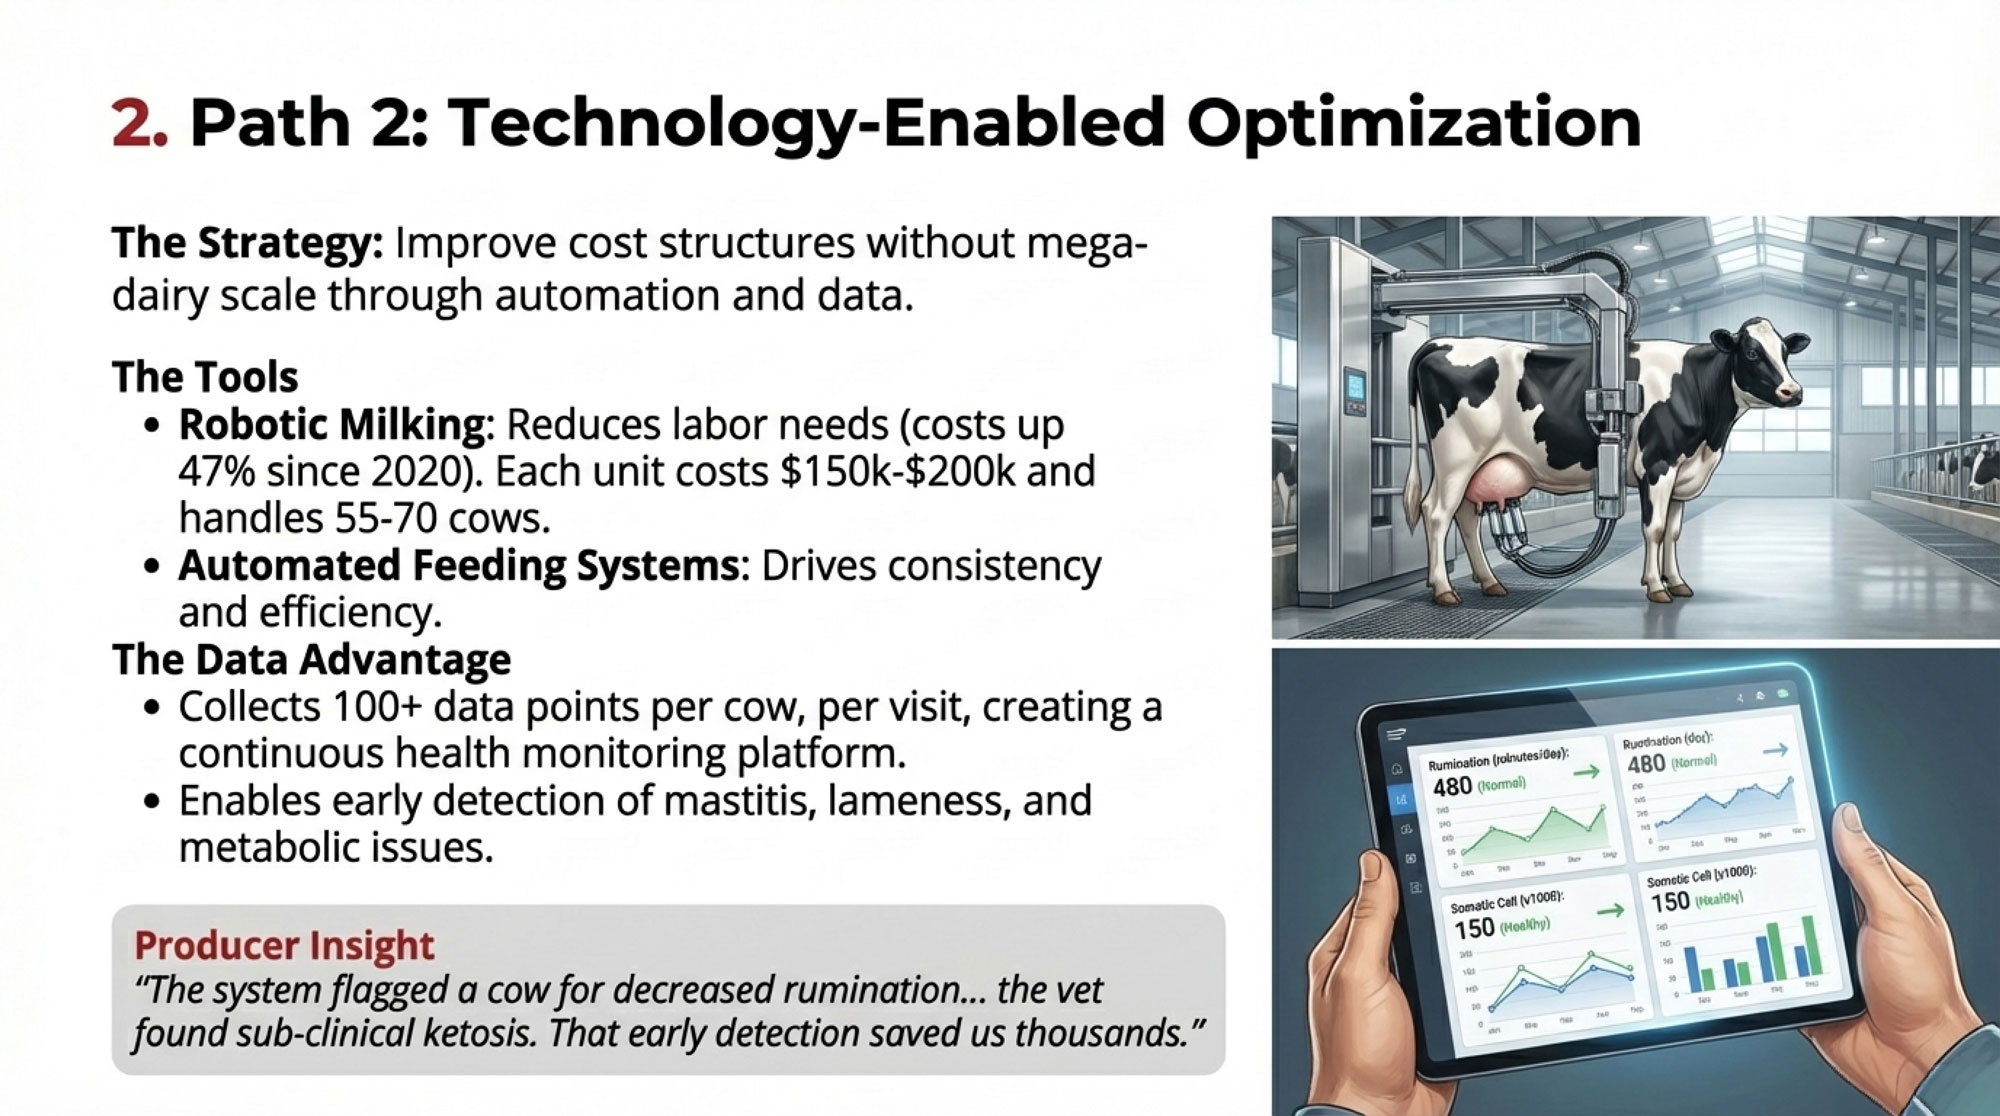
Technology-Enabled Optimization
This represents newer territory that warrants attention. Robotic milking and automated feeding systems are enabling some operations to improve cost structures without pursuing mega-dairy scale.
University of Minnesota Extension has documented results from operations in the 250-300 cow range that implemented robotic milking. Several have reduced labor requirements substantially while achieving meaningful cost-per-hundredweight improvements.
Regional economics matter here, too. Technology optimization delivers the highest ROI in regions where labor costs have risen most dramatically. With labor costs up 47% since 2020, according to USDA data, Upper Midwest operations face some of the most acute labor pressure—making automation investments relatively more attractive than in regions with different labor dynamics.
As one producer involved in their case studies observed: “We’re not trying to be the biggest operation around. We’re trying to be the most efficient at our scale.”
The Data Advantage
What’s particularly compelling for tech-forward operations is the data these systems generate.
Every time a cow visits the robot, over 100 data points are collected—milk yield, flow rate, electrical conductivity, somatic cell indicators, and, in many systems, body condition scoring through integrated cameras.
This isn’t just automation—it’s a continuous health monitoring platform. Farmers consistently report improved health detection as a primary benefit, with early identification of mastitis, lameness, and metabolic issues cited as top advantages in industry surveys.
One Wisconsin producer’s experience captures the practical value: “The system flagged one of our best cows for decreased rumination, though she looked perfectly fine to me. The vet found sub-clinical ketosis before any visible symptoms. That early detection saved us thousands in treatment costs and lost production.”
The predictive health monitoring appeals to a different kind of operator than scale expansion does. If you’re analytically minded, comfortable with technology, and interested in optimizing individual cow performance rather than managing large labor crews, this pathway may fit your management style.
Current economics: robotic milking systems cost $150,000-200,000 per installed unit, with each unit typically handling 55-70 cows, depending on configuration and management. Results across operations show meaningful variation. Success appears to correlate strongly with operator comfort with technology systems and the quality of local dealer support.
| Strategic Pathway | Upfront Capital | Annual Revenue Potential | Risk Level | Timeline to Impact | Best Fit |
|---|---|---|---|---|---|
| Premium Market(organic, A2, direct) | $45K–$250K | +$8–$15/cwt premium | High(market execution) | 2–3 years | Near metro areas, marketing-minded families |
| Scale Expansion(1,000+ cows) | $4M–$6M | Cost reduction to $18–$20/cwt | High (debt service) | 3–5 years | Younger operators, strong processor ties |
| Beef-on-Dairy + Genomics | $15K–$30K (genomic testing) | $100K–$175K annually | Low(proven model) | 1–2 years | Any herd size, immediate cash flow |
| Planned Exit | Legal/advisory: $10K–$25K | Preserve $1.5M–$2M equity | Low (if strategic) | 12–18 months | Operators 50+, no successor |
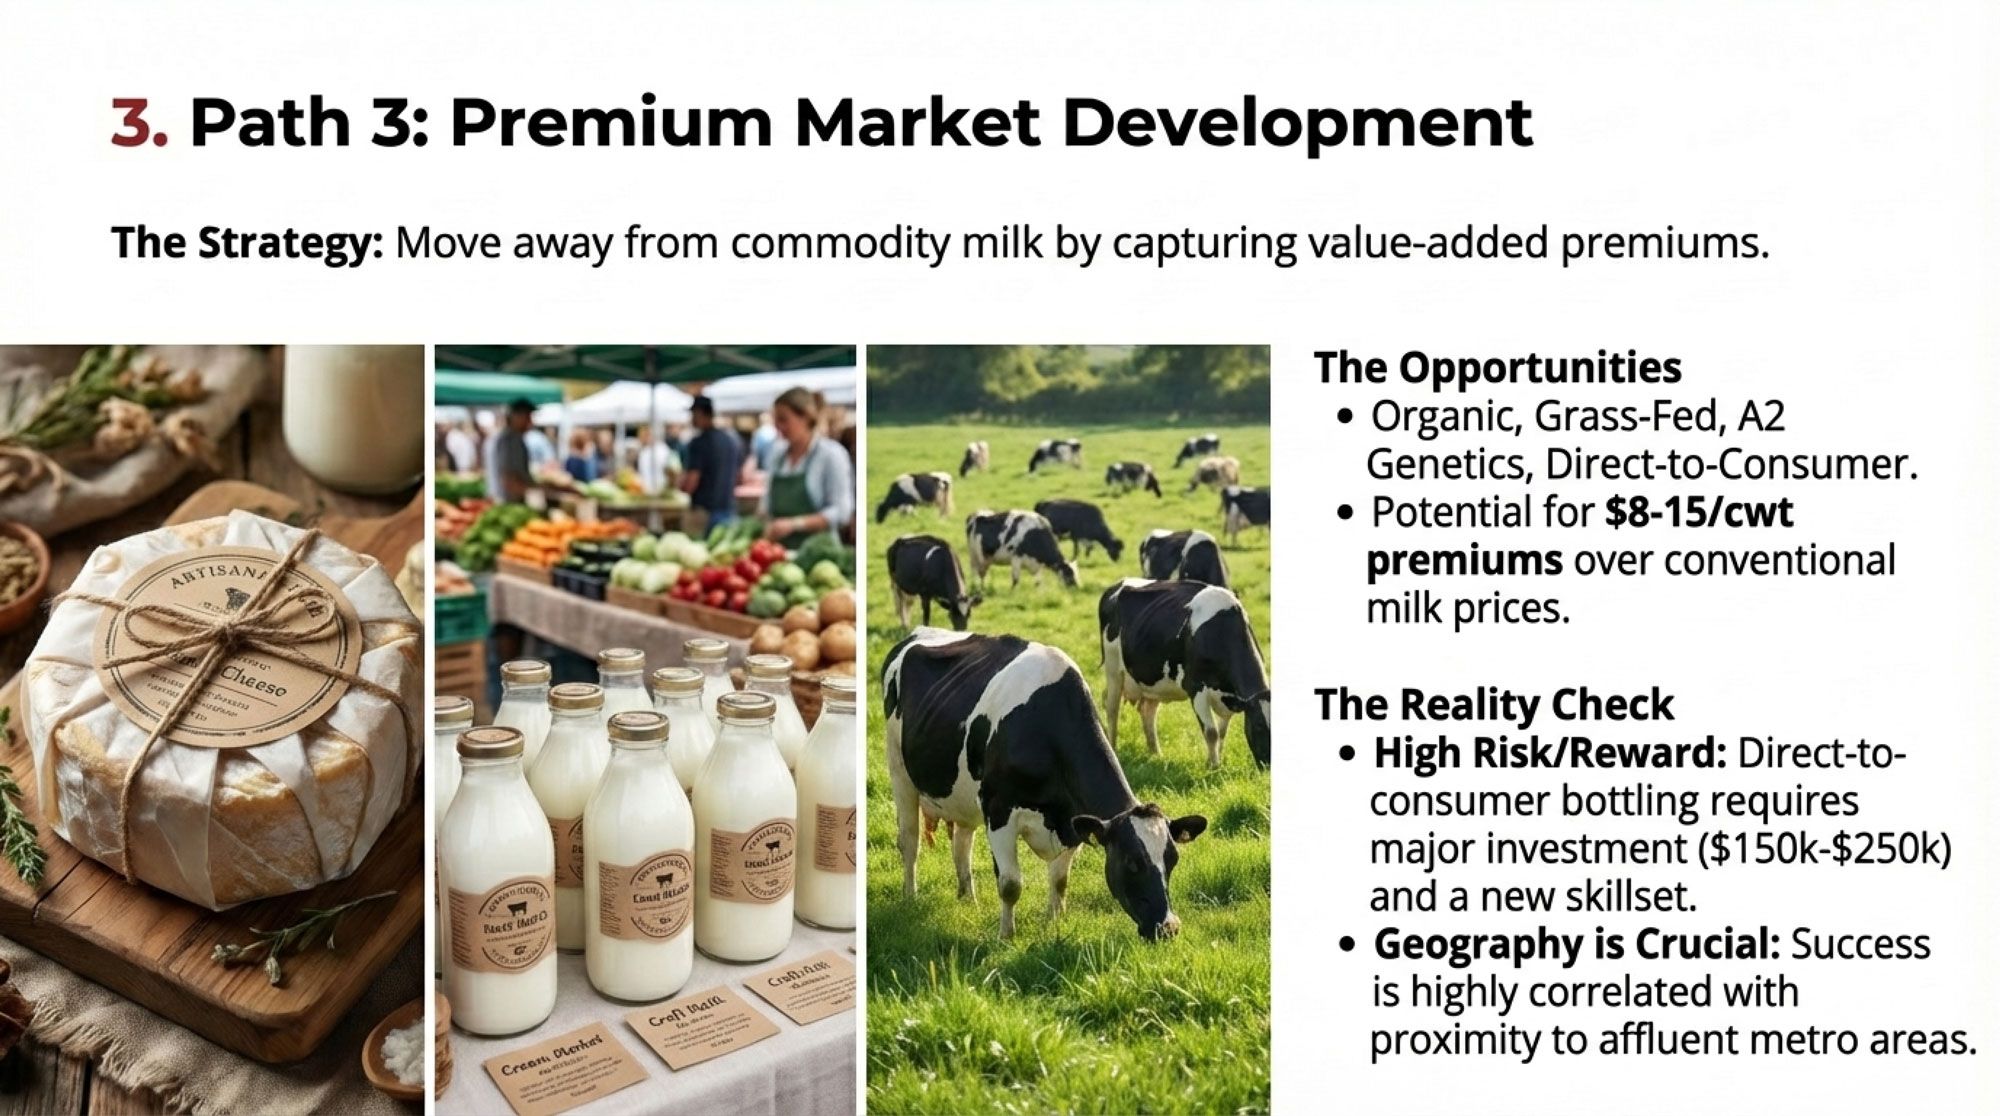
Premium Market Development
Some operations are finding genuine success by stepping away from commodity milk production entirely.
Organic certification, grass-fed programs, A2 genetics, and direct-to-consumer channels—when executed thoughtfully— can capture $8-15/cwt premiums.
Capital requirements vary with approach:
- Organic cooperative transition: $45,000-75,000
- Direct-to-consumer bottling infrastructure: $150,000-250,000
What’s worth noting is that organic cooperative transitions—particularly through established cooperatives like Organic Valley—show reasonable success rates for farms that complete the transition period and maintain certification requirements. Direct-to-consumer ventures carry more risk, with Cornell and other land-grant research suggesting that farmstead processors face significant challenges in the first five years.
Regional fit matters significantly here. Research on farmstead dairy success consistently identifies two factors that correlate with premium-market viability: proximity to population density and regional prosperity. Operations within a reasonable delivery distance of metro areas with higher median household incomes show meaningfully better outcomes meaningfully. If you’re 150 miles from a population center, direct-to-consumer may not be your pathway regardless of execution quality.
This pathway tends to work well for operations with reasonable access to premium-conscious consumer markets, family members genuinely energized by marketing, and a willingness to shift daily work from production agriculture toward food business management.
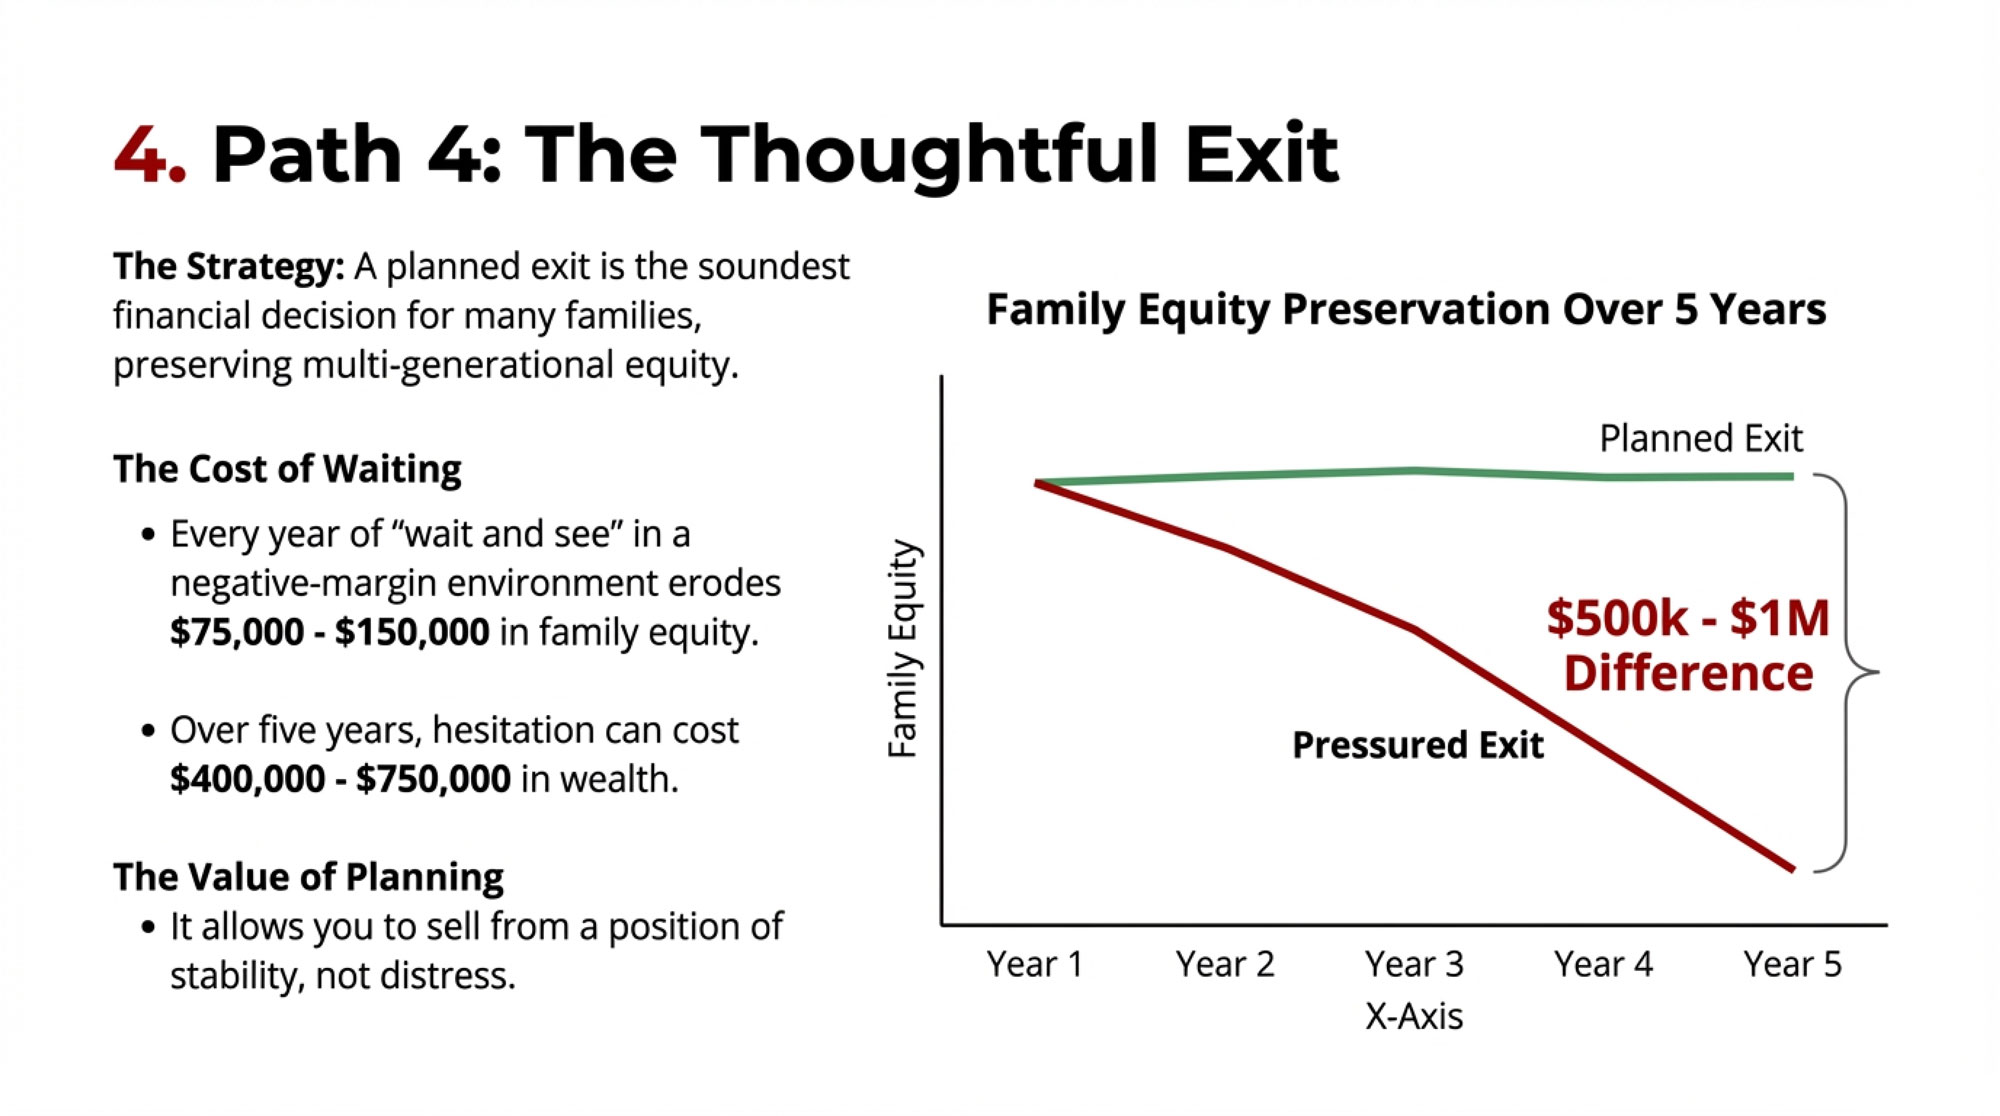
Thoughtful Exit
For many families—and this deserves honest consideration—exiting while meaningful equity remains may represent the soundest financial decision.
An operation holding $2.5-3 million in assets against $1-1.5 million in debt maintains $1.5-2 million in equity. Strategic exit—selling from a position of stability with adequate time to market properly—typically preserves substantially more value than an exit under financial pressure.
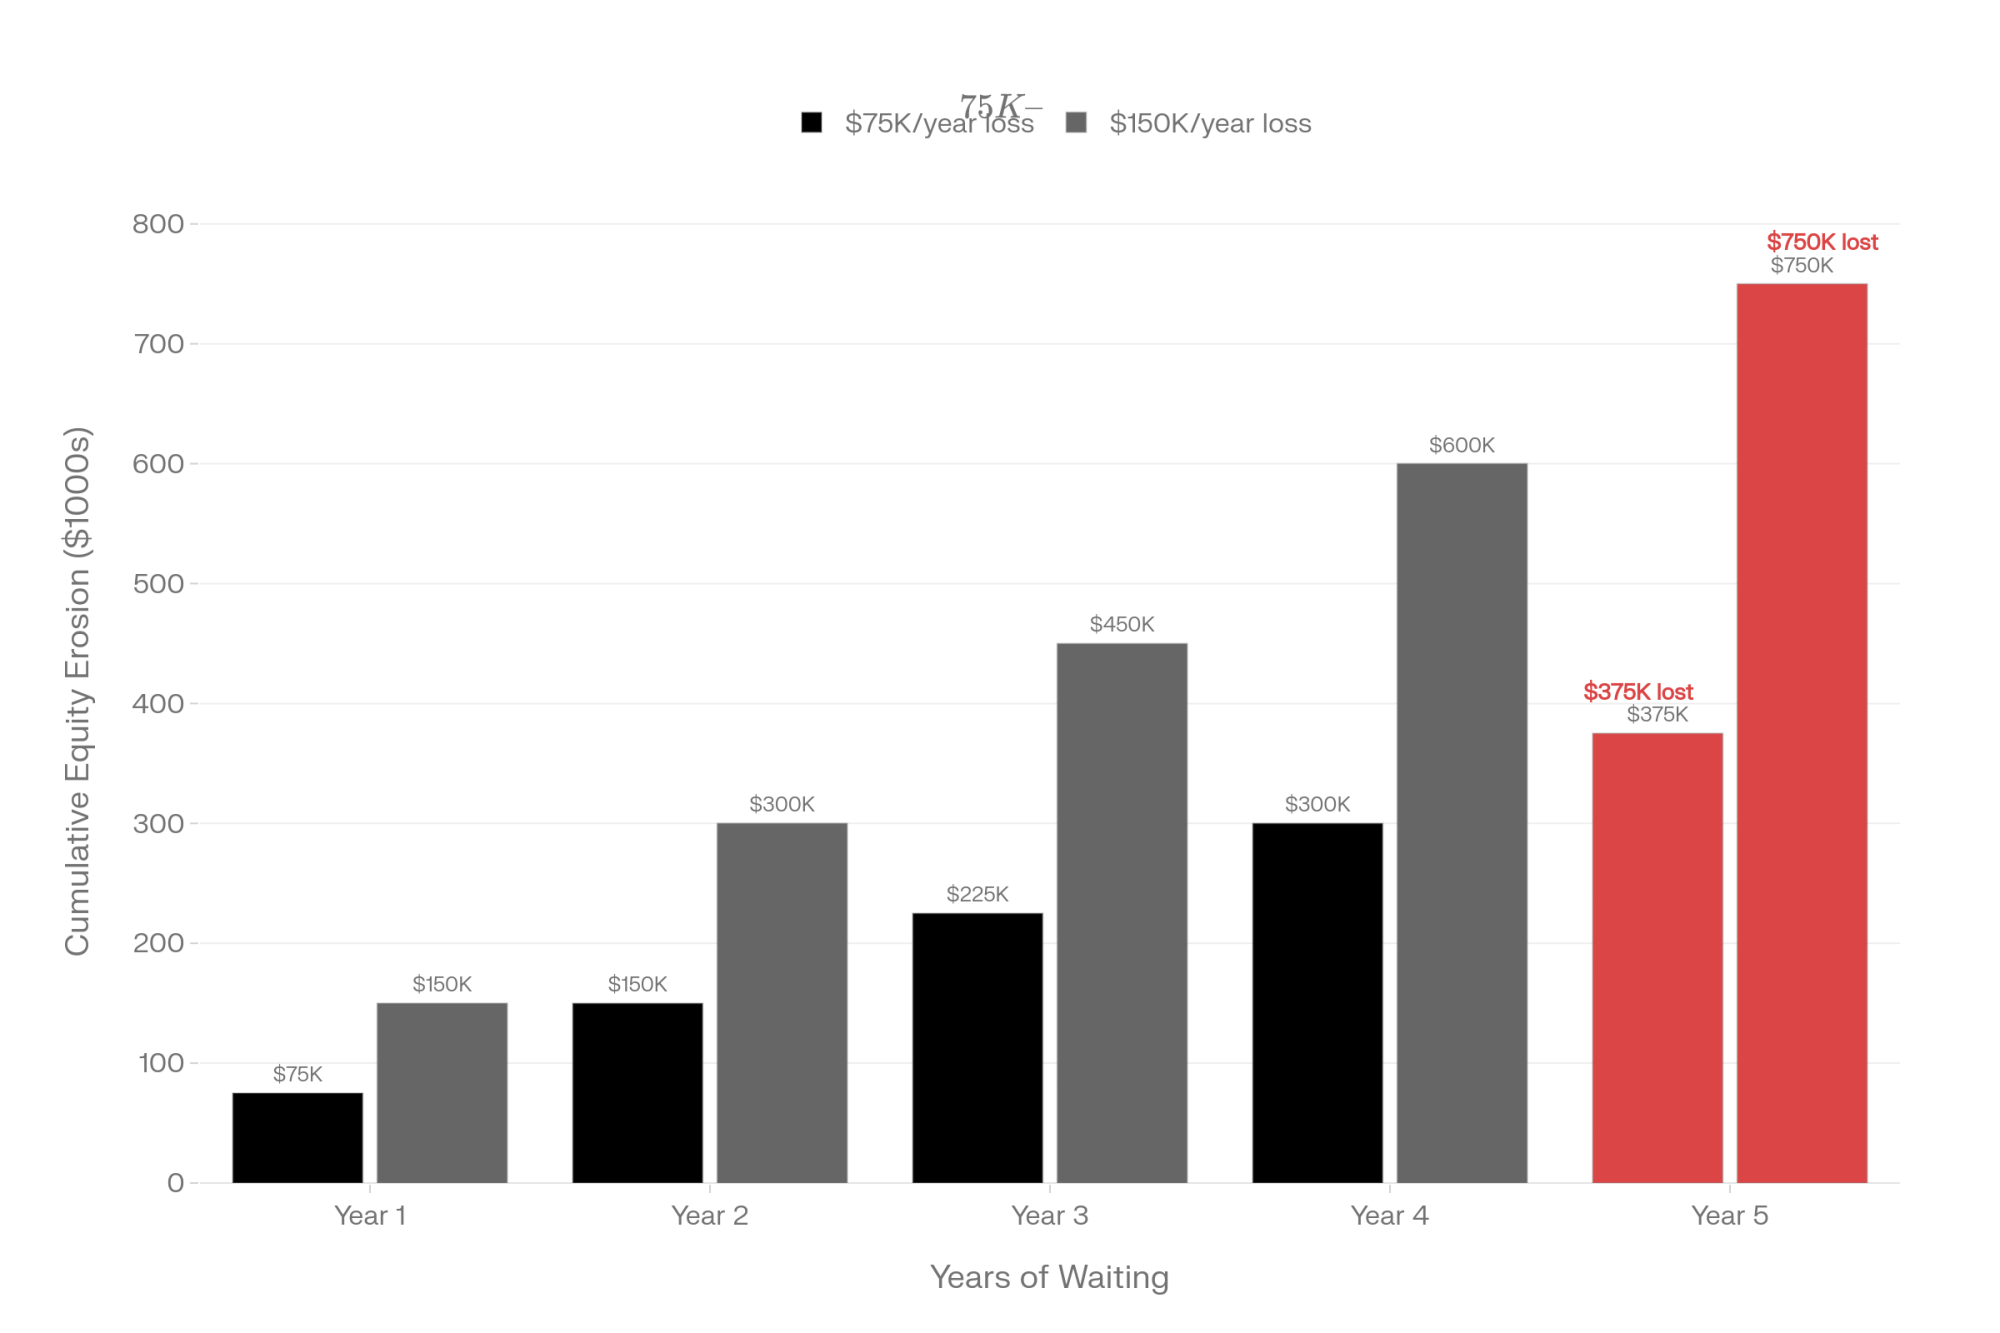
A Farm Financial Standards Council analysis shows that the difference between a planned exit in one’s early-to-mid fifties versus a pressured exit in the early-to-mid sixties can amount to $500,000 to $1 million in preserved family wealth.
The cost of waiting is quantifiable. Every year of deferred decision-making in a negative-margin environment erodes approximately $75,000-$150,000 in family equity for a typical mid-sized operation—that’s the combination of operating losses and asset depreciation that compounds while decisions remain unmade. Over five years, that hesitation can cost the family $400,000-$750,000 in wealth that could have been preserved through earlier action.
One practical observation: timing these conversations around operational rhythms matters. Beginning serious exit planning after spring calving concludes, or once fall harvest and silage work winds down, often allows clearer thinking than attempting major decisions during peak operational demands.
Looking Ahead
Projecting the industry structure five years forward involves genuine uncertainty, and intellectual honesty requires acknowledging that.
Markets evolve. Policy shifts. Consumer preferences move in unexpected directions. Anyone who’s followed this industry for long recognizes that confident predictions frequently miss the mark.
With that caveat, if current trajectories continue without major disruption, here’s what the 2030 landscape might look like:
Farm numbers are likely to settle in the 17,000-20,000 range—representing continued consolidation from current levels, concentrated among operations with fewer than 500 cows.
Production concentration continues its trend. Operations with 1,000+ cows probably account for 75-80% of national milk production, up from roughly two-thirds currently.
Geographic distribution shifts further toward regions with lower cost structures and newer processing infrastructure.
These projections assume continuation of present trends. Meaningful policy changes, shifts in consumer preferences toward local sourcing, technological developments we haven’t anticipated—any of these could substantially alter trajectories.
Practical Considerations
If there’s a central theme running through this analysis, it’s that decisions made over the next 18-24 months carry substantial weight for dairy families.
Why this window matters: Farms that make strategic moves before the next milk price cycle will capture a 2-3-year positioning advantage over those who wait. Whether that’s locking in beef-on-dairy genetics, securing processor commitments for expansion, or timing an exit during favorable asset markets—the decisions made now compound forward.
The structural dynamics reshaping the industry continue regardless of individual timing preferences. Deferring decisions—waiting to see how conditions develop—is itself a choice, and often one that results in circumstances dictating outcomes rather than families directing their own course.
5 Decisions That Can’t Wait
- Decision 1: Know your actual cost per hundredweight versus the benchmarks within 60 days. If you’re producing at $25/cwt in a $21 market, no amount of management intensity closes that gap.
- Decision 2: Have the succession conversation—directly and honestly—before next calving season. Too many farm families wait until circumstances force the discussion.
- Decision 3: Run the beef-on-dairy numbers for the bottom 50% of your herd. At $350-700 per head in premiums, this revenue stream alone could shift your annual math by $50,000-$150,000.
- Decision 4: Identify your processor alternatives—or document that you have none. Understanding your actual market position is essential before any strategic move.
- Decision 5: Schedule proactive advisory conversations (lender, attorney, extension) in Q1 2026. These discussions are dramatically more productive before urgency forces them.
Resources for Further Exploration
Financial Planning:
- USDA Farm Service Agency provides complimentary farm financial planning assistance
- University extension farm management programs offer operation-specific analysis
- Farm Credit associations frequently provide transition planning support
Market Data:
- USDA-AMS Dairy Market News: ams.usda.gov/market-news/dairy (weekly component prices, market reports)
- CDCB genetic evaluations: uscdcb.com (genomic data, sire summaries)
Succession and Transition:
- Land-grant extension programs conduct succession planning workshops
- Agricultural attorneys can outline available legal structures
- SCORE includes agricultural business mentors nationally (score.org)
Premium Market Development:
- Organic Valley maintains active producer recruitment (organicvalley.coop)
- State agriculture departments typically maintain direct-market directories
- Regional farmers market associations provide market-entry guidance
Support Resources:
- Farm Aid Hotline: 1-800-FARM-AID
- State farm stress hotlines and rural mental health services
- State Farm Bureau organizations often offer confidential counseling programs
The Bottom Line
Mark, the Wisconsin producer whose kitchen-table calculations opened this conversation, hasn’t reached a final decision yet.
He’s investigating organic transition possibilities, working through expansion scenarios with his lender, and quietly gathering market information on operation valuations. He’s also started genomic testing his herd and running numbers on a beef-on-dairy program—his bottom 50% represents about 210 cows that could generate meaningful calf revenue while he focuses on genetic progress on his best animals.
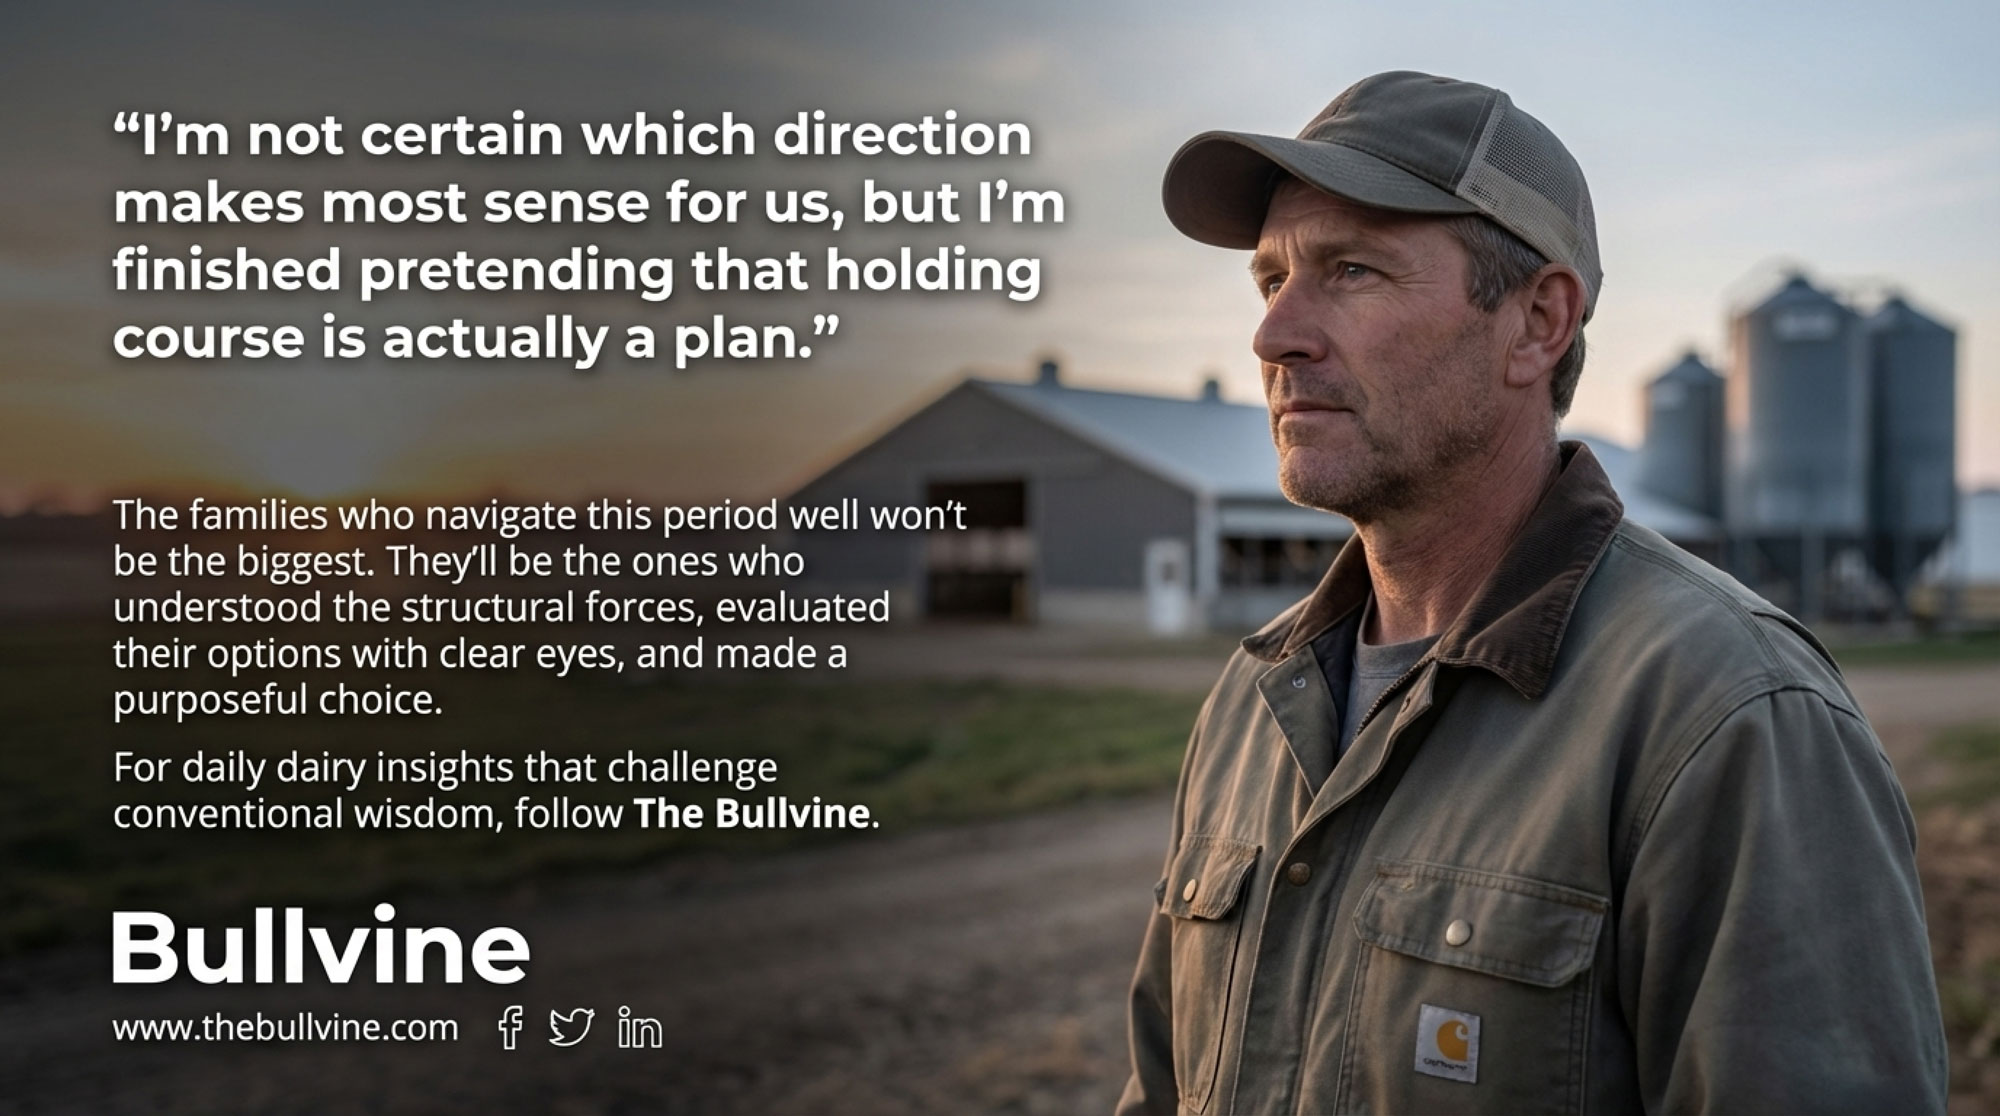
“I’m not certain which direction makes most sense for us,” he shared recently. “But I’m finished pretending that holding course is actually a plan.”
That perspective seems exactly right.
The transformation underway in dairy isn’t something happening to farm families from outside. It’s the accumulated result of countless individual decisions being made by producers, processors, retailers, consumers, and policymakers.
The families who navigate this period well won’t necessarily be those with the largest operations or deepest financial reserves. They’ll be the ones who took time to understand the structural forces at work, evaluated their options with clear eyes, and made purposeful choices aligned with their particular circumstances and family goals.
That kind of thoughtful, informed decision-making has always distinguished successful farm families across generations. The specific challenges evolve. The fundamental approach endures.
Key Takeaways:
- Four farms exit daily. Yours doesn’t have to. Consolidation is structural—but not inevitable for individual operations. Survival requires understanding the math and choosing a path before circumstances choose for you.
- The $100K gap won’t close with harder work. A 300-cow dairy at $25/cwt loses $75,000-$100,000 annually at current milk prices. Scale determines cost structure. Effort can’t fix structural economics.
- Regional economics are diverging fast. Wisconsin cropland at $6,800/acre competes against Kansas at $3,100. Billions in new processing flows to Texas and Idaho. Know where you stand—and what you’re competing against.
- Beef-on-dairy is a $100K+ revenue opportunity—now. Genomic sorting + beef crosses on your bottom 50% generates $100,000-$175,000 in additional annual calf revenue. Early adopters captured 2-3 years of advantage. Late adopters won’t see full returns until 2027.
- Every year of “wait and see” costs $75K-$150K. The action items: Know your actual cost/cwt within 60 days. Have the succession conversation before calving season. Run beef-on-dairy numbers on your herd. Schedule advisory meetings in Q1 2026.
Complete references and supporting documentation are available upon request by contacting the editorial team at editor@thebullvine.com.
Learn More
- The 90-Day Dairy Pivot: Converting Beef Windfalls into Next Year’s Survival – This tactical guide arms you with the specific breakevens and component strategies needed to convert current beef-on-dairy windfalls into a permanent survival cushion. Learn how stacking management changes today can capture an additional $266 per cow before the market window slams shut.
- Squeezed Out? A 12-Month Decision Guide for 300-1,000 Cow Dairies – Exposes the structural “squeeze” facing mid-sized operations and delivers a hard-nosed 12-month framework for choosing your path. Position your farm against looming heifer shortages and shifting protein premiums to ensure you’re among the survivors by mid-2026.
- The $700 Truth: Your Best Milkers Are Your Worst Investment (And 3,000 Dairies Just Proved It) – Breaks down the counterintuitive reality of feed efficiency where high-yield cows can actually drain profits. Gain a massive competitive advantage by using precision genomic data to identify the efficient third of your herd that drives $470 per cow in annual gains.
 Join the Revolution!
 Join the Revolution!
Join over 30,000 successful dairy professionals who rely on Bullvine Weekly for their competitive edge. Delivered directly to your inbox each week, our exclusive industry insights help you make smarter decisions while saving precious hours every week. Never miss critical updates on milk production trends, breakthrough technologies, and profit-boosting strategies that top producers are already implementing. Subscribe now to transform your dairy operation’s efficiency and profitability—your future success is just one click away.


