


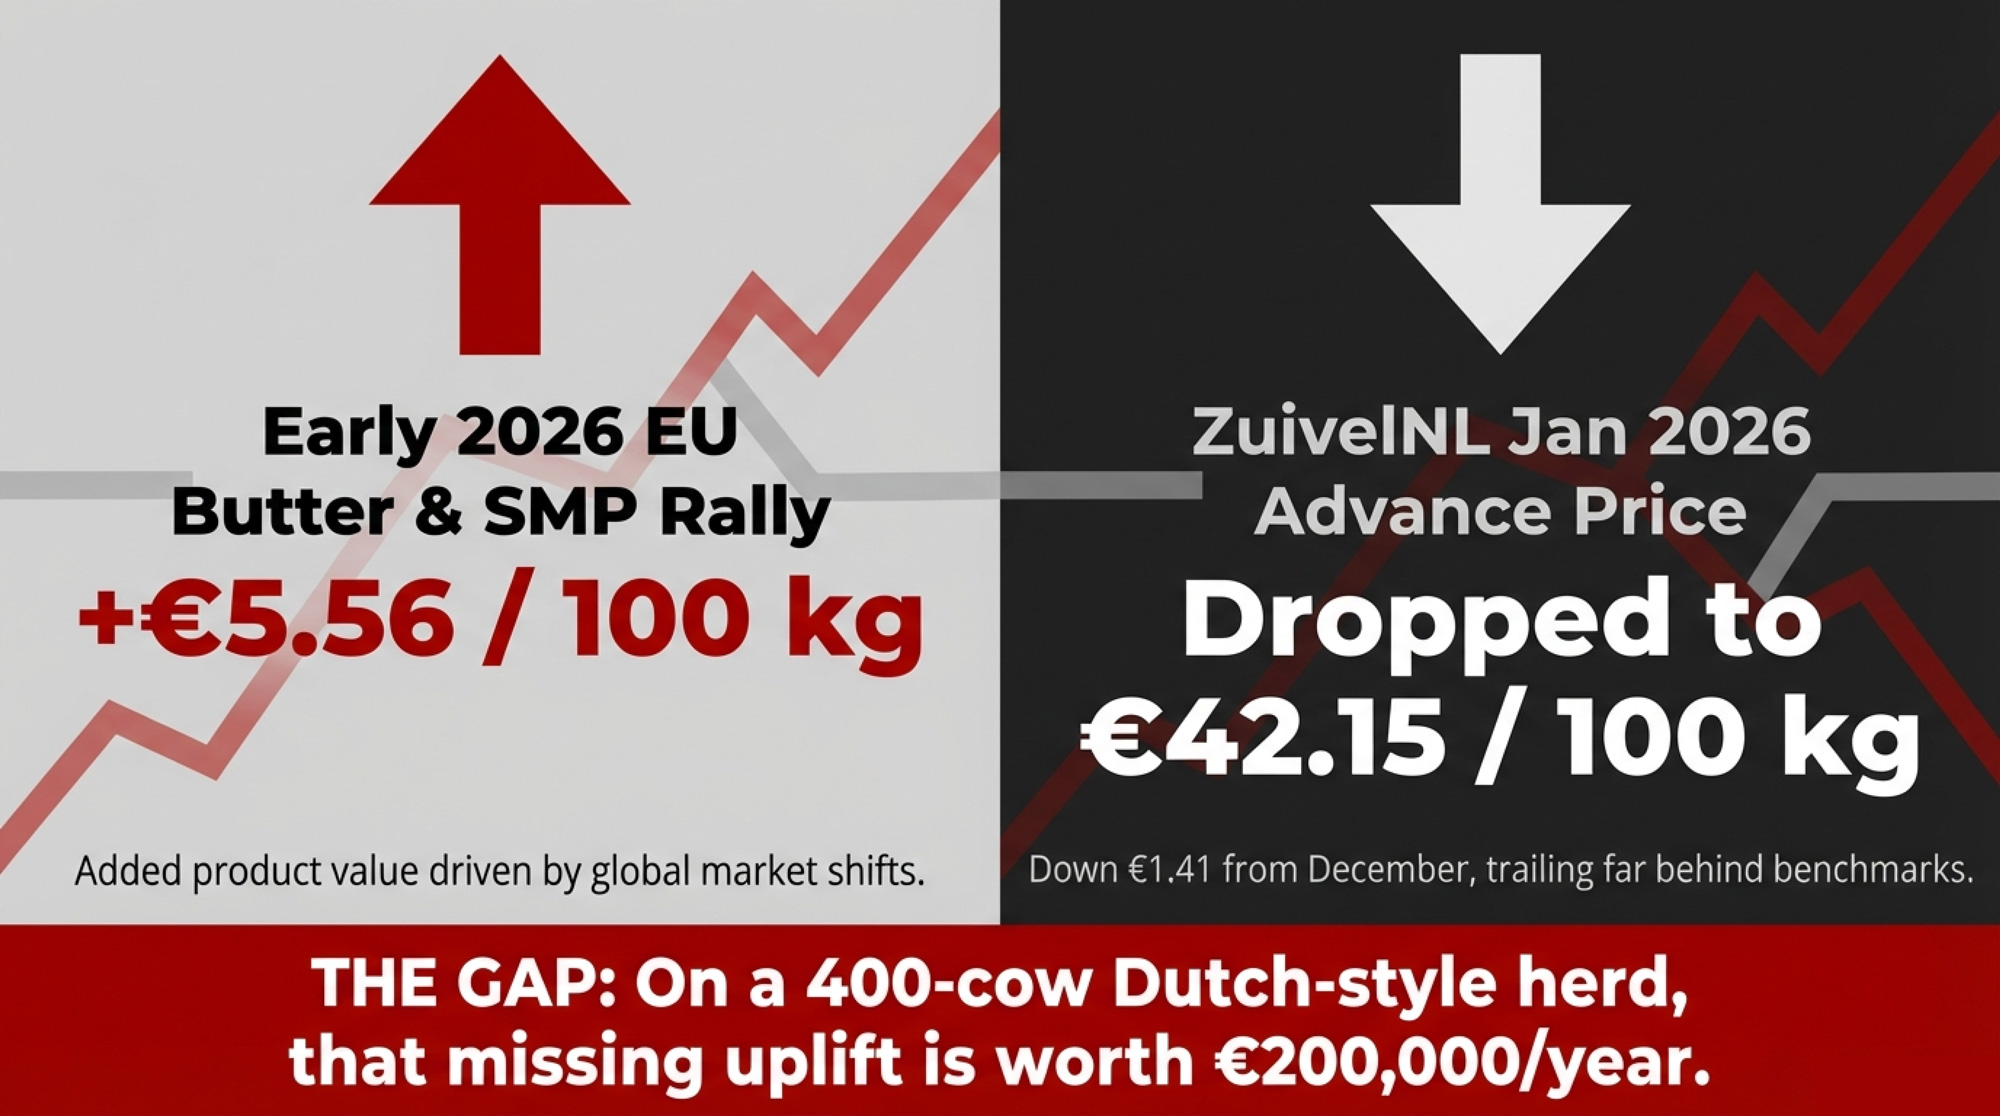
EU butter and SMP added €5.56/100 kg while the Dutch advance slid to €42.15. Until you chart that gap, you’re guessing what your contract is worth.
Executive Summary: In early 2026, EU butter and SMP prices added about €5.56/100 kg of product value while ZuivelNL’s average advance dropped to €42.15/100 kg — a gap worth around €200,000/year on a 400‑cow Dutch‑style herd. This article walks through the barn math that exposes the gap, using AHDB and EEX prices, standard butter/SMP yields, and ZuivelNL data, so you can plot the benchmark value against your own milk cheque. It then shows how FrieslandCampina’s 2023–2025 swing from loss to recovery, and the drop in early‑2026 advances, reveal the smoothing valve between markets and farm‑gate prices. From there, you get a four‑step playbook: chart the gap and put it in front of your buyer, run a “Scenario C” DSCR stress test on extra litres, audit notice and revision clauses in your contract, and decide whether you want any tools beyond the cheque as Euronext dairy futures roll out. The payoff is a set of 30‑ and 90‑day checks and longer‑term triggers so you can stop guessing what your contract is worth and start making expansion, debt, and contract decisions with your own two‑line chart in front of you.
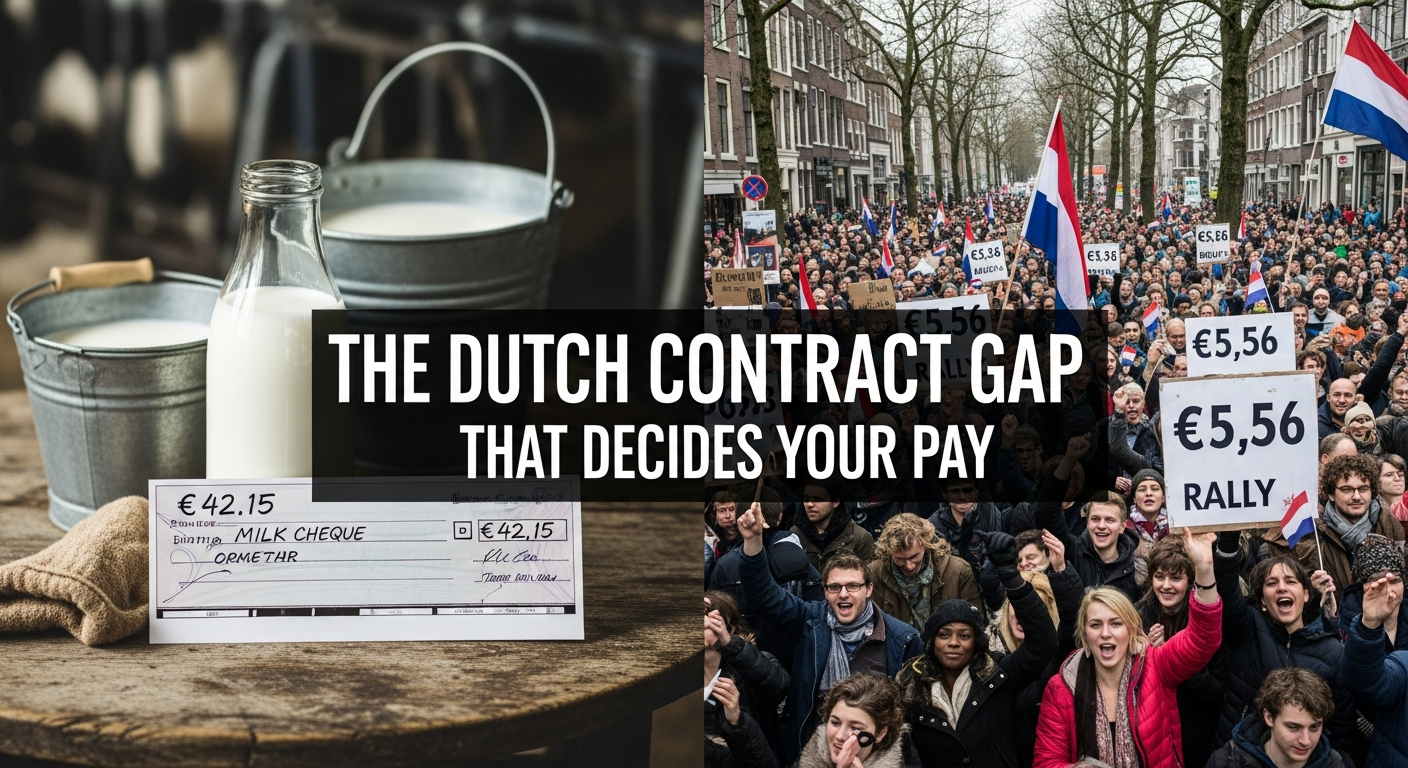
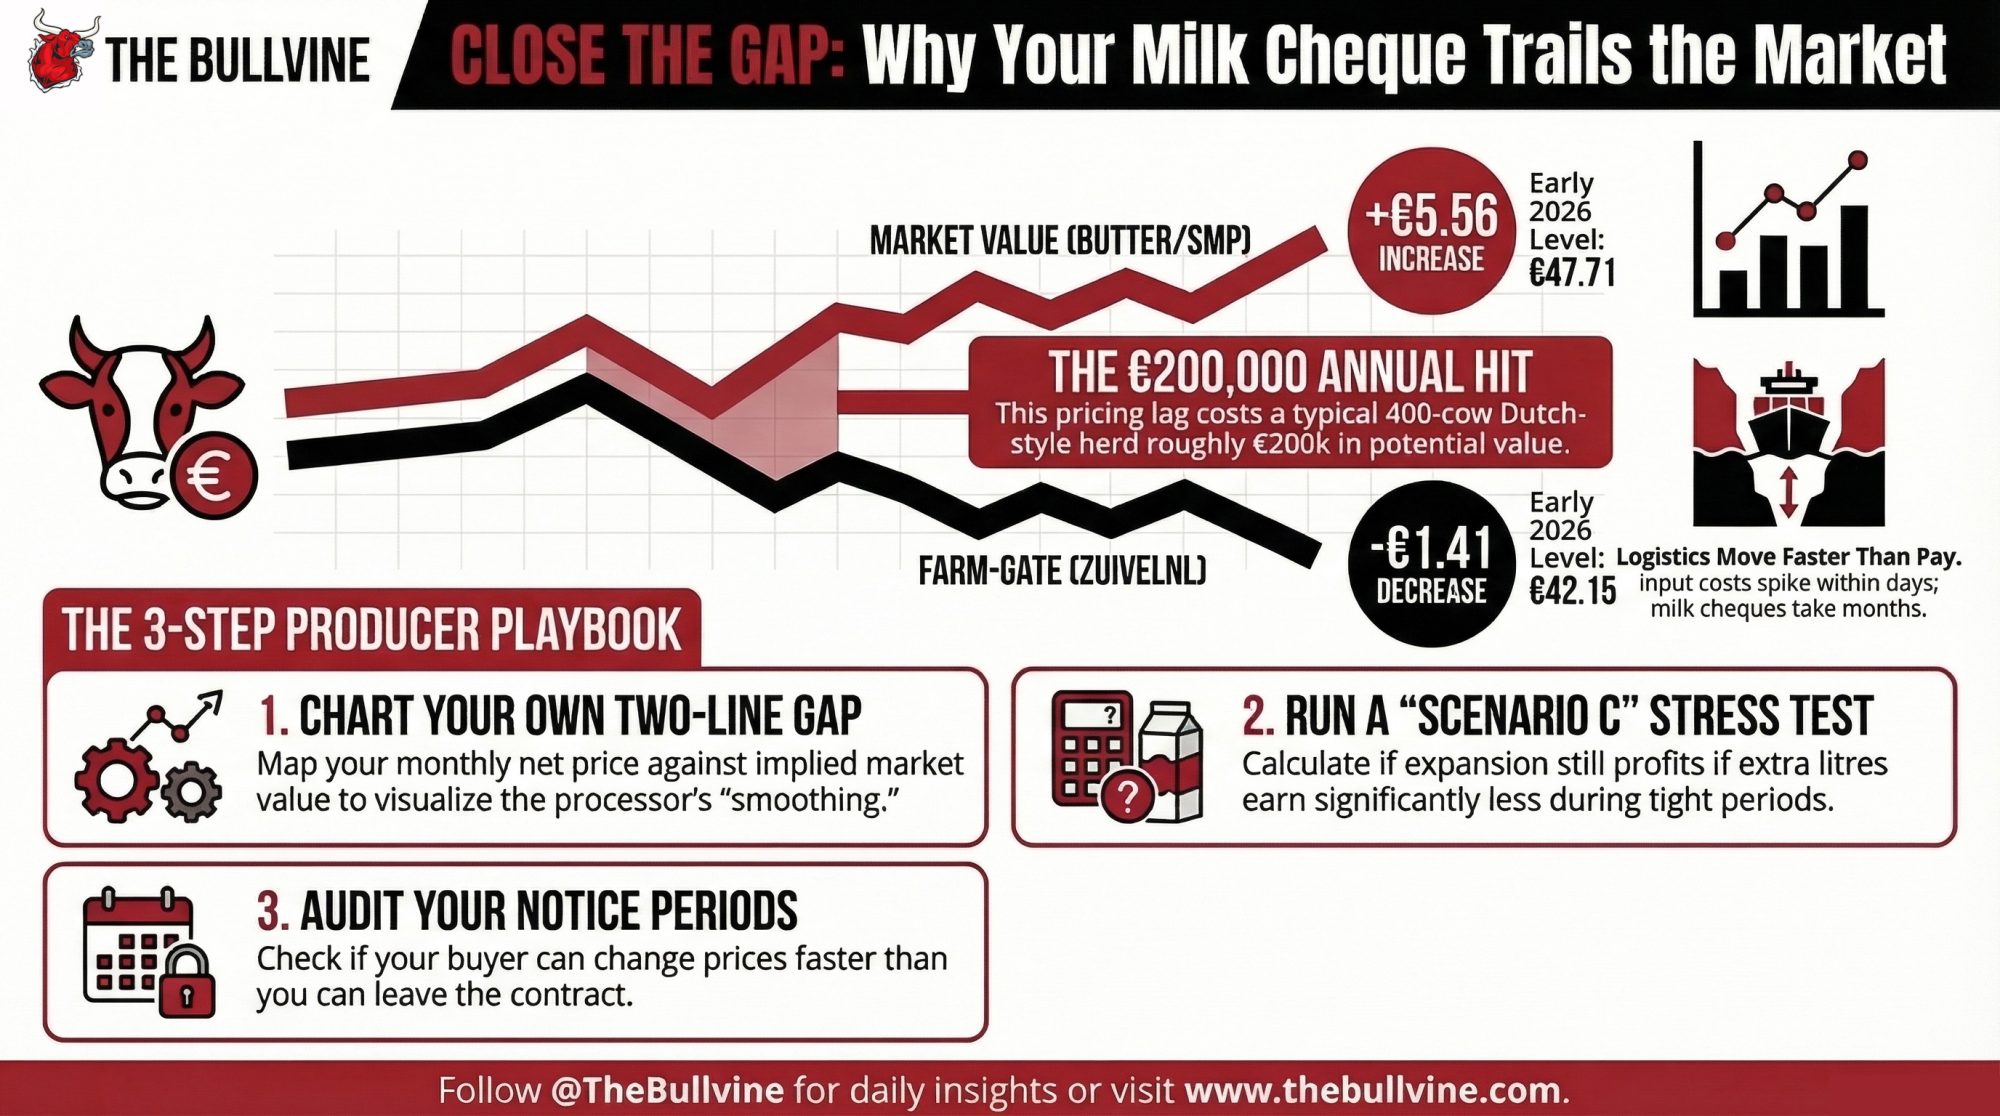
ZuivelNL’s January 2026 advance milk price averaged €42.15 per 100 kg of standard milk, down €1.41 from December and well below January 2025’s level. Over the same window, EU butter and skim milk powder benchmarks rallied enough to add about €5.56 per 100 kg of milk to the value of a standard butter/SMP stream. If you’re running a 400‑cow Dutch‑style herd shipping around 3.6 million litres a year, that uplift is worth roughly €200,000/year on paper — if it actually landed in your cheque.
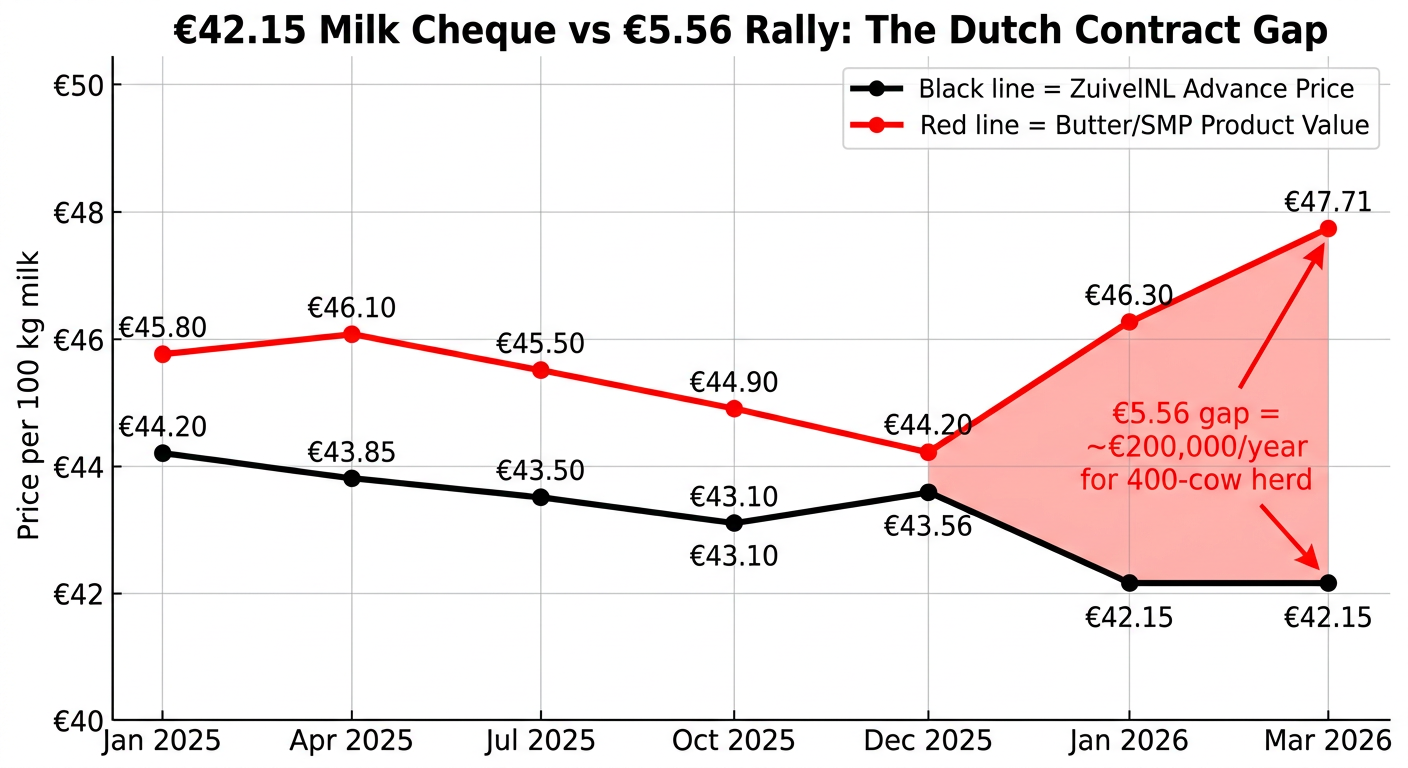
| Month | ZuivelNL Advance Price (€/100kg) | Calculated Butter/SMP Product Value (€/100kg) |
|---|---|---|
| Jan 2025 | 44.20 | 45.80 |
| Apr 2025 | 43.85 | 46.10 |
| Jul 2025 | 43.50 | 45.50 |
| Oct 2025 | 43.10 | 44.90 |
| Dec 2025 | 43.56 | 44.20 |
| Jan 2026 | 42.15 | 46.30 |
| Mar 11, 2026 | 42.15 | 47.71 |
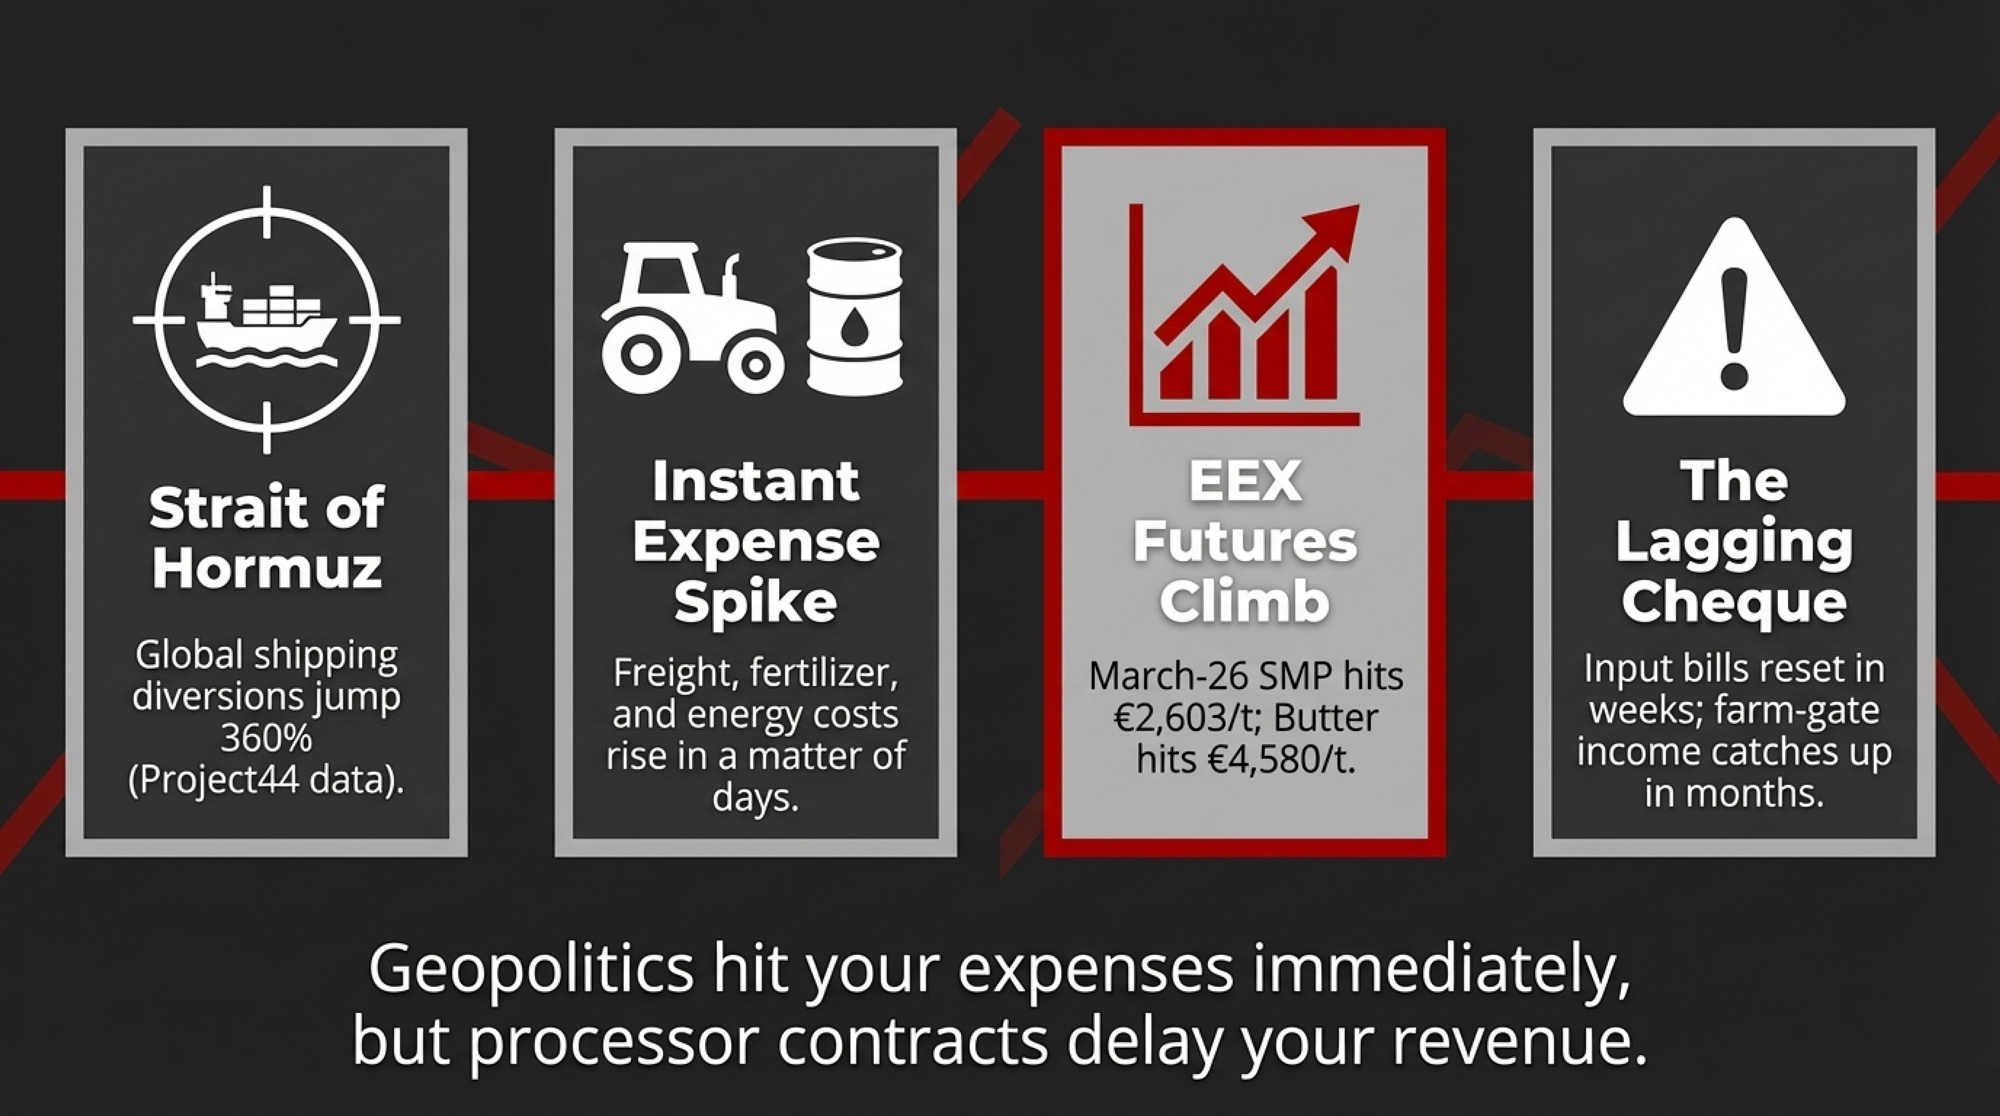
It didn’t. And that’s not a rounding error. It’s how your processor, your contract, and tight EU capacity decide who captures geopolitical premiums — and who pays the higher freight, fertiliser, and energy bills when a choke point like the Strait of Hormuz gets messy.
The Hormuz Shock vs Your Cheque
By January 2026, EU wholesale prices had quietly clawed back from the 2025 floor. AHDB put EU butter at about €4,252/tonne and skim milk powder at €2,097/tonne that month. Nobody was celebrating, but at least the slide had stopped.
Then the Strait of Hormuz blew up the script.
Late in February, US and Israeli forces hit targets in Iran, and Iran’s Revolutionary Guard threatened to block ships from entering or leaving the strait. Within days, tanker traffic through Hormuz had fallen to almost zero, and major carriers were rerouting ships around Africa. Analytics firm project44 tracked global shipping diversions jumping by more than 360% — from 218 per day on February 20 to 1,010 per day by March 1.
That corridor is a main artery for oil and key fertiliser inputs, such as sulfur. For you, that usually shows up as:
- Higher freight on imported feed and inputs.
- Higher fertiliser costs heading into planting.
- Higher energy bills — right when you least need them.
Dairy markets reacted fast. At the March 3 Global Dairy Trade auction, SMP climbed 9.1%, mozzarella 7.9%, and butter 6.1%. By March 11, Daily Dairy Report data showed EEX March‑26 SMP at €2,603/tonne and butter at €4,580/tonne, both well above January levels.
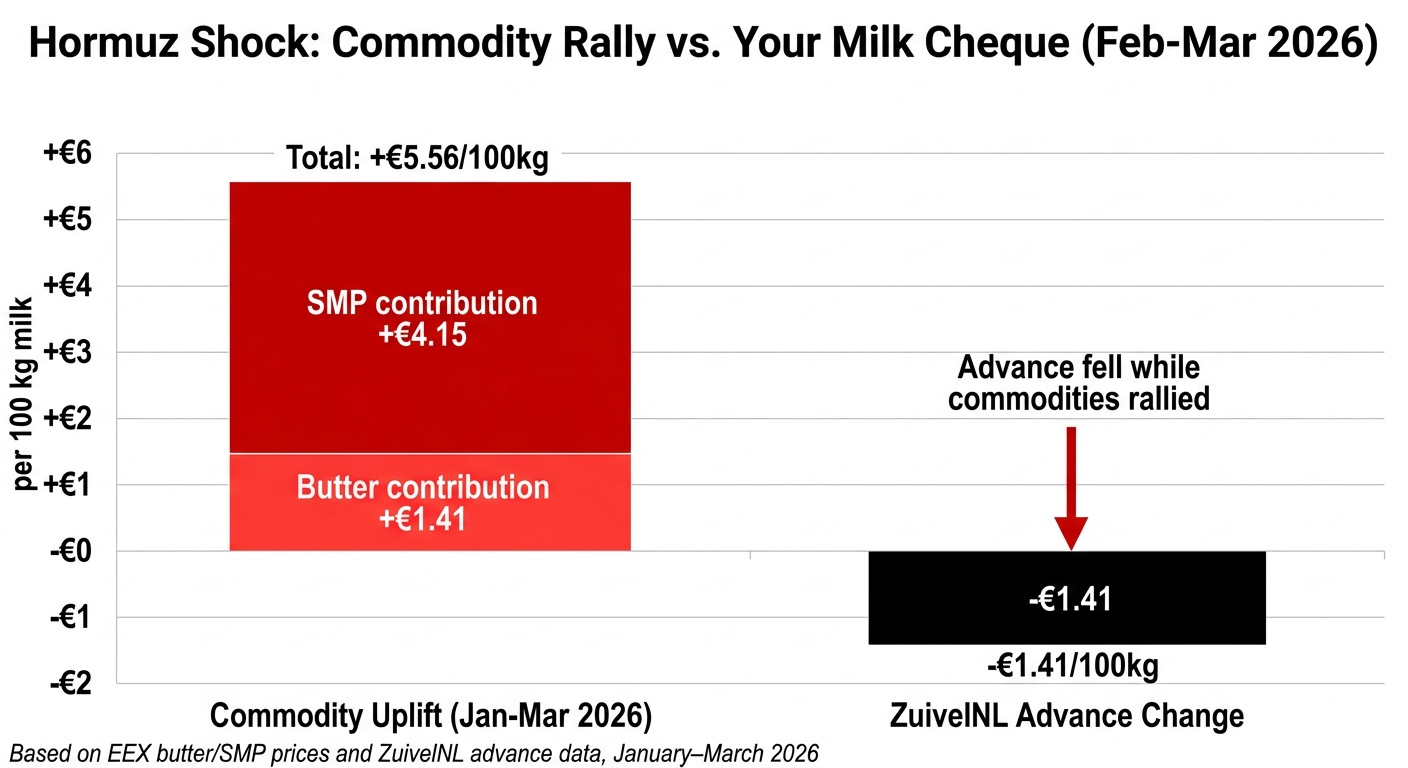
| Category | Butter Contribution (€/100kg milk) | SMP Contribution (€/100kg milk) | Total Commodity Uplift | ZuivelNL Advance Change |
|---|---|---|---|---|
| Jan–Mar 11, 2026 | +1.41 | +4.15 | +5.56 | -1.41 |
Your fuel and fertiliser suppliers probably moved prices within days. Your milk cheque? That’s a different story.
The Barn Math Behind the €5.56/100 kg Uplift
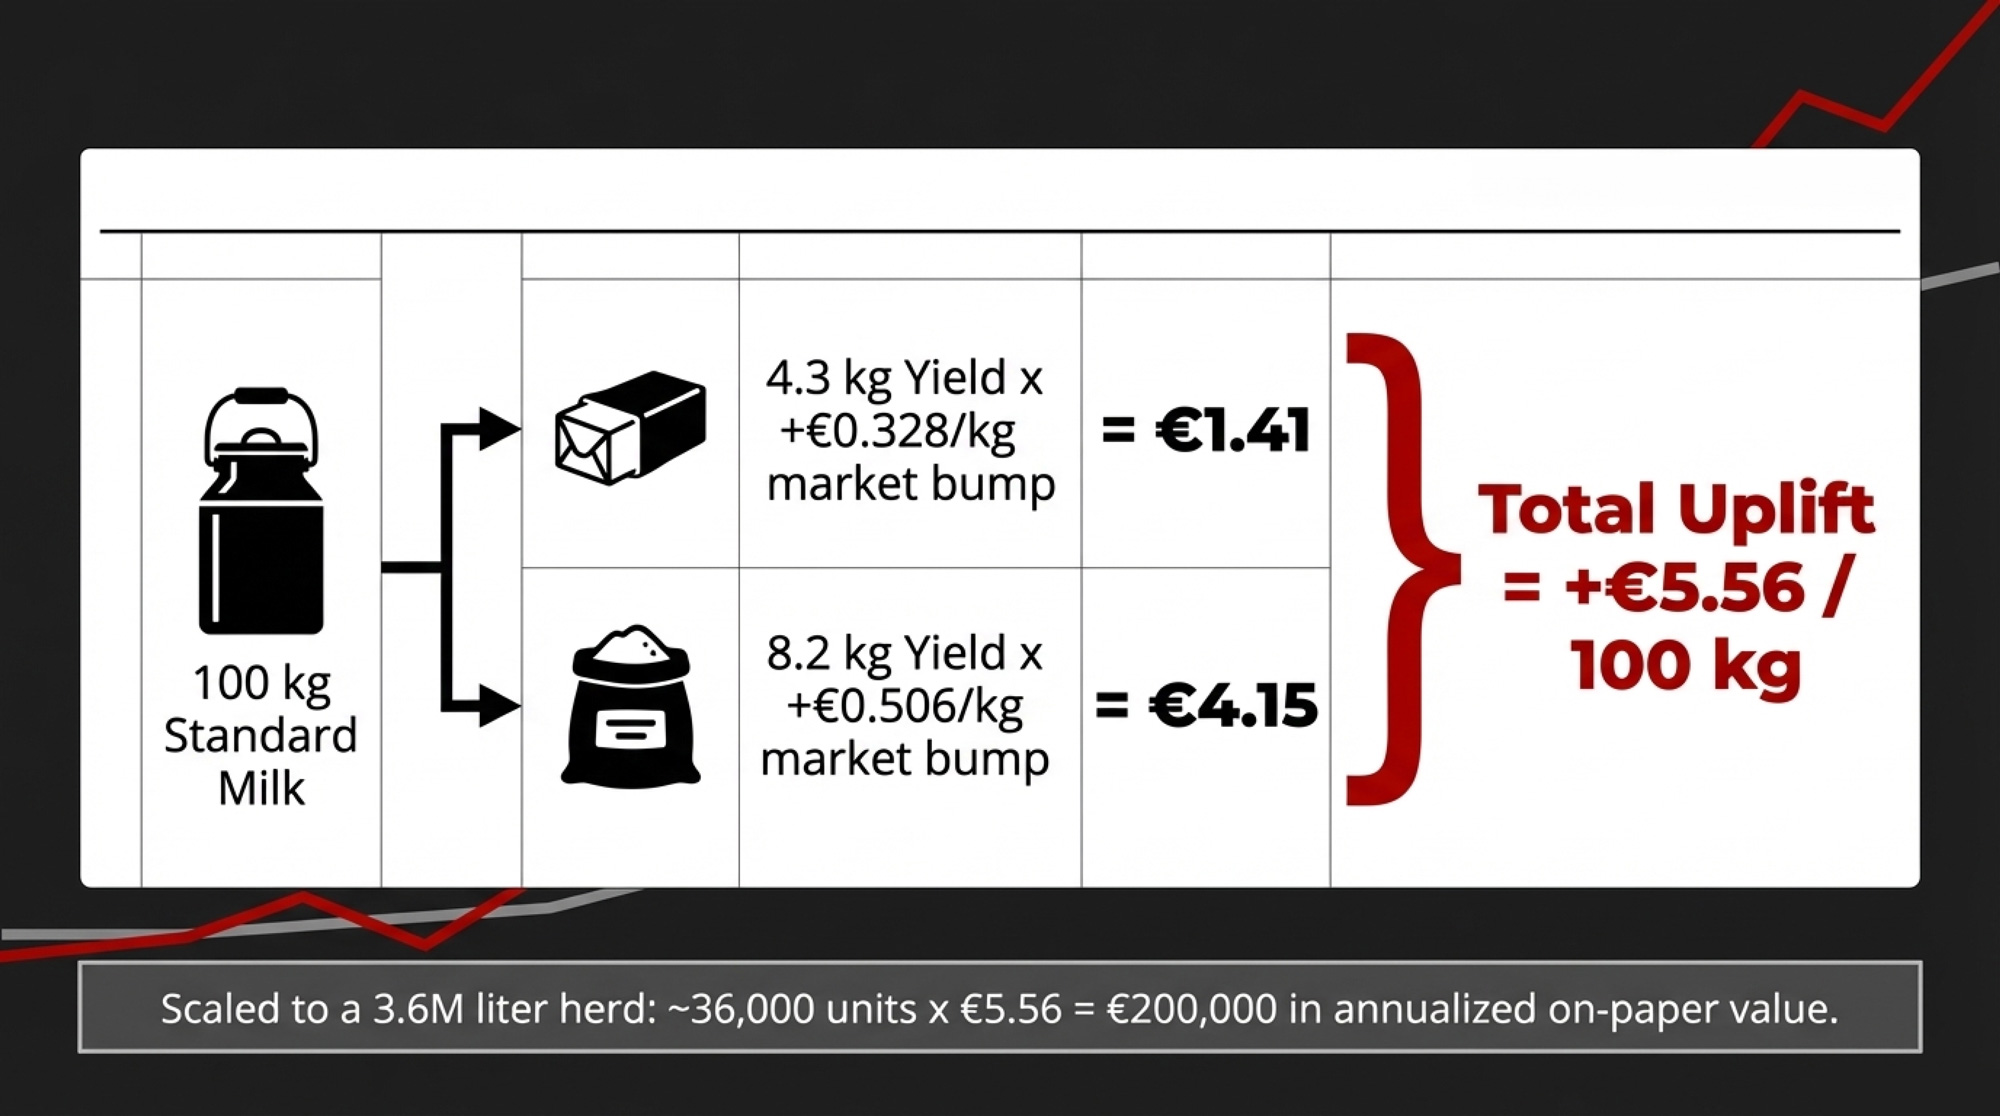
Most EU product‑value models use the same basic yields: 100 kg of standardised milk routed into a butter + SMP stream yields about 4.3 kg of butter and 8.2 kg of skim milk powder.
Take January to March 11, 2026.
Butter:
- January EU wholesale: €4,252/tonne.
- March 11 EEX March‑26: €4,580/tonne.
- Change: +€328/tonne, or €0.328/kg.
SMP:
- January EU wholesale: €2,097/tonne.
- March 11 EEX March‑26: €2,603/tonne.
- Change: +€506/tonne, or €0.506/kg.
Run that through the yields:
- Butter: 4.3 kg × €0.328 ≈ €1.41 per 100 kg milk.
- SMP: 8.2 kg × €0.506 ≈ €4.15 per 100 kg milk.
Total: ~€5.56 per 100 kg milk of extra product value between January and March 11.
Now scale it to a realistic Dutch‑style herd:
- 400 cows × 9,000 litres/cow/year = 3.6 million litres/year.
- Treat 100 kg as roughly 100 litres for this exercise → about 36,000 “hundred‑kg” units.
36,000 × €5.56 ≈ €200,000 in extra annualised product value if 100% of that uplift flowed into your milk price.
But it’s not flowing through.
ZuivelNL’s international comparison shows the average European standard milk price trending downward through late 2025, with December around €43.56/100 kg. Their January 2026 advance was €42.15/100 kg, down €1.41 from December and well below the January 2025 level. That’s the opposite direction of the butter and SMP benchmarks.
So you’ve got a clear split:
- Product value on a butter/SMP basis is up about €5.56/100 kg in a few weeks.
- The average farm‑gate advance is moving down into the low‑€40s.
The size of the gap on your own farm will depend on your processor, your contract, and your product mix — but we’re not talking pennies.
The Processor Valve: Three Years of FrieslandCampina
To see how smoothing works in the real world, look at FrieslandCampina’s last three years.
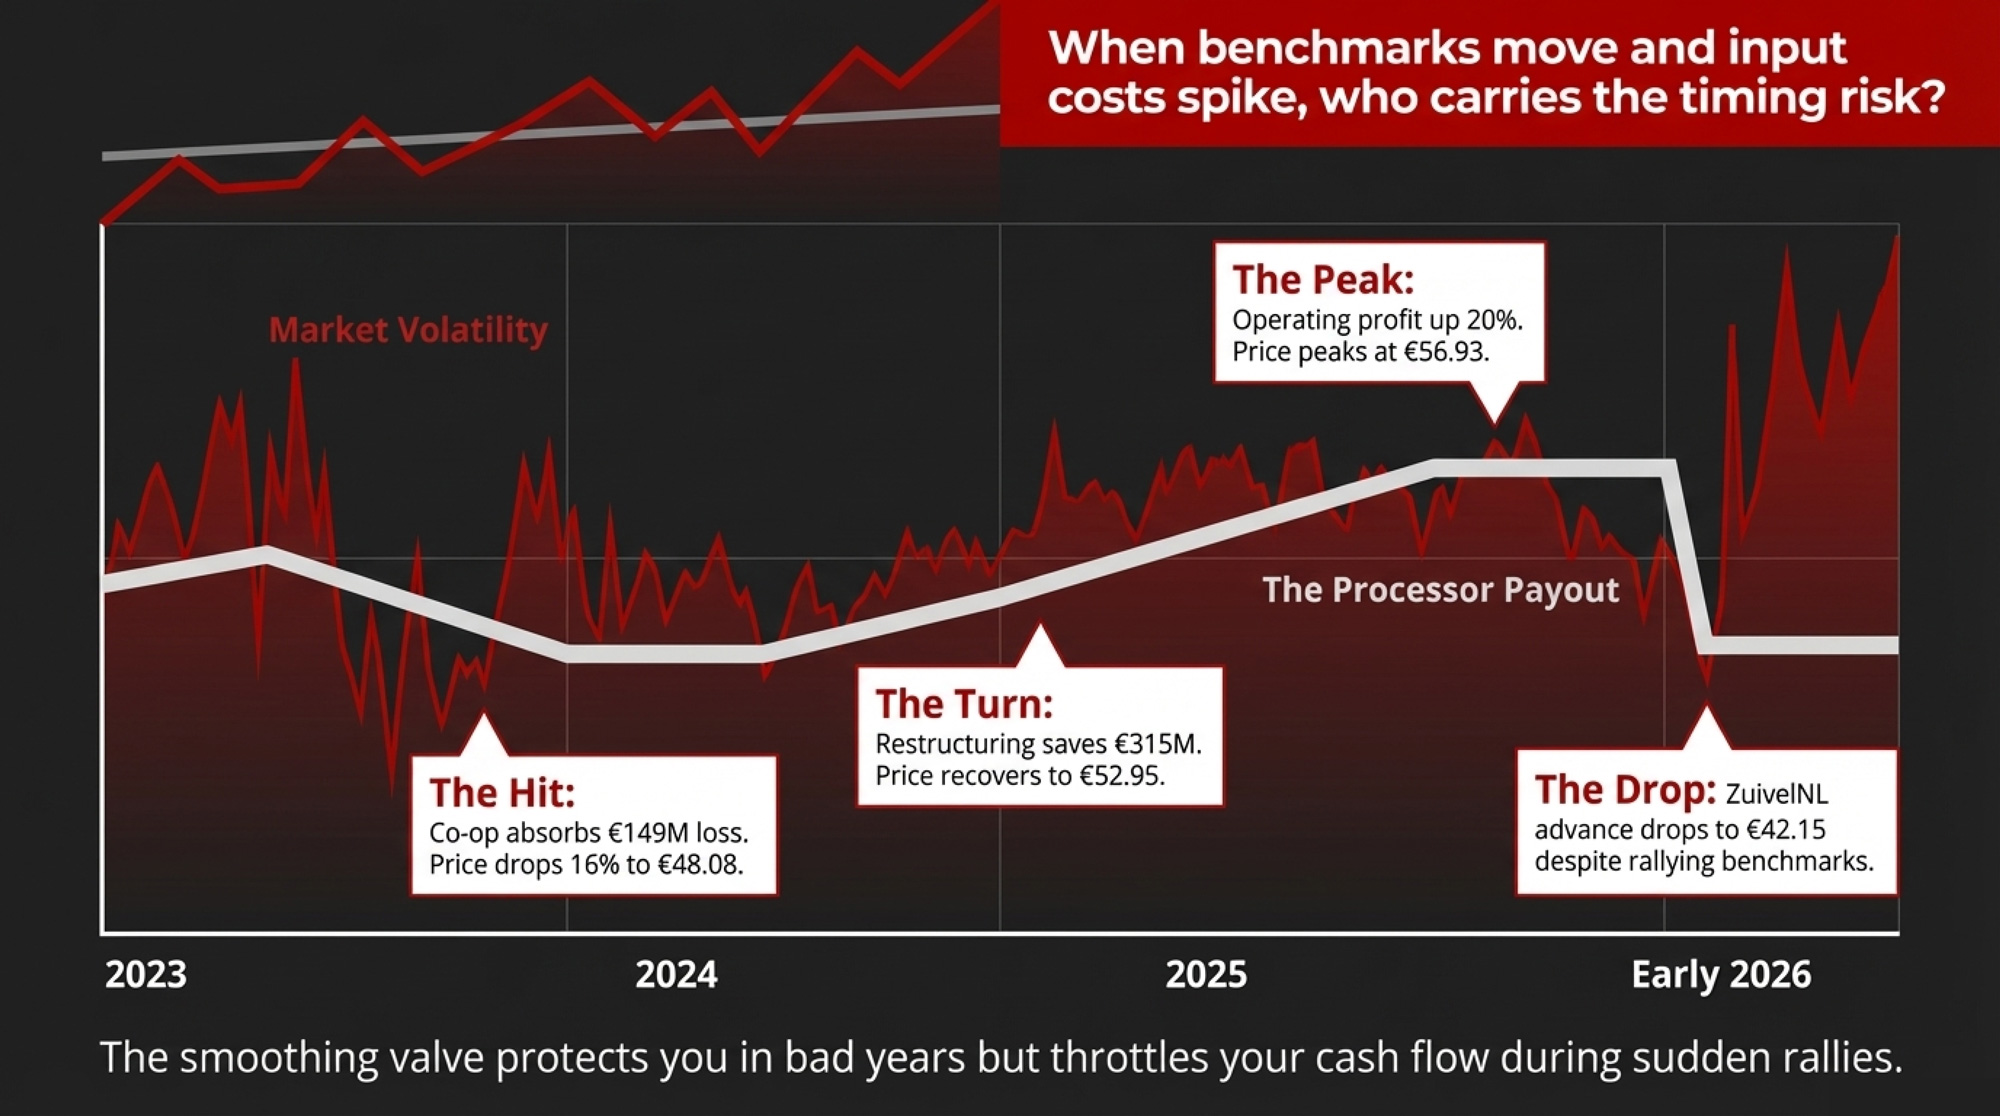
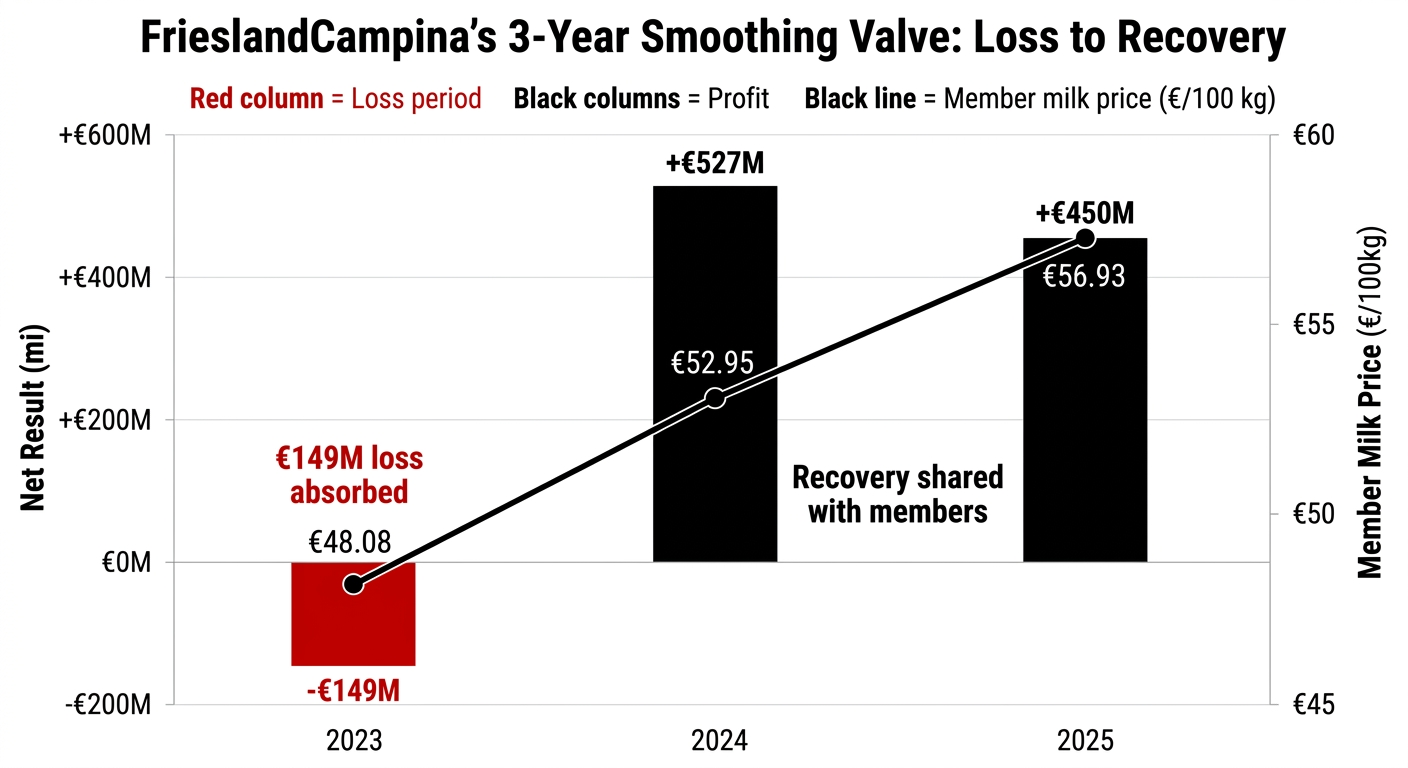
In 2023, FrieslandCampina reported a net result of –€149 million, hit by weak commodity markets and €136 million in restructuring costs under its “Expedition 2030” plan. The average member milk price dropped to €48.08/100 kg, more than 16% below 2022, and there was no supplementary cash payment.
In 2024, the co‑op’s fortunes flipped. Operating profit climbed to about €527 million, with management crediting €315 million in cost savings from the restructuring. The average member milk price climbed to €52.95/100 kg, and FrieslandCampina reinstated a €1.21/100 kg supplementary cash payment.
In 2025, the recovery continued. FrieslandCampina’s full‑year member milk price reached €56.93/100 kg, with a €1.31/100 kg supplementary cash payment. The co‑op reported revenue of about US$15.85 billion and highlighted improved milk prices as a key driver. Its Half‑year Report 2025 showed operating profit up about 20% year‑on‑year and a strong pro forma milk price, driven mainly by the higher guaranteed price.
Across 2023–2025, the smoothing valve clearly worked both ways: co‑op members saw downside absorbed in 2023 and upside shared in 2024–25.
| Year | Net Result (€M) | Member Milk Price (€/100 kg) | Supplementary Cash (€/100 kg) |
|---|---|---|---|
| 2023 | -149 | 48.08 | 0.00 |
| 2024 | +527 (approx.) | 52.95 | 1.21 |
| 2025 | +450 (implied) | 56.93 | 1.31 |
Now zoom back in on early 2026. ZuivelNL’s January 2026 advance price of €42.15/100 kg is well below the 2025 FrieslandCampina average. Your co‑op has just come off a strong year. Benchmarks for butter and SMP are bouncing. And your advance has dropped.
The tension here isn’t “Is my co‑op good or bad?” It’s: when benchmarks move and your input costs spike, how does your contract decide who carries the timing risk?
Not a Milk Shortage Story — It’s Capacity and Allocation
If you only watched futures, you’d assume Europe is short of milk. The physical data and pricing pressure say otherwise.
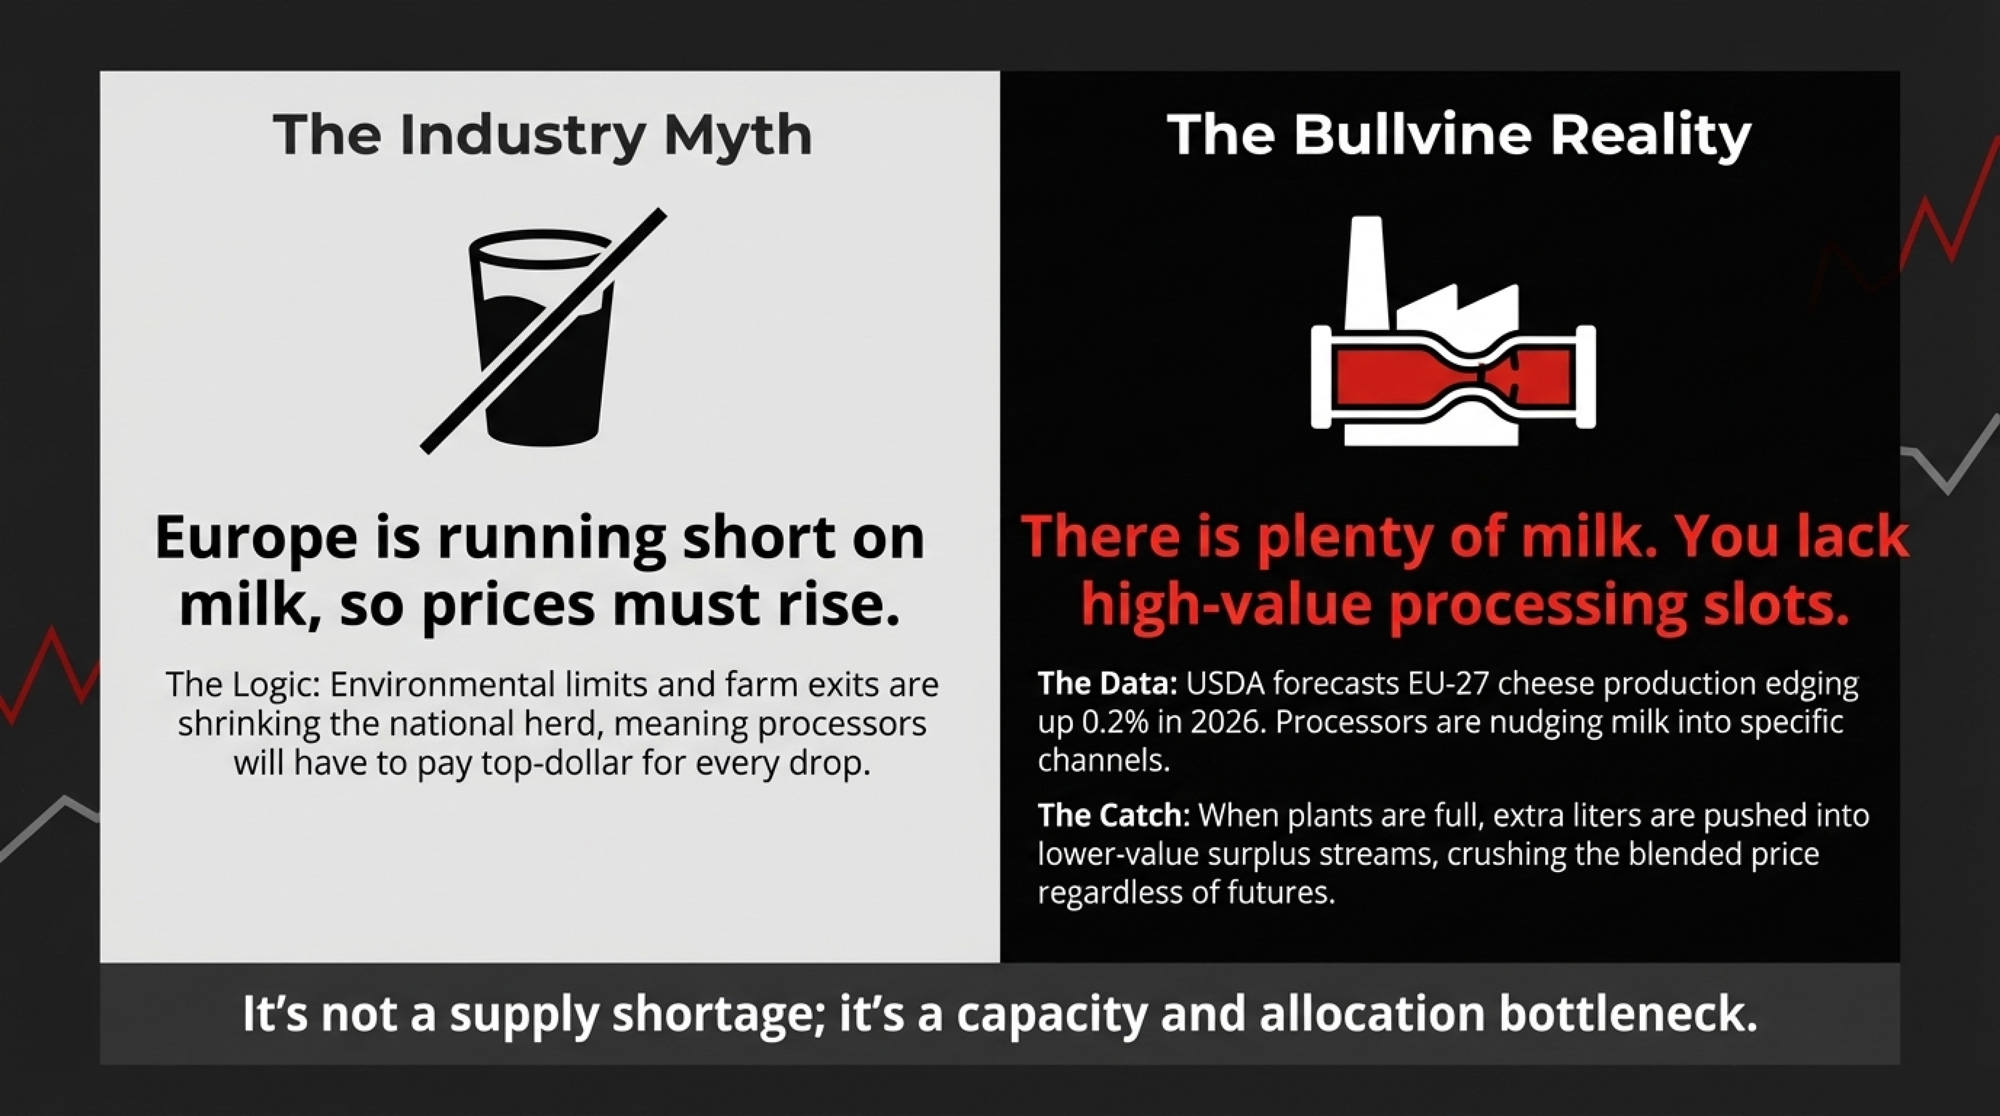
USDA’s 2026 EU Dairy and Products Annual expects EU‑27 cheese production to edge up by about 0.2% between 2025 and 2026 “at the expense of butter, nonfat dry milk, and whole milk powder.” Processors are nudging more milk into cheese and fresh products, and a bit less into commodity powders and butter.
ZuivelNL’s commentary on the January 2026 advance price is blunt: “The persistently strong growth in milk production remains a key contributing factor.” In other words, there’s plenty of milk. It’s the processor capacity and allocation, not a supply shortage, that drives the pricing pressure you feel.
At the same time, a February 2026 question in the European Parliament flagged regions where farm‑gate prices were 10–15 cents per litre below production costs, pushing producers toward exit. Rabobank’s early‑2026 outlook expects EU milk collections to be roughly 0.9% lower in 2026 as environmental limits and investment fatigue start to bite. That’s a small decline overall, but it’s not going to magically tighten your local market if your catchment is still heavy on milk and short on high‑value processing slots.
So no, Europe isn’t running out of milk. But it’s also not short enough, in the right places, to force processors to chase every litre with top‑end prices. They’re choosing where your litres go — and your contract decides how you get paid for them.
The Contract Lens: Who Can Move Faster — You or Your Buyer?
Most Dutch and Northwest European producers sit on some mix of:
- Base (A‑volume) litres priced on a long‑term formula tied to branded, retail, and industrial business.
- Flex (B‑volume) litres that bear more direct exposure to commodity swings and surplus outlets.
On paper, that mix gives you stability plus some market connection. In practice, three levers in your contract determine how much of a rally you actually feel.
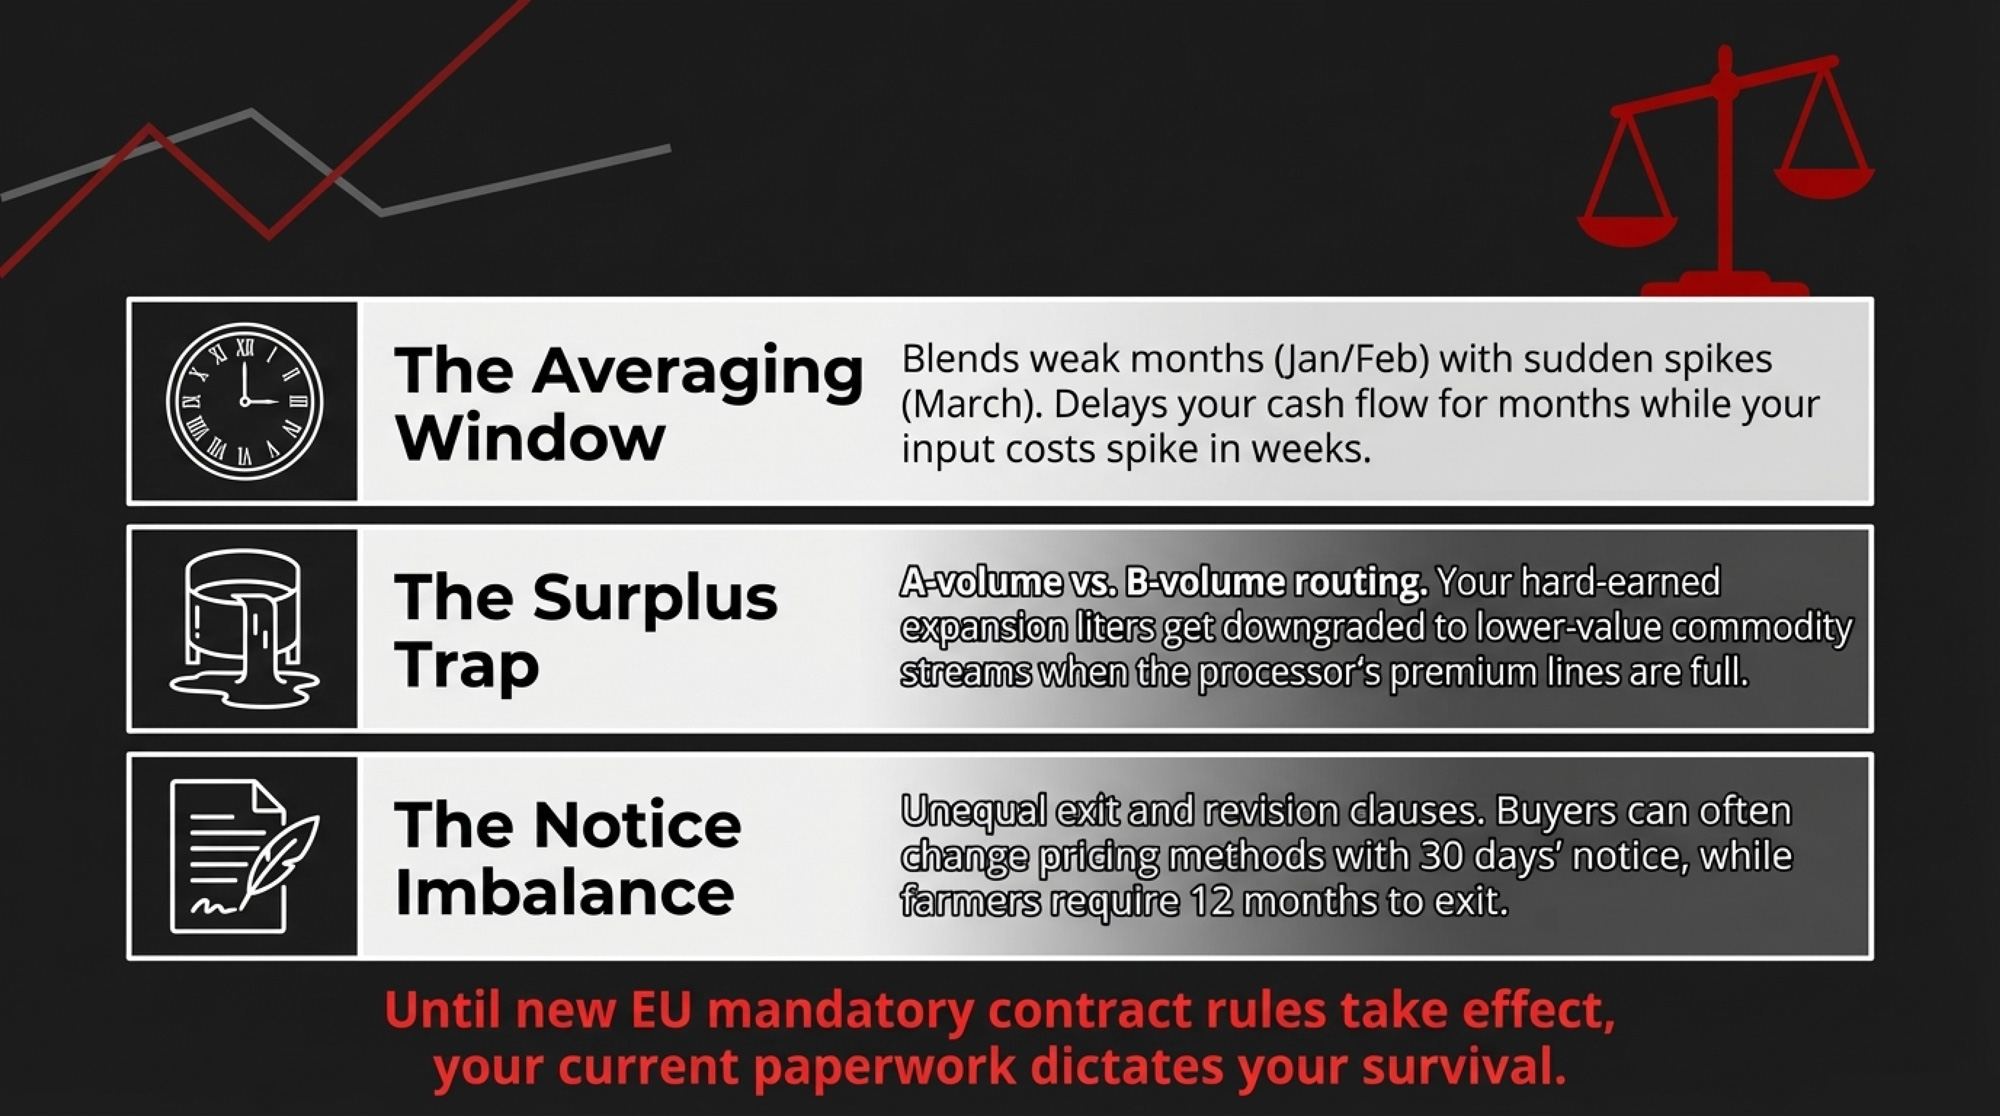
1. The averaging window
If your price is based on a quarterly (or longer) average of reference prices, January and February’s weaker months get blended with March’s spike. That’s fine for smoothing an ugly year. It’s rough when your fertiliser, freight, and power costs reset in a matter of weeks, and your income catches up months later.
2. Where extra litres go when plants are full
When dryers or cheese plants are running flat out, extra litres don’t automatically land in butter, SMP, or premium cheese — no matter what futures say. ZuivelNL’s slide into the low‑€40s across late 2025 and early 2026 suggests a lot of milk was being pushed into lower‑value streams even as commodity benchmarks improved. If your expansion litres are first in line for those outlets, the extra cows you add during “good” times are actually tied to the risk of lower‑priced surplus in a stress year.
3. Who has the right to change what, and how fast
A Scottish Government‑commissioned study of UK dairy contracts turned up some eye‑opening asymmetries: in certain agreements, the buyer could change pricing methods with 30 days’ notice while the farmer needed 12 months’ noticeto leave the contract. That’s the kind of imbalance EU politicians have been trying to address.
On March 4, 2026, EU institutions announced a provisional deal “reinforcing farmers’ position in the food supply chain.” The package includes:
- Mandatory written contracts in certain sectors.
- National price indicators that can be used as benchmarks.
- Options for revision clauses that allow contracts to be revisited when conditions change.
Rapporteur Céline Imart called it “a major victory for our farmers,” arguing that better contract rules and clear indicators will give producers a fairer place in the value chain. Even so, implementation across member states is expected to take 12–18 months. Until those rules hit your actual paperwork, the notice periods, volume tolerances, and revision rights you already signed are what really matter.
The Turn: Stop Only Reading the Cheque — Start Reading the Gap
Most producers can quote their average milk price off the top of their heads. Fewer can tell you how their price responds when benchmarks move sharply.
The real turn in this story is when you stop treating that disconnect as “just how it is” and start putting numbers to it.
The simplest way to start:
- Pull your last 6–9 months of cheques — net price per 100 kg, month by month.
- Pull the same months of butter and SMP prices from AHDB, your co‑op’s market reports, or EEX settlements.
- Convert those into implied butter/SMP product value per 100 kg using the 4.3/8.2 yields.
- Put both lines on the same chart: product value vs. your farm‑gate price.
If you see the top line jump by around €5.56/100 kg while your line drifts downward toward the low‑€40s — which is what ZuivelNL’s averages suggest for early 2026 — you’ve just drawn your contract’s timing and smoothing function. It’s no longer an abstract complaint. It’s a picture you can take to your buyer and your bank.
From there, the decisions get more interesting.
Four Moves to Understand and Narrow Your Contract Gap
1. Chart the Gap and Put It in Front of Your Buyer (Next 30 Days)
Build that two‑line chart for your own farm: monthly farm‑gate price per 100 kg vs. implied butter/SMP value per 100 kg over the last 6–9 months.
| Action Step | What to Do | Deadline | Why It Matters |
|---|---|---|---|
| 1. Chart the Gap | Build 2-line chart: your farm-gate price vs. butter/SMP product value. Send to buyer. | Next 30 days | Turns complaint into data. Forces buyer to explain who carries timing risk. |
| 2. Stress-Test Expansion | Run Scenario C (extra litres at stress pricing) through DSCR calculation. | Next 90 days | If DSCR falls below 1.2, your expansion is a contract bet, not a cow bet. |
| 3. Audit Contract Terms | Write down your notice periods, volume flex, and revision triggers. Compare to buyer’s. | Next 90 days | Asymmetry (12× worst case, 2–3× typical) decides whether you can pivot when markets turn. |
| 4. Decide on Hedging Tools | Define trigger (e.g., if gap > €4 for 4 weeks, talk to advisor about hedging 10–20% volume). | Next 365 days | Your buyer and lender have tools to manage risk. You need to decide if you want any. |
Then send it to your processor or co‑op contact with a short, professional note that:
- Acknowledges 2023’s pain on both sides (co‑op loss, price cuts).
- Acknowledges 2024–25’s recovery and the higher 2025 milk price.
- Points to the early‑2026 pattern: benchmarks higher, advances lower.
The question isn’t “pay me more.” It’s: “When product value moves this fast while input costs spike, what can we do in our contract structure so farms see enough of that move in time to keep paying bills?”
You probably won’t walk away with a new clause tomorrow. But you’ll stop being just another supplier and start being the member who clearly understands how the value flows.
2. Run a Stress Scenario on Your Expansion Plan (Next 90 Days)
If you’re adding cows, robots, or a barn, you’re not just betting on “milk price goes up.” You’re betting on how your incremental litres are priced when plants are full, and exports are messy.
Build three scenarios for the extra litres only:
- Scenario A – Smooth: Extra litres always get your current blended price.
- Scenario B – Bumpy: Extra litres average a discount to your blended price in “normal” years.
- Scenario C – Stress: In tight periods, extra litres earn significantly less than your current average, reflecting how surplus‑type volumes can be priced when advance prices are falling, as in late 2025–early 2026.
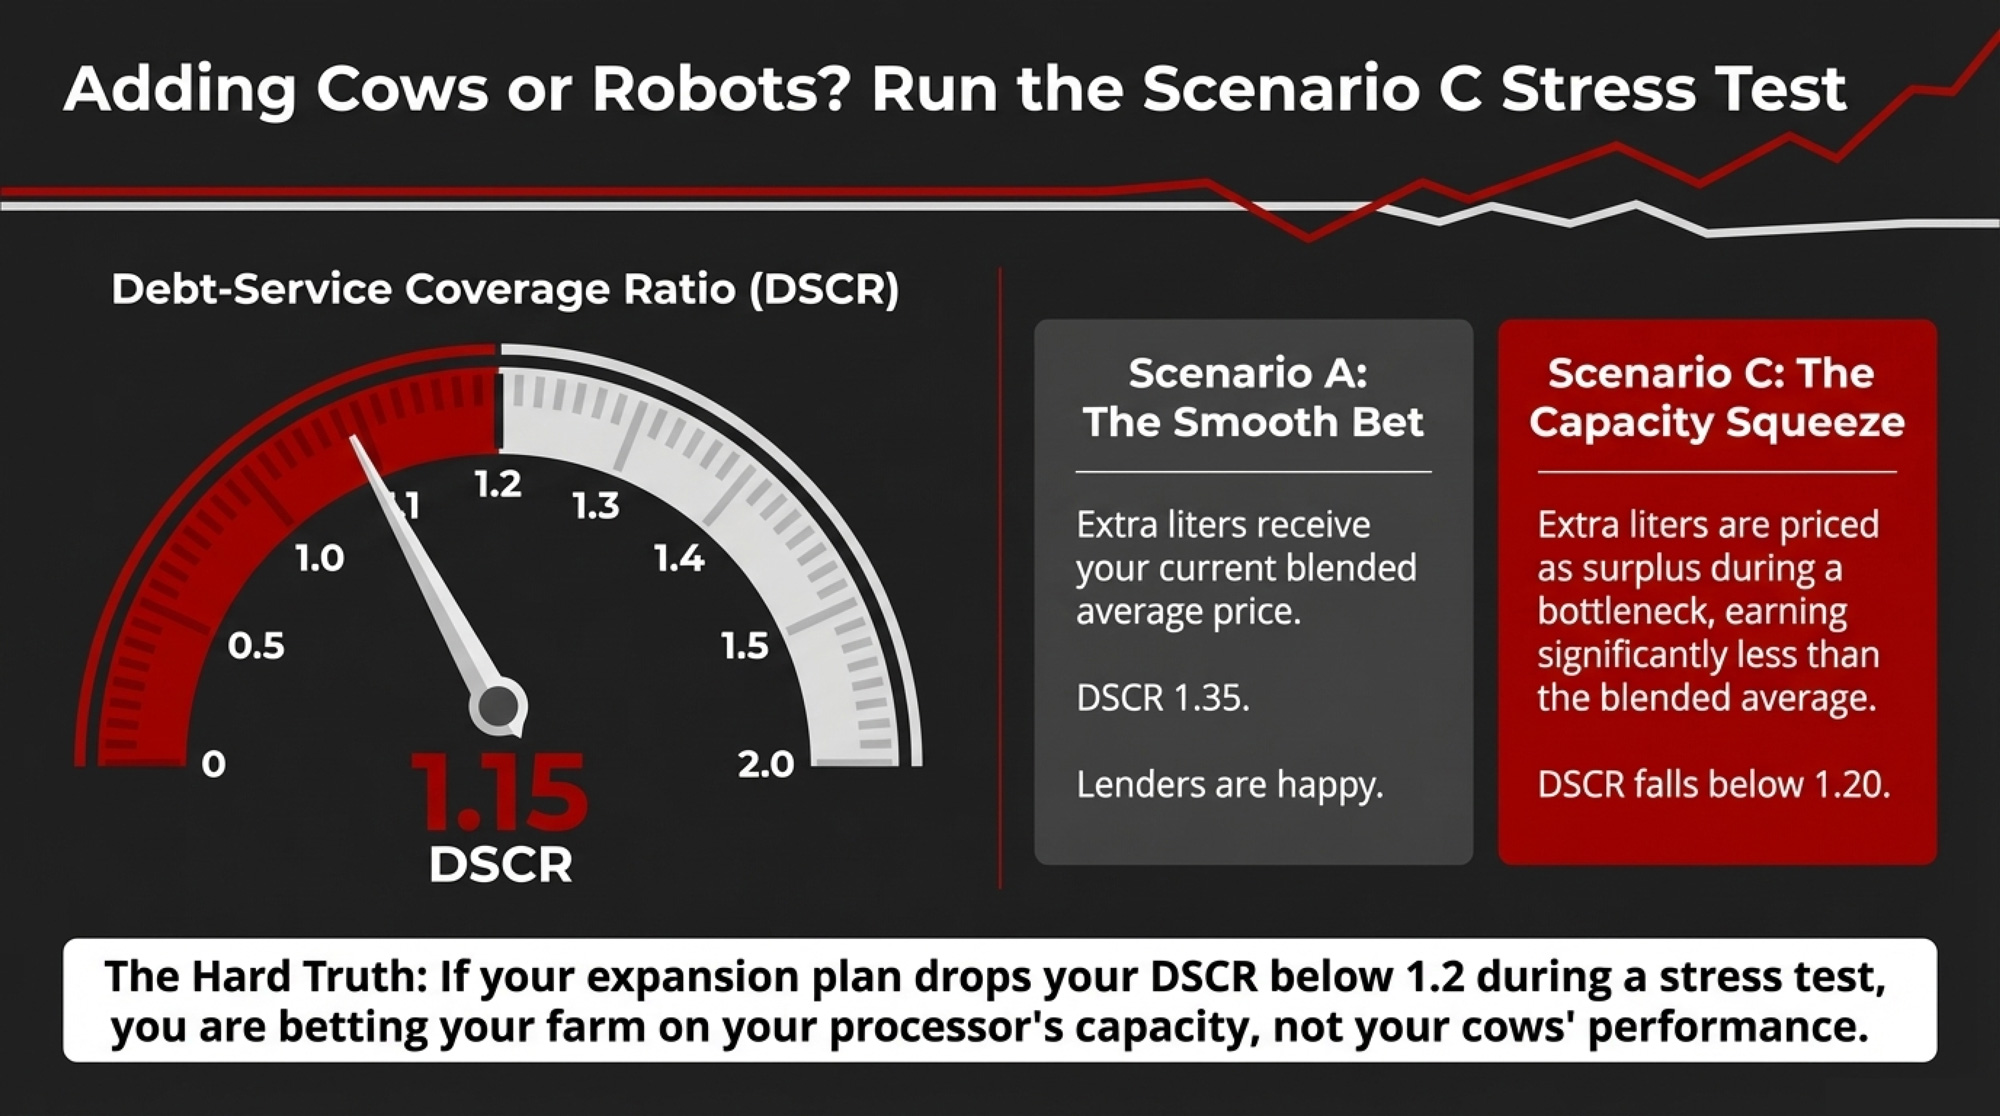
Run each scenario through your cash‑flow and debt‑service coverage ratio (DSCR) calculations. If your DSCR is, say, 1.35 at today’s blended price and falls to around 1.15 when you plug in a stress price for extra litres, you’re right at the point where many lenders start to get twitchy.
| Scenario | Incremental Litre Pricing Assumption | Extra Annual Income (€) | Annual Debt Service (€) | DSCR |
|---|---|---|---|---|
| A – Smooth | Extra litres priced at current blended average (€52/100 kg) | +€520,000 | €385,000 | 1.35 |
| B – Bumpy | Extra litres average 5% discount to blended (€49.40/100 kg) | +€494,000 | €385,000 | 1.28 |
| C – Stress | Extra litres priced at stress-period rate (€42/100 kg, like Jan 2026) | +€420,000 | €385,000 | 1.09 |
The exact thresholds will vary by bank, but once you fall below 1.2, most lenders view you as operating with very little margin for error. That’s not a reason to never expand. It’s a reason to make sure your expansion math reflects how your contract actually treats marginal litres when capacity is tight.
3. Audit Your Contract Terms — Especially Notice and Revision (Next 90 Days)
Most producers sign a contract once and then let it gather dust. In a year like this, that’s dangerous.
Get your contract out and write down:
- How much notice do you need to give to change or leave?
- How much notice does your buyer need to give to change pricing methods or key terms?
- How much can you increase or decrease volume without penalty?
- Whether there are explicit revision triggers tied to benchmarks or cost changes.
Use the Scottish study as a mental “worst‑case” benchmark: buyers with 30‑day flexibility vs. farmers needing 12 months to get out. Even if your contract isn’t that lopsided, knowing who can move faster is crucial when you’re deciding on debt and expansion.
| Contract Type | Buyer Notice to Change Terms | Farmer Notice to Exit | Asymmetry Factor |
|---|---|---|---|
| Scottish “worst case” | 30 days | 12 months | 12× |
| Typical NW Europe A-volume | 90 days | 6 months | 2× |
| Flexible B-volume | 30 days | 3 months | 3× |
| New EU-mandated (proposed) | 90 days | 90 days | 1× (balanced) |
The new EU deal around mandatory written contracts and revision options should improve this over time. But it doesn’t rewrite the document that governs your 2026 cash flow. Only you, your buyer, and — if it comes to it — your lawyer can do that.
4. Decide If You Want Any Tools Beyond the Cheque (Next 365 Days)
Big traders and commercial houses are clearly active in dairy derivatives. Research on dairy volatility since the late 2000s has documented more use of futures and options as markets opened up. Up to now, EEX has been the main European platform for butter and SMP futures.
From 2026, Euronext is set to launch European dairy futures — cash‑settled butter and SMP contracts based on the Vesper Price Index, initially covering the Netherlands, Germany, France, Belgium, Denmark, and Ireland. That’s not something you have to jump on. But it does mean your processor, your buyer, and your lender will have even more tools to manage their risk.
You don’t need to become a trader. You do need to be clear with yourself:
- Are you comfortable having zero tools if your lender and buyer are both using them?
- Would it make sense to define a small slice of volume you’d ever consider hedging — say 10–20% — if your own numbers scream “this is risky”?
A simple trigger might look like:
- “If my implied butter/SMP value per 100 kg sits more than €4 above my contract price for four straight weeks, I’ll talk to my advisor about hedging a portion of volume for the following quarter.”
- “If I lock in feed for six months, I’ll at least explore locking in a matching slice of income.”
You’re not trying to outsmart the market. You’re trying not to be the only player in the chain with no tools and all the exposure.
Signals to Watch: Is Your Gap Closing or Widening?
A few external signals will tell you whether this Dutch contract gap is likely to narrow or persist:
- How your processor responds to the EU contract deal. Do you see draft written contracts, clear benchmark references, or discussion of revision clauses — or radio silence?
- The relationship between ZuivelNL’s advance price and EEX benchmarks. If ZuivelNL advance prices stay around the low‑€40s while EEX butter and SMP hold near recent levels, there’s still margin sitting upstream.
- Changes in local capacity and product mix. USDA’s 0.2% cheese uptick “at the expense of butter and powders” shows where processors want to send litres. Any new dryers or cheese lines in your catchment area change your odds of landing in the higher‑paying streams.
- The tempo of logistics shocks. Whether it’s Hormuz, the Red Sea, or something nobody’s named yet, global shipping isn’t getting calmer. If you’re seeing a major logistics hit every 18–24 months, treating each one as a one‑off is wishful thinking.
What This Means for Your Operation
- If your own two‑line chart shows benchmark product value per 100 kg rising by about €5.56 while your farm‑gate price drifts toward €42/100 kg, your contract is doing heavy smoothing — and you’re carrying most of the timing risk when markets jump.
- If your expansion plan pencils out only at today’s blended price, you need a Scenario C in which extra litres earn significantly less during stress periods. If your DSCR falls below roughly 1.2 in that scenario, you’re not just betting on cows and feed — you’re betting on how your buyer treats your marginal litres when plants are full.
- If your buyer can change pricing terms faster than you can leave, that asymmetry belongs in every major decision you make in 2026. The EU deal should help over time, but not in time to change the contract already in your drawer.
- In the next 30 days, build the two‑line chart and show it to someone who writes cheques to you or for you.Start with data, not just “the price is terrible again.”
- In the next 90 days, walk your lender through a stress‑priced expansion scenario. Make sure they see where the weak spots are — contracts and allocation — before you lock in new debt.
- Over the next year, watch how your co‑op or buyer talks about Euronext and EEX. Any tools they use to manage their risk are tools you should at least understand, even if you never hedge a litre yourself.
Key Takeaways
- If benchmark butter and SMP moves added about €5.56/100 kg of product value while ZuivelNL’s average advance fell into the low‑€40s, you’re effectively absorbing timing risk so processors and buyers don’t have to. The barn math is simple enough to present to them.
- FrieslandCampina’s swing from a €149 million loss and a €48.08/100 kg milk price in 2023 to €56.93/100 kg in 2025 — followed by a sharp drop in advance prices in early 2026 — shows just how quickly the valve between farm and market opens and closes. Understanding that the cycle matters more than fixating on any single month’s number.
- The new EU contract rules and Euronext’s upcoming dairy futures don’t magically fix your 2026 cash flow — they change the tools on the table. Your current contract and how you use it are still the main levers you control.
The Bottom Line
Before the next alert about shipping lanes, futures rallies, or co‑op results, put two lines on paper: what the market says your litres are worth in butter and powder, and what you actually get per 100 kg. Then ask yourself — and your lender — a simple question: if that gap looks the same a year from now, are you happy with the bets you’re making on cows, concrete, and contracts, or is it time to change how your litres are treated when the world throws another punch?
Complete references and supporting documentation are available upon request by contacting the editorial team at editor@thebullvine.com.
Learn More
- More Milk, Fewer Farms, $250K at Risk: The 2026 Numbers Every Dairy Needs to Run – Exposes the brutal $250,000 margin gap between USDA forecasts and reality. This breakdown arms you with a survival playbook to find 75¢/cwt in hidden savings, protecting your equity before the 2026 consolidation wave hits.
- The Triple Cushion Trap: Why 2025’s Strong Margins Won’t Save You in 2026 – Reveals why high cull values and cheap feed are temporary safety nets. Andrew delivers a strategic frame for the next 3-5 years, showing how to reposition your herd’s genetics and contracts before these cushions inevitably deflate.
- From Shutdown to Showdown: How Dairy’s 2026 Wake-Up Call Is Redefining Survival – Breaks down the $11 billion processing wave and the high-component quality barriers coming for every milk check. It reveals how shifting to butterfat-focused genetics and precision data delivers a massive $4.40/cwt competitive advantage.
 The Sunday Read Dairy Professionals Don’t Skip.
 The Sunday Read Dairy Professionals Don’t Skip.
Every week, thousands of producers, breeders, and industry insiders open Bullvine Weekly for genetics insights, market shifts, and profit strategies they won’t find anywhere else. One email. Five minutes. Smarter decisions all week.


