


Class III in the mid‑$16s, feed cheap, margins tight. The real test in 2026 is whether calf checks and components close your gap.
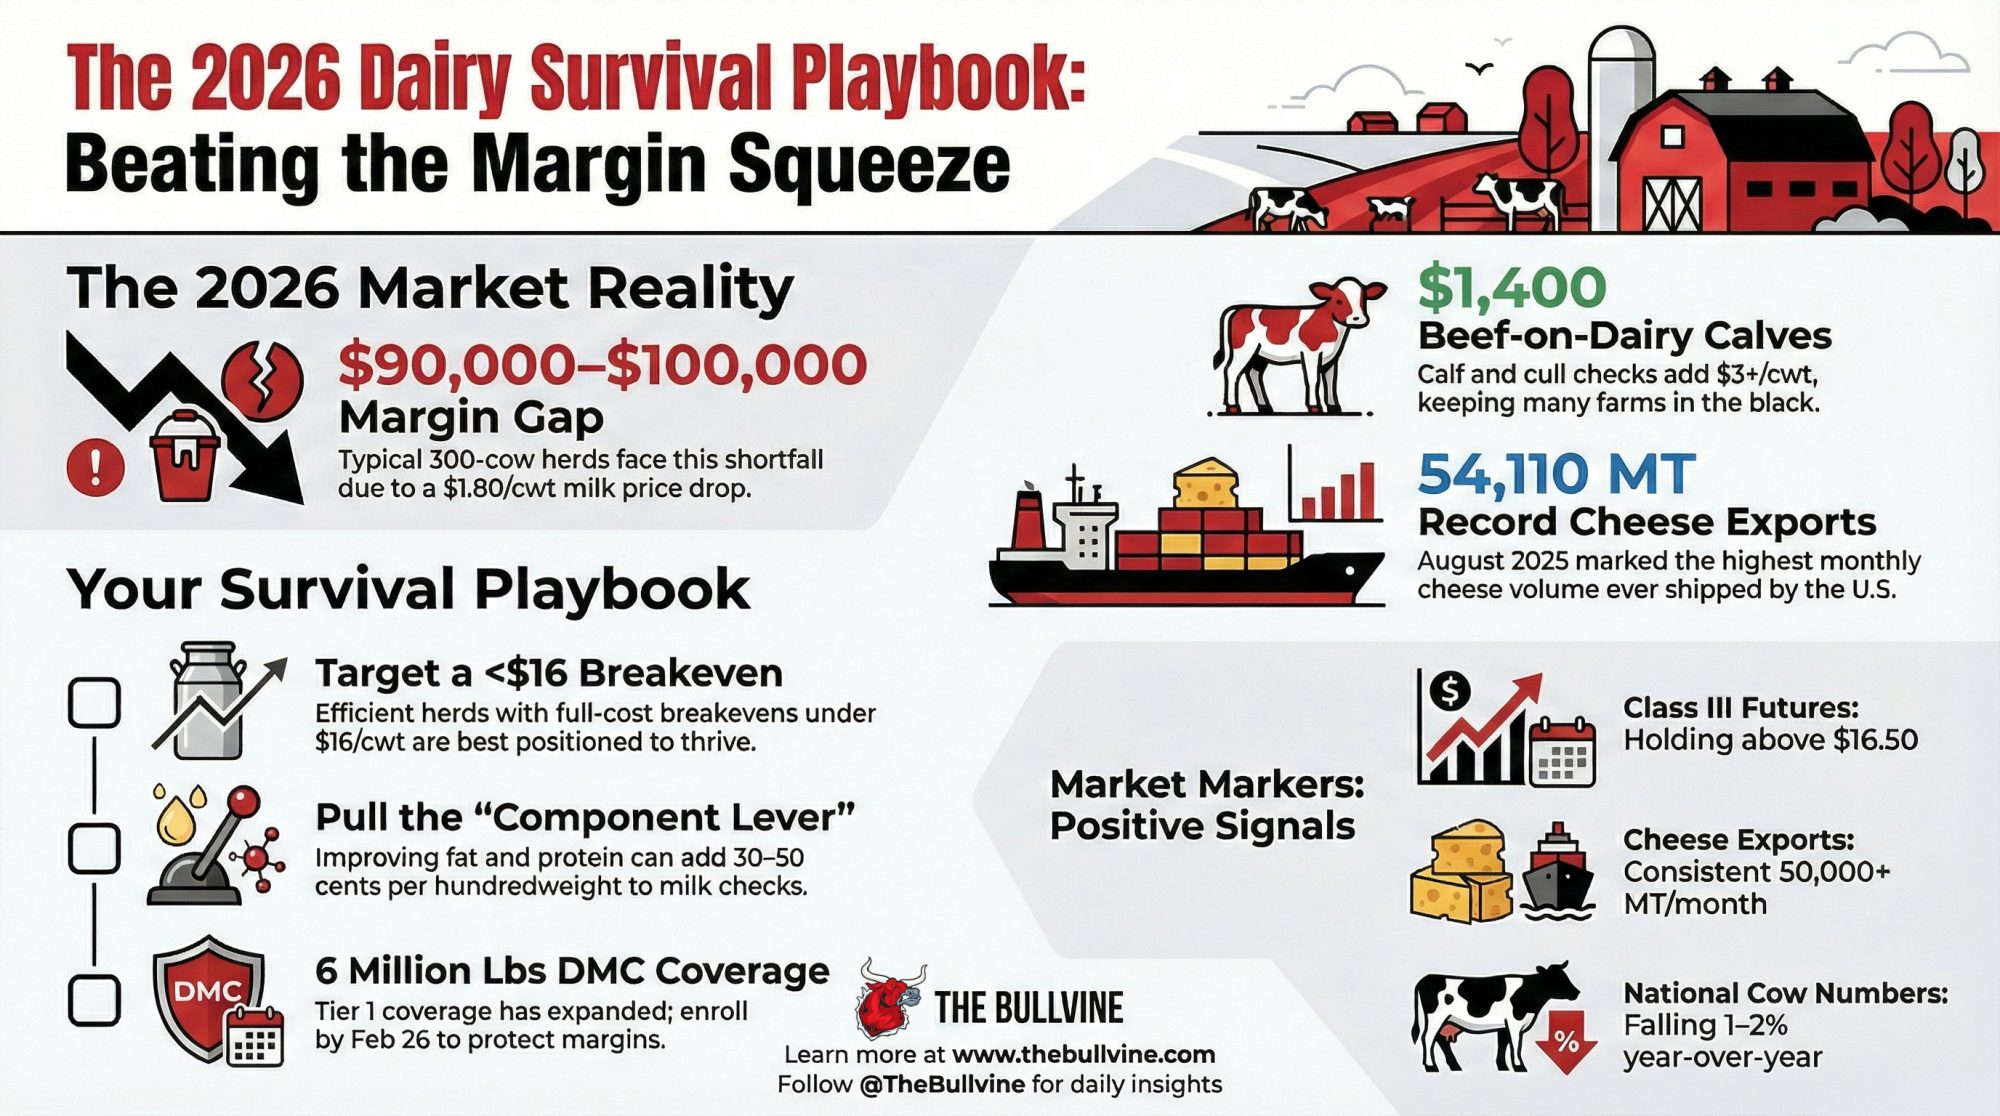
Executive Summary: USDA’s latest Milk Production report shows November 2025 output up 4.7% in the 24 major states, with 214,000 more cows on line, even as 2026 all‑milk prices are forecast about $1.80/cwt lower—leaving a typical 300‑cow herd roughly $90,000–$100,000 short on milk income. This article explains why that expansion still pencils out for many farms once you put $1,400 beef‑on‑dairy calves, strong cull checks, and record U.S. cheese and butterfat exports into the equation. It shows how calf checks, better butterfat and protein performance, and DMC’s new 6‑million‑pound Tier 1 coverage can add $2–$3/cwt back into margins on efficient herds, while highlighting why high‑cost or heavily leveraged operations—especially in the Southeast, New England, and some Western dry‑lot systems—are under far more stress. From there, you get a straight‑talk 2026 playbook: know your true breakeven, use beef‑on‑dairy and components intentionally, lock in smart DMC/DRP protection, and be honest about scale, succession, and exit timing while calf and cull values are still on your side. It closes with three simple markers—Class III futures, cheese export volumes, and national cow numbers—to help you decide when this downcycle is finally turning instead of guessing from headlines.
| Component | 2025 (at $21.05/cwt) | 2026 Forecast (at $19.25/cwt) | Year-Over-Year Change |
|---|---|---|---|
| Gross Milk Revenue | $1,452,450 | $1,328,250 | –$124,200 |
| Beef-on-Dairy/Cull Income (est.) | $32,000 | $42,000 | +$10,000 |
| Net Revenue After Offsets | $1,484,450 | $1,370,250 | –$114,200 |
You know, here’s what doesn’t quite add up when you look at where we’re starting 2026.
Most mid‑size herds are staring at roughly $90,000 to $100,000 less operating margin this year than they had in 2025, based on USDA’s all‑milk price forecasts and some pretty basic herd‑level math. USDA’s November 2025 Milk Production report put output in the 24 major states at 18.1 billion pounds, up 4.7% from November 2024, with total U.S. production at 18.8 billion pounds, up 4.5% year‑over‑year. That same report shows the milking herd in those 24 states at 9.13 million cows—214,000 more than a year earlier and even 1,000 head more than October.
So milk keeps coming, even as margins tighten to levels a lot of us haven’t had to stomach for a while.
On the face of it, that feels backward. But once you dig into the beef‑on‑dairy economics, the regional realities, and the way risk management and exports are behaving, the picture starts to come into focus.
Beef‑on‑Dairy: The Calf Check That’s Quietly Rewriting the Math
Looking at this trend, what farmers are finding is that beef‑on‑dairy has quietly become a major stabilizer in an otherwise stressful year.
Laurence Williams, who leads dairy‑beef cross development at Purina, reported in late 2025 that day‑old beef‑on‑dairy calves are now commonly bringing around $1,400 a head, compared to roughly $650 just three years earlier. Analysts ran the numbers and found that the combination of beef‑on‑dairy calves, cull cows, and related cattle sales has added $3.00 or more per hundredweight to the bottom line on many participating herds.
| Revenue Stream | 2022 (Before B×D Surge) | 2025 (Beef-on-Dairy Established) | Dollar Increase | % of Total Revenue |
|---|---|---|---|---|
| Milk Revenue (Gross) | $1,452,450 | $1,452,450 | — | 87% |
| Beef-on-Dairy Calf Income | $8,000 (dairy calves @ $650 ea) | $35,000 (B×D @ $1,400 ea) | +$27,000 | 2.1% |
| Cull Cow Sales | $18,000 | $22,000 | +$4,000 | 1.3% |
| Component Premiums (fat/protein) | $15,000 | $28,000 | +$13,000 | 1.7% |
| TOTAL REVENUE | $1,493,450 | $1,537,450 | +$44,000 | 100% |
That’s not a nice little bonus. That’s often the difference between red ink and black ink.
In barn after barn, what I’ve noticed is that producers are increasingly thinking of each cow as a two‑part enterprise: milk plus calf. If her butterfat performance and protein hold up reasonably well and she throws a high‑value beef cross calf, the calculus for one more lactation shifts. It’s no longer just, “Is she paying for her feed on milk alone?” It becomes, “Does her milk plus calf check more than cover her costs?”
CattleFax analysts have been pointing out that the U.S. beef cow herd is at its lowest level since the 1960s. That’s a structural shortage in the beef pipeline, not just a one‑season hiccup. In recent outlook presentations, CattleFax has said they expect beef and dairy‑beef calf prices to stay historically strong through 2026 and likely into the first half of 2027, because the beef herd just isn’t rebuilding quickly.
So when someone asks, “Why aren’t we seeing deeper herd cuts with these milk prices?” one honest answer is: because the calf checks and cull checks are doing a lot of heavy lifting right now, especially on farms that have leaned into beef‑on‑dairy in a disciplined way.
Global Milk Supply: Everyone Turned on the Taps at Once
Now, zooming out, here’s where it gets tricky. The U.S. isn’t expanding in a vacuum.
USDA’s Foreign Agricultural Service outlooks for 2025–2026 suggest that European Union milk production is holding near the high‑140‑million‑tonne range. Cow numbers in several EU countries are slowly declining, but productivity per cow continues to climb thanks to advances in genetics, feeding, and management documented in recent European dairy research. So you’ve still got a lot of European milk behind a very export‑oriented processing system.
In New Zealand, Fonterra cut its farmgate milk price forecast to around NZ$9.50 per kilogram of milk solids for the 2025–26 season. DairyNZ’s economic trackers show that at that level, many Kiwi farms are running on slender margins. But Fonterra’s seasonal updates have still shown collections heading into the Southern Hemisphere spring flush running ahead of the previous year across much of the country.
In South America, USDA attaché reports dindicate thatArgentina and Uruguay pare osting meaningful production gains over 2024 levels. While they’re smaller players than the EU or New Zealand, they add to the global pool of exportable milk solids and keep price presthe sure on whole milk powder amilk powder nd skim markets.
Australia is the one major exporter clearly constrained, with drought and water allocation issues limiting out,put in key dairy regions according to Australian government and industry reports. But Australia’s volumes by themselves aren’t big enough to offset Europe, New Zealand, and South America all pushing harder at once.
The bottom line on global supply is straightforward: multiple major exporting regions turned the taps up in the second half of 2025, and they’re all chasing a limited set of buyers. In that kind of environment, it doesn’t take much extra milk to lean hard on world prices.
Spot Markets and GDT: Trying to Find a Floor, Not a Rocket Ship
What’s interesting is that even in this heavy‑supply environment, the markets aren’t behaving like they d,id in some past downturns where everything fell off a cliff at once.
Take butter. USDA’s Cold Storage report released in late January 2026 shows U.S. butter inventories at the end of 2025 running about 7% below the year‑earlier level. That’s not wh,at most of us would expect given all the extra milk. But when you add in strong domestic demand for fat through the holiday season and the fact that U.S. butter has often been priced below European and New Zealand butter, it starts to add up.
Traders have responded to that combination with a firmer butter market than many had penciled in. That doesn’t mean prices are great, but it does mean there’s a recognizable floor.
Skim‑side products have been more volatile, but there ar,e some positive signs there too. At the Global Dairy Trade auctions in early January 2026, the overall price index climbed 6.3% at the first event of the year and another 1.5% at the next. Skim milk powder rose a little over 2% at the most recent auction, with butter and anhydrous milk fat also moving higher. Whole milk powder gained about 1%.
Analysts at AHDB in the U.K. and other market trackers have noted that these gains were broad‑based rather than driven by a single dominant buyer. Middle Eastern importers stepped up their participation to the highest share in roughly two years, and Chinese buyers returned to the platform more actively than they had in late 2024, even as China continues pushing its own domestic dairy expansion.
So are prices “back”? No. But they might be trying to carve out a base instead of sliding endlessly lower, and that’s worth watching.
U.S. Cheese Exports: The Quiet Workhorse in the Background
If there’s one bright spot that doesn’t get enough credit, it’s cheese exports.
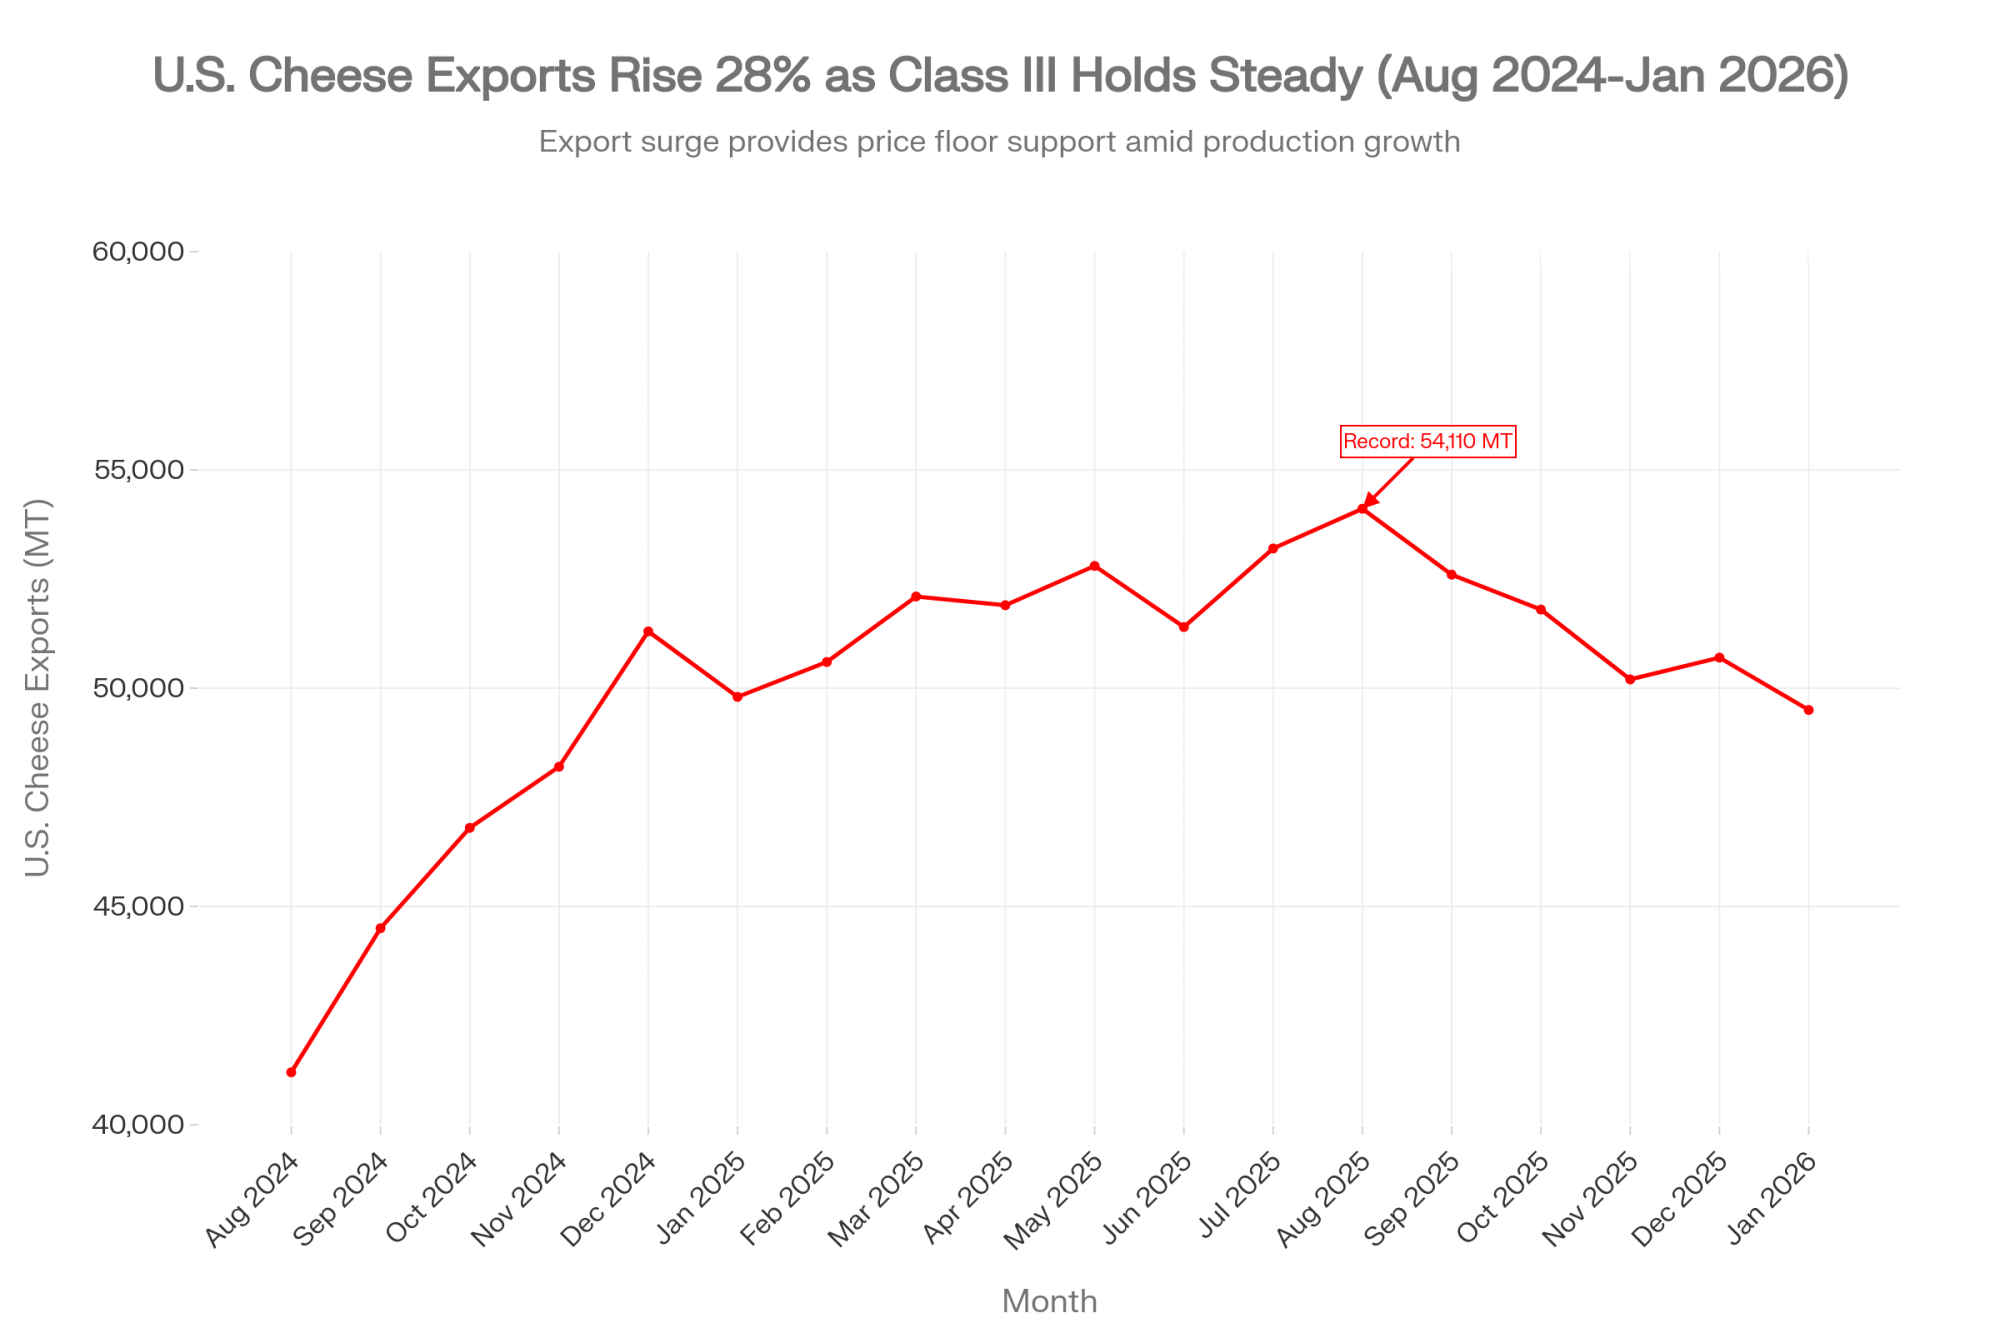
The U.S. Dairy Export Council’s November 2025 report highlighted that August cheese exports hit 54,110 metric tons, up 28% year‑over‑year and the highest monthly cheese volume the U.S. has ever shipped. August was also the fourth straight month where U.S. cheese exports topped 50,000 metric tons—a milestone that had never been reached before May 2025.
Analysts pointed out that South Korea’s cheese imports from the U.S. were up 84% compared to the previous year. Mexico, Central America, Japan, and Australia all booked sizable gains as well. Butterfat exports nearly tripled year‑over‑year, with butter and anhydrous milkfat shipments up close to 190–200% in some categories, as foreign buyers took advantage of relatively cheap U.S. fat.
A big driver is price. USDEC and several commodity risk firms have noted that U.S. cheese—especially cheddar and mozzarella‑type products—has been priced below comparable European and Oceania offerings for much of 2025. That discount, combined with new cheese plants in the central U.S., has given buyers reasons to shift more volume to U.S. suppliers.
Without that export engine—in both cheese and butterfat—we’d likely be staring at much bigger inventories and even lower domestic prices.
Feed Costs: A Tailwind That Still Can’t Outrun the Headwinds
Now, let’s slide over to the cost side of the ledger.
USDA crop reports for 2025 confirmed a big U.S. corn harvest and solid soybean production. That’s kept corn futures trading in the low‑to‑mid $4 per bushel range and soybean meal at relatively manageable levels compared to the spike years we all remember too well. When you plug these feed prices into the Dairy Margin Coverage formula, the feed‑cost component drops to some of the lowest levels we’ve seen since late 2020.
Land‑grant economists and extension dairy specialists have been pointing out that, at least on paper, this should be a “feed‑friendly” year.
But here’s where the math still bites: USDA’s outlook, as summarized by Southeast Ag Net and other ag media, has the 2026 all‑milk price averaging around $19.25 per hundredweight, down from about $21.05 in 2025. That’s a drop of roughly $1.80 per hundredweight. So even if feed costs trim 35 to 50 cents per hundredweight off your expense line, the net margin still narrows uncomfortably.
I’ve seen some herds with exceptionally strong forage programs and careful fresh cow management insulate themselves a bit more—they’re getting more milk per unit of feed, which helps. But nobody’s describing this as an “easy‑money” year.
How the 2026 Margin Squeeze Lands on Different Farms
Let’s put some real numbers to this.
| Region / Herd Profile | Typical Herd Size | Full-Cost Breakeven ($/cwt) | 2026 Forecast Price ($/cwt) | Margin/(Loss) at Forecast | Key Headwinds |
| Upper Midwest (WI, MN) | 300–500 | $16.50–$17.00 | $19.25 | +$2.25–$2.75 | None acute; feed-friendly; strong components help |
| Texas Panhandle | 2,000–5,000 | $17.00–$18.00 | $19.25 | +$1.25–$2.25 | High debt from recent expansion; interest rate exposure |
| California Central Valley | 2,000–8,000 | $16.50–$17.50 | $19.25 | +$1.75–$2.75 | Water restrictions; regulatory costs; high land value |
| Southeast (Federal Order 7) | 150–300 | $19.00–$20.50 | $19.25 | –$0.25 to +$0.25 | Class I premium erosion; heat stress; long hauls to plant |
| New England | 100–250 | $20.00–$21.50 | $19.25 | –$0.75 to –$2.25 | High land, labor, & regulatory costs; insufficient scale |
| Upper Midwest (< 100 cows) | 40–100 | $22.00–$25.00 | $19.25 | –$2.75 to –$5.75 | Can’t spread fixed costs; limited premium market access |
| Mid-Size Growth (500–1,000) | 500–1,000 | $17.50–$18.50 | $19.25 | +$0.75–$1.75 | Debt servicing; succession clarity required |
Imagine a 300‑cow herd shipping about 23,000 pounds per cow annually—roughly 69,000 hundredweight per year. At a $1.80 per hundredweight drop in milk price, you’re looking at about $124,000 less top‑line milk revenue. If beef‑on‑dairy calves and components are adding extra income, that might bring the net hit closer to that $90,000 to $100,000 range, but it still stings.
USDA’s Economic Research Service breaks milk cost of production down by herd size, and while the exact numbers vary year to year, the pattern is consistent. Small herds under 50 cows often end up with total economic costs—once you price in family labor, depreciation, and interest—well over $40 per hundredweight. Mid‑size herds from 100 to 500 cows commonly sit somewhere in the low‑to‑mid twenties. Large herds, especially those above 2,000 cows with efficient layouts and strong management, can get their full costs into the upper teens or around $20.
In Wisconsin and much of the Upper Midwest, extension educators tell me that herds with a true full‑cost breakeven under about $16 per hundredweight are generally okay at these forecasted prices, especially if they’re capturing strong component premiums and calf/cull income. Once that breakeven climbs into the $18–20 range, the stress shows up quickly in lender meetings.
In California’s Central Valley and the Texas Panhandle, a lot of the big modern facilities have very competitive operating costs on a per‑hundredweight basis but also carry significant debt from recent expansions. When interest rates sit where they are and all‑milk prices back up, those principal and interest payments can start to drive decisions just as much as feed bills.
The Southeast is fighting a different battle. Federal Order 7, along with Order 5 in parts of the Appalachian region, has long relied on Class I fluid milk premiums to keep blend prices workable. University of Kentucky and other regional economists have been documenting how declining beverage milk consumption reduces Class I utilization and erodes that premium. Combine that with higher heat‑stress mitigation costs, more challenging forage conditions, and long hauls to processing plants, and many Southeast producers describe 2025–2026 as one of the toughest stretches they’ve faced.
In New England, the story centers on high land values, strict environmental regulations, and costly labor. Even with excellent butterfat performance and strong protein, some mid‑size herds simply can’t spread those fixed costs across enough hundredweight to make the numbers work at a sub‑$20 all‑milk price.
So when you look at the national average projections, it’s worth reminding yourself: there really is no single “U.S. dairy market.” Your reality depends on your region, your herd size, your debt structure, and how you manage forage, cows, and risk.
What DMC and Risk Management Can—and Can’t—Do This Year
Given all that, it makes sense that Dairy Margin Coverage is back on a lot of producers’ radar.
For the 2026 program year, USDA’s Farm Service Agency expanded Tier 1 coverage from 5 million to 6 million pounds of milk. That’s a big deal for herds in the 250–300‑cow range, because more of their production now fits under the lower Tier 1 premium schedule. Penn State Extension, Texas Farm Bureau, and several other groups have all been reminding producers that enrollment opened January 12 and runs through February 26, 2026.
Risk‑management specialists like Katie Burgess, director of risk management at Ever.Ag, has been quoted as saying that their models point to DMC payments exceeding $1 per hundredweight for at least the first few months of 2026, with smaller payments likely into mid‑year if current price and feed forecasts hold. That lines up with what many margin calculators were showing as we came into January.
It’s worth noting that DMC is designed as a margin program, not a price program. So it’s the combination of feed cost and milk price that matters. In a year like this, where feed is relatively cheap but milk has dropped more, it can still provide meaningful support.
Beyond DMC, Dairy Revenue Protection (DRP) and Livestock Gross Margin for Dairy (LGM) remain important tools. Extension economists at universities like Wisconsin, Minnesota, and Cornell keep stressing a simple point: the farms that seem to manage volatility best are the ones that decide ahead of time what prices they’ll lock in and how much volume they’ll protect, rather than trying to chase the market in real time.
Practical Playbook: Questions to Take to Your Lender and Nutritionist
If we were sitting at your kitchen table with a pot of coffee and your last 12 months of milk statements, here are the areas I’d want to talk through.
1. Know Your Real Breakeven, Not Just a Guess
You probably know this already, but in a year like 2026, guessing at your cost of production is dangerous.
That means:
- Putting real numbers on family labor (what you’d have to pay someone else to do those jobs)
- Including depreciation on equipment and facilities, not just current payments
- Accounting for land costs honestly, whether you own or rent
Once you’ve got that full‑cost breakeven per hundredweight, compare it to what you can reasonably expect for the next 12 months, using both the USDA all‑milk forecast and current Class III/IV futures as guides. If your breakeven is $17 and you can add a couple of dollars from beef‑on‑dairy calves and solid components, you’re in a very different position than if your breakeven is $22 and you’re light on calf income.
2. Use Beef‑on‑Dairy as a Strategy, Not Just a Trend
Beef‑on‑dairy works best when it’s planned, not just sprinkled around.
The herds making it pay are typically:
- Using sexed dairy semen on their best cows and heifers to generate high‑quality replacements
- Breeding the bottom half—or more—of the herd to carefully chosen beef sires to maximize calf value
- Building relationships with buyers, feedlots, or finishers who know how to handle dairy‑beef crosses
Several auction reports have all documented beef‑on‑dairy calves bringing $800–$1,000 per head in many markets, with some sales reporting over $1,600 for particularly strong day‑old crossbreds. When those prices are combined with the right breeding plan, you’re not just “having fun with a fad”—you’re rewiring your revenue model.
3. Treat Butterfat and Protein as Margin Levers
In a lot of federal orders and cooperative pay schedules, components are where the real action is.
Risk‑management columns from organizations like the Center for Dairy Excellence and multiple land‑grant extension dairy programs have shown that moving from, say, 3.7% fat and 3.0% protein toward something closer to 3.9% fat and 3.2% protein can often add 30–50 cents per hundredweight to the milk check in strong component markets. Across a 300‑cow herd shipping 23,000 pounds per cow, that can easily translate to $20,000–$30,000 per year.
Getting there usually isn’t about one magic bullet. It’s the combination of:
- Consistent, high‑quality forages
- Attention to detail in the transition period so fresh cows hit lactation strong
- Careful ration balancing with your nutritionist
- Stable cow comfort and feed access, especially in hot weather
As many of us have seen, the herds that are fanatical about feed delivery, bunk management, and minimizing up‑and‑down swings in dry matter intake tend to be the same herds that quietly add 0.1–0.2% fat and a bit more protein without spending much extra per cow.
4. Decide What “Scale” Means for Your Family, Not Just Your Neighbors
This is the hardest part of the conversation, but it’s one we can’t dodge.
If you’re under 500 cows and don’t have a clear edge—either by being ultra‑efficient, having reliable premium markets, or running a strong direct‑to‑consumer business—the structural headwinds have been intensifying for a decade. Consolidation in the U.S. dairy sector is well documented in USDA and industry analyses.
That doesn’t mean small and mid‑size herds are doomed. It does mean that, in many regions, they need one or more of the following to thrive:
- A truly low cost of production and low debt load
- A solid premium market (organics, grass‑fed, A2, or strong local brand)
- An intentional plan to partner, merge, or exit before pressure forces a fire sale
The one thing that’s clear from both economic data and real farm stories is that making the tough calls while calf and cull prices are still strong usually works out better than waiting until lender pressure makes the decision for you.
What Could Actually Turn This Market Around?
So, with all of that on the table, what would it take for 2027 to feel meaningfully better than 2026?
1. A Real Supply Response
USDA’s late‑2025 Livestock, Dairy, and Poultry outlook pointed to ongoing herd expansion through much of 2025. For margins to really heal, we eventually need either stronger demand or slower growth in milk.
A meaningful supply response would look like:
- National cow numbers falling 1–2% from their recent peaks
- Noticeable herd dispersals in high‑cost regions
- Replacement heifer prices easing as fewer people expand
Right now, beef‑on‑dairy is slowing that process because cull and calf values are so attractive. But if milk stays soft long enough, history says the herd will respond.
2. Sustained Export Strength
Export performance has a huge say in how quickly things improve at home.
If U.S. cheese exports can consistently stay in that 50,000‑metric‑ton‑plus range month after month, and butterfat exports hold onto their recent gains, that continues to siphon product off the domestic market and support both Class III and Class IV values. USDEC’s 2025 reports make it clear that strong export demand is the reason we’ve been able to move record volumes of cheese without drowning in inventory.
Watching Global Dairy Trade auctions, USDEC’s monthly updates, and export coverage is a good way to sense whether that engine is still running or starting to sputter.
3. Class III and All‑Milk Prices Converging on Something Livable
One simple rule of thumb several risk‑management folks use is this: if Class III futures can hold above about $16.50 for several consecutive contract months and you simultaneously see herd contraction, the worst of the downcycle is probably behind you.
Right now, USDA’s all‑milk forecast sits in the $19s for 2026, while Class III futures tend to be in the mid‑$15s to mid‑$16s in many months, based on early‑January price sheets. That gap is a big reason analysts keep warning producers to build budgets off realistic Class III/Class IV numbers, not just the all‑milk headline.
Three Markers Worth Checking Every Month in 2026
If we boil everything down, here are three things I’d personally watch as the year unfolds:
- Class III Futures: Are several 2026 contracts holding above roughly $16.50, or are they stuck in the mid‑$15s?
- Cheese Exports: Are U.S. cheese exports still at or above 50,000 metric tons per month, or have they slipped back? USDEC’s monthly summaries are a good quick read here.
- Herd Size: Are national cow numbers finally dropping 1–2% from a year earlier, as reflected in USDA’s Milk Production reports, or are we still adding cows?
If, by late summer, we can honestly say “yes” to at least two of those being in the “improving” camp, there’s a good chance 2027 looks more forgiving than 2026.
| Signal / Metric | 2026 Breakeven Target | Current Status (Jan 2026) | What “Improving” Looks Like | Your Action |
| Class III Futures | Hold >$16.50 for 3+ consecutive contract months | Mid-$15s to $16.20 range | Several 2026 contracts trending toward $16.50+ | Monitor CME futures daily; lock protection at $16.50+ |
| U.S. Cheese Exports | Sustain 50,000+ MT per month | August peak 54,110 MT; December ~50,700 MT; still strong | Consistent 50K+ MT/month through Q2 2026 | Check USDEC monthly reports; if slipping below 48K MT, watch for domestic price weakness |
| National Cow Numbers | Down 1–2% from year-earlier level | Up 214,000 cows YoY (9.13M in 24 states) | Herd numbers plateau or decline 1–2% in Milk Production reports | If two of three signals are improving by late summer, cycle is likely turning; consider less aggressive risk management in 2027 |
| DECISION POINT (Late Summer 2026) | Two of three signals in “improving” column | TBD – Check back August 2026 | If YES → 2027 likely more forgiving; if NO → Tighten controls further | Revisit break-even, debt, and succession plans with lender & advisor |
Bringing It Back to Your Farm
At the end of the day, the big charts and global data are useful, but they’re just the backdrop. The real work is in your own ledger, your own barns, your own conversations with family and lenders.
If there’s one thing this cycle is forcing on all of us, it’s clarity. Clarity about what our true costs are. Clarity about which cows and acres are really paying their way. Clarity about how much risk we’re willing to carry—and for how long.
The farms that come through this stretch in good shape tend to:
- Know their cost of production down to a realistic dollars‑per‑hundredweight number
- Use tools like DMC, DRP, and LGM on purpose—not as an afterthought
- Treat beef‑on‑dairy and components as serious margin levers, not side projects
- Keep fresh cow management and the transition period tight, so they’re not quietly bleeding money on sick cows and lost milk
- Are honest about scale, succession, and what “success” looks like for their family
If 2026 feels tight for you, you’re not alone. Many of us are staring at the same spreadsheets and having the same conversations.
What’s encouraging is that the long‑term demand story for dairy still looks solid. USDEC data shows U.S. dairy exports hitting record volumes. USDA consumption statistics show Americans eating more cheese and using more dairy ingredients than ever. There’s been billions of dollars invested in new processing capacity across the country in the past few years—companies don’t make those bets if they think the category is dying.
The trick is getting from here to there without burning through more financial and emotional capital than you can afford.
And that’s where open, honest conversations—at meetings, in vet trucks, over coffee at the kitchen table—about the real math on our farms might be one of the most valuable tools we’ve got in 2026.
Key Takeaways
- $90K–$100K less milk income for a 300‑cow herd: USDA’s 2026 all‑milk price is forecast $1.80/cwt below 2025. At 69,000 cwt shipped, that’s a six‑figure revenue gap before calf and cull checks help close it.
- Beef‑on‑dairy is why cow numbers keep climbing: $1,400 day‑old crossbred calves (vs. $650 three years ago) plus strong cull values add $3+/cwt to participating herds, according analysts, enough to justify keeping cows that would’ve been culled in 2022.
- Record exports are quietly backstopping the market: August 2025 cheese exports hit 54,110 MT (+28% YoY); butterfat exports nearly tripled. Without that demand pulling product offshore, domestic prices would be far uglier.
- DMC Tier 1 now covers 6M lbs—enrollment closes Feb 26: That fits a 250–300‑cow herd. Analysts project payouts above $1/cwt early in 2026. If you haven’t enrolled, you’re leaving real money on the table.
- Know your breakeven, use components as a margin lever, and watch three signals: Herds under $16/cwt full cost and capturing strong butterfat/protein premiums are in far better shape. Track Class III futures (>$16.50), cheese exports (50K+ MT/month), and national cow numbers (down 1–2% YoY)—when two of three turn positive, the cycle is likely shifting.
Editor’s Note: The numbers in this article draw on USDA’s November 2025 Milk Production report, USDA Economic Research Service cost-of-production data, USDA Farm Service Agency announcements on Dairy Margin Coverage, CME Group market reports, Global Dairy Trade auction results, and industry analysis from the U.S. Dairy Export Council, and land‑grant university extension programs. Comments on beef‑on‑dairy and export trends reflect 2024–2025 data and interviews with credentialed industry experts, including analysts at CattleFax and risk‑management professionals working with dairy producers.
Learn More
- The $15,800 DMC Decision Every Dairy Needs to Make Before February 26 – Gain an immediate $15,800 premium advantage by restructuring your safety net before the February deadline. This blueprint delivers the exact math to transition from a generic renewal to an optimized, 6-million-pound Tier 1 protection plan.
- Beef-on-Dairy’s $3,000 Trap: 800,000 Missing Heifers and Who Pays the Bill – Expose the $3,000 biological trap hidden within today’s calf checks before your replacement pipeline runs dry. This analysis arms you with the inventory intelligence to navigate a structural heifer shortage and secure high-value processor partnerships.
- The Next Frontier: What’s Really Coming for Dairy Cattle Breeding (2025-2030) – Arm your operation with a $5,000-per-cow genetic edge by leveraging CRISPR and AI-driven health markers. This roadmap reveals how transitioning into high-casein “designer milk” and automated disease detection will redefine your bottom line by 2030.
 The Sunday Read Dairy Professionals Don’t Skip.
 The Sunday Read Dairy Professionals Don’t Skip.
Every week, thousands of producers, breeders, and industry insiders open Bullvine Weekly for genetics insights, market shifts, and profit strategies they won’t find anywhere else. One email. Five minutes. Smarter decisions all week.


