
A 500-cow herd breeding 60% to beef at $8 a straw thinks they’re saving money. They’re $313 per cow underwater and 15 heifers short every year. The spreadsheet doesn’t lie.
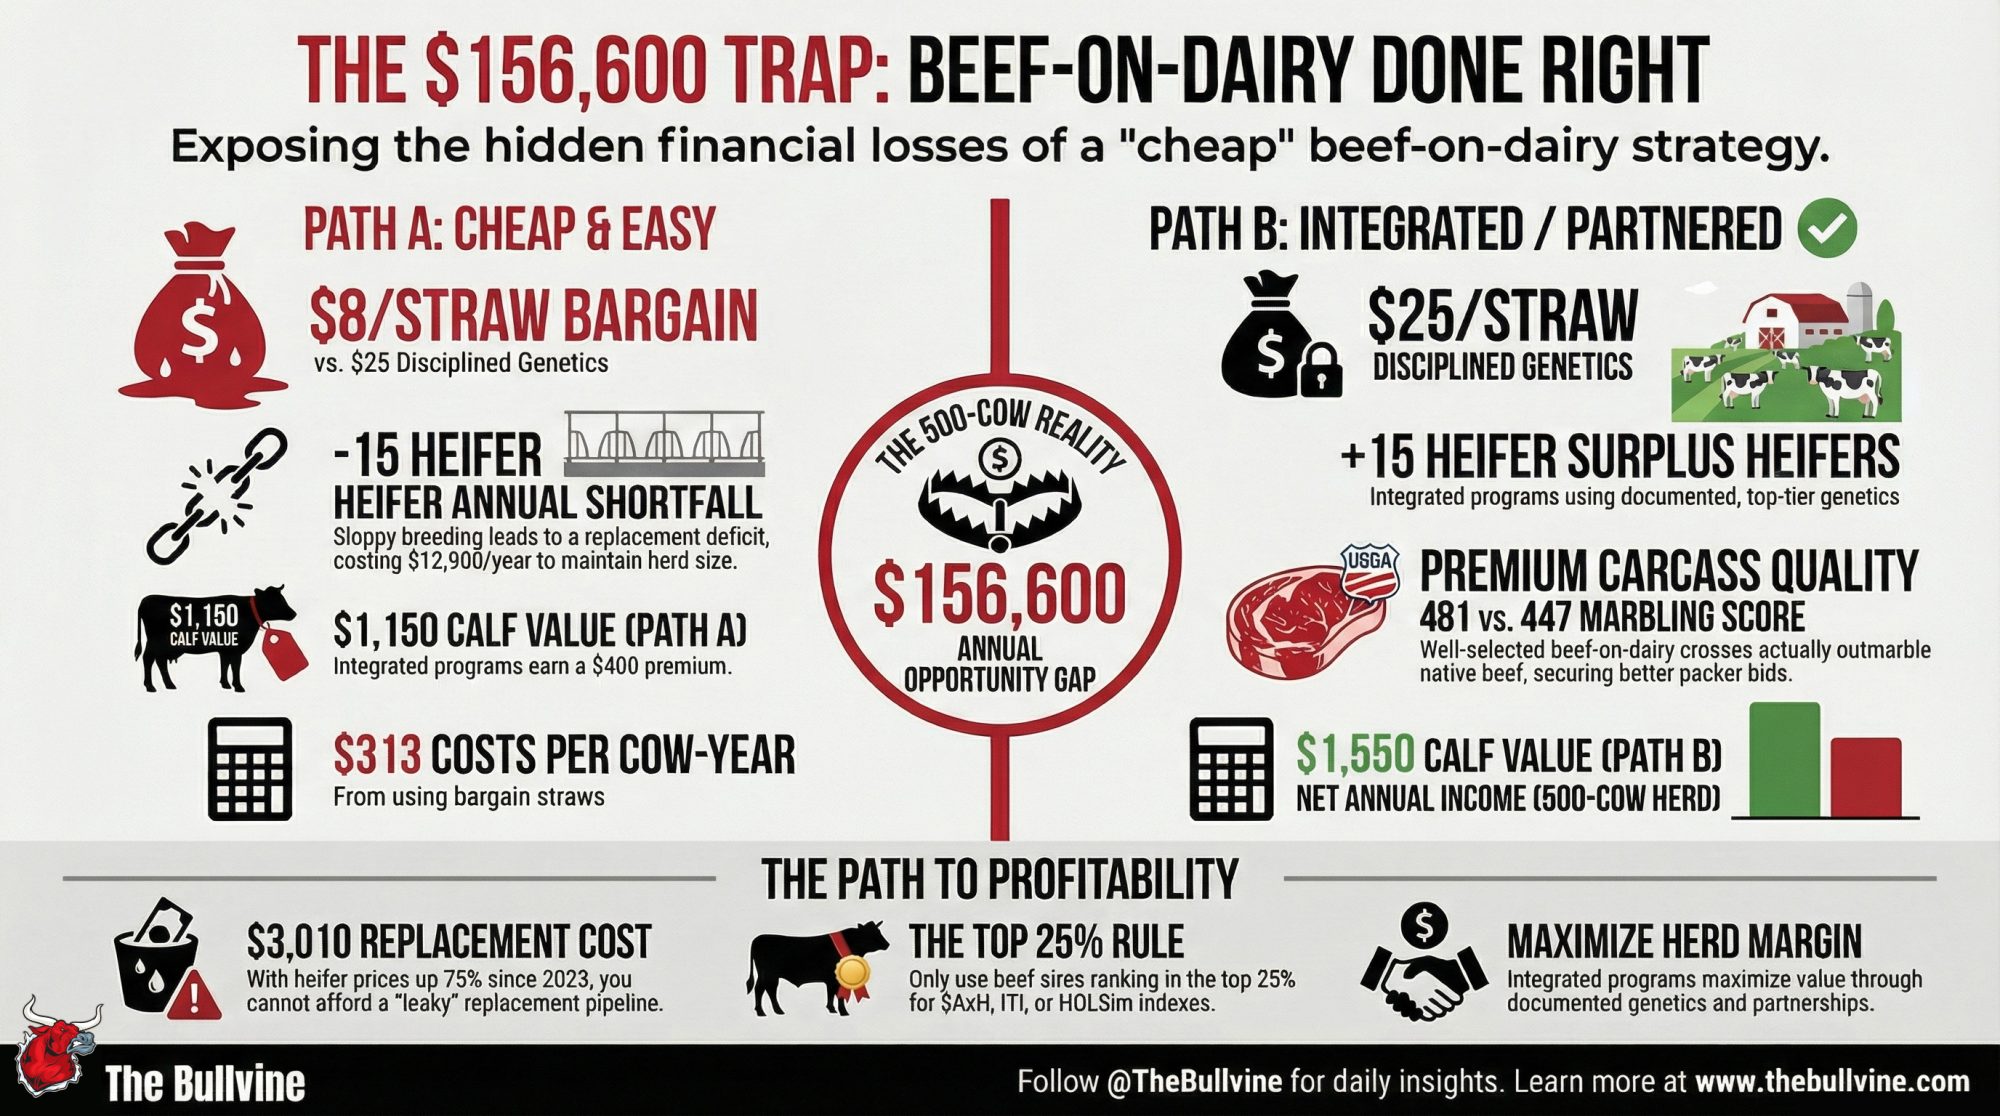
Executive Summary: The gap between a cheap beef-on-dairy strategy and a disciplined one on a 500-cow Holstein herd is $156,600 a year — $313 per cow. Most of that margin vanishes into places nobody budgets for: a 15-heifer annual replacement shortfall at $3,010 each, higher calf mortality, and undocumented calves discounted $25–50 a head at the barn. CoBank’s heifer deficit data says the industry is 600,000–700,000 head short; every $8 straw of unselected beef semen widens the hole on your farm while you think you’re pocketing $7,700 in annual savings. Peer-reviewed carcass research shows well-selected beef × dairy crosses actually outmarble native beef — but random-sire crosses are sliding toward Holstein bull calf pricing. Three paths, three cost structures, and a 30/90/365-day audit that starts with one number: your real 21-day PR — not your target. If your replacement pipeline can’t survive your current beef percentage, that $156,600 gap isn’t a model. It’s your margin.
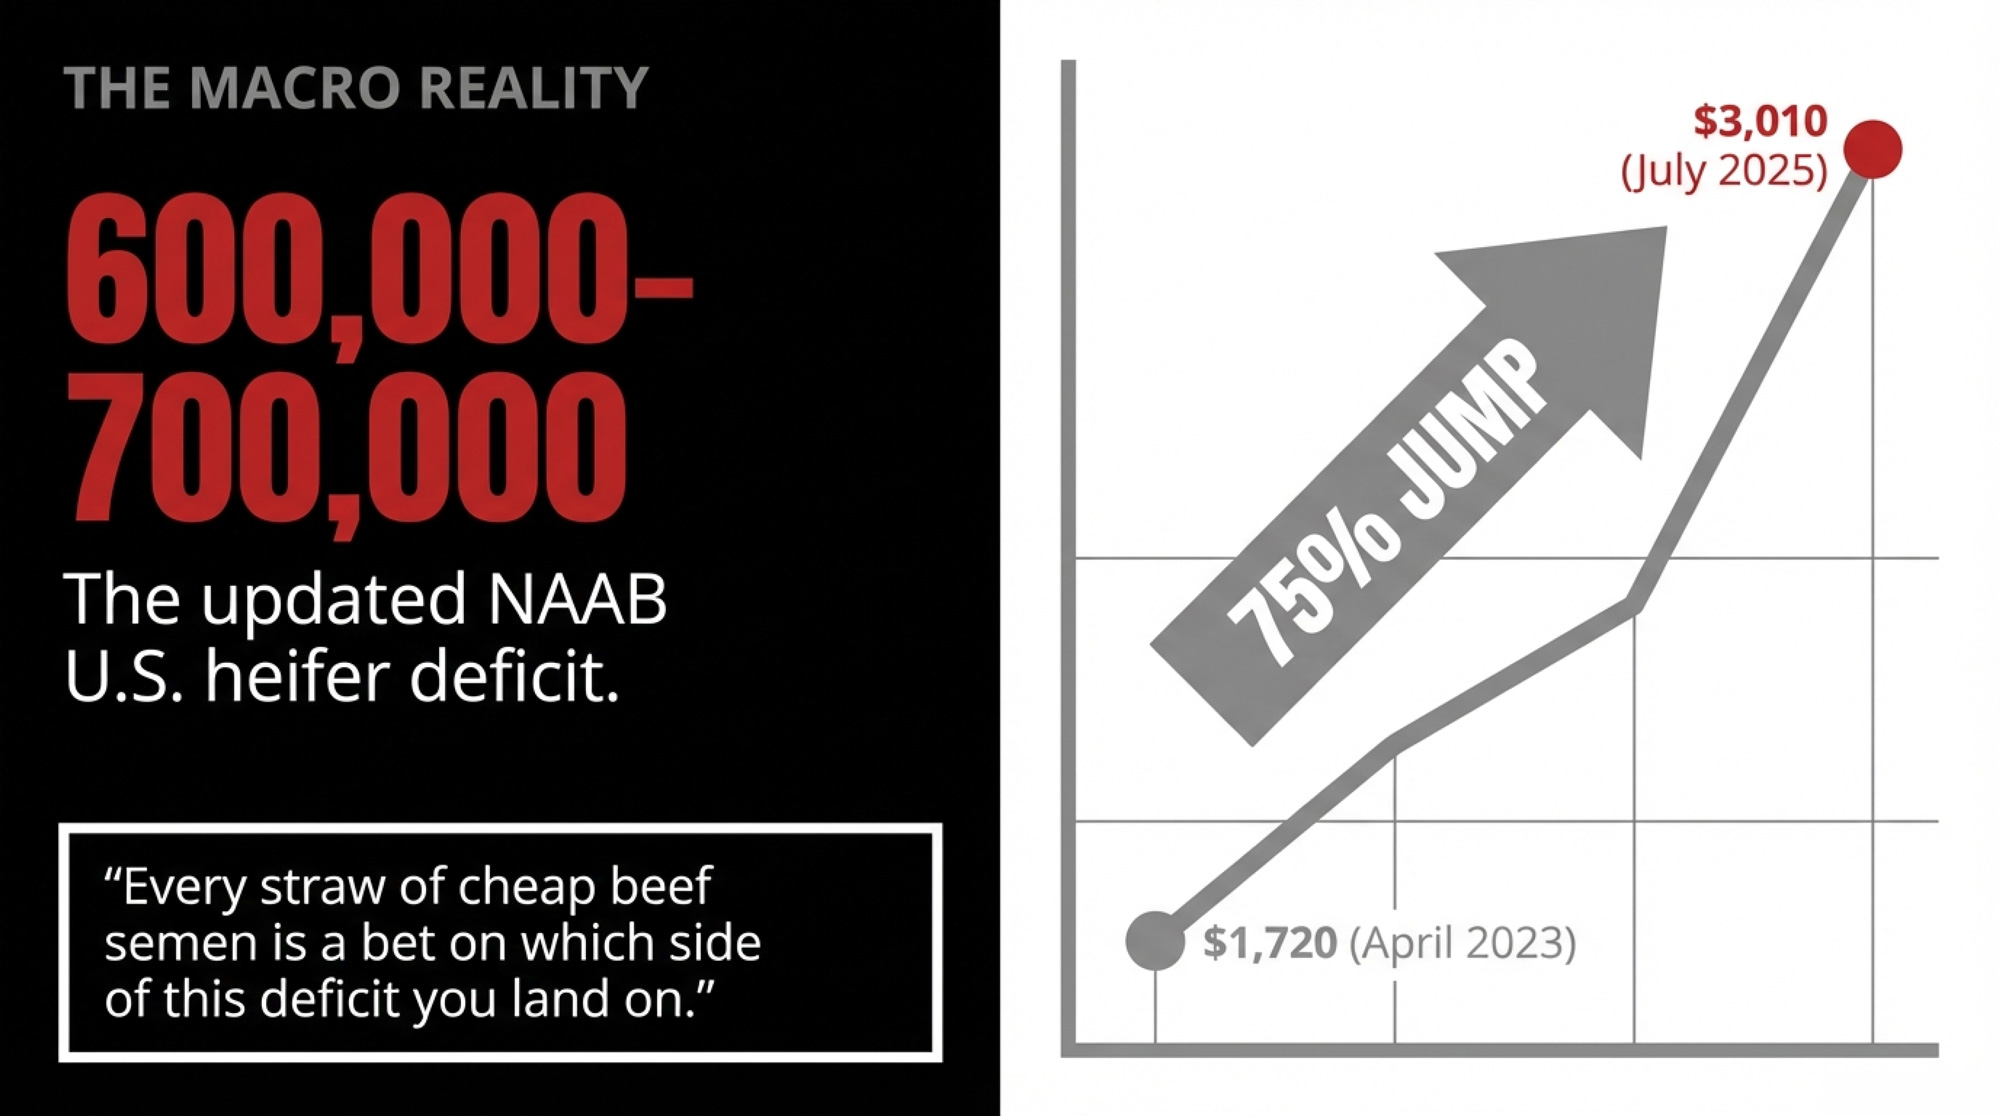
CoBank’s August 2025 analysis put a number on what a lot of producers already felt in their gut: the U.S. dairy industry was roughly 800,000 heifers short — a figure that updated NAAB year-end data released March 10, 2026, has since been revised closer to 600,000–700,000 head. The correction from sexed semen is running ahead of schedule. But the farm-gate math hasn’t softened, because replacement heifers tracked from $1,720 per head in April 2023 to $3,010 by July 2025 — a 75% jump in barely two years. And every straw of beef semen in your tank is a bet on which side of that deficit you land on.
So we modeled it. Three beef-on-dairy strategies run on an identical 500-cow Holstein herd in the Ontario/US Midwest market. Same parlor. Same turnover. Same pregnancy rate. The only variable: how seriously the operation treated the beef side of the business. The gap between the cheapest approach and the most disciplined one wasn’t a rounding error. It was $156,600 a year.
The Backdrop You Can’t Ignore
This isn’t a “should you use beef semen?” conversation. You already are. The question is whether those straws are building equity or quietly draining it — and whether there’s a genetic time bomb hiding in the fresh pen that you haven’t priced yet.
National cattle inventories sit at their lowest point since 1951 — just 86.2 million head as of the January 2026 USDA count. Dairy-origin cattle now account for an estimated 18–24% of U.S. commercial beef production when you combine finished steers, heifers, and cull cows, according to Beef Checkoff and university extension data tracking 2002 through 2018, and the share is almost certainly higher today given the explosive growth of beef-on-dairy breeding. Every genetic decision in the breeding pen is a marketing decision for 2027 and 2028.
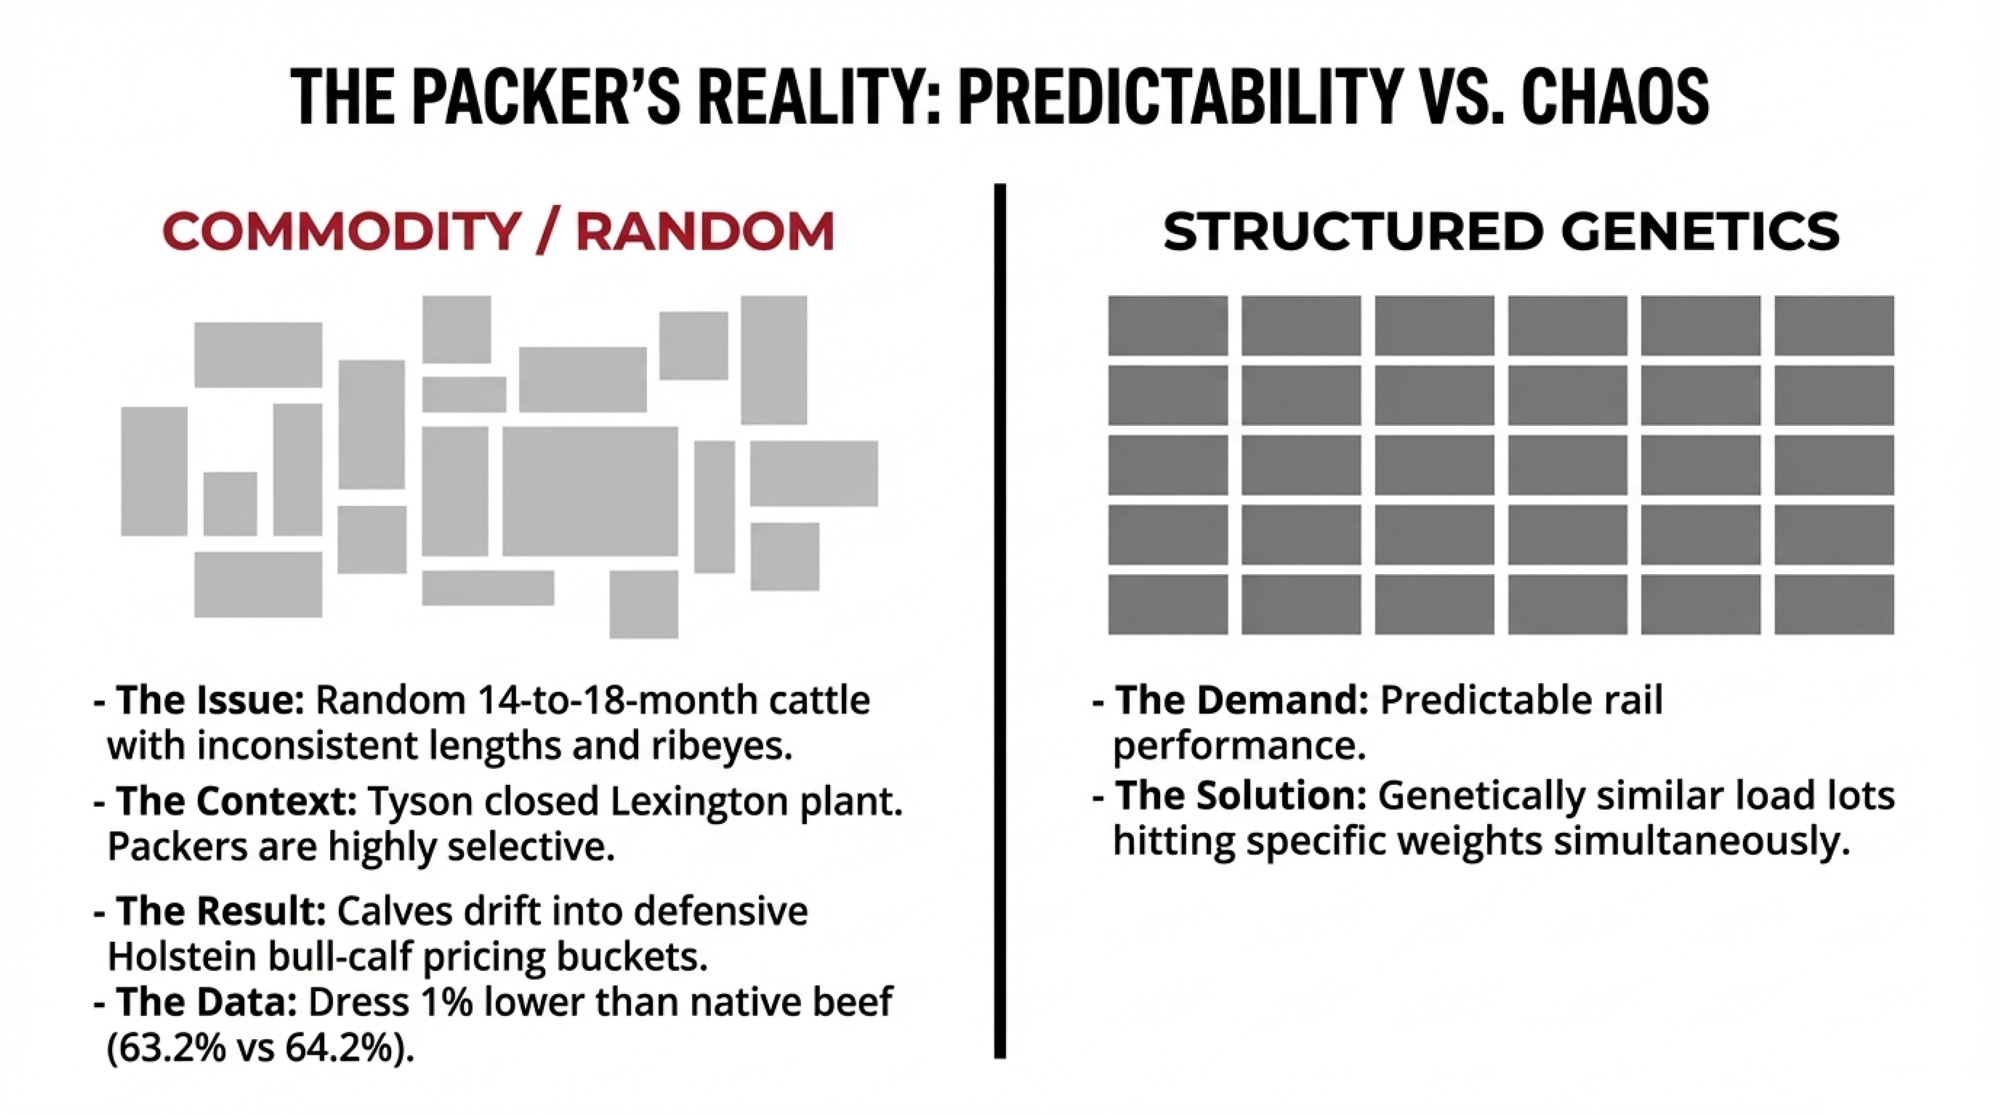
At the other end of the chain, the source analysis cites packers — including JBS — describing carcass conformation on early dairy-beef crosses as inconsistent: too narrow, undersized ribeyes, not enough muscling. Research from Texas Tech (Foraker et al., 2022) found that even well-selected beef × dairy crosses dressed about 1 percentage point lowerthan native beef (63.2% vs. 64.2%, P < 0.01) — and that’s with quality sires. Random or bottom-tier sire selection likely widens that gap further. Anonymous beef-on-dairy calves are drifting into the same pricing bucket Holstein bull calves used to occupy: commodity cattle, priced defensively.
The 500-Cow Showdown: Cheap vs. Disciplined
To make the economics concrete, the Beef-on-Dairy 2.0 analysis runs a modeled 500-cow Holstein herd through identical biological assumptions: 35% annual turnover, 30% 21-day pregnancy rate, and 79% heifer completion rate from birth to freshening.
One bull can reshape a breed’s trajectory over decades. In beef-on-dairy, one wrong sire decision reshapes your cash flow for 30 months. Here’s what that looks like at scale.
| Metric | Path A: “Cheap & Easy” | Path C: “Integrated/Partnered” |
| Semen Cost | $8/straw | $25/straw |
| Annual Semen Spend (Beef) | $4,800 | $12,500 |
| Beef Conception Rate | 48% | 46% |
| Calf Sale Price | $1,150 (at 5–7 days) | $1,550 (at 21 days) |
| Calf Mortality to Sale | 5.0% | 2.5% |
| Beef Calves Sold/Year | ~285 | ~293 |
| Replacement Impact | −$12,900 (15-head deficit) | +$15,000 (surplus heifers sold) |
| Net Annual Income* | $300,050 | $456,650 |
| The Gap | — | +$156,600 |
*Net includes semen cost plus estimated mortality-related rearing losses not separately itemized in the model.
Path A thinks it’s saving $7,700 on semen compared to Path C. It’s actually losing $156,600 in total opportunity — calf price, mortality, documentation premiums, and the avoided cost of buying replacements because the breeding strategy was sloppy. That’s $313 per cow-year. At 500 cows, it’s a tractor payment.
What Happens When 15 Heifers Don’t Show Up?
Path A’s modeled herd doesn’t just lose on calf price. It bleeds replacement heifers. With a 35% cull rate, 79% heifer completion, and beef semen pushed to 60% of the herd, the model shows a 15-heifer annual shortfall — costing $12,900 per year at 2025 market prices to stand still.
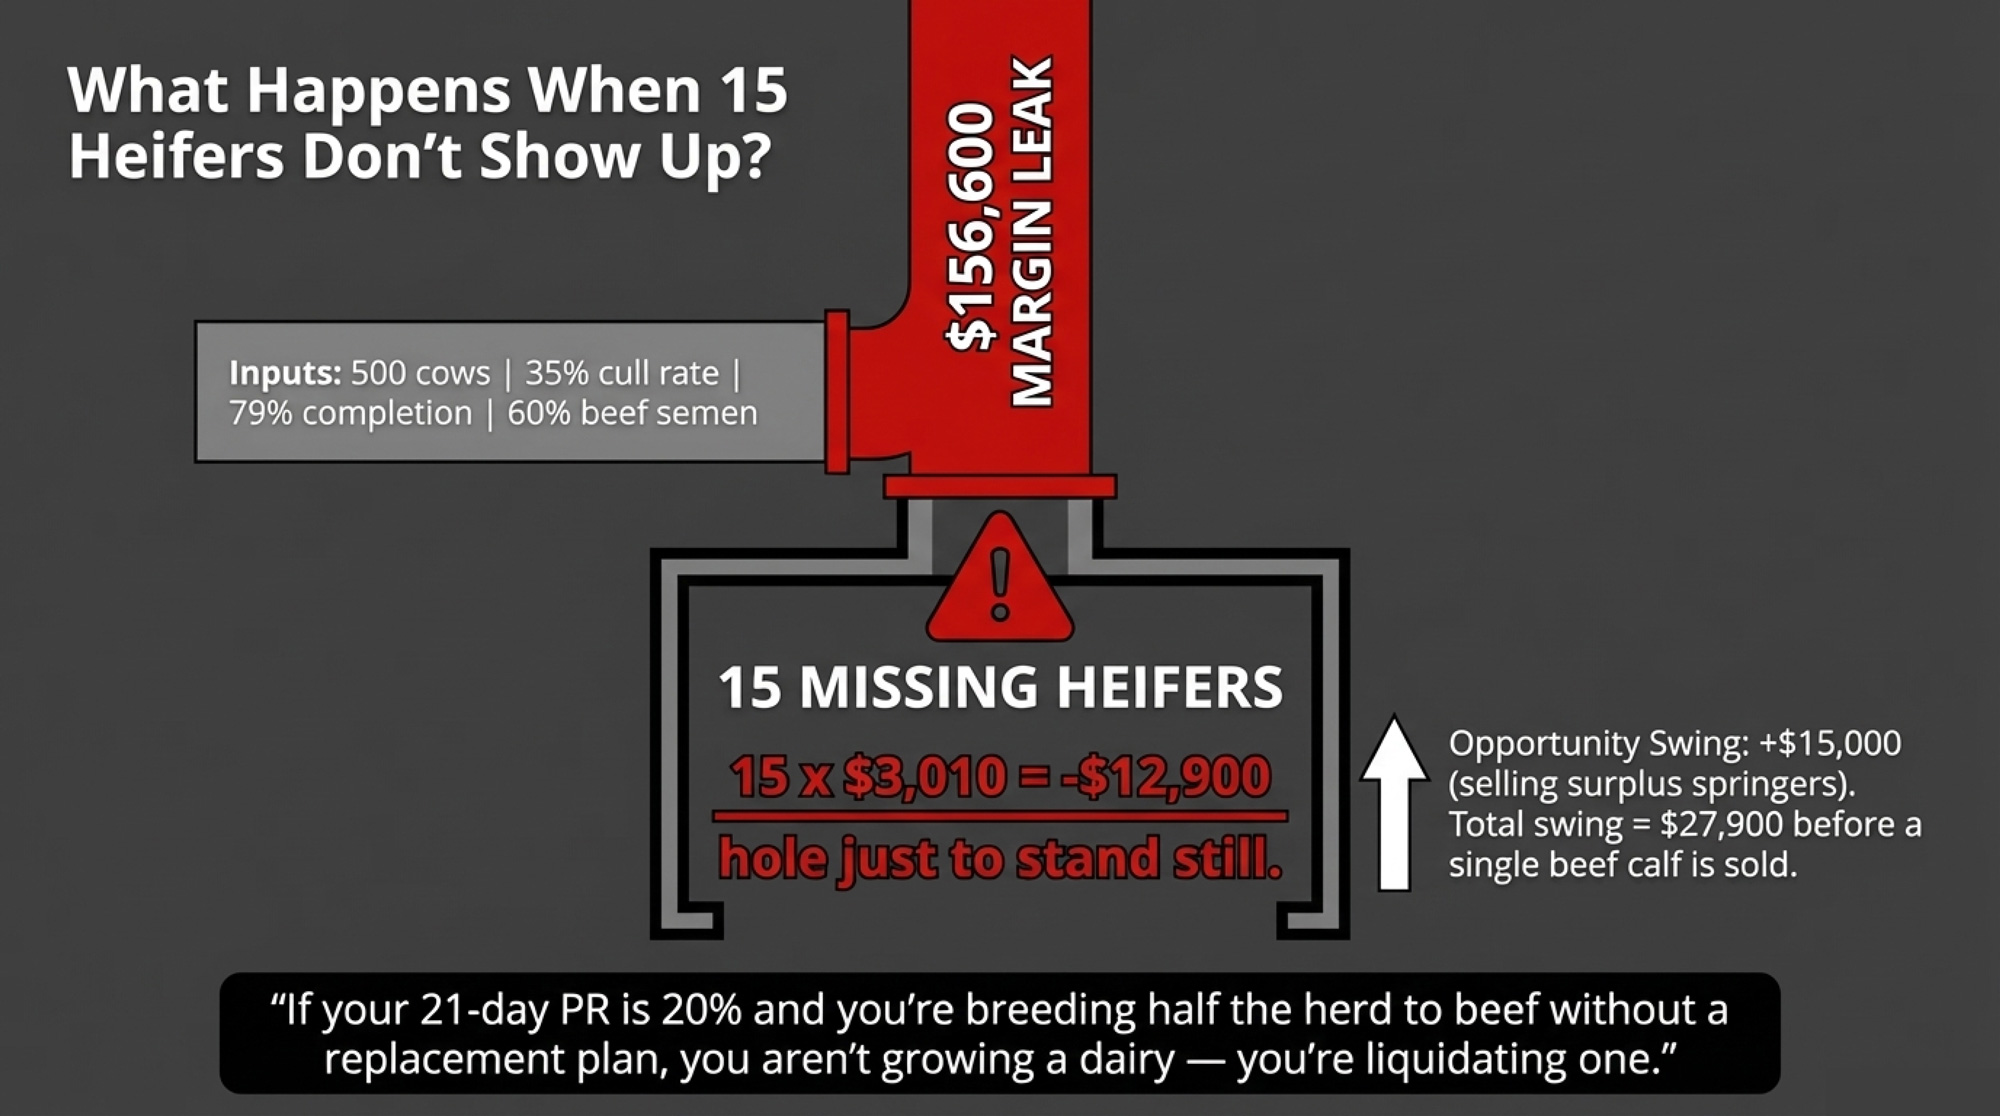
Path C flips that number. Precise use of sexed semen on the top 30% of cows covers all replacement needs and leaves surplus heifers to sell as premium springers — a +$15,000 credit. That’s a $27,900 swing on replacements alonebefore you even talk about what the calves brought at the barn.
And if your actual 21-day PR is sitting closer to 20% instead of 30%? The deficit deepens fast. Your heifer breeding strategy determines how many calves you can afford to send to beef, and a thin PR doesn’t leave room for guessing. The analysis models that scenario bluntly:
“If your 21-day PR is 20% and you’re breeding half the herd to beef without a replacement plan, you aren’t growing a dairy — you’re liquidating one.”
In November 2025, Tyson Foods announced the closure of its Lexington, Nebraska, beef plant — a facility processing about 5,000 head per day, roughly 4.8% of U.S. daily beef slaughter. With capacity coming offline and overall beef production contracting, packers can afford to be selective. They want “predictable rail performance”: load lots of genetically similar cattle that hit specific weights and grades at the same time.
A random mix of whatever beef bull was on sale creates pens that are the opposite — some cattle ready at 14 months, some at 18, with carcasses that don’t match in length, thickness, or ribeye. If you’re selling into that market with undocumented calves from unknown sires, you’re not competing. You’re just filling a spot.
What Are Structured Genetics and Documentation Actually Worth?
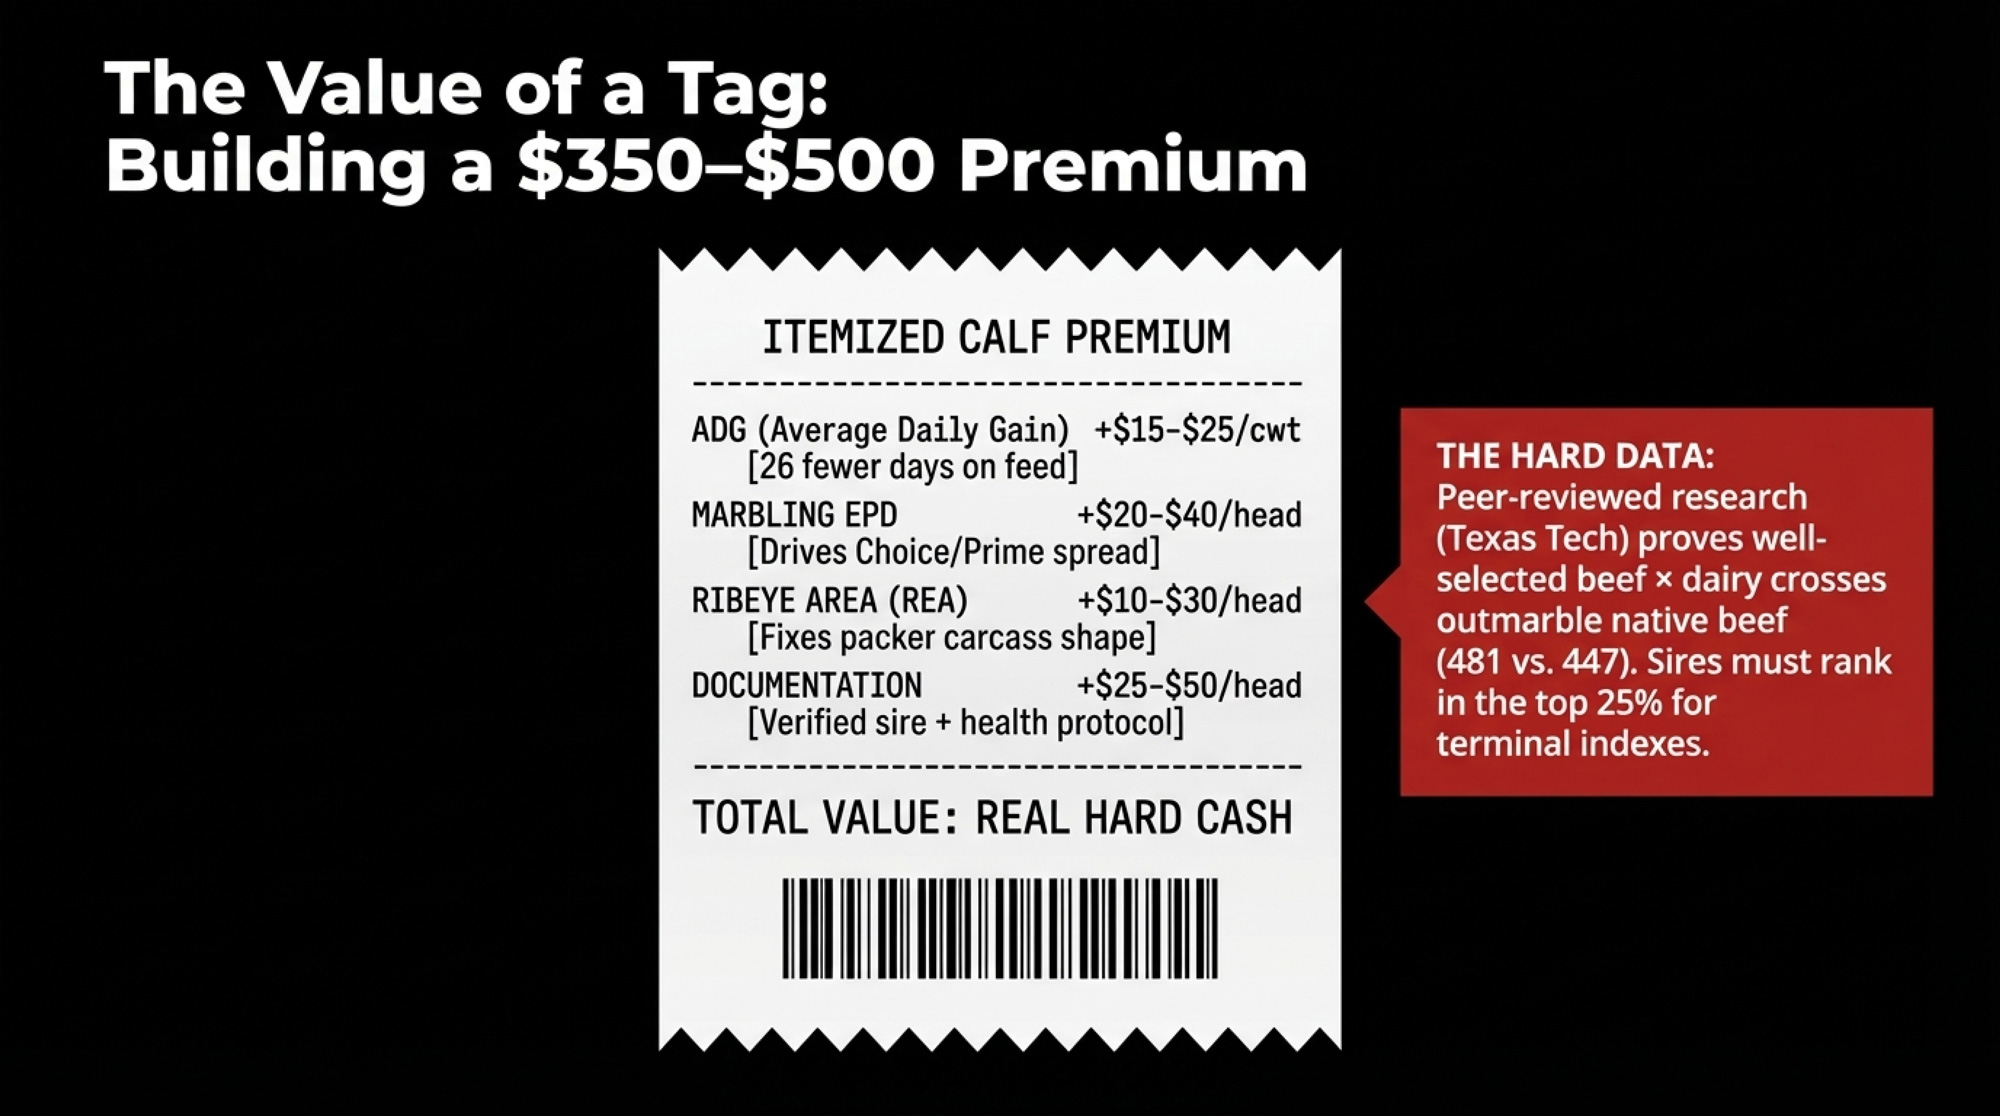
The source analysis breaks down what trait selection and calf documentation mean in buyer bids. These are model-derived estimates, but the direction aligns with independent data — The Bullvine’s own August 2025 reporting confirmed $350–500 per head premiums for documented beef-cross calves over straight Holsteins at Midwest sales. Actual premiums vary by buyer, region, and market conditions:
| Trait | Relevant Index | Premium/Calf (Est.) | Mechanism | Path A Captures? | Path C Captures? |
|---|---|---|---|---|---|
| Average Daily Gain | $AxH, ITI | $90/calf (26 fewer days on feed) | Saves ~$15–25/cwt in yardage costs | ❌ | ✅ |
| Marbling EPD | $AxH, HOLSim | $20–40/head | Drives Choice/Prime vs. Select spread | ❌ | ✅ |
| Ribeye Area (REA) | ITI, HOLSim | $10–30/head | Fixes carcass conformation for packers | ❌ | ✅ |
| Calf Documentation | Any program | $25–50/head | Verified sire + health records cut feedlot risk | ❌ | ✅ |
| Dress % (>63%) | $AxH top 25% | Avoided discount | Prevents Holstein-bull-calf pricing at rail | ❌ | ✅ |
| Total potential premium | — | ~$145–210/calf | vs. commodity Path A pricing | $0 | ~$180 |
The peer-reviewed data backs this up convincingly. In the Foraker et al. (2022) Texas Tech carcass study — 518 beef × dairy, 966 native beef, and 935 Holstein steers — well-selected beef × dairy crosses actually outmarbled native beef(marbling score 481 vs. 447, P < 0.05) while carrying 18% less back fat and 5% more ribeye area than straight Holsteins. Select Sires’ feedyard data tells a similar story: in well-managed yards, beef-on-dairy crosses are hitting more than 60% Prime and Choice.
The chasm between that outcome and the JBS “all over the board” complaint is almost entirely about sire selection and management. The analysis recommends filtering sires by terminal indexes — Angus-on-Holstein ($AxH), Igenity Terminal Index (ITI), or Holstein-Simmental (HOLSim) — using only bulls in the top 25% for carcass merit. If a bull can’t clear that bar, the math says he doesn’t belong in a terminal program even if the semen is free.
Which Path Is Your Herd Actually On?
You don’t have to become Path C overnight. But you need to decide which game you’re playing — especially when margins are already running to the bone.
| Metric | Path A: Cheap & Easy | Path B: Structured Sires | Path C: Integrated/Partnered |
|---|---|---|---|
| Beef sire selection | Random / bottom-tier | Top 25% on $AxH, ITI, or HOLSim | Finisher-specified sires only |
| Semen cost/straw | $8 | ~$15–18 | $25 |
| Annual semen spend | $4,800 | ~$9,000 | $12,500 |
| Calf sale price | $1,150 | ~$1,350 | $1,550 |
| Calf mortality to sale | 5.0% | ~3.5% | 2.5% |
| Documentation standard | None | Basic calf protocol | Full sire ID + health records |
| Replacement impact | −$12,900 (15-hd deficit) | Breakeven | +$15,000 (surplus sold) |
| Net annual income (500 cows) | $300,050 | ~$380,000 | $456,650 |
| Packer relationship | Commodity / spot | Preferred supplier | Named program partner |
| Data feedback loop | None | Internal only | ADG + carcass closeouts returned |
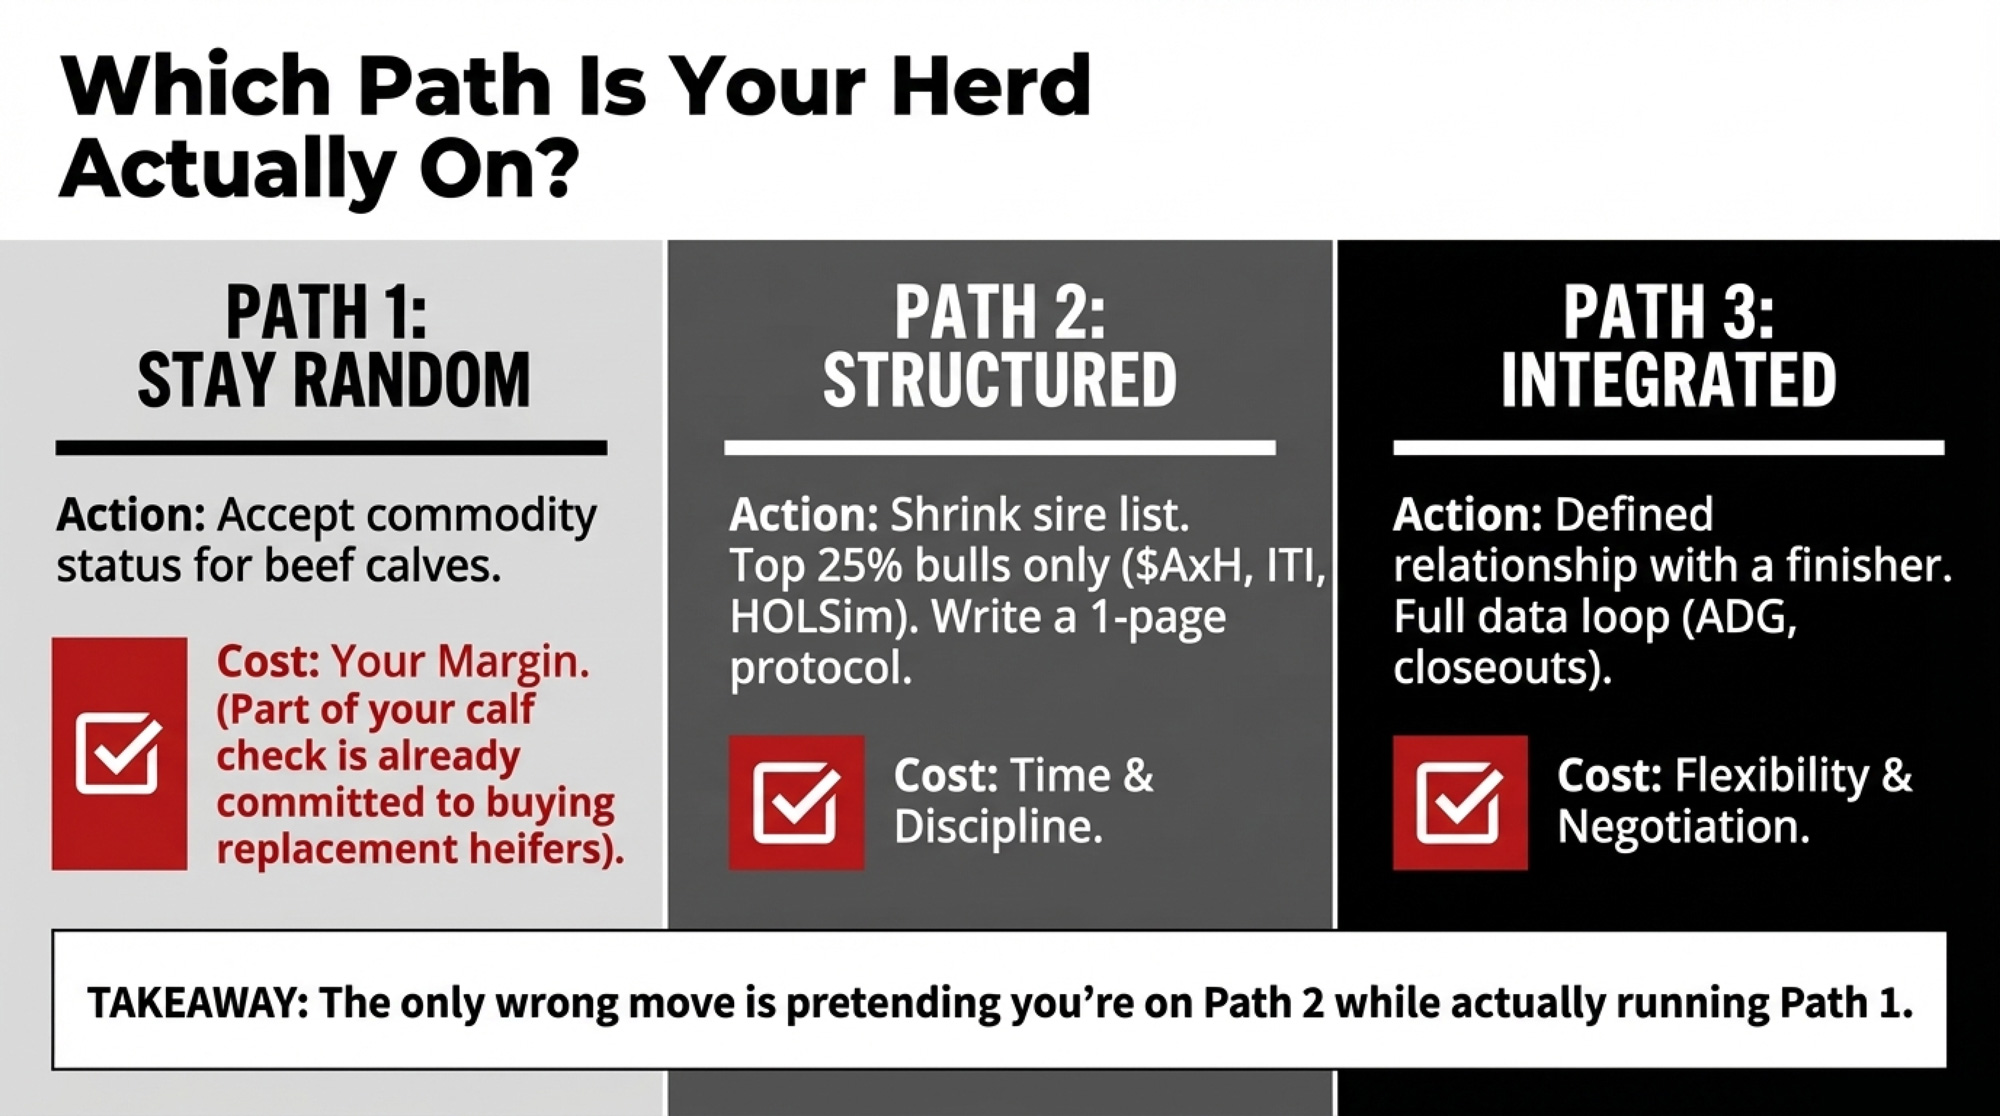
Path 1 — Stay Random, but Own the Trade-Off. You’re putting out bigger fires right now. Fine. Accept commodity status for your beef calves, and understand that part of your “good beef cheque” is already committed to future replacement purchases.
Path 2 — Structured Sires and Protocols (No Integration Yet). Shrink your beef sire list to 2–3 bulls for smaller herds, 3–5 for 500+ cows, all top-quartile on $AxH, ITI, or HOLSim. Write a one-page calf protocol. Use sexed dairy semen on your top 30% until your forward replacement model says you’re covered.
Path 3 — Integrated/Partnered (The Full Margin Engine). A defined relationship with one finisher or branded program. Full documentation on every calf. A data loop where you get ADG, days-on-feed, death loss, and carcass summaries back — and actually adjust sires and protocols based on those closeouts.
Each path has a cost. Path 1 costs you margin. Path 2 costs you time and discipline. Path 3 costs you flexibility and negotiation effort. The only wrong move is pretending you’re on Path 2 while actually running Path 1.
Your 30/90/365-Day Audit Checklist
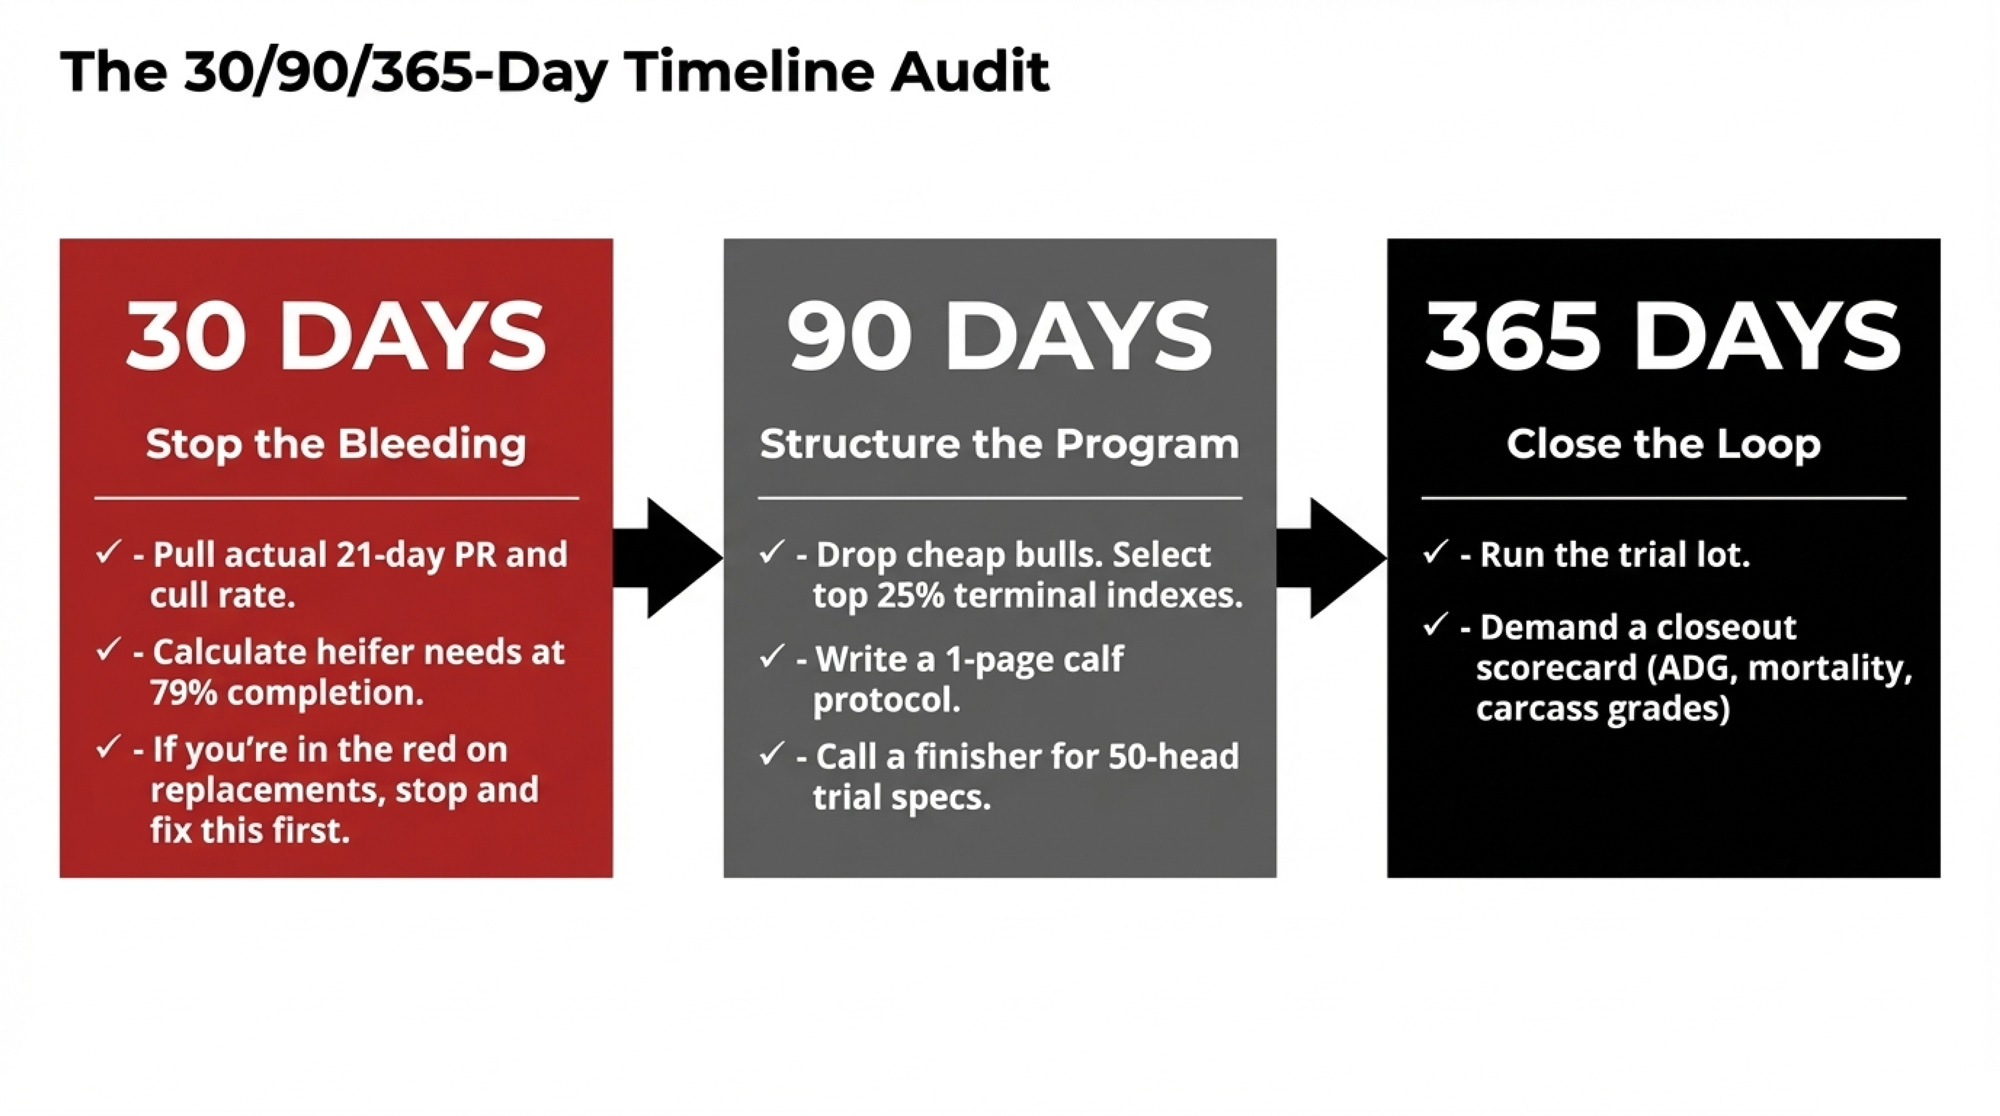
☐ Within 30 Days
- [ ] Pull your last 12 months of cull rate and actual 21-day pregnancy rate — not your target, your real number.
- [ ] Calculate your annual heifer need using a 79% completion rate from birth to freshening at your current herd size.
- [ ] Overlay your current beef semen percentage and model whether you’re headed for surplus, balance, or deficit on a three-year horizon.
- [ ] If the model shows you in the red on replacements, stop and fix that before touching anything else.
☐ Within 90 Days
- [ ] Tighten your beef sire list to the top 25% on a recognized terminal index ($AxH, ITI, or HOLSim). Drop every bull that’s only in the tank because he was cheap.
- [ ] Write a one-page beef-calf protocol: colostrum timing, vaccination schedule, minimum sale age, and weight. Make sure everyone on the team follows it.
- [ ] Call one serious calf buyer or finisher and ask what specs they’d want from a 50–100 head trial lot. You’ll learn more in that conversation than in a year of reading semen catalogues.
☐ Within 365 Days
- [ ] Run at least one group of 50–100 calves through that buyer or program under your tightened sire list and documented protocol.
- [ ] Get a basic closeout: ADG, days-on-feed, mortality, carcass weights/grades. That’s the only real scorecard for whether your genetics and management are earning a premium or just looking like they should.
- [ ] Use those results to decide: commit to full Path C integration, or tighten Path 2 further and shop for a better buyer.
What This Means for Your Operation
- If your 21-day PR is below 25% and your cull rate is above 30%, run your replacement model before you order another tank of beef semen. The deficit might already be there — you just haven’t priced it yet.
- If you can’t name the terminal index ranking of every beef bull in your tank, you’re making a $313-per-cow decision on feel instead of data.
- If you’ve never seen a closeout for calves from your farm, your opinion of their performance is based on what they look like at five days — not what they’re worth at fifteen months.
- The $27,900 replacement swing between Path A and Path C happens before a single calf crosses the sale ring. That’s the hidden lever most operations never model.
- Running the real ROI math — the way Clark Farms did with their creamery — is the only way to know if your beef program is building equity or just moving money around.
Key Takeaways
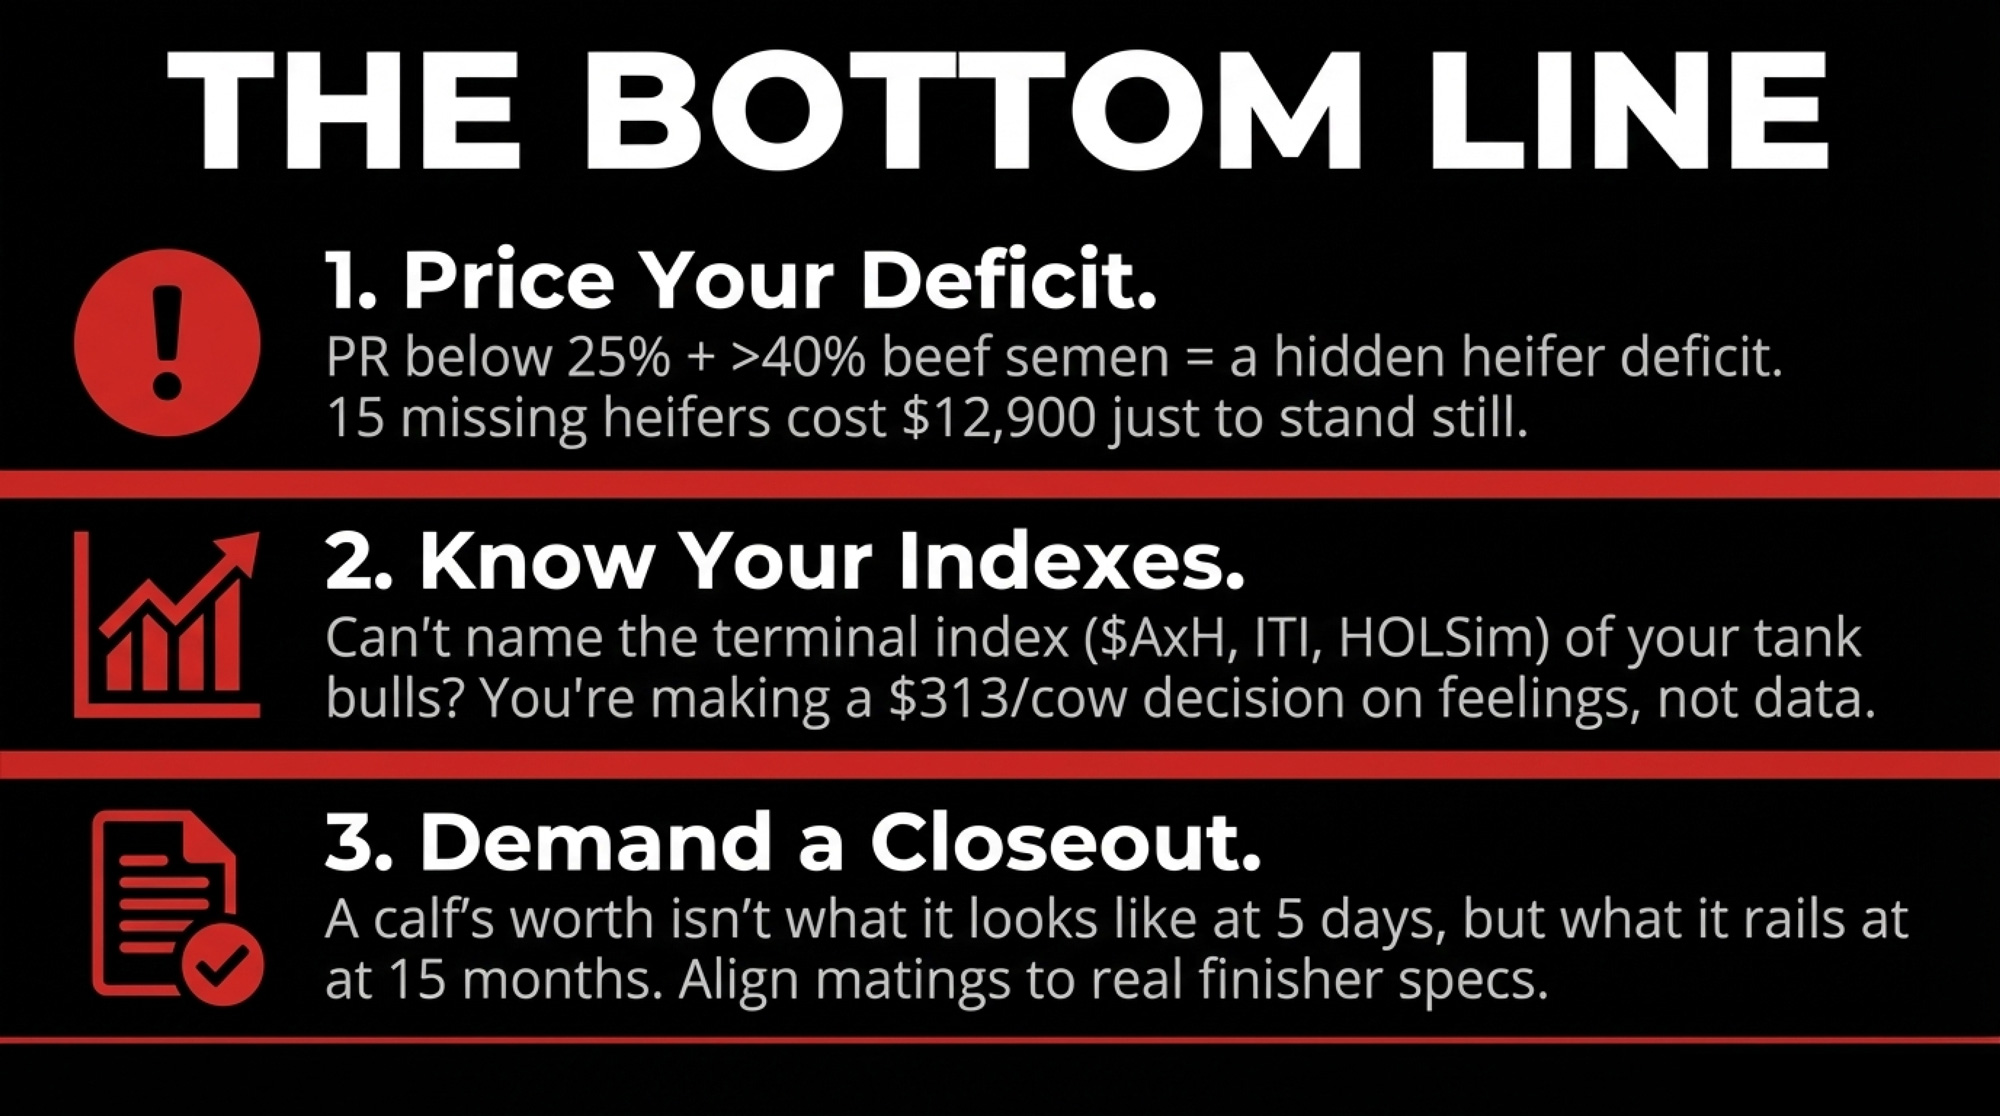
- If your 21-day PR is below 25% and you’re breeding more than 40% to beef, you’re likely already in a heifer deficit you haven’t priced. Run the replacement model before you reorder semen — at $3,010 per head, 15 missing heifers cost $12,900 a year to stand still.
- Drop every beef sire that doesn’t rank in the top 25% on $AxH, ITI, or HOLSim — even free ones. Texas Tech carcass data shows well-selected beef × dairy crosses outmarble native beef at 481 vs. 447. Random-sire crosses are sliding toward commodity pricing.
- Call your top calf buyer this month and ask for their preferred sire list. If they can’t give you one, they’re a middleman. Aligning 80% of your beef matings to a real finisher’s specs is the fastest path from $1,150 calves to $1,550 calves.
- The $27,900 replacement swing between a cheap beef strategy and a disciplined one happens before a single calf crosses the sale ring. Your heifer pipeline — not your calf cheque — is the lever most operations never model.
The Bottom Line
Don’t wait for your next replacement bill to find out you’re in the red. Start your 30-day audit today — pull your real PR, your real cull rate, and your real beef semen percentage. Put them on paper. If the numbers look more like Path A than Path C, that $156,600 gap isn’t a hypothetical. It’s the margin you’re leaving on someone else’s table.
Complete references and supporting documentation are available upon request by contacting the editorial team at editor@thebullvine.com.
Learn More
- Beef-on-Dairy’s $500,000 Swing: What 72% of Farms Know That’s Costing You $1,000/Cow Every Year – Optimized operations capture a $500-per-calf premium while laggards leave money on the table. This guide delivers a Monday-morning blueprint to fix your pregnancy rate and flip your breeding budget from a cost into a $500,000 annual swing.
- $3,010 Per Heifer. 800,000 Short. Your Beef-on-Dairy Bill Is Due. – Exposes the structural 800,000-head heifer deficit that is locking in high replacement costs through 2027. This analysis arms you with the market intelligence to navigate $4,000 price tags and secure processor partnerships before the supply window closes.
- The Next Frontier: What’s Really Coming for Dairy Cattle Breeding (2025-2030) – Reveals the high-accuracy genomic breakthroughs and AI markers that will redefine herd value by 2030. This feature breaks down how advancements in casein selection and disease resistance can transform your breeding program into a high-margin protein factory.
 The Sunday Read Dairy Professionals Don’t Skip.
 The Sunday Read Dairy Professionals Don’t Skip.
Every week, thousands of producers, breeders, and industry insiders open Bullvine Weekly for genetics insights, market shifts, and profit strategies they won’t find anywhere else. One email. Five minutes. Smarter decisions all week.