


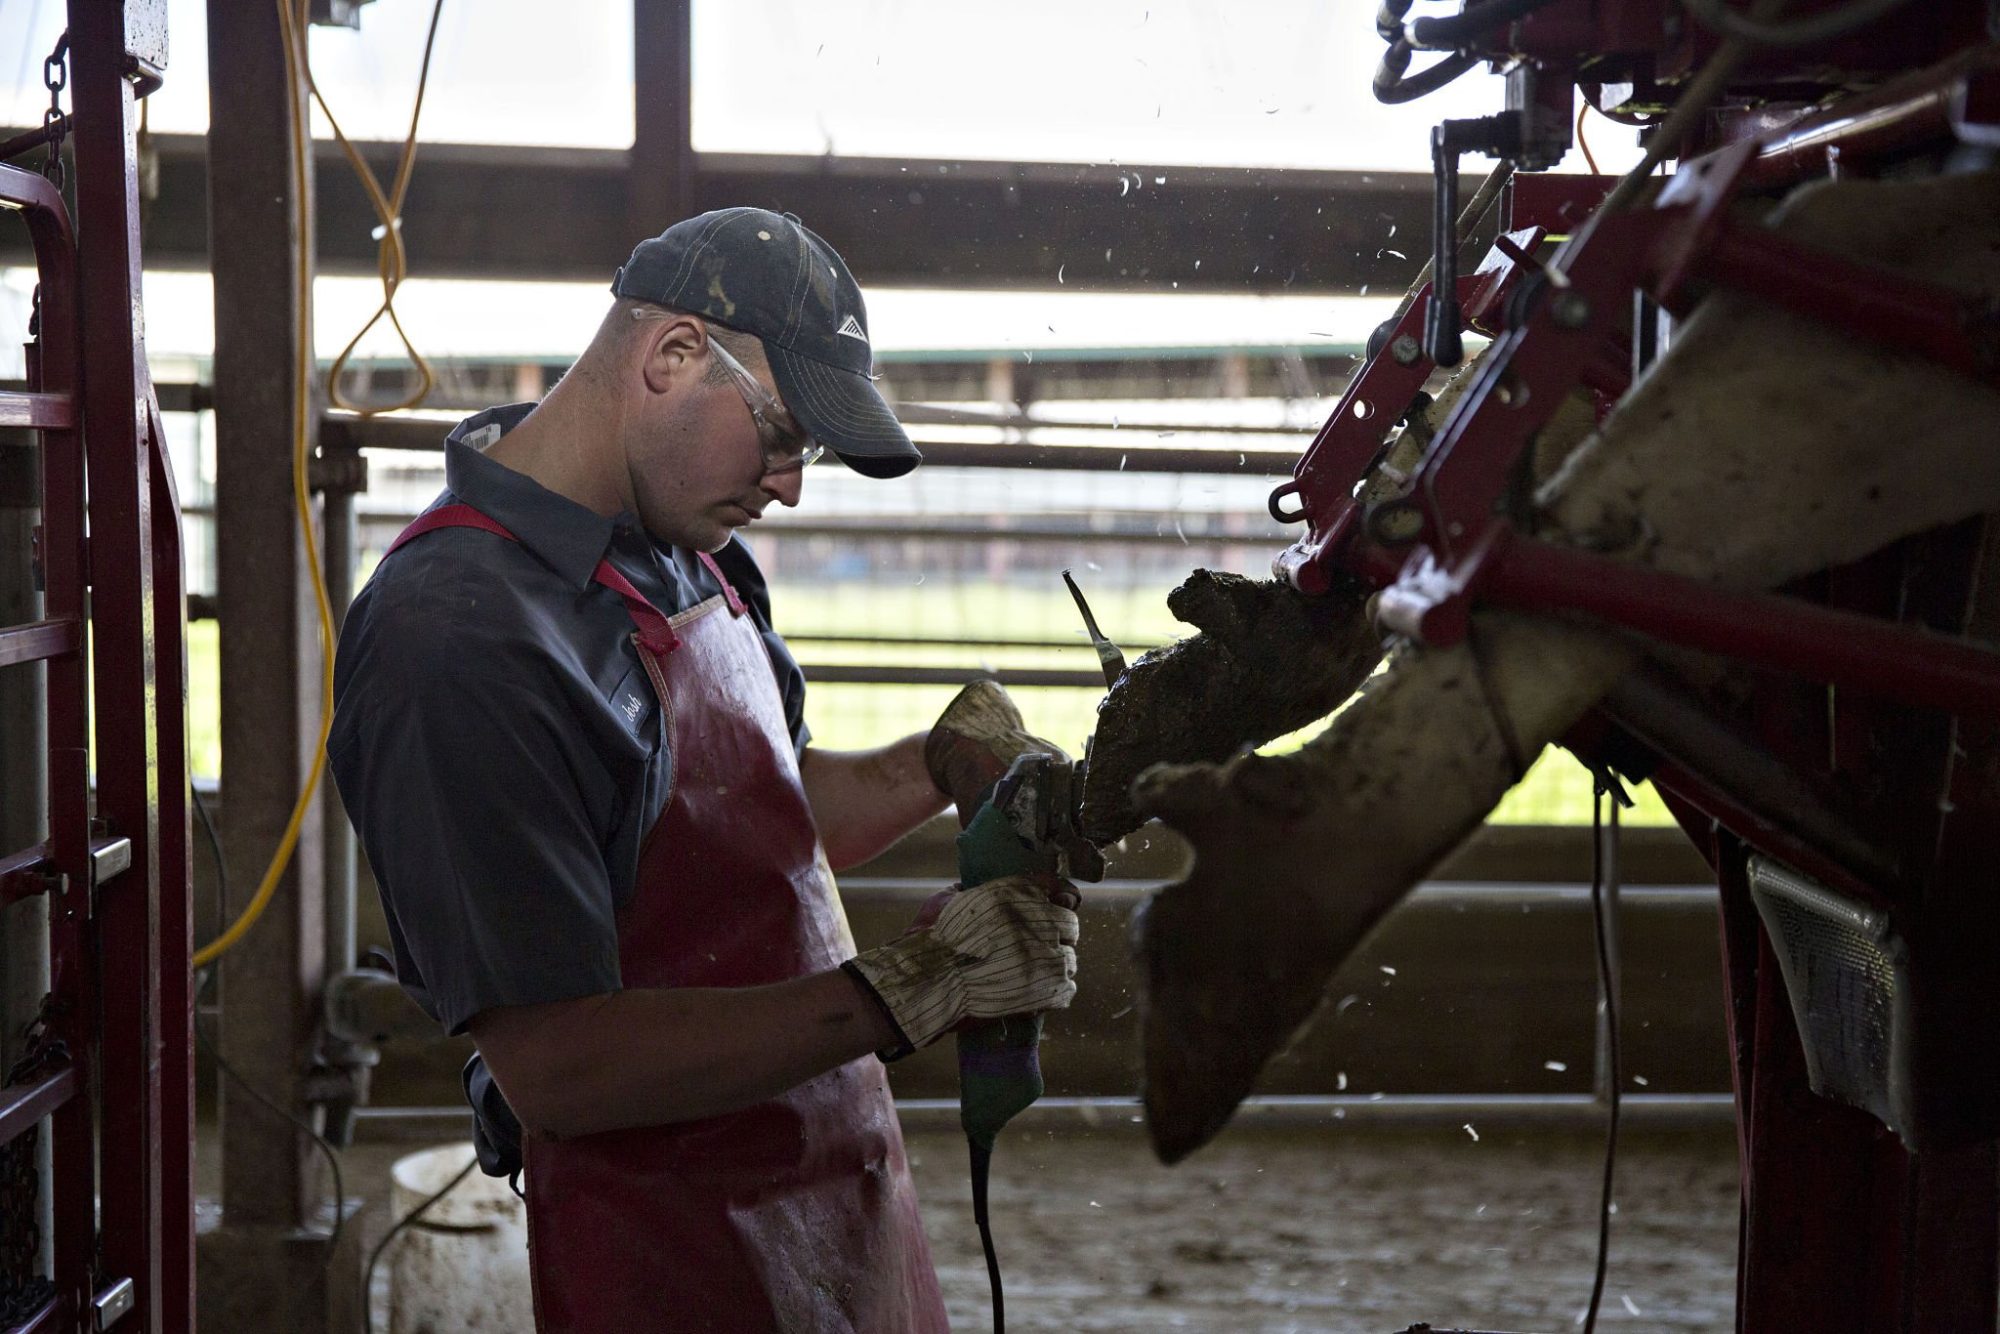
Your herd doesn’t have to be a train wreck to bleed money. ‘Average’ lameness is a $40,000 ration problem in a lot of freestall barns.
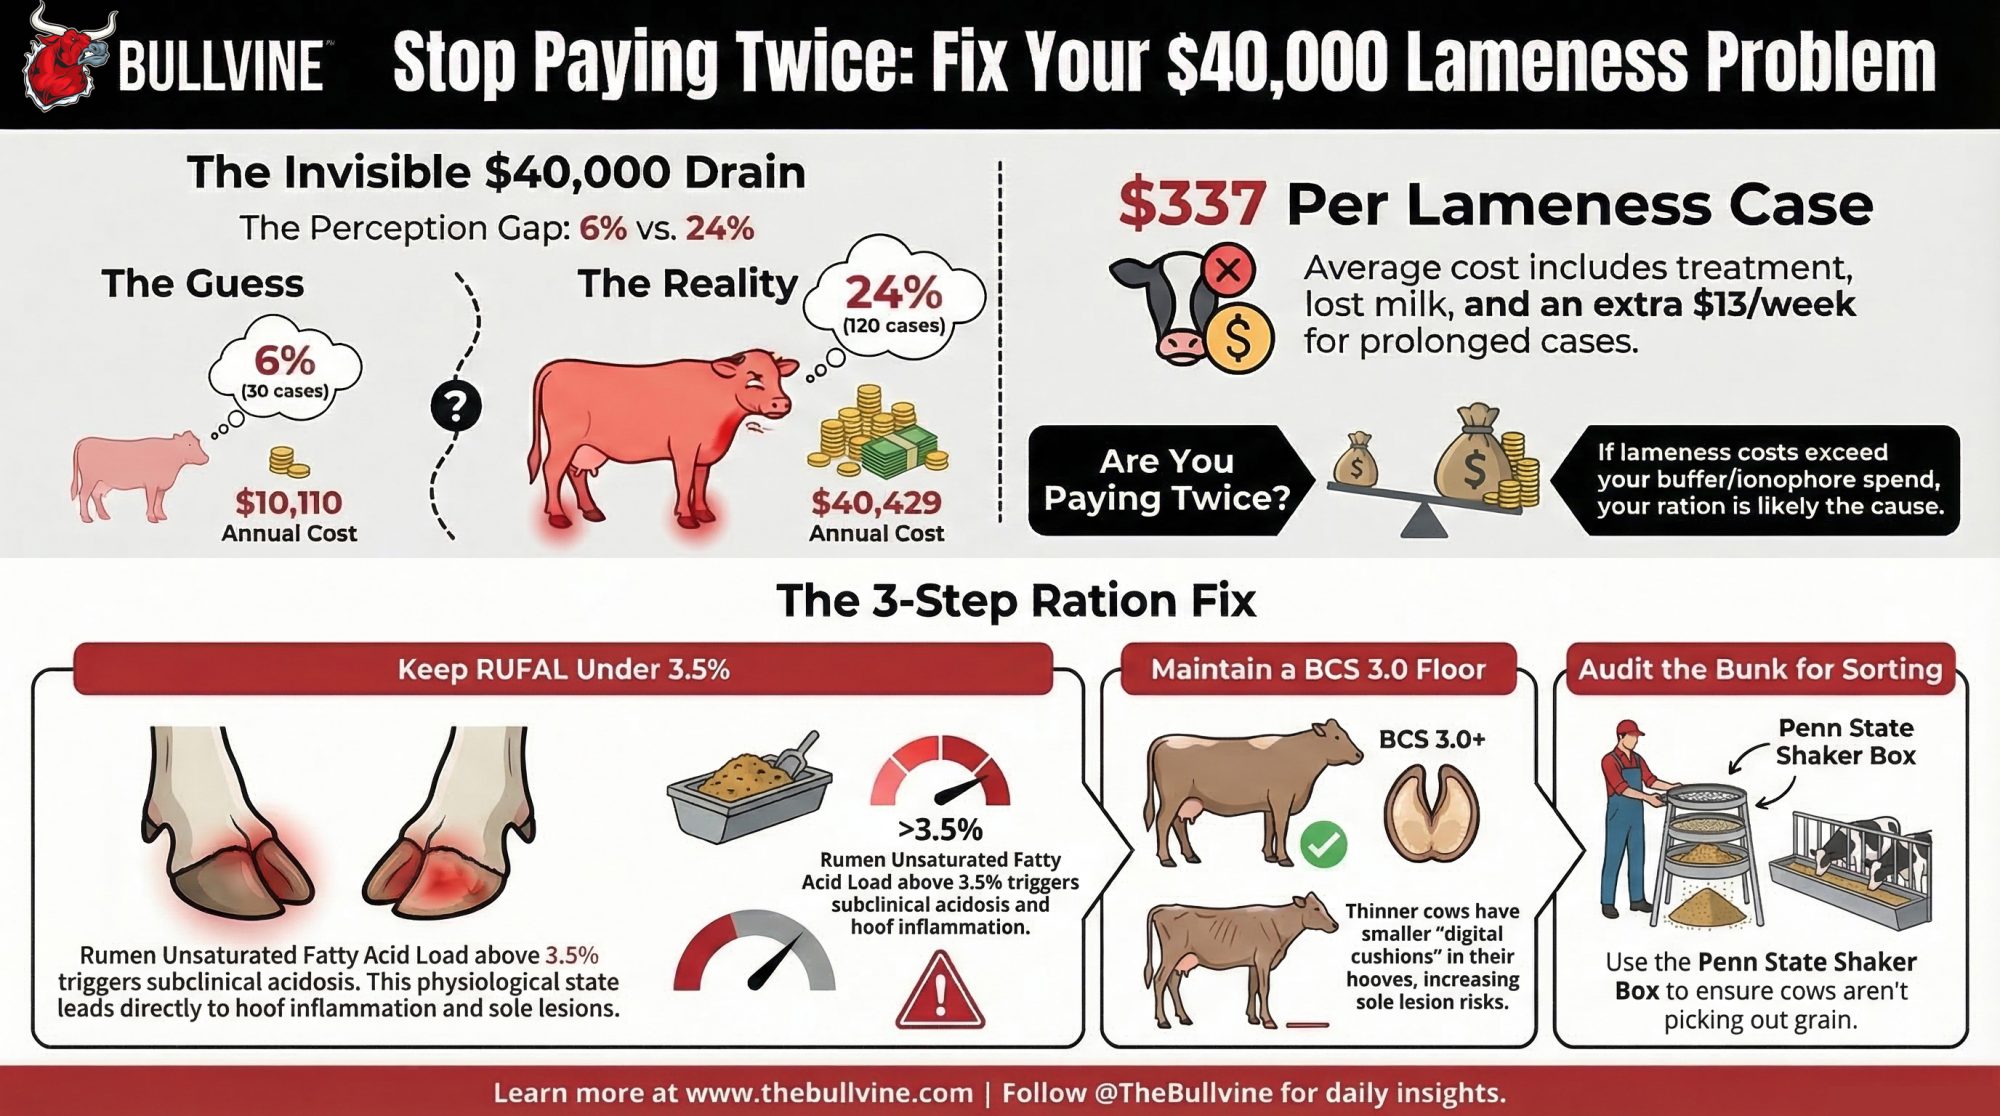
Executive Summary: Many freestall herds guess lameness at 5–7%, but proper scoring often lands closer to 20–25%, turning “normal” into a roughly $40,000‑a‑year problem at about $337 per case. Using the Robcis 2023 cost model and recent lameness research, this article walks through a composite 500‑cow herd in which one RUFAL audit traced that hidden bill back to the ration rather than just the trim chute. A high RUFAL (over about 3.5% of DM) quietly drives more subclinical acidosis, thinner digital cushions, and extra claw horn lesions — especially when low‑BCS dry cows and TMR sorting pile on. By pulling RUFAL down, enforcing a BCS 3.0 floor at calving, and tightening sorting with the Penn State shaker box, that herd cut lameness from 24 to under 18 cases per 100 cows and avoided roughly $10,000 a year in lameness cost. The 30‑Day Lameness Audit and “Paying Twice” Calculator give you a simple way to put your buffer bill, lameness bill, and ration risk on one page. If your own math shows lameness costs bigger than your buffer spend, it’s a strong signal your ration and dry‑cow program — not your hoof trimmer — are the first place to go to work.
Nearly one in four dairy cows in freestall herds worldwide is lame right now — and most owners think their number is under 7%. A 2025 Journal of Dairy Science meta-analysis by Wessels et al. estimates a median lameness prevalence of 29.5% across studies. A 2023 Journal of Dairy Science bioeconomic model by Robcis et al. puts the average cost at €307.50 ($336.91 USD) per case, with digital dermatitis cases roughly $92 more expensive and an extra $13.26 tacked on for every additional week a cow stays lame.
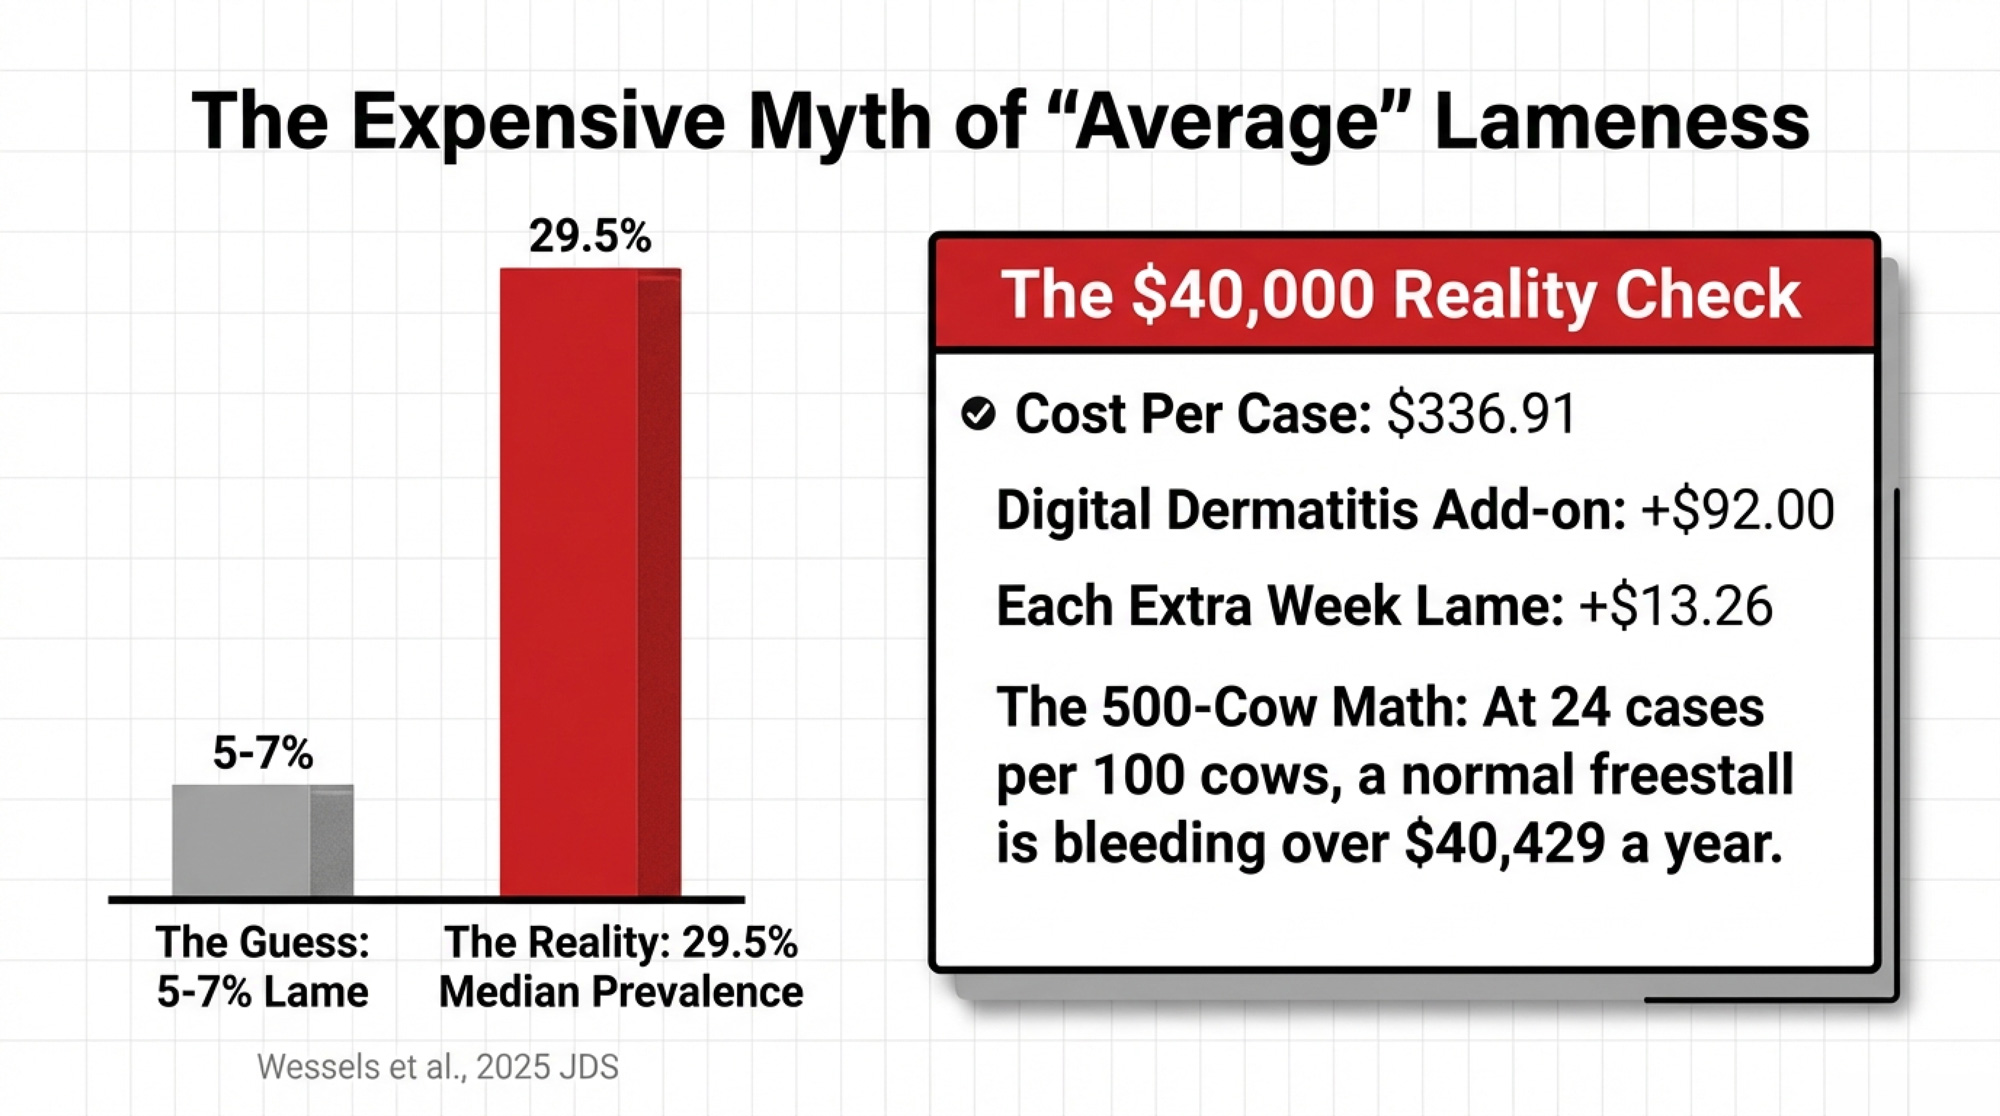
Those two numbers collided on a 500-cow North American freestall operation when the owner put the annual trim-chute costs and the sodium bicarbonate invoice on the same spreadsheet for the first time. What he found: the herd was spending over $40,000 a year on lame cows and another $25,000–35,000 buffering a ration that kept breaking hooves. He wasn’t running a bad dairy. He was running an average one. And the average was expensive.
What follows is a composite management case built from 2023–2025 lameness research and field data. No single farm is named — but the numbers, the patterns, and the ration problems are real.
“We Thought We Were at 6%.”
If you’ve ever guessed your herd’s lameness prevalence before a welfare audit, you already know this part. Someone says five percent. Maybe six. You picture the obvious head-bobbers and move on.
That’s what happened here. The owner and herd manager settled on “six or seven percent.” Then they brought in locomotion scoring — the three-point system (1 = sound, 3 = arched back with shorter stride and head bob, 5 = clearly favoring one or more hooves). Over two sessions, an outside vet scored every cow in the herd. The number wasn’t 6%. It was just under 24%.
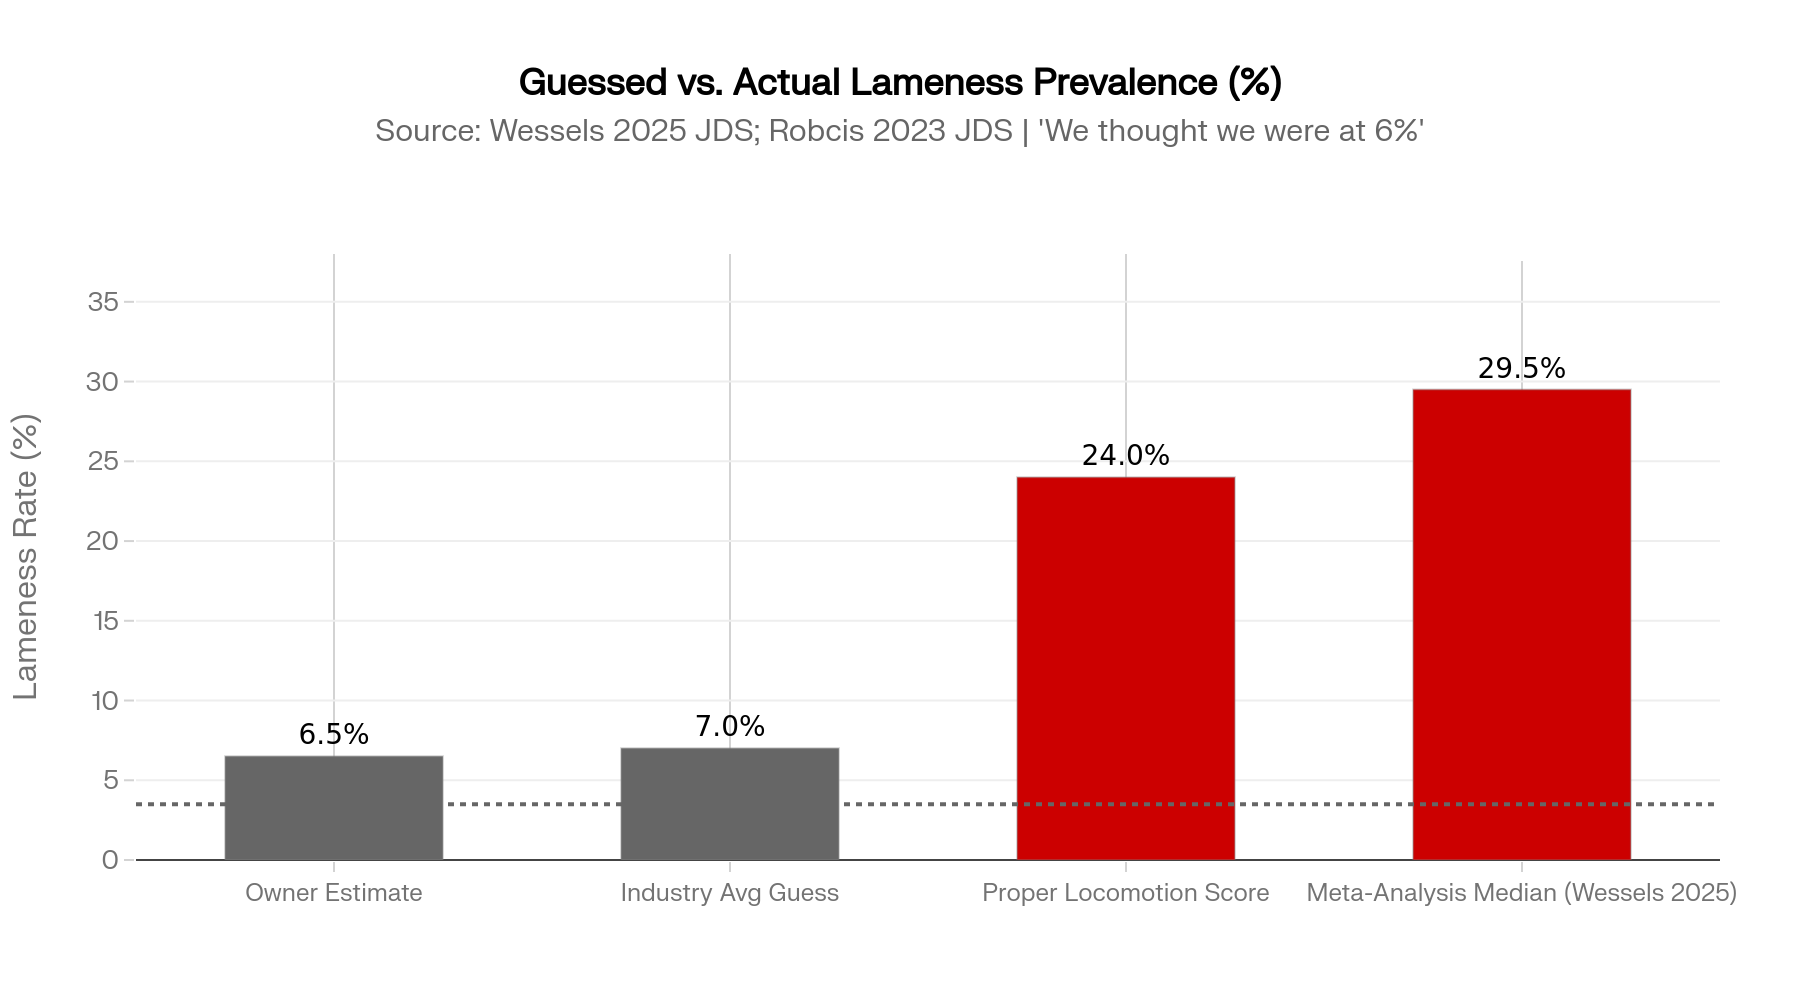
The perception gap isn’t unique to this farm. A 2019 review in Animals (Salgado et al., doi:10.3390/ani9050270) found that farmers consistently underestimate lameness prevalence compared to trained scorers — often by a factor of two to four. Put that gap beside the Robcis cost model, and “six percent” starts to look like an expensive myth.
Two hard questions came out of that scoring session: What in our system is actually creating lame cows? And how much are we spending to manage the damage rather than prevent it?
The ration sheet had the first answer.
What Is RUFAL — and Why Is 3.5% the Line?
The cows were milking well. Components looked good. Total dietary fat didn’t seem extreme. But when the herd nutritionist ran the numbers through AMTS — one of the ration-balancing platforms that calculates RUFAL (NDS and CPM Dairy do too, though display units may differ between grams per day and percent of DM) — the story shifted.
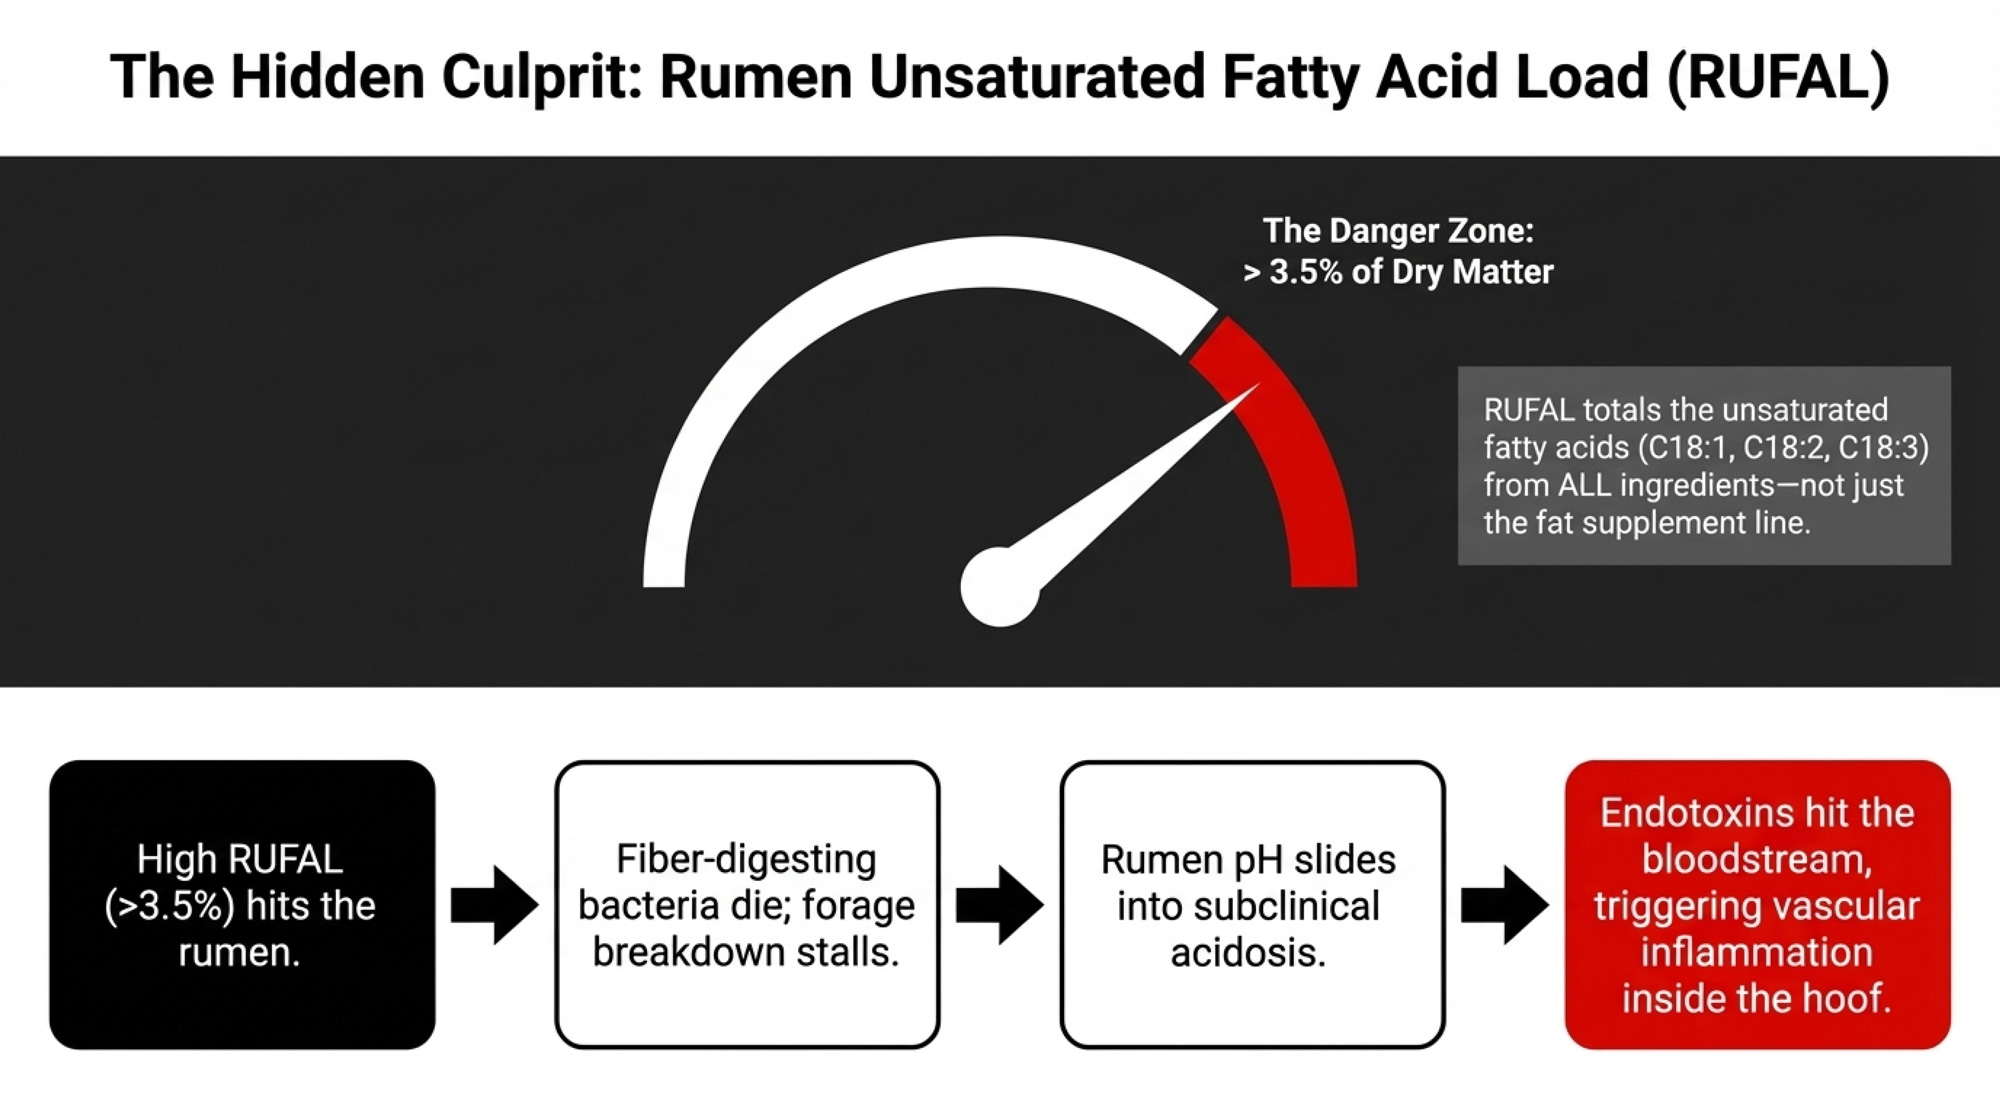
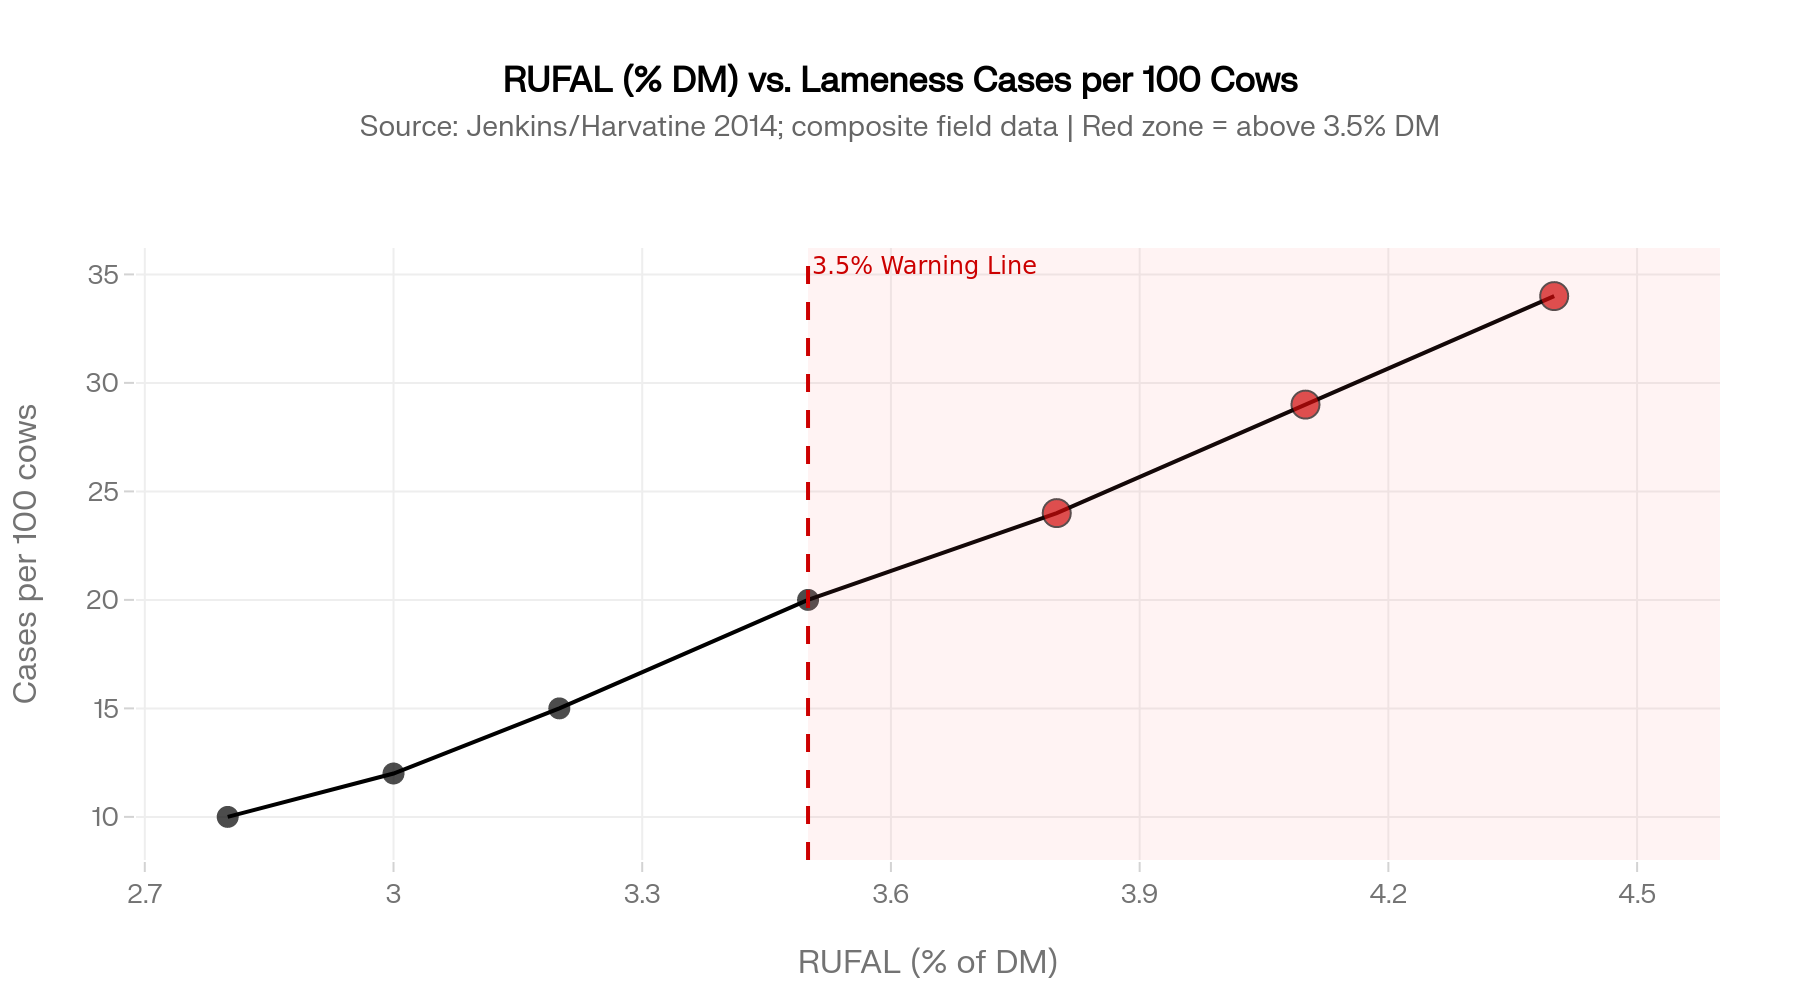
RUFAL — Rumen Unsaturated Fatty Acid Load — totals the unsaturated C18:1, C18:2, and C18:3 fatty acids entering the rumen from all ingredients: corn silage, high-moisture corn, DDGS, whole or extruded soybeans, vegetable oils — not just the “fat supplement” line. Dr. Tom Jenkins at Clemson University developed the concept. On this herd, the number came back at about 3.8% of the ration DM.
As Jenkins summarized in a 2013 presentation and later with Harvatine in 2014, values below about 3.5% of DM are viewed as lower-risk fat intakes, while those above 3.5% indicate fatty acid loads that “may be at risk of being too high.” That’s not a hard clinical cutoff — it’s a red-flag level at which rumen fat load warrants closer scrutiny.
Above 3.5% RUFAL, fiber-digesting bacteria take the hit first. Forage doesn’t break down as it should. Rumen pH slides toward subclinical acidosis more often, especially when cows sort and slug-feed. And it changes the mix of volatile fatty acids and endotoxins hitting the bloodstream — some of which are linked to vascular changes and inflammation inside the hoof.
RUFAL Cheat Sheet: What Pushes It Up and What Doesn’t
| Ingredient | RUFAL Impact | Approx. C18 UFA (% EE) | Risk Level at Typical Inclusion |
|---|---|---|---|
| Soybean oil / corn oil (free liquid) | Very High | ~85–90% | 🔴 High — small additions move RUFAL sharply |
| Corn DDGS (full fat, 10–12% EE) | High | ~60–65% | 🔴 High — linoleic acid rapidly rumen-available |
| Whole / extruded soybeans | High | ~55–60% | 🔴 High — extrusion makes oil fully rumen-active |
| Corn silage (high-oil hybrids) | Moderate-High | ~45–55% | 🟡 Moderate — adds up fast at 55–65% ration DM |
| High-moisture corn | Moderate | ~40–50% | 🟡 Moderate — germ oil more available than dry corn |
| Grass / legume forages | Low-Moderate | ~35–45% | 🟢 Lower — fat mostly intact in cell structure |
| Calcium salts of palm FA (e.g., Megalac) | Low | ~5–10% C18 | 🟢 Low — bypass rumen; mostly saturated |
| Hydrogenated tallow / prilled fat | Very Low | ~2–5% C18 | 🟢 Very Low — saturated, rumen-inert |
| C16:0 palmitic acid supplements | None | 0% (C16, not C18) | 🟢 None — not counted in RUFAL calculation |
When the Buffer Bill and the Lameness Bill Look the Same
The herd nutritionist stared at the RUFAL printout. Then she pulled up the annual bicarb and monensin invoices.
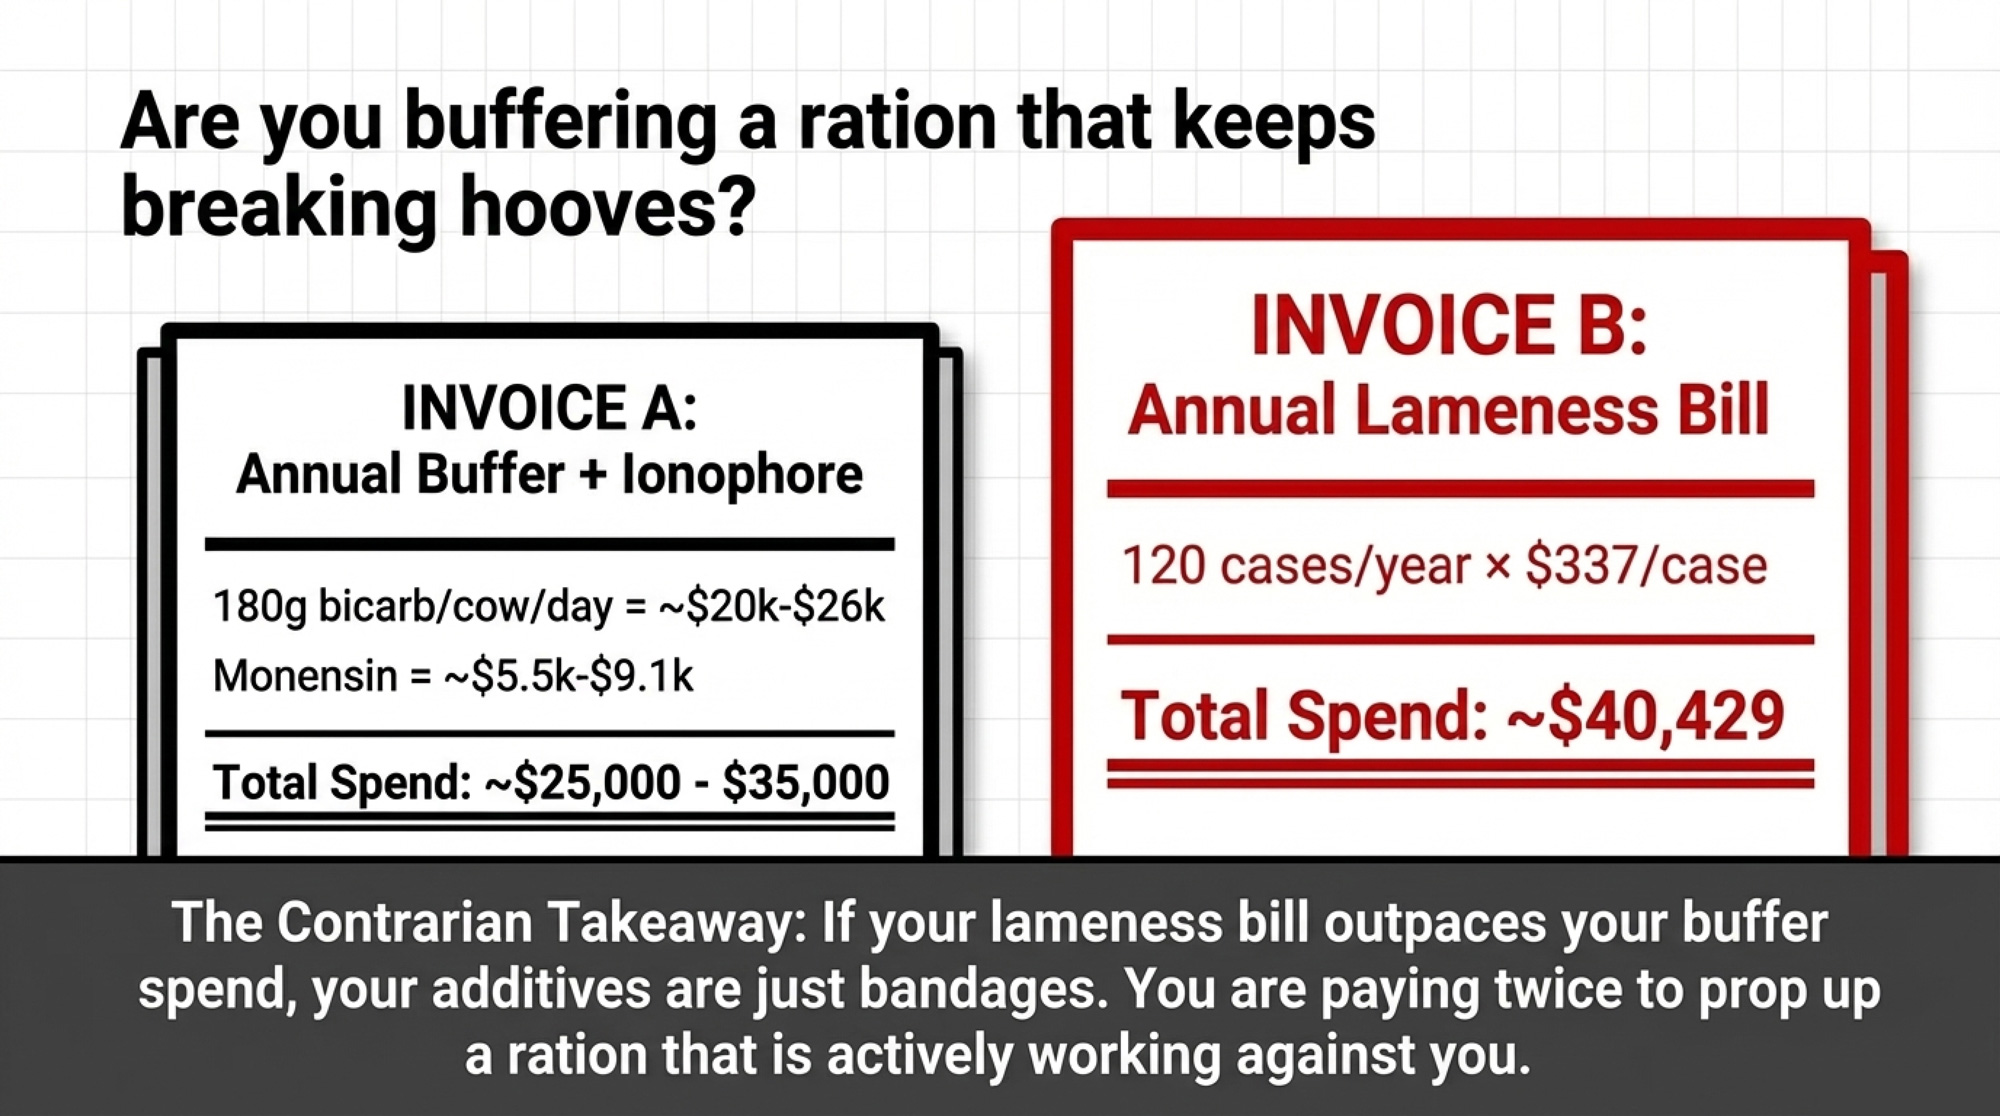
Buffer + ionophore spend (illustrative field math):
- 24 kg DM/cow/day × 0.75% sodium bicarbonate = 180 g bicarb per cow per day.
- At $0.60–0.80/kg feed-grade bicarb: roughly $0.11–0.14 per cow per day.
- 500 cows × 365 days: approximately $20,000–26,000/year on bicarb.
- Monensin at $0.03–0.05/cow/day adds roughly $5,500–9,100/year.
- Combined: roughly $25,000–35,000 annually.
Lameness bill:
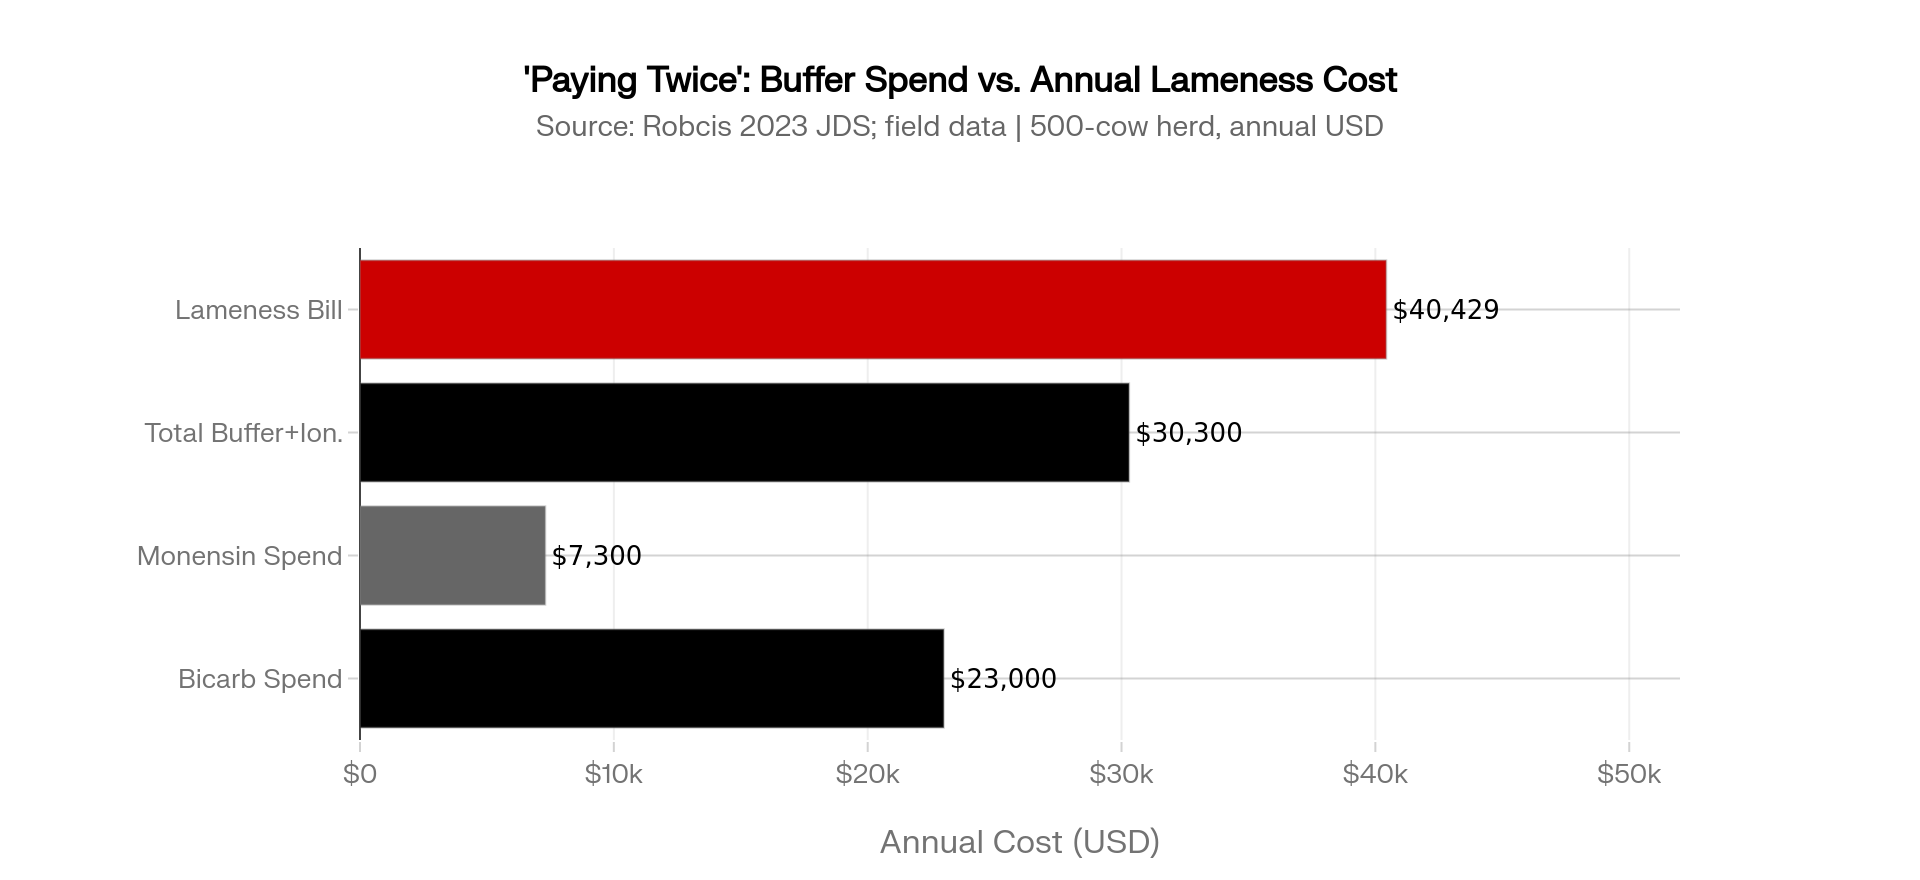
- 120 cases/year (24 per 100 cows) × $336.91 per case = approximately $40,429 on the Robcis model.
They weren’t wrong to use buffers and monensin. But here’s the decision frame that changed the conversation: If your RUFAL is below 3.5% and you’re still seeing subclinical acidosis, the buffer is doing its job. If RUFAL is above 3.5%, the buffer is a bandage — fix the ration first.
This herd was paying twice. Once to keep a high-RUFAL ration from falling over, and again when the system still generated enough lame cows to cost $40,000 a year.
📊 The “Paying Twice” Calculator
Cost A — Annual Buffer + Ionophore Spend
(Bicarb kg/cow/day × price/kg × 365 × herd size) + (monensin cost/cow/day × 365 × herd size)
Cost B — Annual Lameness Bill
(Total lameness cases in 12 months) × $337
If Cost B > Cost A, your ration may be working against you despite the additives propping it up.
This herd: Cost A ≈ $30,000. Cost B ≈ $40,429. Gap: over $10,000.
What Were the Thin Dry Cows Telling Them?
The next uncomfortable meeting wasn’t at the mixer. It was in the dry-cow pen.
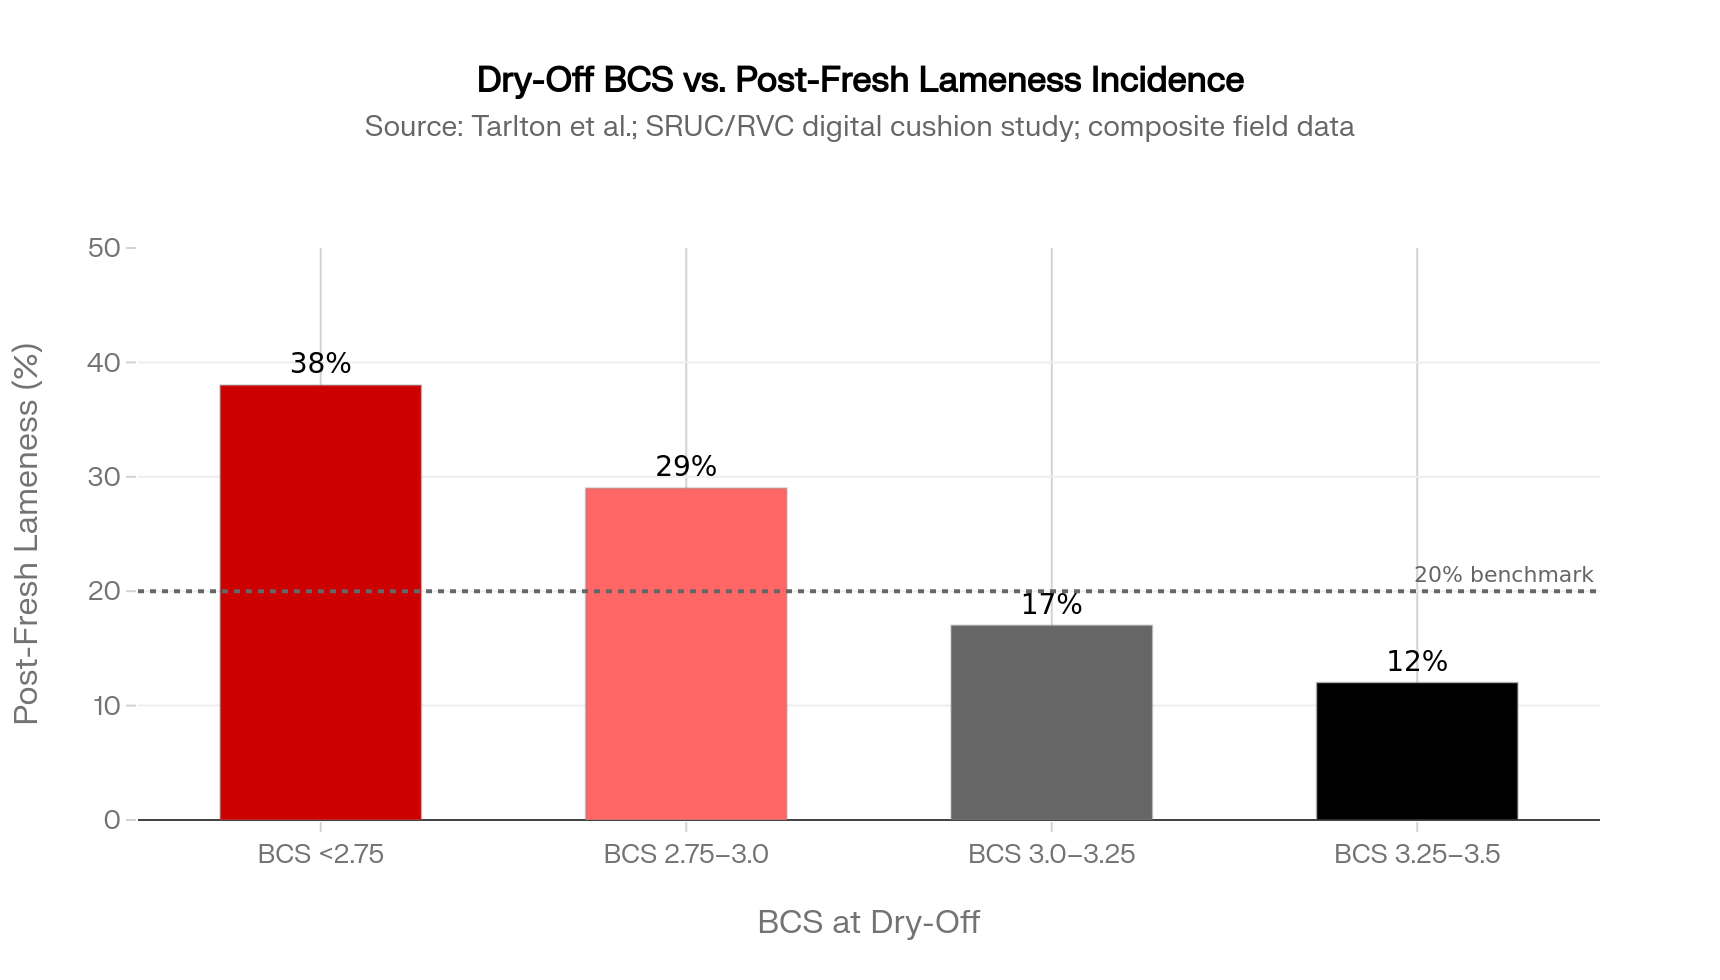
When they pulled BCS scores, a pattern jumped out: too many cows were drying off below BCS 3.0, and first-lactation heifers were often closer to 2.5–2.75. Those same animals kept reappearing in the trim chute after freshening.
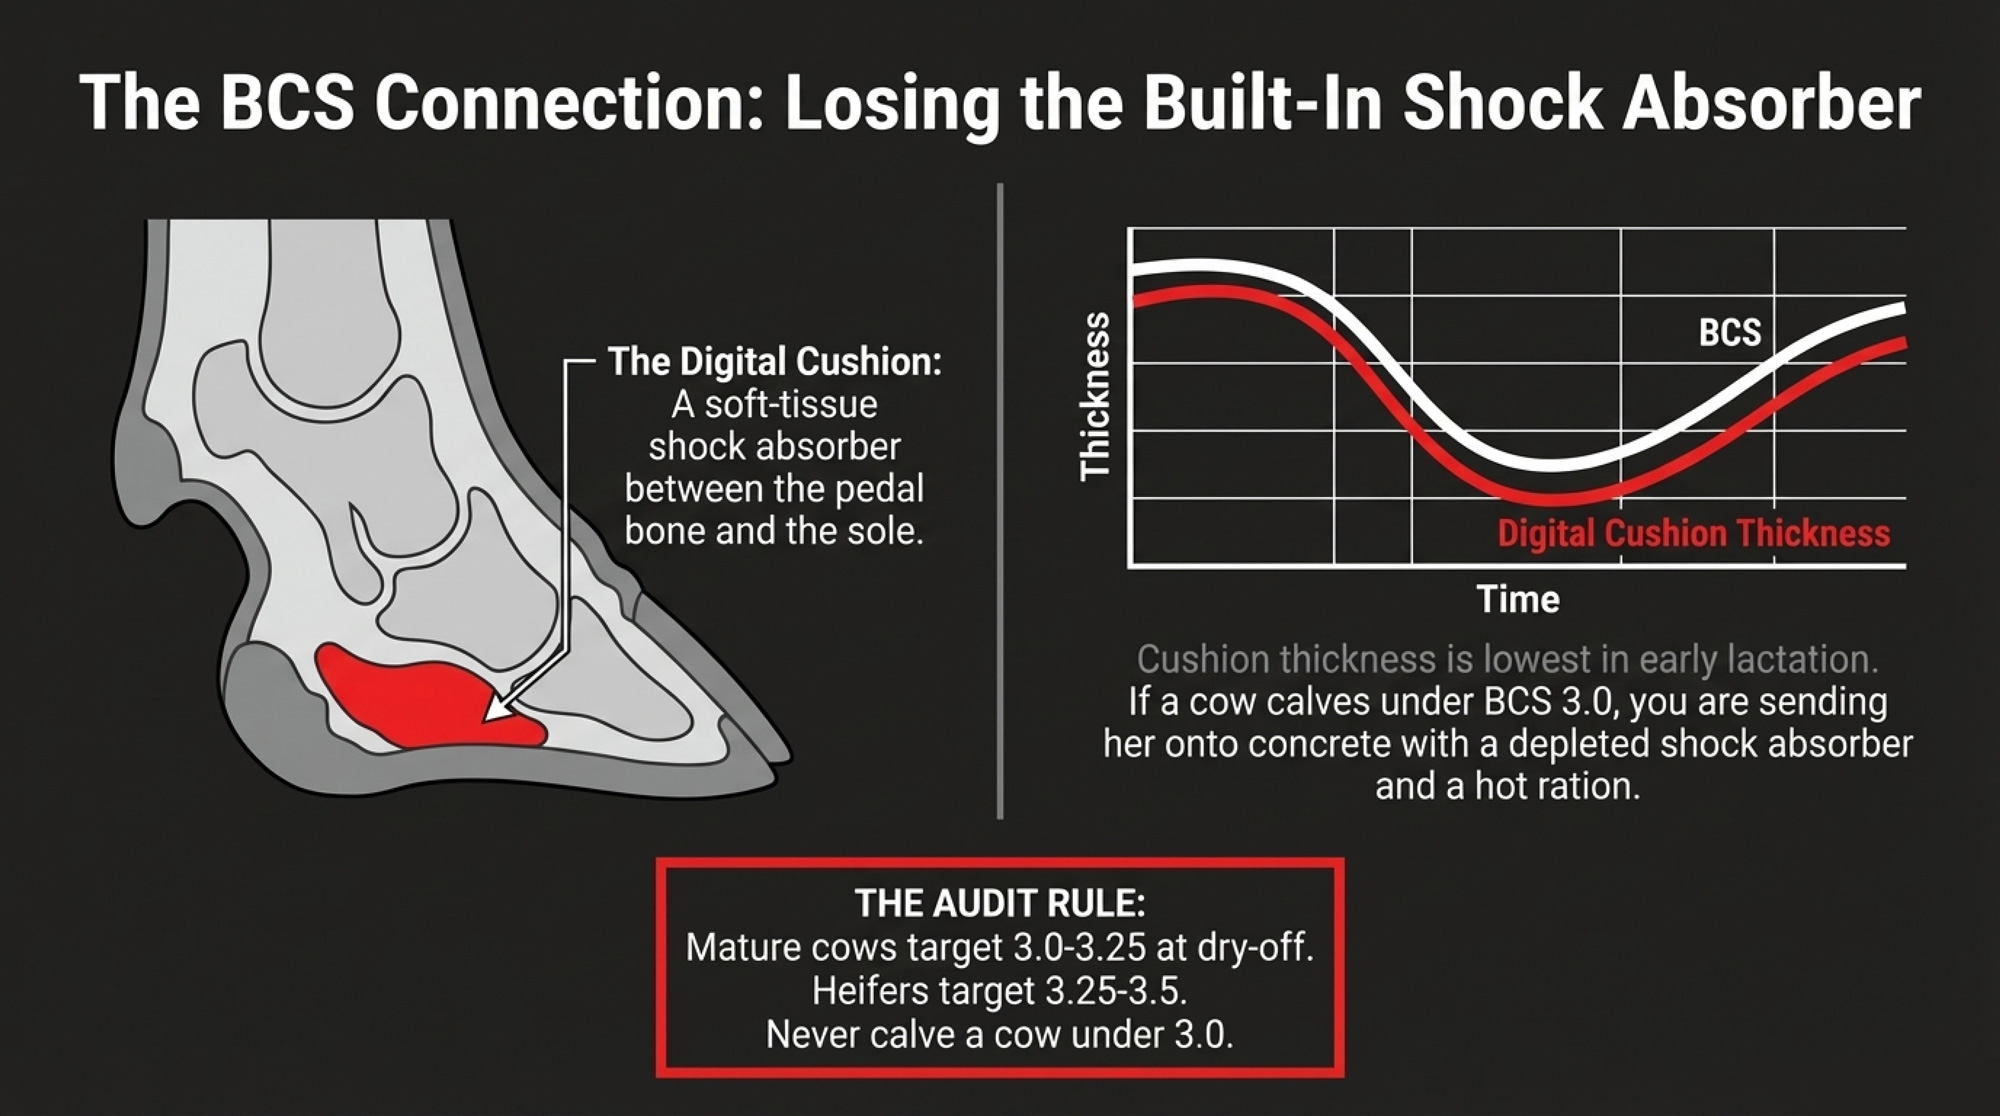
Coverage of a £1 million SRUC/RVC/Liverpool digital cushion study in Dairy Global reported that cows with greater digital cushion thickness had decreased odds of sole lesions (odds ratio about 0.74 for the typical ulcer site). That soft-tissue pad under the sole is thickest late in lactation and thinnest in early lactation — exactly when cows face the most metabolic stress and the most concrete. Earlier work from Tarlton and colleagues showed that hormonal changes around calving loosen the suspensory apparatus inside the claw, allowing the pedal bone to shift downward when cushion thickness is already at its lowest.
More recent work from the University of Nottingham, covered in The Bullvine’s December 2025 JDS roundup, found structural differences in the digital cushions of cows with lifetime histories of hoof horn lesions — including changes in collagen composition that may reduce shock absorption.
If you send a cow into that calving period at BCS 2.5, you’re not just flirting with ketosis. You’re thinning the shock absorber between bone and sole when she’s about to spend more time on concrete and eat a hotter ration. For a deeper look at how prepartum BCS affects DMI and energy balance, The Bullvine’s breakdown of the University of Florida BCS research lays out the numbers by BCS category.
The herd drew a line: mature cows at BCS 3.0–3.25 at dry-off, first-lactation heifers at about 3.25–3.5, and any animal below those targets in the last 60 days of lactation flagged as a “rebuild” cow.
Can RUFAL and Dry-Off BCS Really Change Your Lameness Bill?
Over the next 90 days, the owner, nutritionist, and hoof trimmer agreed on three moves.
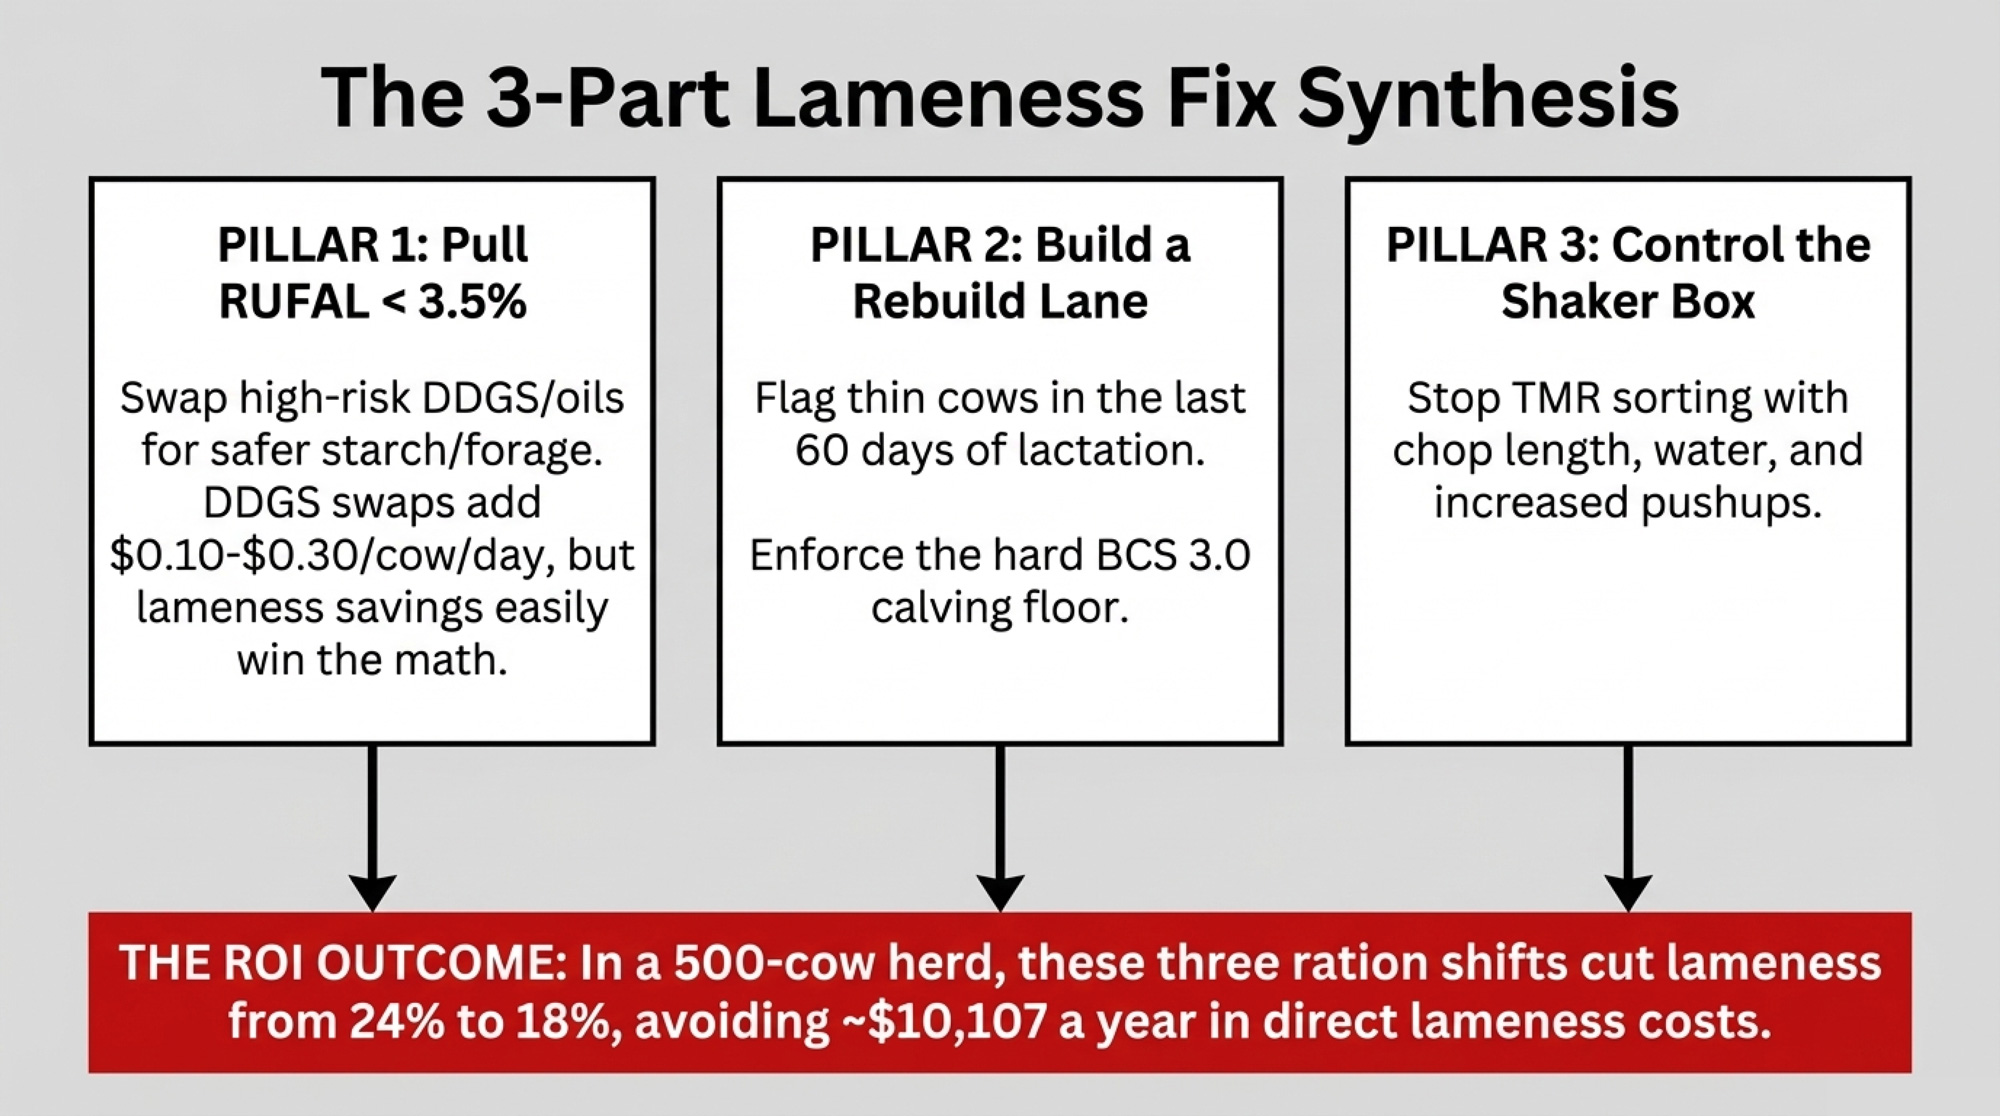
1. Pull RUFAL out of the danger zone.
They pulled back on DDGS and free vegetable oil, replaced some of that energy with better forage and starch sources, and shifted a portion of supplemental fat to a rumen-inert calcium salt product. The revised ration landed at about 3.2% RUFAL, down from 3.8%.
On cost: projected DDG prices for late 2025 and early 2026 are in the $145–155/ton range at $4.00 corn and $325 soybean meal, with a realistic band of $125–170/ton depending on corn and soybean meal swings. In many regions, that still makes DDGS a relatively cheap protein-energy source. Pulling it back to lower RUFAL may add $0.10–0.30 per cow per day in feed costs, depending on what replaces it. The question is whether the lameness savings outrun that ingredient cost — and on this herd’s numbers, they did.
2. Build a “rebuild” lane for thin cows.
They flagged cows and heifers under target BCS in the last 60 days of lactation, moved them into a smaller group with better bunk access and a ration targeting roughly 0.25–0.5 BCS gain before dry-off, and enforced a hard floor: no cow calves under BCS 3.0 unless there’s a clear health reason.
This requires pen space and labor. Not every barn layout can support a separate group; if you can’t build one, at minimum, flag thin cows at dry-off and adjust their close-up ration accordingly. For more on why that BCS window matters for fresh-cow outcomes, The Bullvine’s 90-day transition fix shows how calving most Holsteins at BCS 3.0–3.25 supports both fertility and health.
3. Stop letting sorting rewrite the ration.
Running the Penn State particle separator at 0, 6, 12, and 18 hours told the real story. Penn State Extension guidelines flag a change of more than about 3–5 percentage units in any sieve over several hours as meaningful sorting. By 12 hours post-feeding, this herd’s top screen had swung past that. Cows were picking out grain and fines early and leaving a stemmy mess for the last shift.
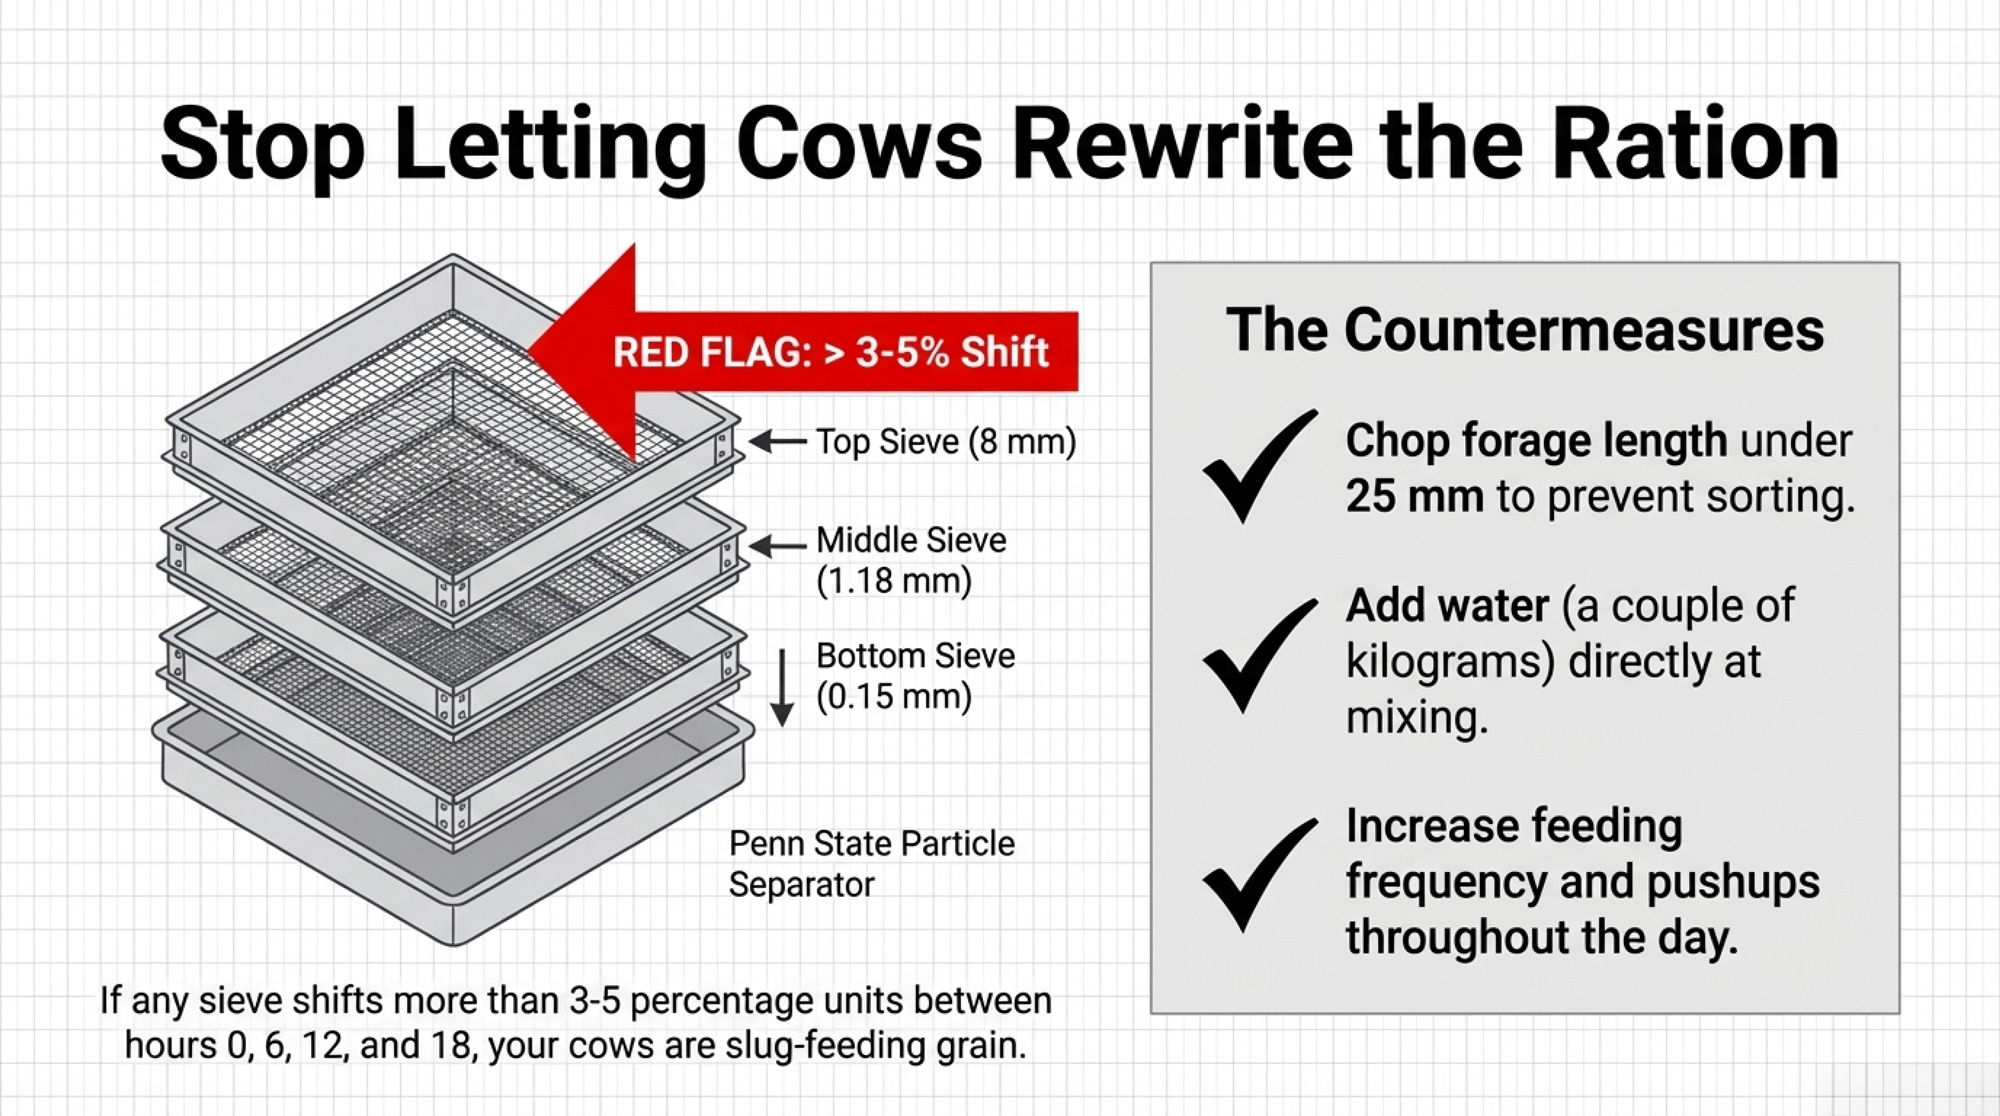
Countermeasures: forage length cut under about 25 mm, a couple of kilograms of water added at mixing, and more frequent feeding and pushups. For a full walkthrough of the Penn State separator as a weekly tool — including tying it to fecal starch testing — see The Bullvine’s particle separator feature.
Did the Ration Changes Actually Reduce Lameness?
Nobody expected lameness to disappear. It didn’t. But over the next 12 months, lameness dropped from 24 cases per 100 cows to just under 18 per 100 — about 90 cases instead of 120.
That 30-case drop: 30 × $336.91 ≈ $10,107 in direct lameness cost avoided on the Robcis model. Beyond the spreadsheet, the hoof trimmer saw fewer repeat claw horn disruption lesions in the same claws, slightly better reproductive performance in fresh cows, and a trim list that felt more manageable.
Sodium bicarbonate stayed at 0.75% of DM. Monensin rates held. They didn’t need to crank either one up. Those tools were now supporting a ration that protected hooves rather than propping up one that kept breaking them.
When Is It the Barn — and When Is It the Ration?
All of this played out in a freestall barn that wasn’t perfect but wasn’t a horror show. Stalls were reasonably sized, bedding adequate, alleys scraped regularly, and parlor routines kept cows out of the pen less than four hours a day.
On this herd, the numbers said the environment wasn’t the primary driver. The big step-change came from RUFAL and BCS, backed by sorting control — not a barn redesign. For herds where the barn is the bottleneck, The Bullvine’s deep dive on time out of the pen shows how stall design, stocking density, and holding-pen time drive lameness and lost production. And for a broader look at what most “non-lame” cows are hiding under their feet, The Bullvine’s hoof lesions feature a breakdown of the scale of subclinical damage.
If your herd is sitting on worn concrete, narrow stalls, or overstocked pens, your math will look different. This isn’t a hall pass for ignoring the barn. It’s a reminder that for some freestall operations, the cheapest place to start is in the ration and the dry-off lane.
Your 30-Day Lameness Audit
You’re not running this exact herd. But you can steal a lot from how they put the pieces together.
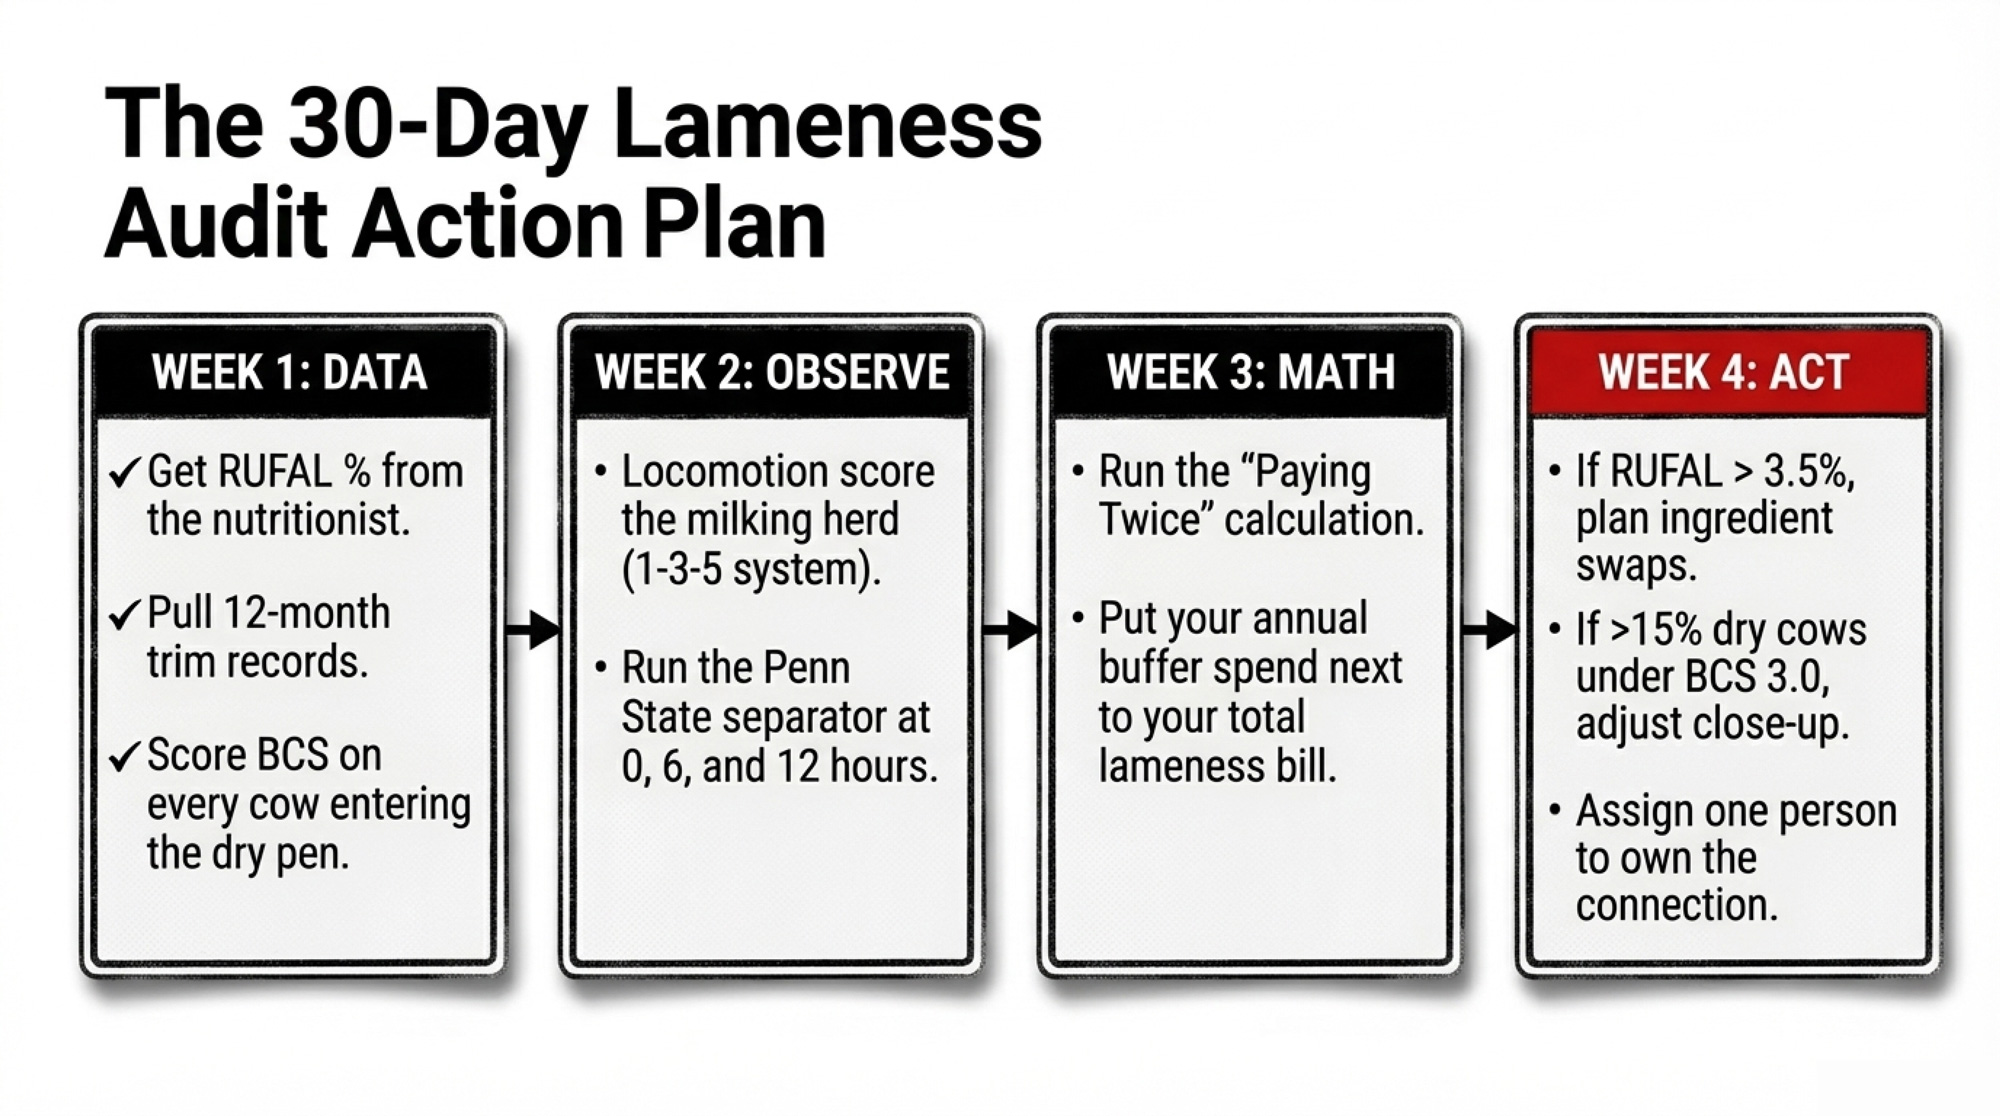
Week 1: Get Your Three Numbers on One Page
- RUFAL (% of DM): Run your current ration through AMTS, NDS, or CPM Dairy — or ask your nutritionist to pull it. Flag if it’s above 3.5%.
- Lameness cases per 100 cows per year: Pull your trim and treatment records for the last 12 months. If you don’t have them, that’s finding number one.
- BCS at dry-off: Score every cow entering the dry pen this week. What percentage is below 3.0?
Week 2: Score, Sort, and Stare at the Bunk
- Locomotion-score the entire milking herd using a 1-3-5 system. Compare your number to what you thought it was. If the gap is more than 2×, you’ve got a detection problem.
- Run the Penn State particle separator on fresh TMR, then again at 6 and 12 hours. Any box shifting more than 3–5 percentage units? You’ve got a sorting problem.
- Walk the bunk at 18+ hours. If it looks like corn cobs and stems, cows sorted the good stuff out hours ago.
Week 3: Do the “Paying Twice” Math
- Calculate your annual buffer + ionophore spend using the calculator above.
- Calculate your annual lameness cost: (cases/year) × $337.
- Put them side by side. If your lameness cost exceeds your buffer spend, your ration may be working against you.
Week 4: Decide and Assign
- If RUFAL is above 3.5%, work with your nutritionist on an ingredient swap plan. Target getting below 3.5% within two ration changes.
- If more than 15% of dry-off cows are below BCS 3.0, build a rebuild lane or, at a minimum, flag thin cows and adjust their close-up ration.
- If sorting is confirmed, pick at least two countermeasures: shorter chop, added water, more frequent feeding/pushups, or a wet ingredient.
- Assign one person to own the connection between RUFAL, dry-off BCS, and the trim-chute report. Nothing changed on this herd until the nutritionist, hoof trimmer, and owner were looking at the same numbers.
| Input | This Herd (500 cows) | Your Herd (fill in) |
|---|---|---|
| Bicarb inclusion (% DM) | 0.75% | ________ |
| Bicarb cost ($/kg) | $0.70 | ________ |
| Bicarb cost/cow/day | ~$0.12 | ________ |
| Annual bicarb spend | ~$23,000 | ________ |
| Monensin cost/cow/day | ~$0.04 | ________ |
| Annual monensin spend | ~$7,300 | ________ |
| Total Cost A (Buffer + Ionophore) | ~$30,300 | ________ |
| Lameness cases per 100 cows/yr | 24 | ________ |
| Cases per year (total herd) | 120 | ________ |
| Cost per case (Robcis 2023) | $336.91 | $336.91 |
| Total Cost B (Annual Lameness Bill) | $40,429 | ________ |
| Gap (Cost B minus Cost A) | $10,129 🔴 | ________ |
What This Means for Your Ration and Your Trim Bill
If your RUFAL lives north of about 3.5% of DM and you’re seeing more than 30 lameness cases per 100 cows per year, you probably don’t have a “trim faster” problem — you have a ration and dry-cow problem showing up in the hoof.
Bringing RUFAL under 3.5% and enforcing a BCS floor of about 3.0 at calving are two of the cheapest moves you can make to change your lameness math — even before you touch the barn. Pulling RUFAL down may cost you on the ingredient line, especially if DDGS is your cheapest energy source. But if your lameness savings outrun that extra $0.10–0.30 per cow per day in feed cost, the math is still in your favor.
At 90 days, re-score the entire herd for locomotion. Compare your new per-100-cow lameness rate to the baseline you established in Week 1.
At 12 months, run the Paying Twice Calculator again with real post-change data. If your lameness cost dropped more than your ration-change cost, the RUFAL fix paid for itself.
The next time your nutritionist and hoof trimmer are at the same table, don’t just ask how to treat lame cows faster. Ask where your lameness bill really starts — and how long you’re willing to keep paying twice.
Key Takeaways:
- When proper scoring puts lameness closer to 20–25% than the 5–7% you’d guess, you’re likely staring at a $40,000‑a‑year problem at about $337 per case.
- Treat 3.5% of DM RUFAL as a warning line: above that, your ration is a major lameness risk, even if the barn and trimmer look good.
- Don’t calve cows under BCS 3.0; thin cows bring softer digital cushions into the riskiest weeks and show up more often with claw horn lesions.
- Pulling RUFAL under 3.5%, holding a BCS 3.0 floor, and fixing TMR sorting can realistically drop lameness from the mid‑20s to the high‑teens per 100 cows and keep roughly $10,000 a year in your pocket.
- Any time your lameness bill is bigger than your buffer and ionophore spend, it’s your ration and dry‑cow program — not your hoof trimmer — that should move to the top of the to‑fix list.
Complete references and supporting documentation are available upon request by contacting the editorial team at editor@thebullvine.com.
Learn More
- The $7,200 Lameness Fix That Beats $45,000 Technology – Reveals a disciplined prevention protocol that slashes lameness by 40% for a fraction of tech costs. You’ll gain a non-negotiable footbath and scoring schedule that delivers a four-month payback and stops $10,000 in annual profit leaks.
- The 3.5-Hour Cow Rule: How Time Out of the Pen Quietly Erases Over $300,000 – Exposes how excessive parlor wait times drive a “biological tax” on resting and rumination. It arms you with a three-step time-budget audit to reclaim lost lying time and prevent the mechanical hoof damage that rations alone can’t fix.
- From “Worst Dairy” to Zero Lame Cows: How CDCB’s New Trait Could Rewrite Genetics – Delivers a forward-looking strategy for using the latest mobility PTAs and AI camera data to breed out lameness entirely. You’ll learn to identify sire families that naturally resist lesions, positioning your herd for a future without the trim-chute bill.
 The Sunday Read Dairy Professionals Don’t Skip.
 The Sunday Read Dairy Professionals Don’t Skip.
Every week, thousands of producers, breeders, and industry insiders open Bullvine Weekly for genetics insights, market shifts, and profit strategies they won’t find anywhere else. One email. Five minutes. Smarter decisions all week.


