
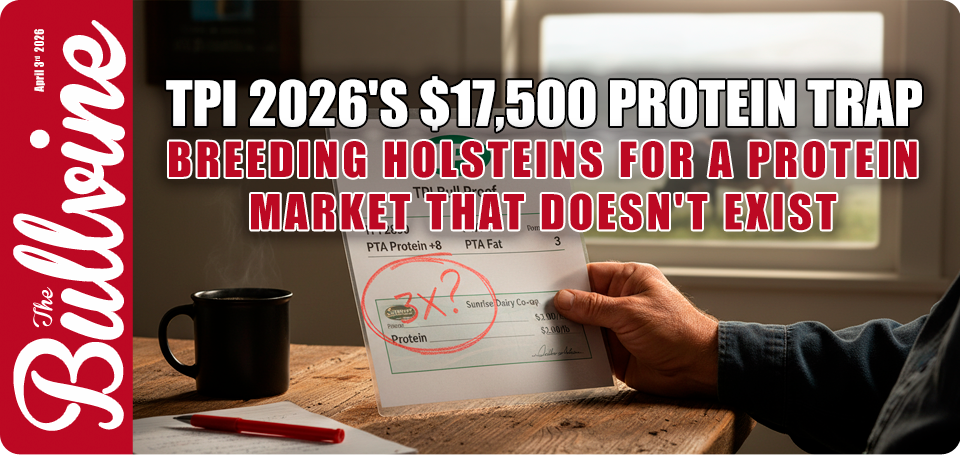
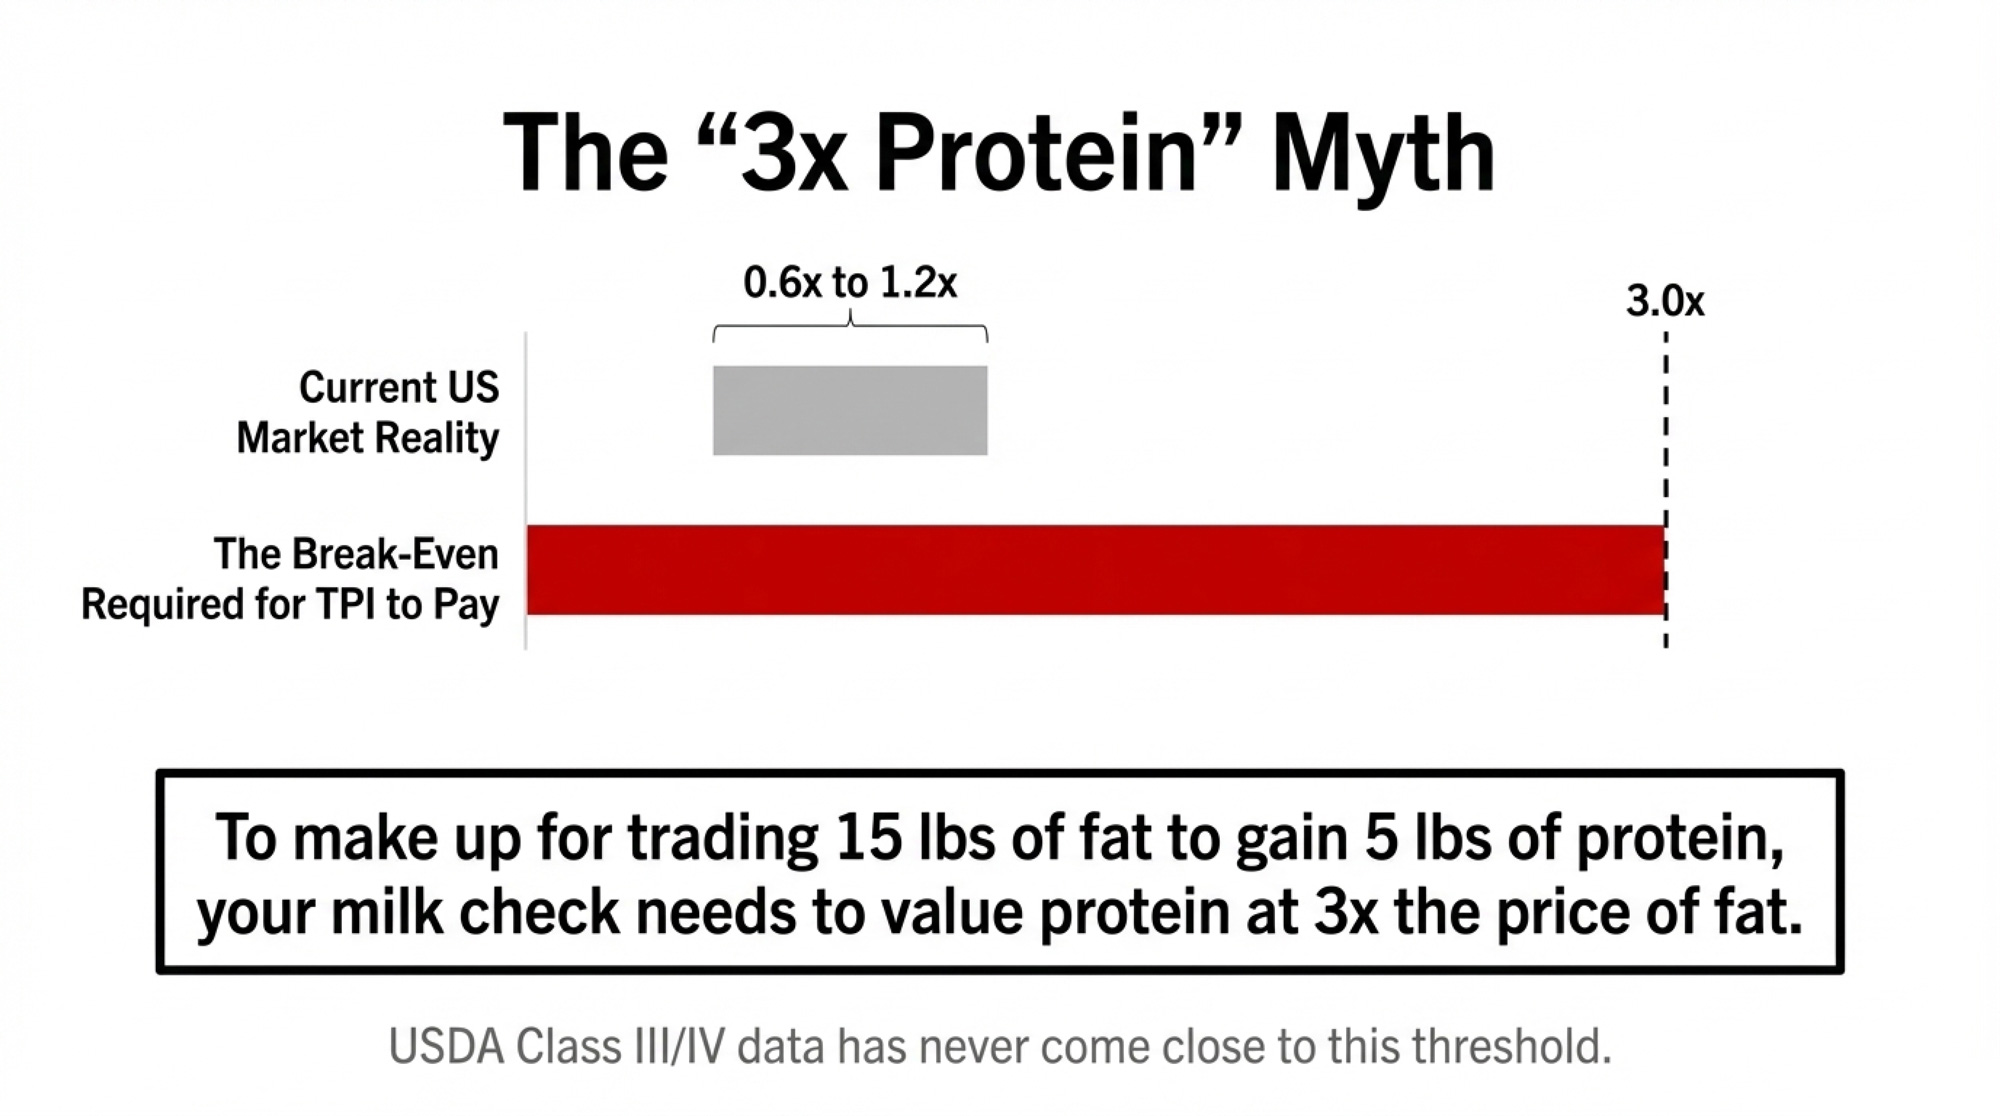
Protein would have to be worth 3× fat for this TPI shift to pay. Your milk check says it isn’t. Where does that leave the bulls you’ve been loading into your tank?
[Editor note: “Mark H.” and “Sara L.” in this article are composite characters built from real barn math and industry context to illustrate decisions many 500‑cow dairies face in 2026.]
The new TPI weights don’t just tweak your sire list. They push the Holstein breed in a new direction for the next 10–15 years. This isn’t a milk check issue alone; it quietly changes the fundamental type of cow the industry breeds for over the next decade.
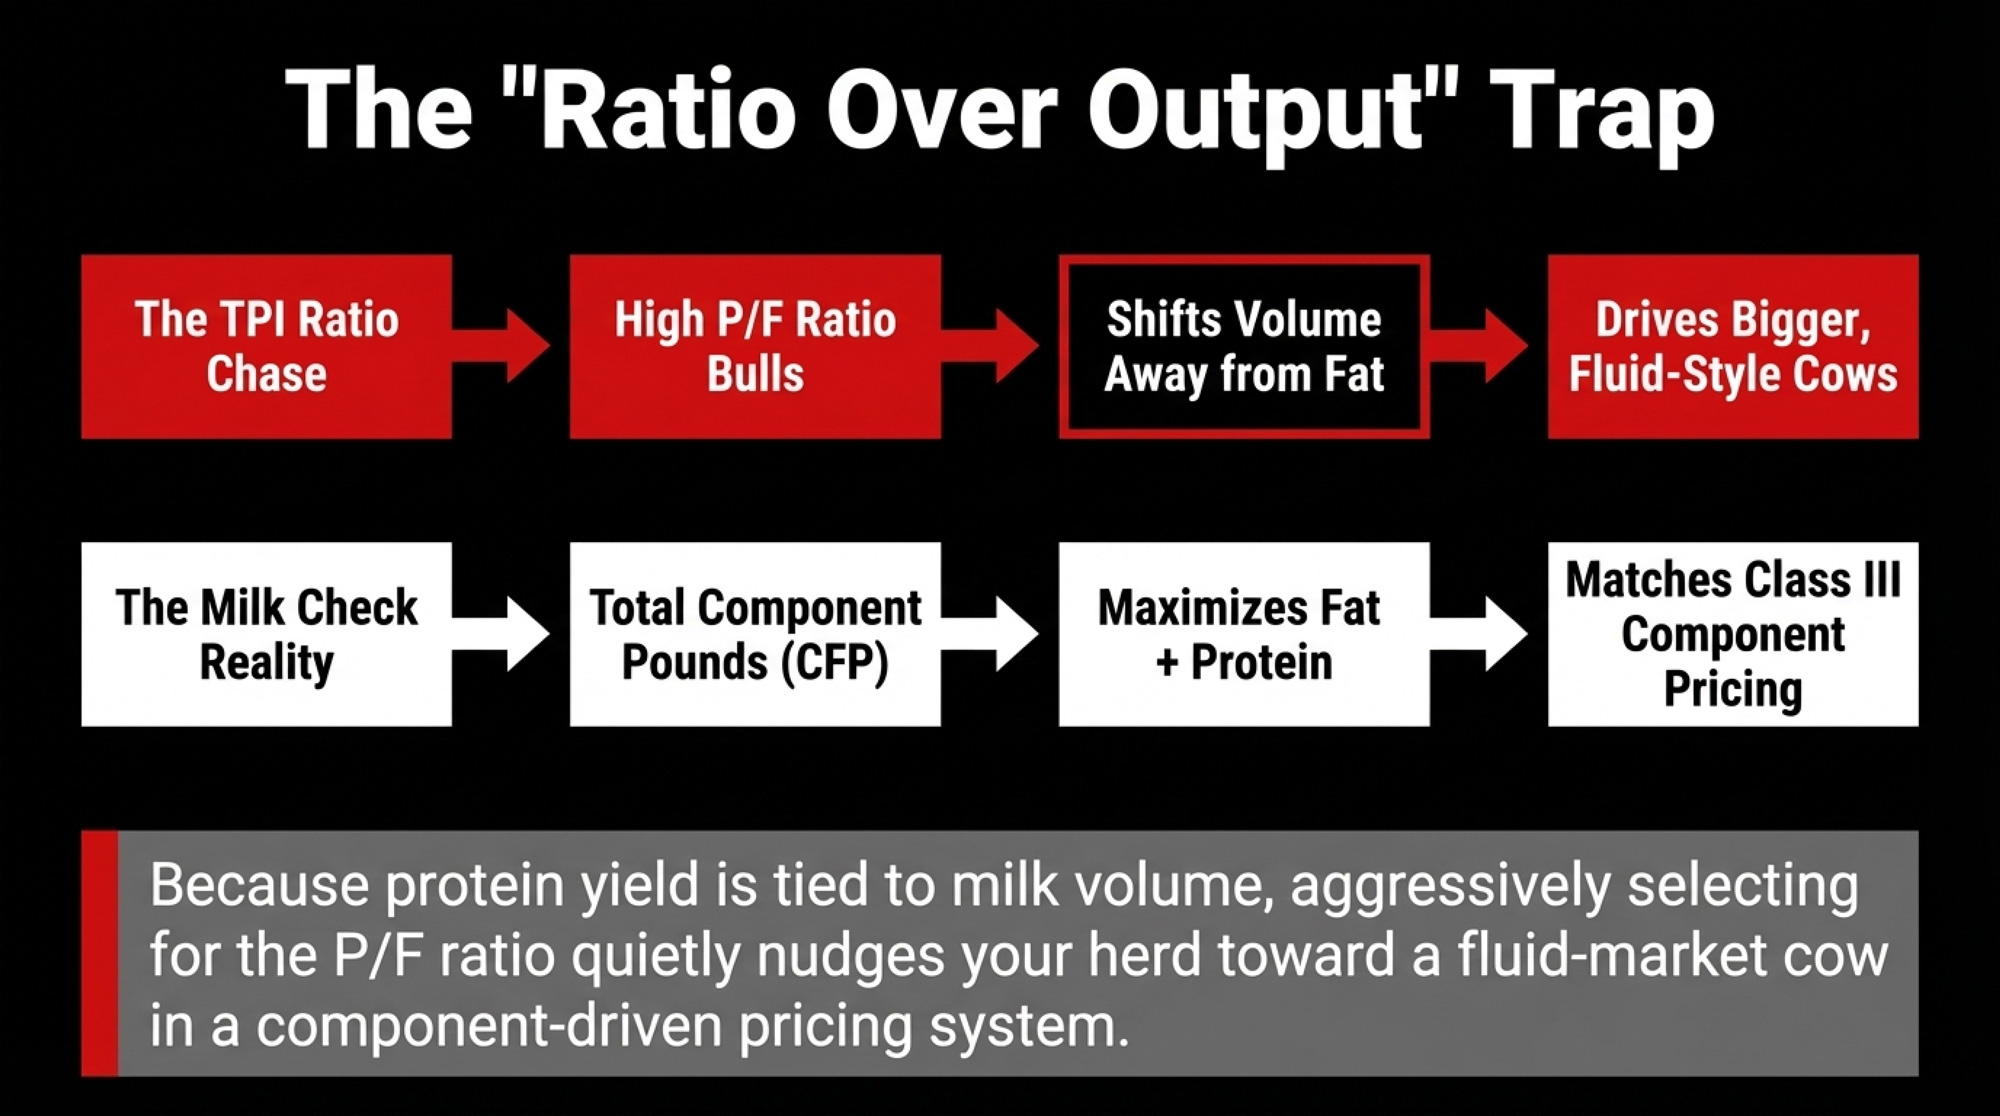
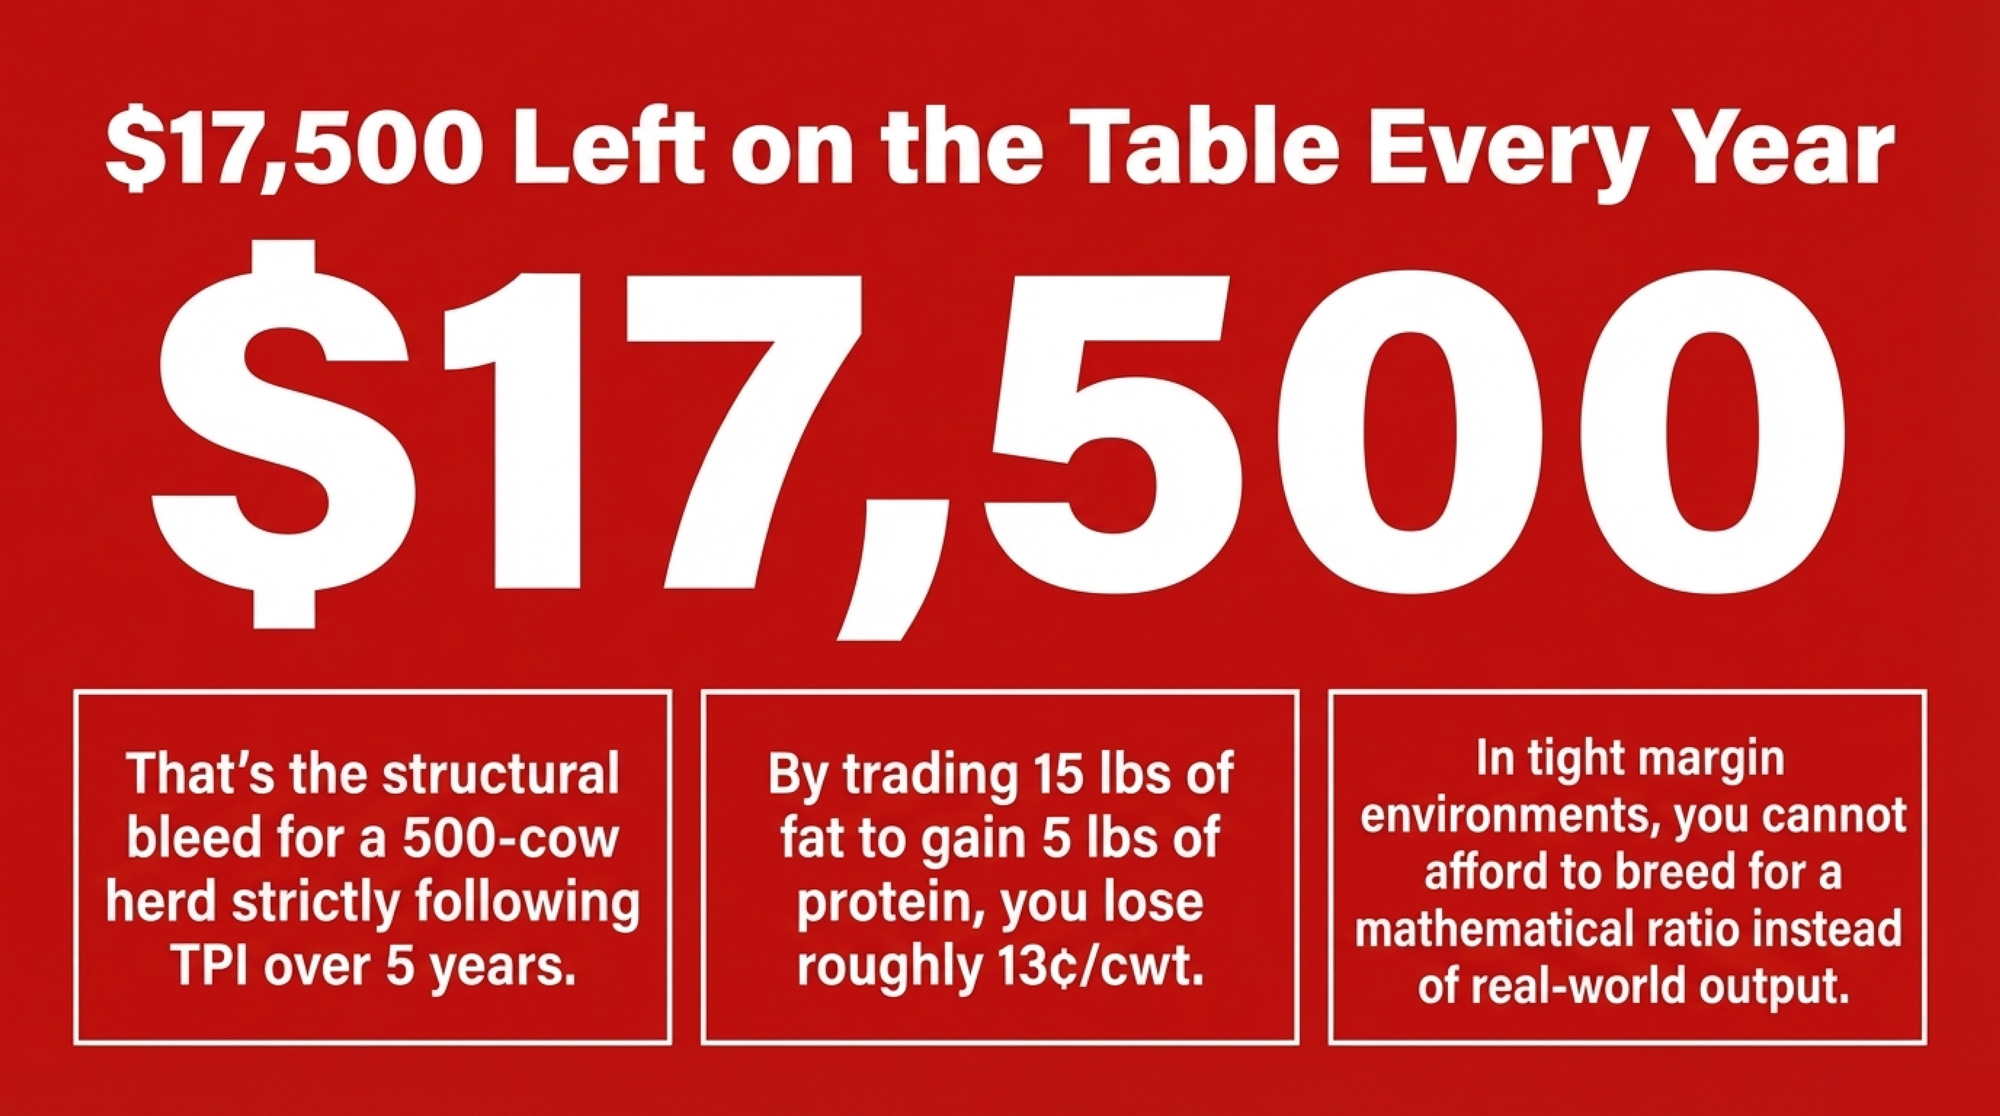
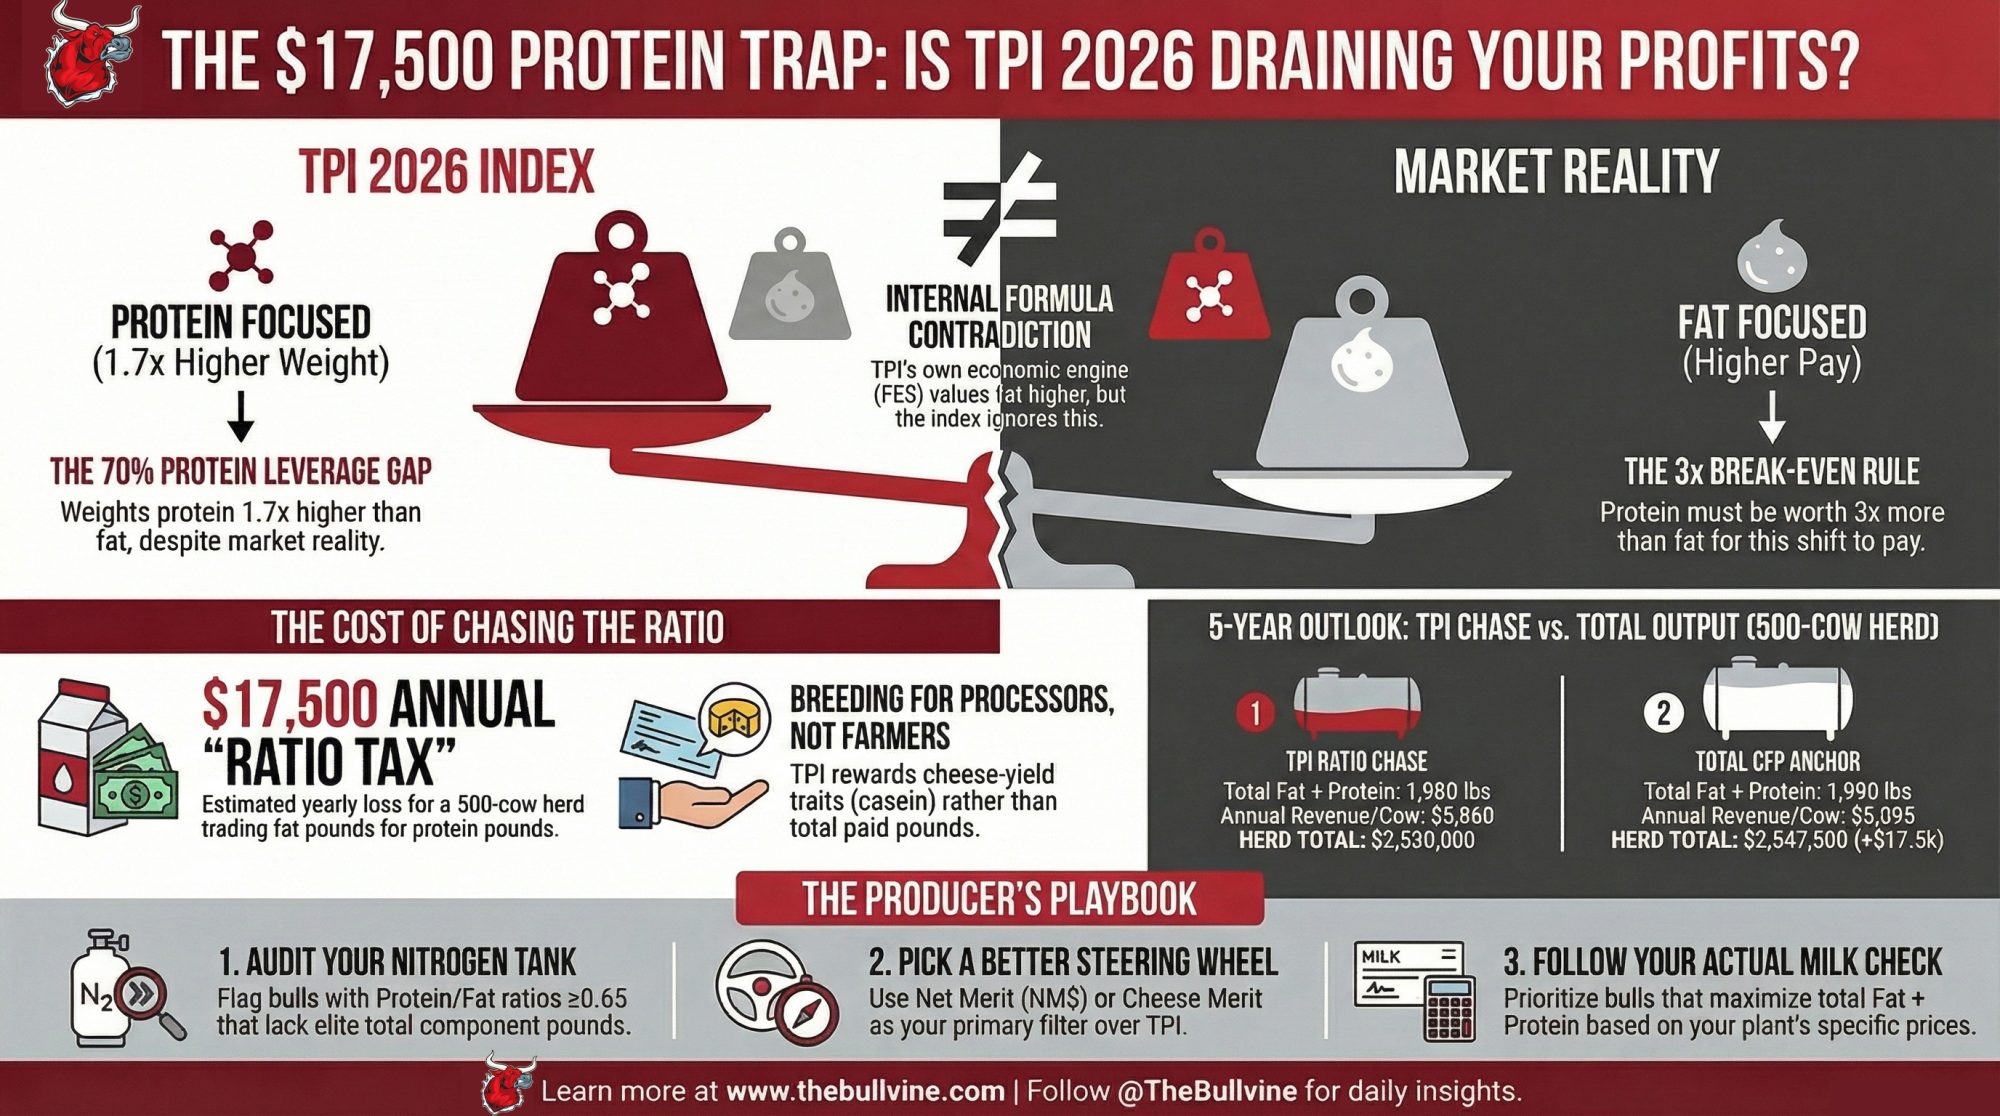
Holstein USA’s April 2026 TPI formula doesn’t just nudge protein; it rewards the protein‑to‑fat ratio over total output. That’s a fundamentally different breeding goal from previous iterations that treated fat and protein more evenly in the production slice. If you follow that signal unthinkingly in a US Class III component grid, a 500‑cow herd can easily leave about $17,500 a year on the table.
Mark H., who milks 500 Holsteins in New York, only saw “five‑point tweaks” when Holstein USA shifted TPI production weights to 24% protein and 14% fat, and Lactanet moved Holstein LPI production to 40% fat, 60% protein. Under pressure from reps and neighbors, he leaned into the new high‑TPI, protein‑heavy bulls — and that’s where the barn math started to disagree with his milk check.
2026 TPI Formula Changes: A Directional Shift, Not a Tweak
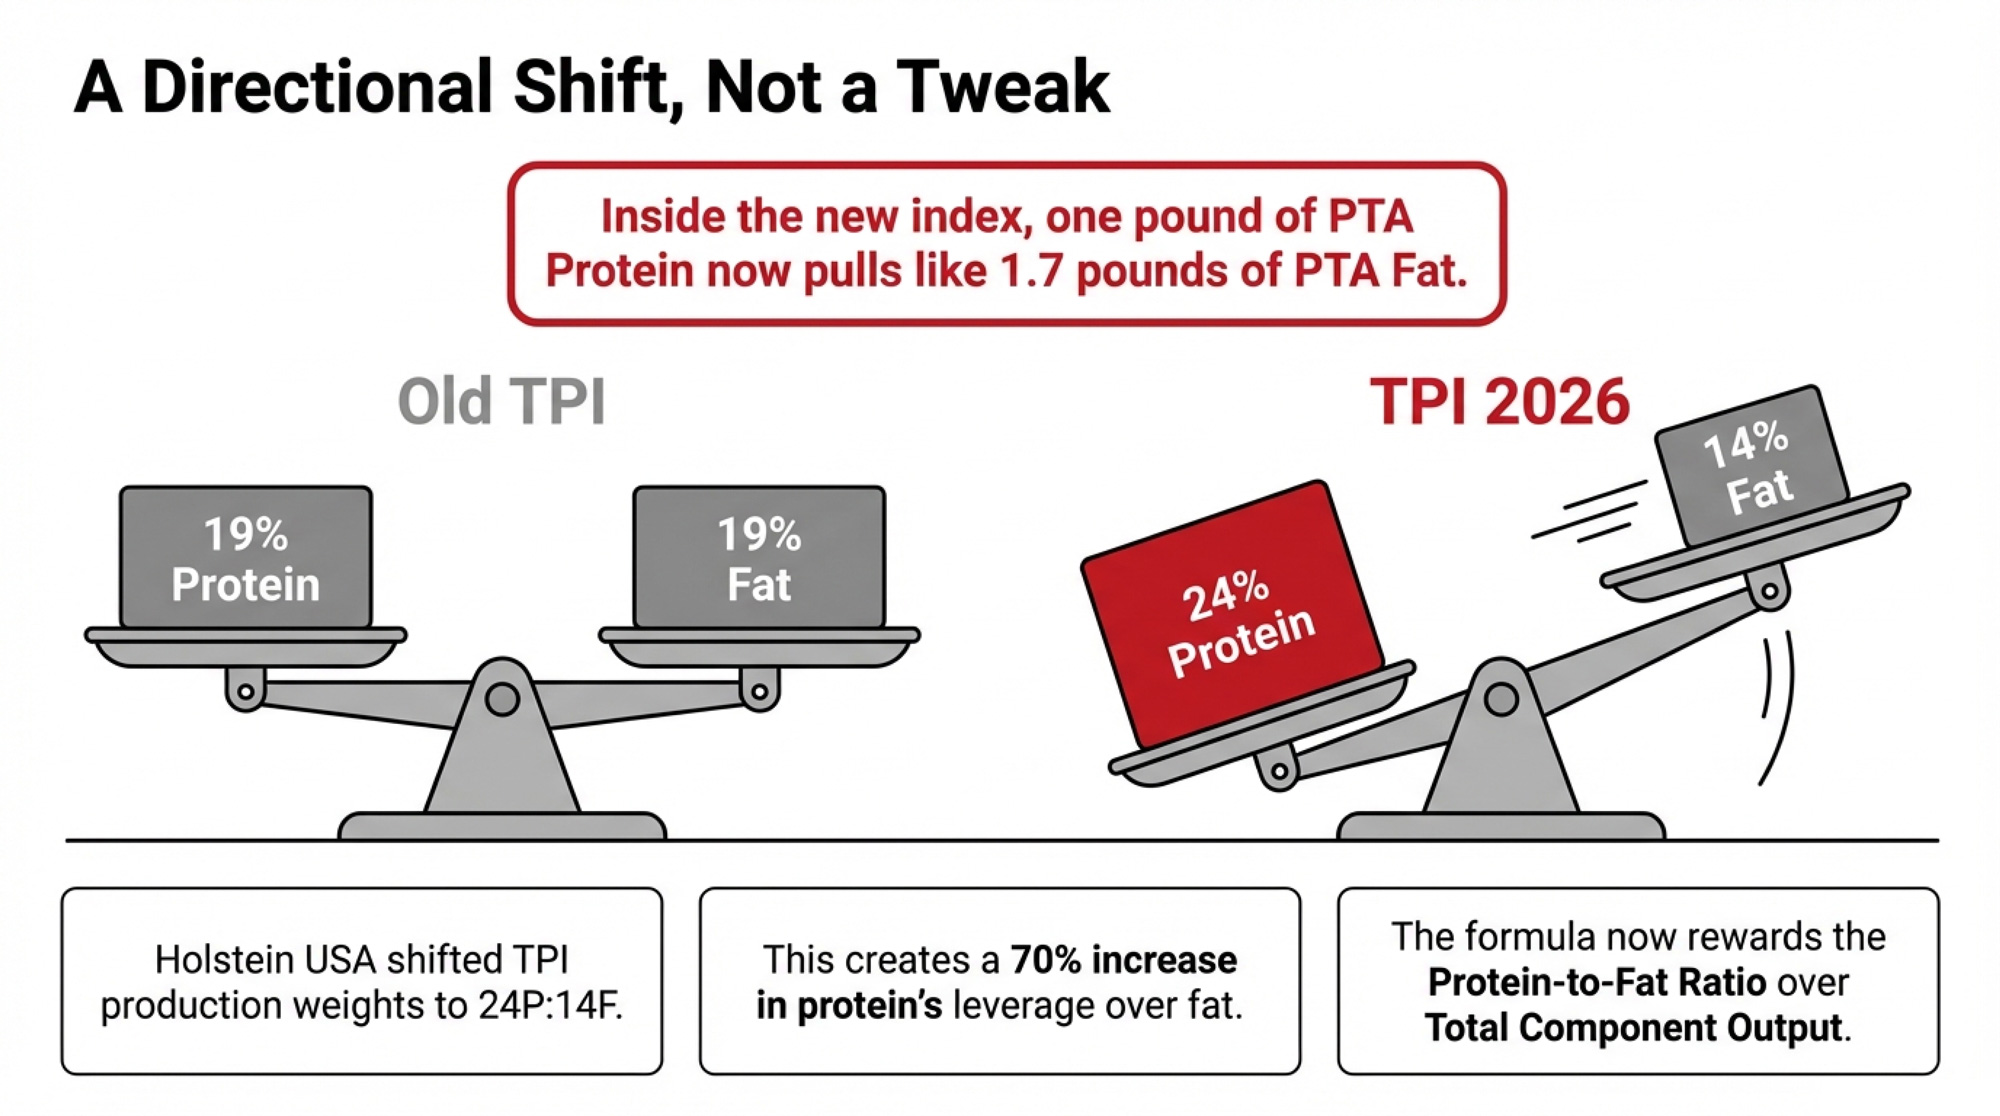
Holstein USA’s 2026 TPI formula update increased the weighting on PTA Protein from 19 to 24 and decreased the weighting on PTA Fat from 19 to 14. That’s the headline change in the production slice.
By early 2025, Mark’s Federal Order milk check looked like most US Class III/IV component checks. USDA Class III and IV component reports through 2023 and into 2025 often show butterfat prices near the high‑$2.80s to low‑$3.00s per lb, with protein commonly in roughly the $1.80–$2.50 per lb range, depending on the month and year. In several recent months, that’s meant fat is worth more per pound than protein on his component line.
At the same time, the TPI formula did something very different inside the index. It moved the production weights from:
- 19% protein, 19% fat → to → 24% protein, 14% fat.
On the surface, you see a five‑point bump to protein and a five‑point cut to fat. Simple enough.
When Mark’s nutritionist and genetics advisor, Sara L., put a pen to it at his kitchen table, she wrote one line that changed the whole conversation:
- Old protein:fat leverage = 19:19 = 1.0
- New protein: fat leverage = 24:14 ≈ 1.71
Inside the production slice of TPI, one pound of PTA Protein now pulls like roughly 1.7 pounds of PTA Fat. That’s roughly a 70% increase in protein’s leverage over fat, even though Holstein USA’s own description says the formula is designed to yield “additional pounds of fat and protein, with slightly more emphasis on protein.”
Because protein yield is closely tied to milk volume in most Holstein evaluations, loading selection on the P/F ratio nudges herds — and over time the breed — toward higher‑volume, more fluid‑style cows, even while most plants continue to pay based on total fat + protein sold.
The formula isn’t creating more total components — it is redistributing emphasis. A hard P/F chase moves components away from fat instead of maximizing total pounds of fat + protein you sell. TPI is now quietly rewarding the ratio more than the total output. That’s a different breeding goal than the one that built the modern high‑component Holstein.
Lactanet did something similar but more transparent. Its April 2026 bulletin spells out that shifting Holstein LPI production from 60F:40P to 40F:60P is meant to “better reflect anticipated changes in milk pricing and processor demand, particularly the growing emphasis on protein,” and that it should cause only minor reranking among top animals. Canada’s move is explicitly anchored in its quota‑based pricing math and processor demand; it’s internally consistent with that market.
Holstein USA’s change, by contrast, is big enough to push fat‑heavy bulls down the list and protein‑heavy bulls up, even when no new daughters are added. The 24P:14F production weighting behaves more like a new rulebook for which cow wins — especially in how it reshuffles bulls with very different fat vs protein profiles. Mark saw that on the spring lists. He just hadn’t tied it back to dollars or to the kind of cow he was breeding for 2036.
2026 TPI vs Total CFP: Two Paths for the Same 500‑Cow Herd
To get past the rhetoric and the rankings, Sara asked Mark to walk through two very different five‑year futures off the same starting herd. Same cows today, different sire lists from 2026 through 2030.
They agreed on a realistic starting point for his 500‑cow Holstein herd:
- Fat: 1,070 lb/cow/year
- Protein: 840 lb/cow/year
- Total components (CFP): 1,910 lb/cow/year
That’s roughly a 26,700‑lb Holstein at ~4.0% fat and 3.1% protein — very normal for a well‑managed commercial herd.
These gains are illustrative — built to show directional outcomes, not to predict any specific bull’s future proof. Actual genetic trends will vary by herd, sire choice, and whatever comes out of the April evaluations.
Path 1: Follow the 2026 TPI Formula — Chase the Ratio
If Mark listens to the new 24P:14F signal and leans into bulls that look fantastic on updated Holstein TPI 2026 lists, he’s going to pick a lot of sires that:
- Carry high PTA Protein
- Have only moderate PTA Fat
- Sit at P/F ratios ≥0.60
Those are the profiles that jumped when TPI changed — protein‑strong, fat‑lighter bulls that TPI now likes roughly 1.7× more per pound of protein than per pound of fat.
Looking at typical genomic bull PTAs and recent trends, Sara used conservative, scenario‑level genetic gains for a herd that picks sires that way:
- +6 lb PTA Fat per year
- +8 lb PTA Protein per year
Over five years of bull selection, that’s +30 PTA Fat and +40 PTA Protein at the sire level. With a realistic ~2.5‑year lag from bull usage to milking cows, about half of that gain has flowed into the cow herd by Year 5:
- +15 PTA Fat, +20 PTA Protein in the herd.
Translate PTAs to actual production (roughly 2 lb actual per lb PTA on mature daughters):
- +30 lb fat, +40 lb protein per cow per year by Year 5.
So if Mark “follows TPI,” his Year‑5 average cow looks like this:
- Fat: 1,070 + 30 = 1,100 lb
- Protein: 840 + 40 = 880 lb
- Total CFP: 1,980 lb
- P/F ratio (by lb): 880 ÷ 1,100 ≈ 0.80
He’s now got a prettier P/F ratio and more protein. That’s what the formula rewards.
Path 2: Follow Total Output — Anchor on Combined Fat + Protein
The alternative is boring but powerful. Ignore the TPI noise and:
- Filter bulls first on a profit index that actually starts from dollars — Net Merit (NM$), Cheese Merit, or a similar economic index.
- Within that filtered list, sort bulls by Fat PTA + Protein PTA (total CFP).
- Keep bulls with P/F in a sane band, roughly 0.50–0.60, so you’re not accidentally tanking protein.
That’s very similar to how Lactanet positions Pro$ and LPI: as profit‑oriented tools tuned to Canada’s component pricing and costs, with the production subindex explicitly anchored to fat and protein yields.
For a herd following that logic, Sara assumed slightly different gains:
- +9 lb PTA Fat per year
- +7 lb PTA Protein per year
Over five years, that’s +45 PTA Fat and +35 PTA Protein among the sires, or about half in the cow herd by Year 5:
- +22.5 PTA Fat, +17.5 PTA Protein.
Translate to actual:
- +45 lb fat, +35 lb protein per cow per year by Year 5.
Now Mark’s “CFP‑anchored” herd is at:
- Fat: 1,070 + 45 = 1,115 lb
- Protein: 840 + 35 = 875 lb
- Total CFP: 1,990 lb
- P/F ratio: 875 ÷ 1,115 ≈ 0.79
Notice what happened: the TPI‑driven path didn’t grow total CFP faster; it just redistributed pounds from fat to protein to achieve a prettier ratio. That is the “ratio over output” trap.
Because protein yield is closely tied to milk volume in most Holstein evaluations, selecting aggressively for the P/F ratio doesn’t just shift your component ratio — it tends to nudge herds toward higher‑volume, more fluid‑style cows. You’re nudging both your herd and, if enough herds follow, the breed toward a fluid‑market cow in a component‑driven system.
2026 Selection Paths for a 500‑Cow Herd (Year‑5 Scenario)
| Metric (per cow/year) | Path 1: TPI Ratio Chase | Path 2: CFP Anchor | Difference |
| Fat yield (lb) | 1,100 | 1,115 | –15 lb |
| Protein yield (lb) | 880 | 875 | +5 lb |
| Total CFP (lb) | 1,980 | 1,990 | –10 lb |
| Fat revenue @ $3.00/lb | $3,300 | $3,345 | –$45 |
| Protein revenue @ $2.00/lb | $1,760 | $1,750 | +$10 |
| Total components revenue | $5,060 | $5,095 | –$35/cow |
| 500-cow herd annual loss | — | — | –$17,500 |
The $17,500 Gap: Paper Cows vs Real Cows
To keep the math honest, Sara anchored everything to real US component prices.
USDA Class III and Class IV component reports through 2023 and into 2025 often show butterfat prices near the high‑$2.80s to low‑$3.00s per lb, with protein commonly in roughly the $1.80–$2.50 per lb range. In several recent months, that’s meant fat worth more per pound than protein on a Federal Order check.
For barn‑table math, she used simple, conservative averages:
- $3.00/lb fat
- $2.00/lb protein
She wasn’t trying to pick a magic month. She wanted Mark to see the difference.
Using the Year‑5 cows they just built:
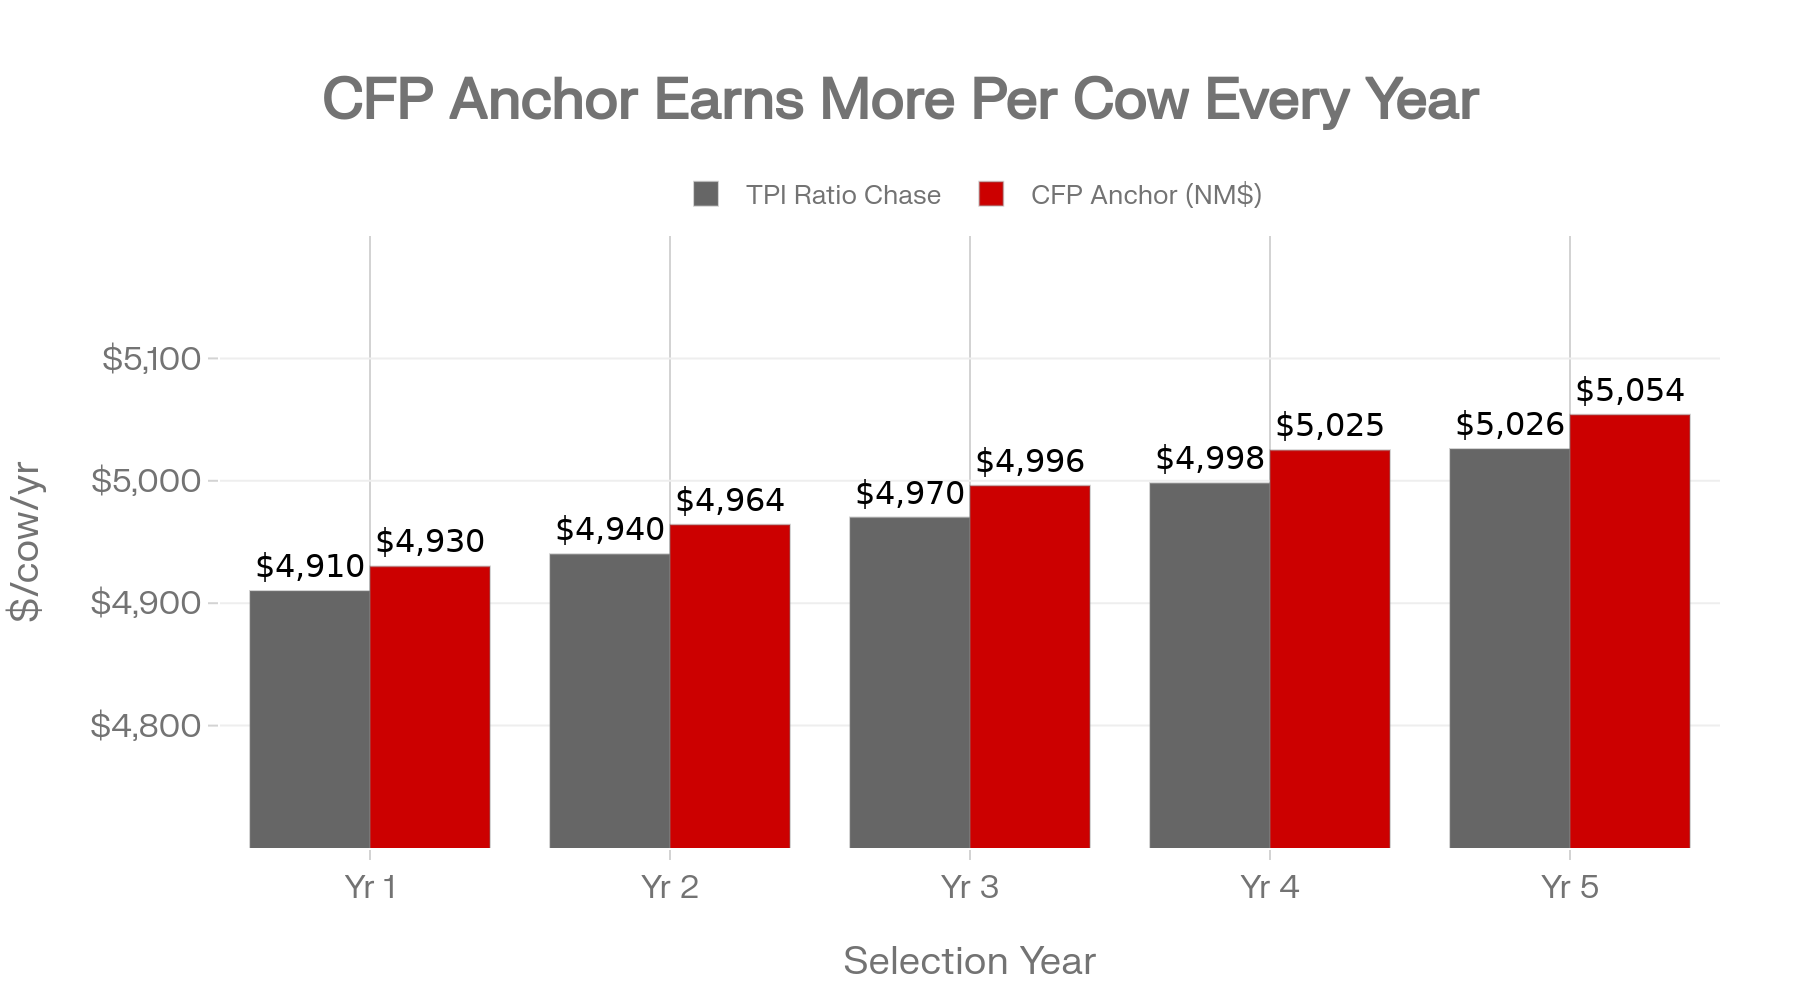
Ratio herd (TPI‑driven)
- Fat dollars: 1,100 lb × $3.00 = $3,300
- Protein dollars: 880 lb × $2.00 = $1,760
- Total components revenue: $5,060/cow/year
CFP herd (milk‑check‑driven)
- Fat dollars: 1,115 lb × $3.00 = $3,345
- Protein dollars: 875 lb × $2.00 = $1,750
- Total components revenue: $5,095/cow/year
The difference:
- $35/cow/year — in favor of the boring CFP herd.
At 500 cows:
- $35 × 500 = $17,500/year.
On paper, the ratio‑focused herd “improved” faster. In the tank and on the check, the CFP herd won. That’s the danger of breeding for a mathematical ratio instead of real‑world output.
If your operation is already navigating tight margins under current milk prices, that $17,500 is serious money — the kind of structural bleed the Bullvine explored in “2025’s $21 Milk Reality: The 18‑Month Window to Transform Your Dairy Before Consolidation Decides for You,” which showed how a $21.60/cwt milk price could wipe out about $125,000 a year from a typical 500‑cow dairy’s profits if nothing changes.
Using the same 26,700 lb/cow:
- 26,700 lb ÷ 100 = 267 cwt/cow/year
Then:
- Ratio herd: $5,060 ÷ 267 ≈ $18.95/cwt
- CFP herd: $5,095 ÷ 267 ≈ $19.08/cwt
While 13¢/cwt may not feel like a crisis in year one, over a decade, it represents a meaningful directional bleed — and it points the herd toward a more fluid‑style cow while your plant still pays you on components sold.
What Does the 3× Protein Break‑Even Really Mean for Your Milk Check?
Mark’s next question is probably the same one you’re thinking: “Sure, that’s with today’s pricing. What if protein really outpaces fat?”
So they stacked the deck for protein. Lactanet’s April 2026 article is explicit that they expect more emphasis on protein in Canadian milk pricing because of processor demand and SNF‑heavy products, and that LPI’s tilt is intended to reflect those anticipated pricing changes. Some specialty protein markets and niche contracts already pay a heavier protein premium than the standard Federal Order grid. The question is whether your check looks like that.
To mirror a “protein‑friendly” future, Sara tried:
- $2.80/lb fat
- $3.50/lb protein
That’s a world where protein is worth ~25% more per lb than fat — much more protein‑heavy than many recent US Federal Order months, but not fantasy.
Run the Year‑5 cows again:
Ratio herd
- Fat: 1,100 × 2.80 = $3,080
- Protein: 880 × 3.50 = $3,080
- Total: $6,160/cow/year
CFP herd
- Fat: 1,115 × 2.80 = $3,122
- Protein: 875 × 3.50 = $3,062.50
- Total: $6,184.50/cow/year
Even in that protein‑leaning grid:
- The CFP herd is still $24.50/cow/year ahead.
- On 500 cows, that’s about $12,250/year.
The trade behind that number:
- Fat lost vs CFP herd: 15 lb × $2.80 = $42
- Protein gained vs CFP herd: 5 lb × $3.50 = $17.50
- Net: $24.50 worse for the ratio herd.
The milk check still doesn’t care that TPI loves Mark’s higher P/F ratio.
Sara wrote the trade on the board:
- Ratio herd vs CFP herd Year 5: –15 lb fat, +5 lb protein.
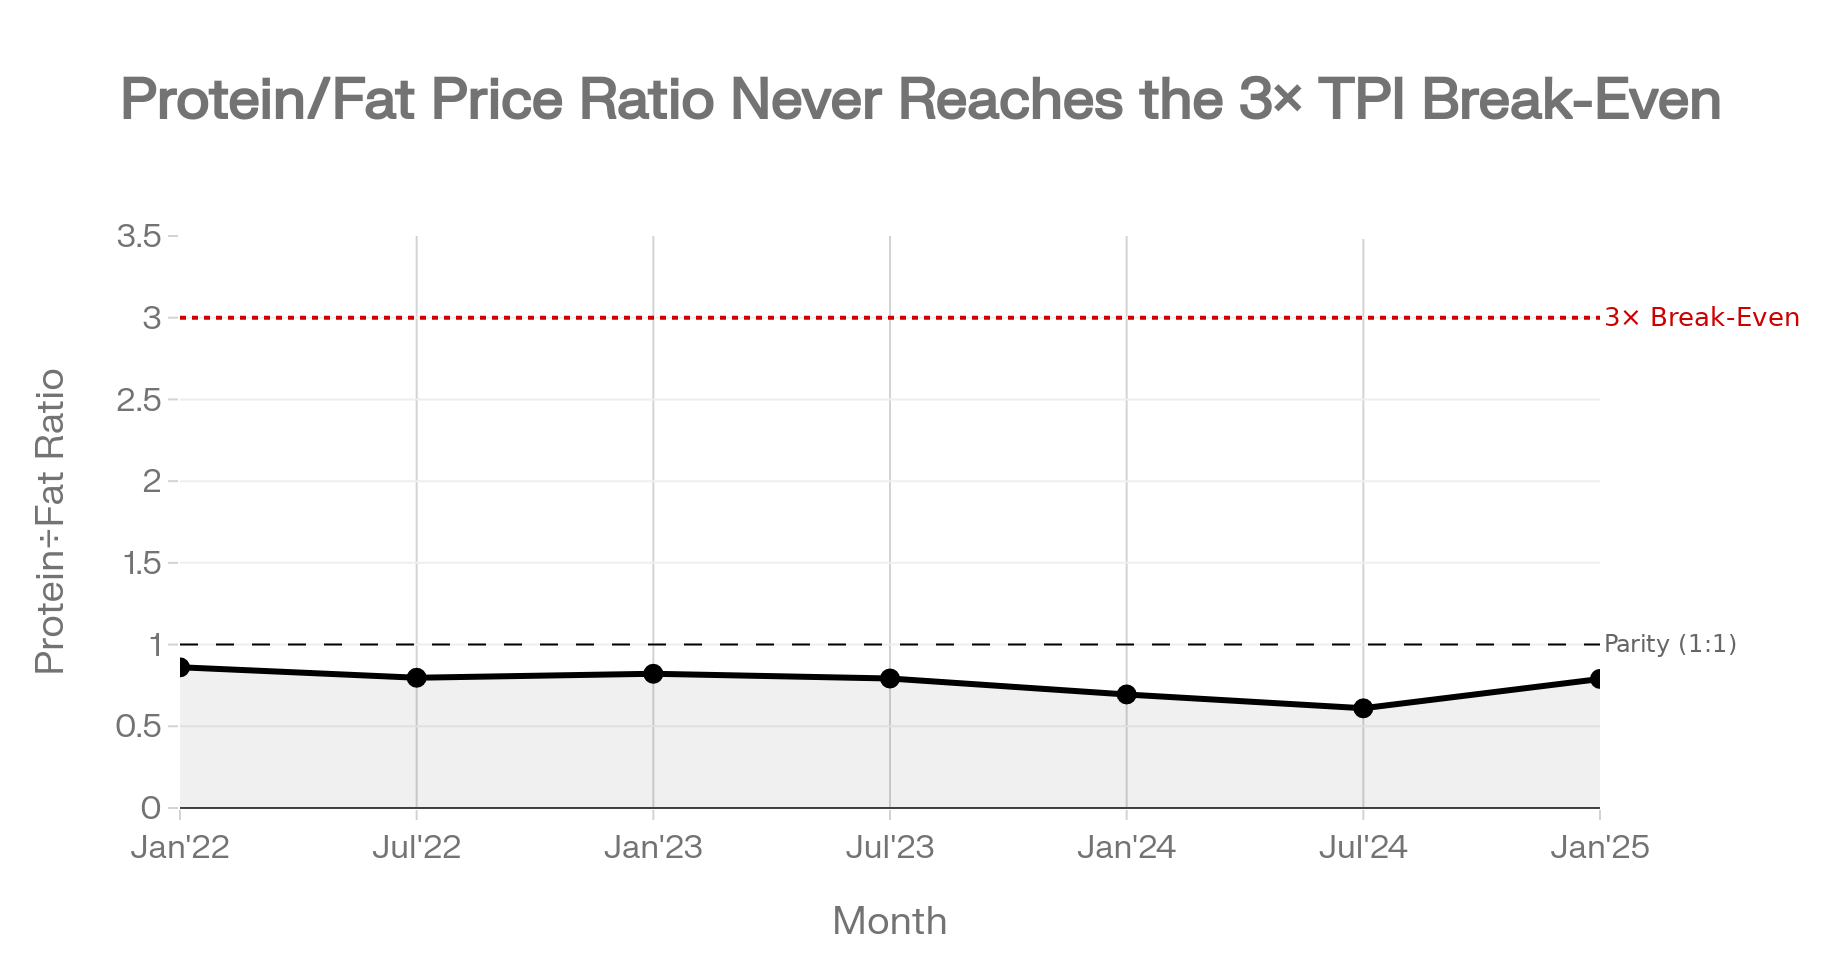
For the ratio herd to make more money on components, you’d need:
5 × protein price > 15 × fat price
So the break‑even is:
protein price ÷ fat price > 3.0
Unless your component grid effectively values protein at 3× the price of fat, you’re being paid to maximize total output, not to reshuffle the ratio.
| Scenario | Fat Price ($/lb) | Protein Price ($/lb) | Protein÷Fat Ratio | TPI Path Winner? |
|---|---|---|---|---|
| Current US avg (2024–25) | $2.95 | $2.33 | 0.79 | ❌ CFP wins by $35/cow |
| Protein-lean month | $3.00 | $1.80 | 0.60 | ❌ CFP wins by $45+/cow |
| Protein-heavy scenario | $2.80 | $3.50 | 1.25 | ❌ CFP still wins by $24.50/cow |
| Break-even threshold | $2.00 | $6.00 | 3.0 | = Tie |
| TPI math finally pays | $2.00 | $6.50+ | >3.0 | ✅ TPI path wins |
USDA Federal Order Class III/IV component data through 2024 and early 2025 doesn’t show anything remotely like that. Protein moves around. Some months it’s close to fat. For many months, it’s been cheaper. But nowhere does it sustainably hit 3× fat per lb.
Who Benefits When TPI Chases Protein?
After the 3× math sank in, Mark asked the question every producer should be asking: “If this doesn’t make sense for my milk check, who decided to do it — and who does it make sense for?”
It’s a fair question. And Holstein USA’s own numbers make it sharper than you’d expect.
TPI’s Own Economics Say Fat Is Worth More
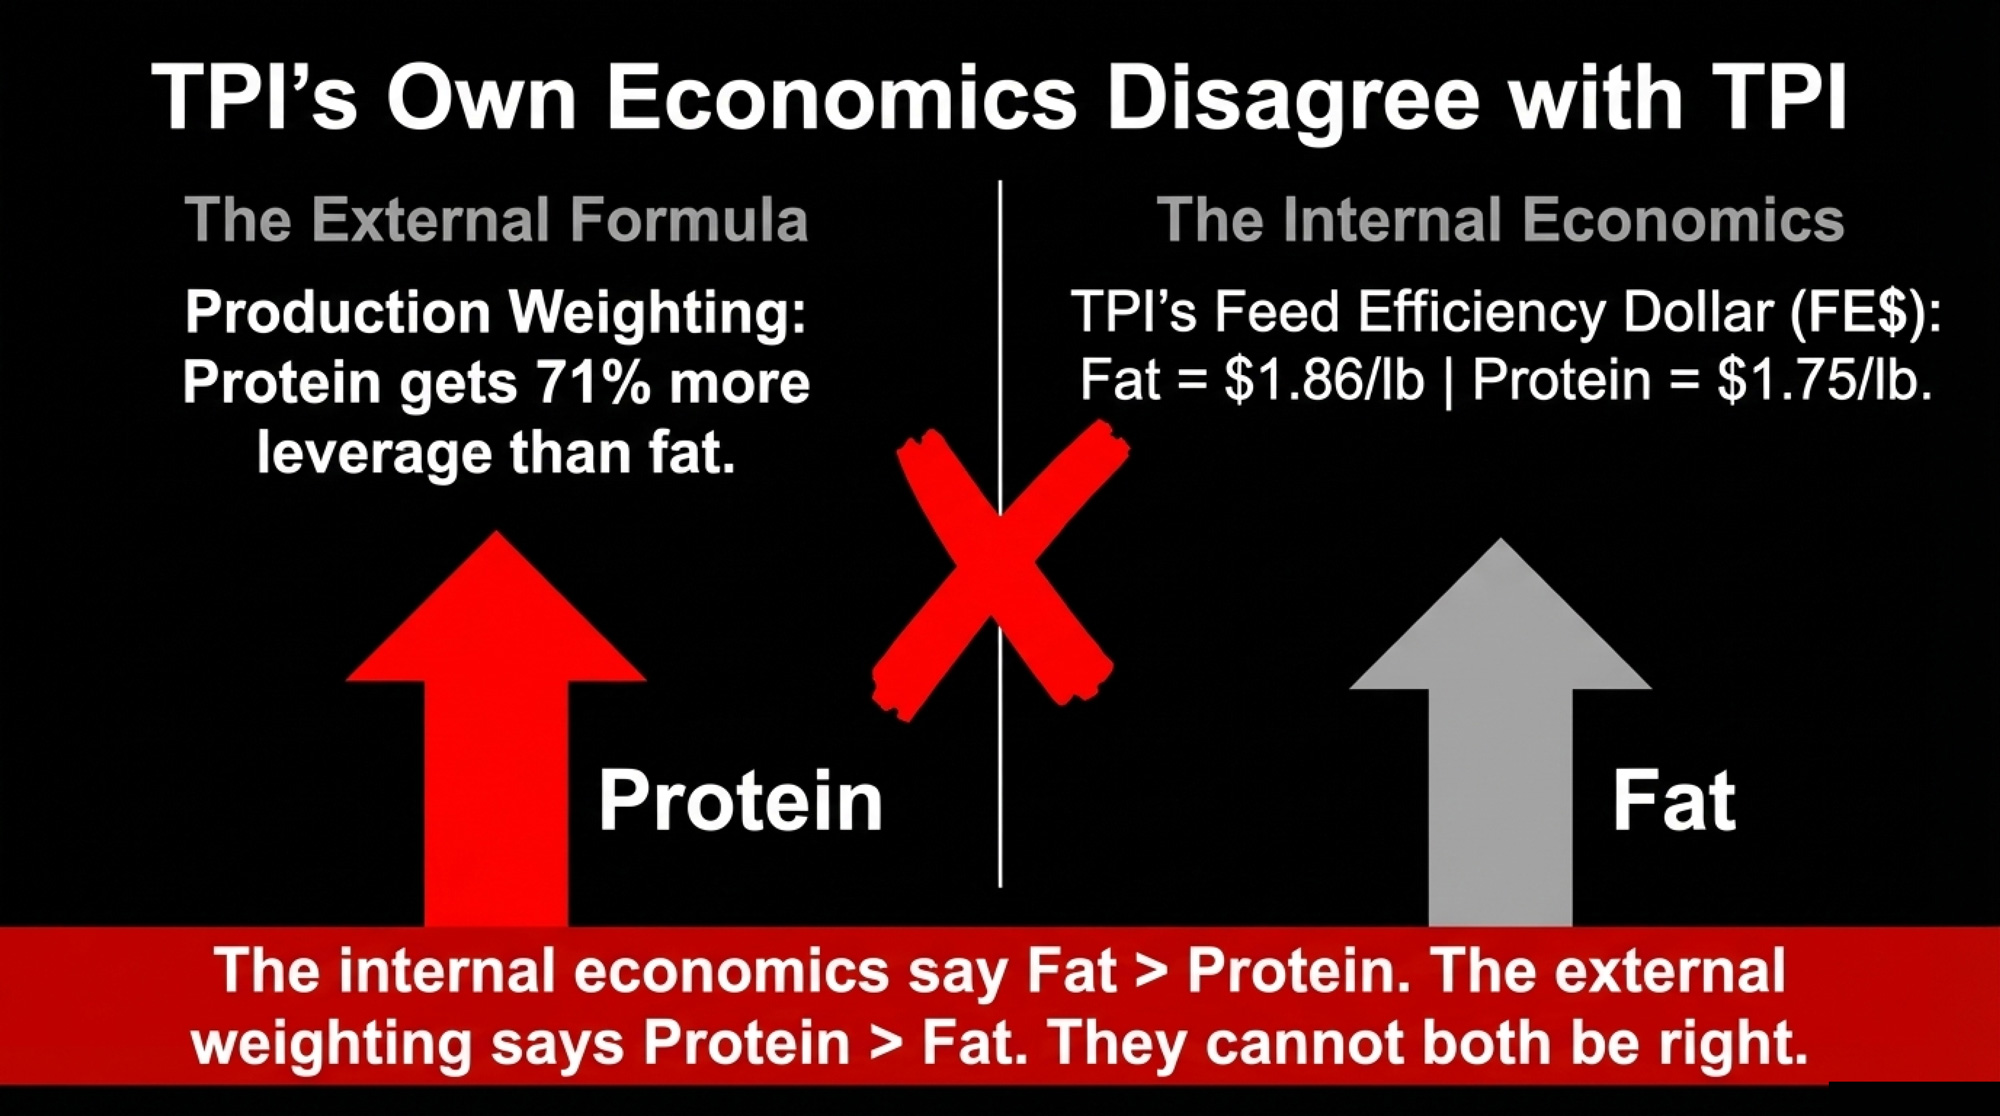
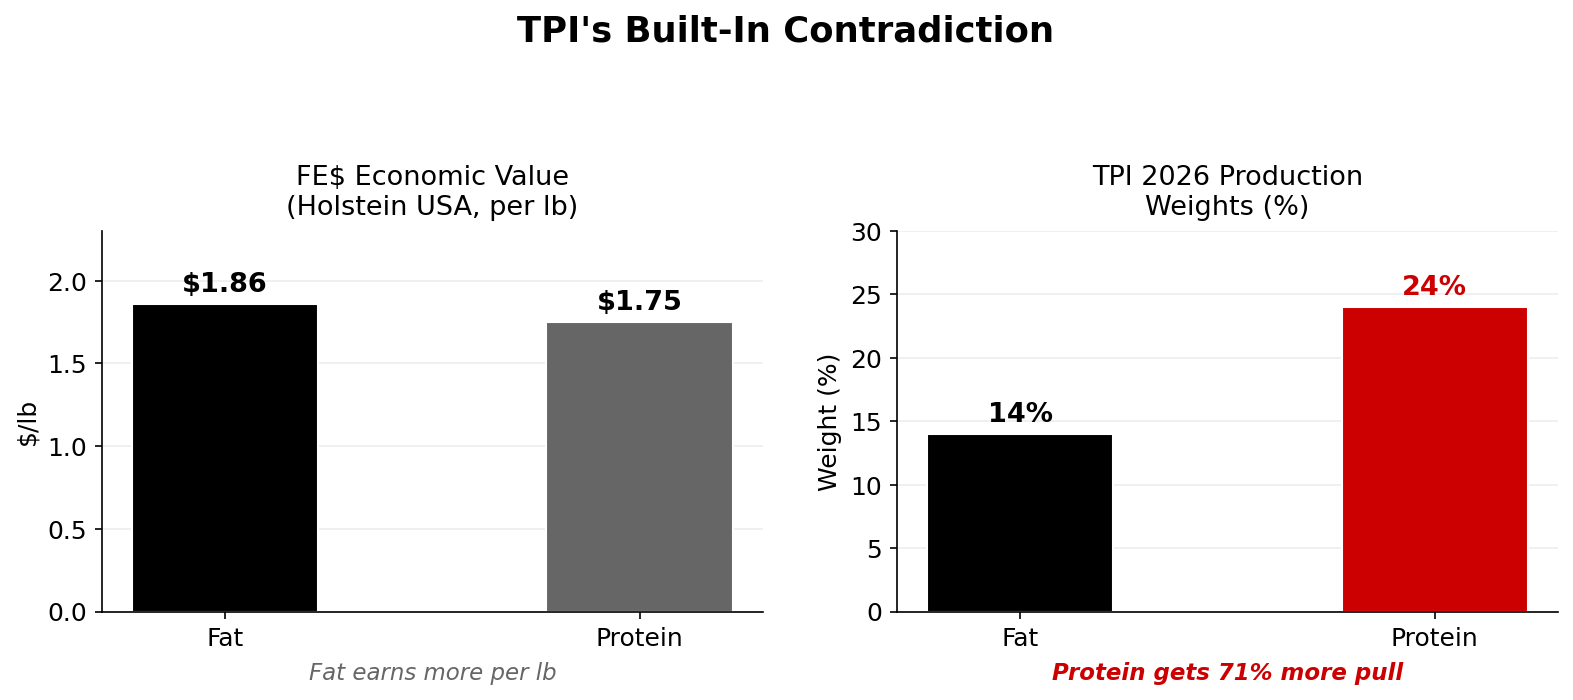
Holstein USA’s Feed Efficiency Dollar (FE$) formula — the economic engine inside TPI — uses these component values:
- Fat: $1.86/lb
- Protein: $1.75/lb
- Milk: –$0.0025/lb
That’s straight from Holstein USA’s published TPI formula page. Protein ÷ fat = $1.75 ÷ $1.86 = 0.94. In their own economic model, fat is slightly more valuable than protein.
But in the TPI production weighting, protein gets 24% vs fat’s 14% — a ratio of 1.71 favoring protein.
Read that again. The economics inside the formula say fat ≥ protein. The weighting applied on top of those economics values protein at 71% more than fat. Those two things can’t both be right at the same time.
And those FE$ component prices? Holstein USA’s own TPI materials show FE$ component values of $1.86 for fat and $1.75 for protein, tied to updated cheese‑market economic assumptions released since 2021. Whatever exact update cycle you use, the current published FE$ values still favor fat over protein — $1.86 vs $1.75. And compared to the April 2021 FE$ values ($1.55 fat, $1.73 protein), fat’s advantage has actually grown: fat jumped 20% while protein barely moved. The formula’s own economics are drifting toward fat even as the production weighting lurches toward protein. The FE$ values are net of feed cost, so they’re not directly comparable to AMS spot prices — but the direction is the same. In January 2025, USDA reported butterfat at $2.9460/lb and protein at $2.3267/lb, a protein/fat ratio of just 0.79. Whether you look inside the formula or outside it, fat keeps winning. The 24P:14F weighting doesn’t reflect that.
By contrast, USDA’s Net Merit 2025 update used current AGIL data and moved toward fat and away from protein. Same data agency, different conclusion.
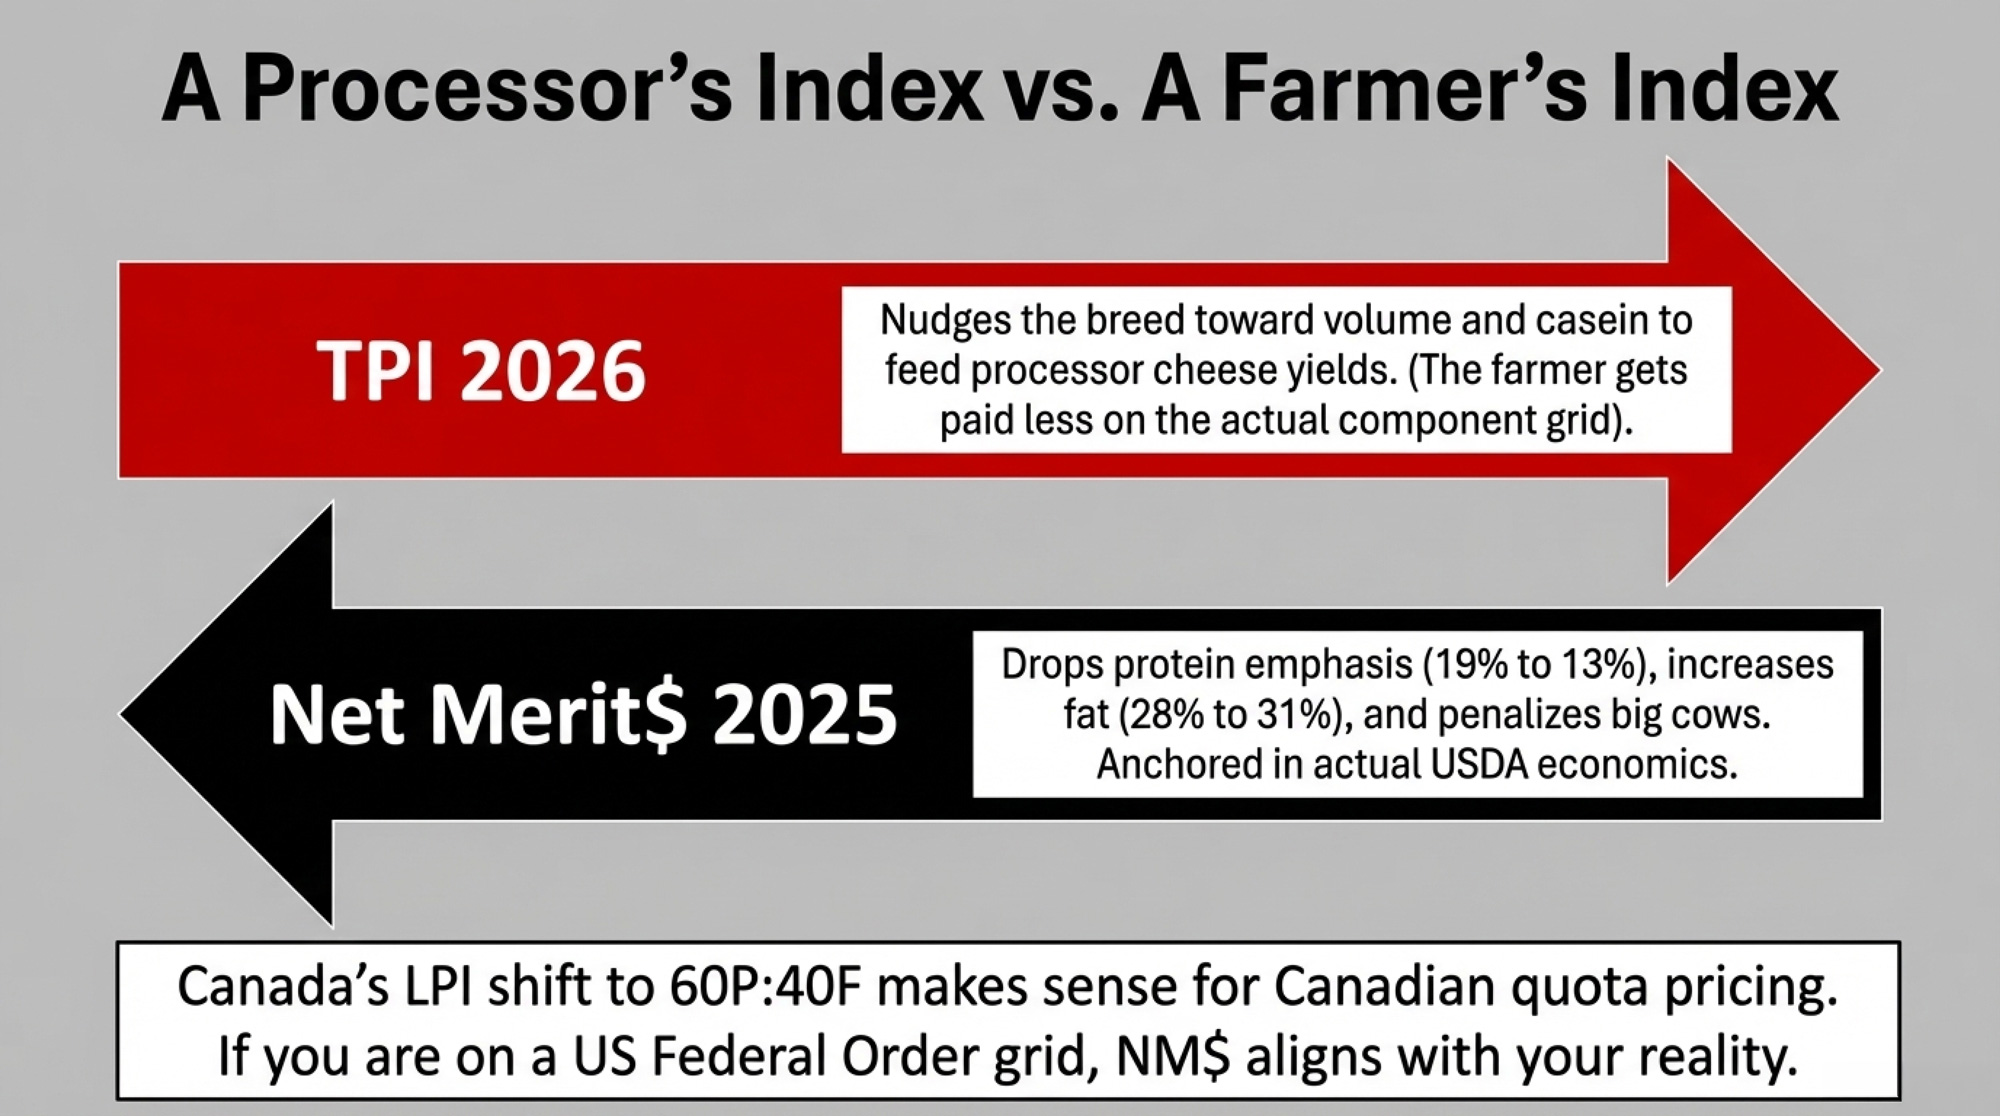
Is This a Processor’s Index or a Farmer’s Index?
Holstein USA’s stated rationale includes alignment with processor demand for casein and the observation that genetic gains for protein have lagged behind fat in recent years. That’s a processor‑supply argument — cheese plants absolutely want more casein per vat because it drives cheese yield.
But here’s where it gets uncomfortable: a farmer doesn’t get paid on cheese yield per vat. You get paid on the total pounds of fat and protein sold, at whatever the Federal Order grid says those pounds are worth. If TPI steers the breed toward protein at fat’s expense, processors get more of the component they want for cheese yield — while farmers may end up with fewer total component dollars per cow under the actual Class III grid.
The Bullvine’s own analysis of the component revolution showed that processors are already capturing a 12.5% cheese yield windfall from higher components, and asked the pointed question: Are farmers getting their fair share of that value?
That doesn’t mean there’s a conspiracy. It means TPI may be optimizing for a processor’s view of what the breed should look like, not necessarily for the farmer’s milk check. If you’re making breeding decisions based on TPI, you should know whose economics the formula is actually serving.
Why Such a Big Swing?
If the goal was to keep protein gains from falling too far behind fat genetically, a modest adjustment might make sense. Go from 19:19 to maybe 21:17. Nudge it.
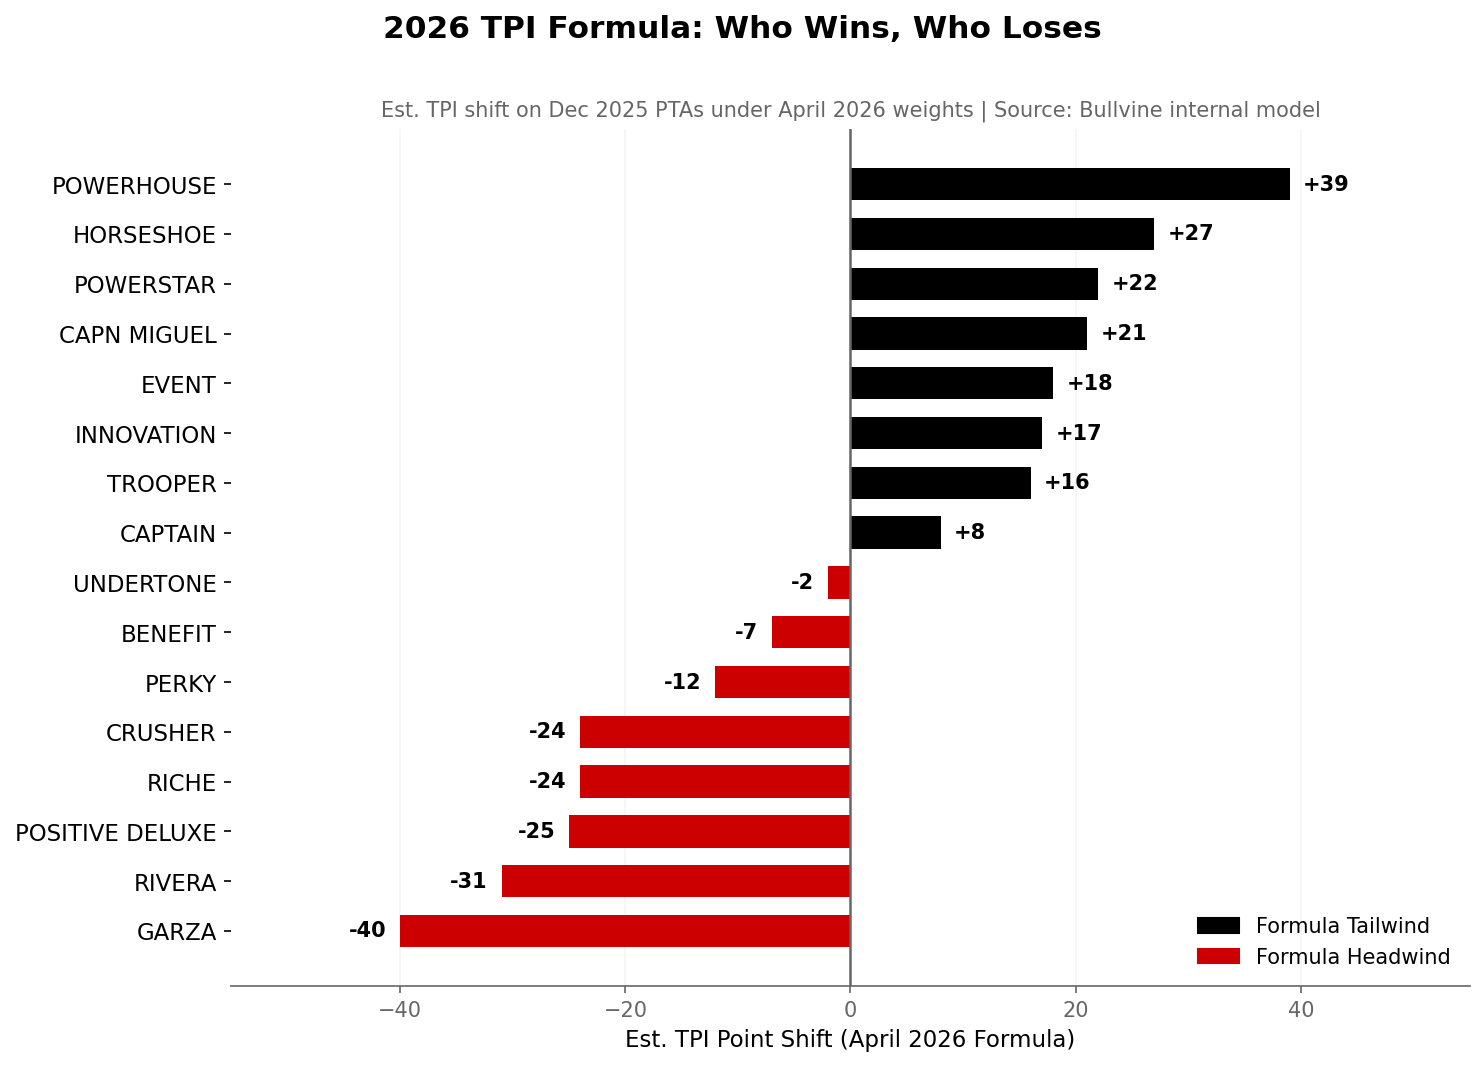
But 19:19 to 24:14 isn’t a nudge. It’s a 70% increase in protein’s leverage over fat inside the production slice. That’s the kind of magnitude that reshuffles bull rankings, shifts semen dollars, and — if enough herds follow — redirects the entire breed toward a different type of cow. (Read more: HORSESHOE Jumped 10 Spots. GARZA Slid From #2. The 2026 TPI Ranking Table Nobody Else Will Publish Before April 7.)
The question Holstein USA hasn’t clearly answered: if your own FE$ economics say fat ≥ protein, and AMS prices have only reinforced that since 2021, why did the production weighting move this far in the other direction?
Net Merit vs TPI 2026: Two Models, Two Directions
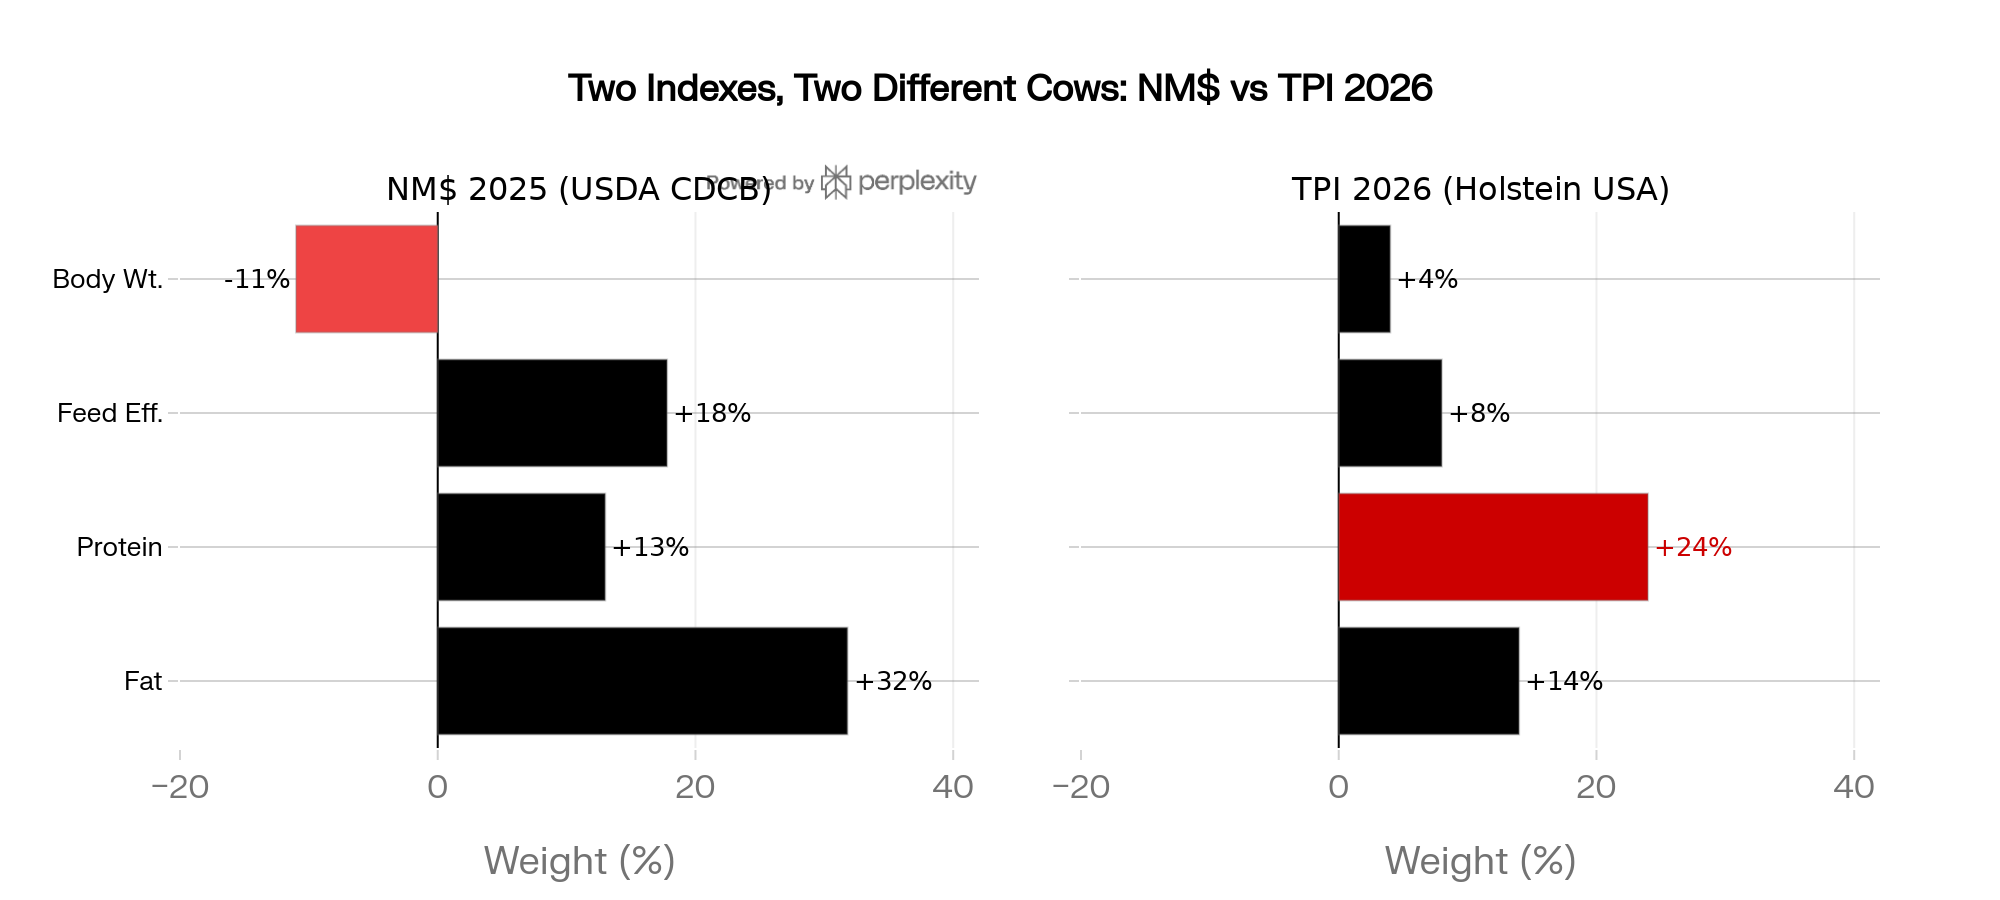
Mark’s not operating in a vacuum. While TPI’s production slice is shifting toward protein, Net Merit 2025 explicitly moved the other way, increasing the emphasis on fat and reducing the emphasis on protein to match observed component price trends.
Bullvine’s Net Merit 2025 analysis in “Net Merit’s $57 ‘Weight Tax’: How to Pick Holstein Bulls That Still Pay”shows:
- Protein’s share of NM$ dropping from 19.6% to 13.0%.
- Fat’s share is increasing from 28.6% to 31.8%.
- Feed Saved rising to a combined 17.8% of NM$ when you add Residual Feed Intake and the negative Body Weight Composite (a ‑11% emphasis that acts as a $57 “weight tax” per BWC point, per daughter).
In plain language:
- NM$ 2025: rewards fat strongly and penalizes big cows, aiming for smaller, efficient, high‑component animals that fit real feed and component markets.
- TPI 2026: increases protein leverage over fat within the production slice and continues to favor higher body weight more than NM$, nudging toward bigger, more fluid‑type cows.
Lactanet’s LPI shift for Holsteins back to 40F:60P is explicitly anchored to “evolving industry directions and milk pricing changes” in Canada and is expected to cause only “minor reranking” of top bulls. The Canadian system is internally consistent with its own pricing math.
The bottom line: the Canadian system is internally consistent with its market. NM$ 2025 is internally consistent with current USDA economics. TPI 2026’s production slice is inconsistent with its own FE$ values or recent AMS pricing data. That’s not a small discrepancy. It’s a question the industry should be asking out loud.
If thousands of herds follow this TPI signal, we don’t just change individual milk checks; we start re‑steering the Holstein breed toward more volume and less fat density over the next 10–15 years. That’s a directional shift for the whole breed, not just a personal quirk for one 500‑cow dairy.
| Index | Fat Weight | Protein Weight | Body Size Emphasis | Market Anchor |
| NM$ 2025 (USDA) | +31.8% | +13.0% | –11% penalty | AGIL/Federal Order economics |
| TPI 2026 (Holstein USA) | +14% | +24% | +4% (slight favor) | Processor casein demand |
| LPI 2026 (Lactanet CA) | 40% | 60% | Neutral/moderate | Canadian quota pricing |
| Cheese Merit (USDA) | Higher than NM$ | Lower than TPI | Negative (like NM$) | Class III cheese yield value |
The Turn: When Mark Stopped Letting TPI Drive
By the end of that kitchen‑table session, Sara hadn’t told Mark to throw TPI in the garbage. She just forced a role change.
Before this spring, Mark treated TPI as the main definition of “good bull.” If a bull climbed the list, he needed him in the tank. If a bull slid, he wondered if he’d made a mistake.
The hardest part wasn’t the math. It was the social pressure.
When a bull is all over social media and climbing the TPI list, it feels like a mistake not to use him. That pressure is real. But a bull rising because a formula changed — not because his daughters produce more total components or more dollars under your grid — isn’t a signal. It’s noise.
After walking through the 70% protein leverage inside 24P:14F, the Year‑5 scenario math, the $35/cow/year gap at realistic component prices, the 3× protein/fat break‑even that the market’s never touched, the contradiction between TPI’s own FE$ economics and its production weighting, and the biological reality that high‑protein selection leans toward more volume, Mark could see one thing clearly:
“If I let TPI steer my breeding program, I’m not actually breeding for the cow my milk check pays best. I’m breeding for the cow the index designer likes.”
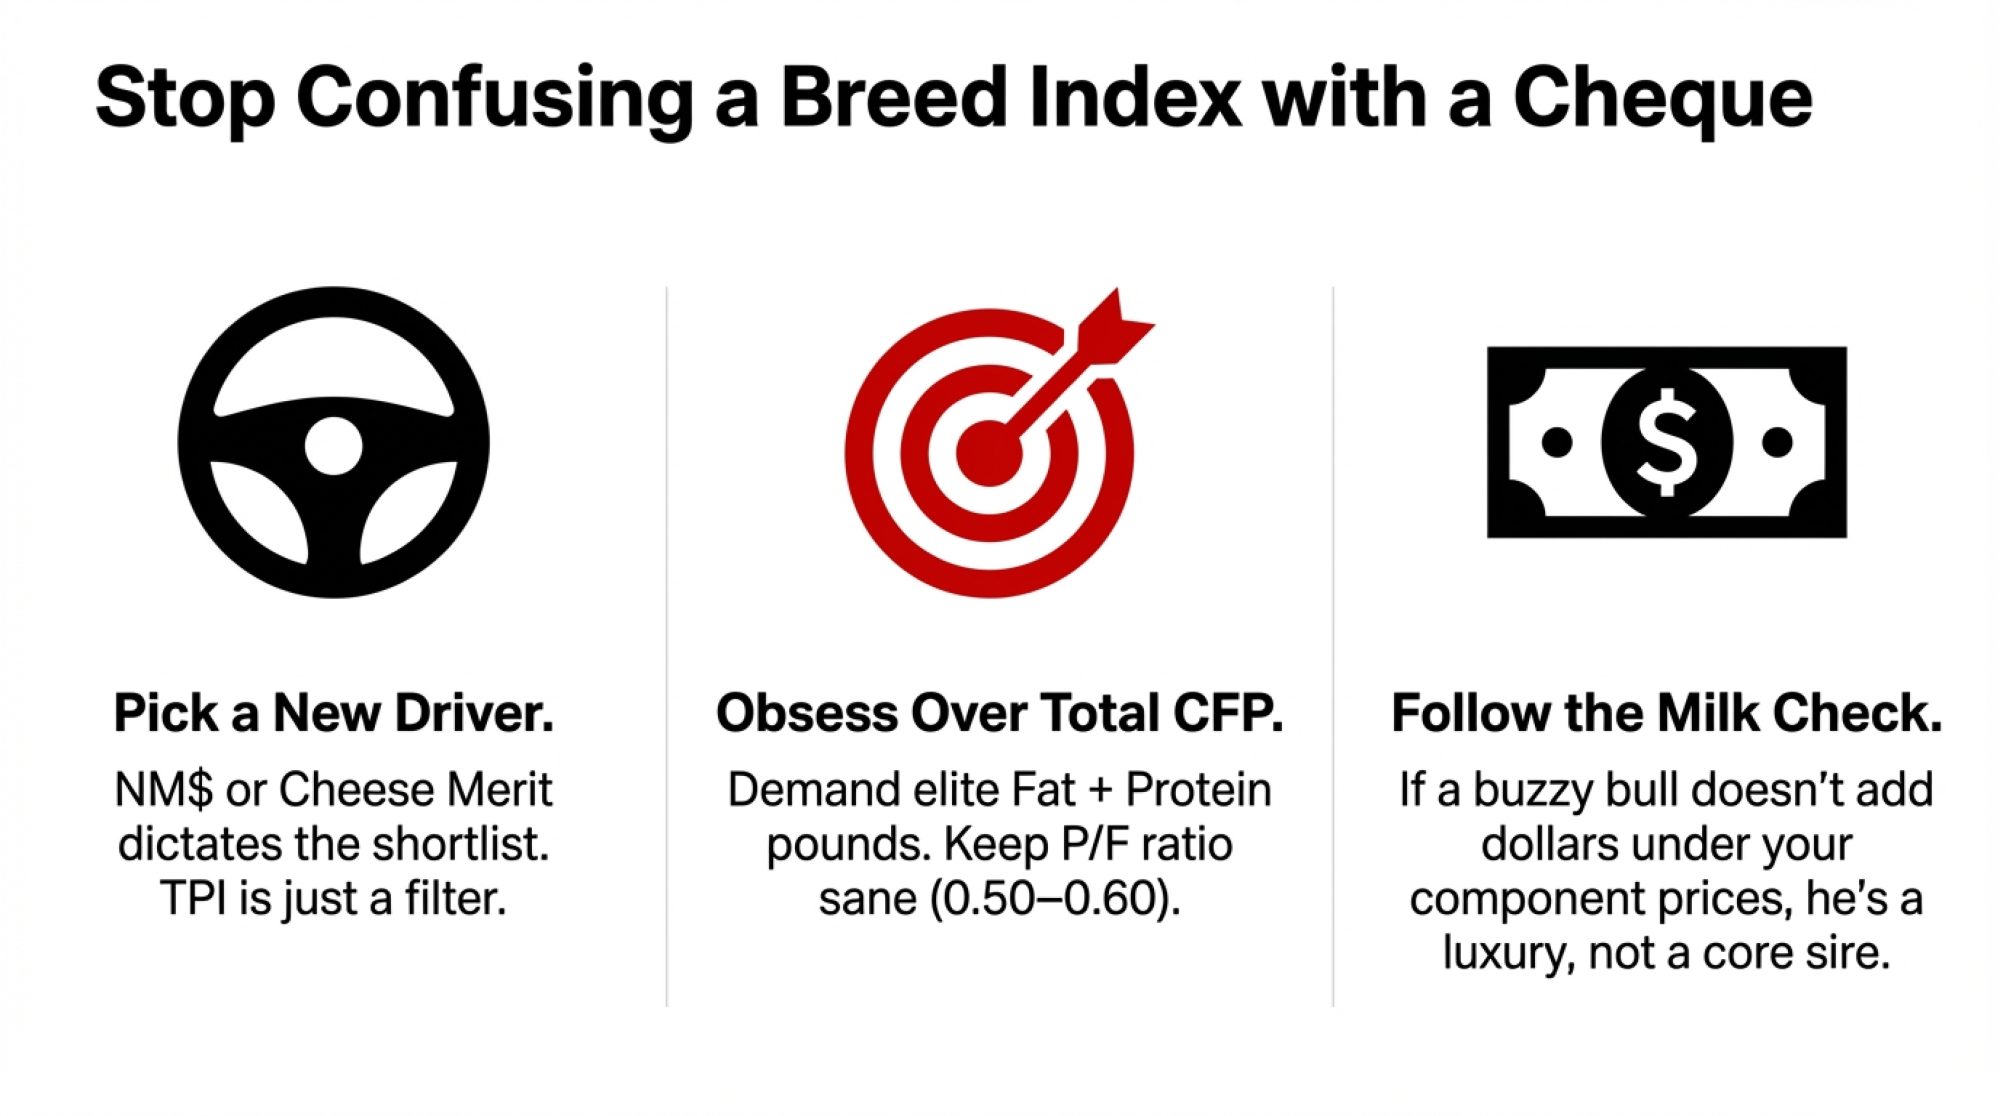
So he made three quiet decisions for 2026:
- Pick his steering wheel. NM$ (or Cheese Merit for his Class III plant) now decides which bulls make it to the short list; TPI is a filter, not the boss. If you want to understand how NM$, Cheese Merit, and the other CDCB indexes actually work — and why the April 2025 NM$ update already shifted weight toward fat and away from protein — the Bullvine’s “Net Merit’s $57 ‘Weight Tax’: How to Pick Holstein Bulls That Still Pay” walks through the new weights and practical filters in detail.
- Stay obsessed with total CFP. Every bull on his “heavy‑use” list has to be elite for fat + protein pounds, with P/F in the 0.50–0.60 band. The ratio‑pretty but mid‑pack CFP bulls get used carefully, not across the whole herd.
- Let his milk check, not the buzz, define success. If a bull looks great on high‑TPI slide decks but doesn’t add more dollars per cow under Mark’s own fat and protein prices, he’s a luxury, not a core sire.
He didn’t burn down his program. He just stopped confusing a breed index with a cheque.
The irony? The genetics revolution that doubled Holstein milk production over 50 years was driven by the same kind of concentrated sire pressure Mark was about to repeat unthinkingly — a story the Bullvine unpacked in “Four Bulls That Changed the Holstein Breed: Genius, Gambles, and the Price We’re Still Paying.”
The Playbook: 30/90/365 Days to Get Out of the TPI Protein Ratio Trap
You don’t have to change everything overnight. You have to stop reinforcing the bias that’s quietly bleeding your components and reshaping your herd type.
In the Next 30 Days: Stop Digging
1. Audit your top bulls for P/F bias
- Pull the 5–10 sires you’ve used the most in the last 12 months.
- For each, jot down PTA Fat, PTA Protein, total CFP (fat+protein), and P/F (protein ÷ fat).
- Count how many of your heavy‑use bulls are P/F ≥0.65 and not in the very top tier for total CFP.
If that’s more than a couple, you’re already leaning into the ratio side of the trap.
2. Freeze new orders on extreme ratio bulls
- Any bull that’s P/F ≥0.65 and only average for CFP goes on a “no reorder” list until you’ve rebalanced.
- Use remaining straws on lower‑value cows or recips if you like; don’t keep filling the tank.
3. Build a CFP‑first short list from a profit index
Tell your rep exactly what you want:
- Filter bulls first on NM$, Cheese Merit, or your co‑op’s profit index, not TPI.
- Within that filtered list, sort bulls by Fat PTA + Protein PTA.
- Keep bulls with P/F roughly 0.50–0.60 and decent PL/DPR (or Herd Life/Fertility in Canada).
If a bull is high TPI and top‑end CFP under your grid, great. If he’s only high TPI because the formula loves his P/F, be cautious.
4. Check your actual fat and protein prices
Grab your last milk check and write down:
- Fat price ($/lb)
- Protein price ($/lb)
Then do one quick ratio: Protein ÷ Fat.
If that number is nowhere near 3.0, a pure P/F chase isn’t justified by your pay structure. In the most recent US Federal Order Class III/IV data from 2023–early 2025, it sits well under 2.0 and often between about 0.6 and 1.2.
In the Next 90 Days: Rebalance Without Blowing Up Your Program
5. Watch the cow type you’re breeding
Look at your last group of fresh heifers:
- Are your best “new genetics” cows the ones with the highest components per cwt, or the highest volume?
- Are you seeing more long, big‑framed, fluid‑type heifers in the pipeline than you expected?
If you’re on a component grid, your index choices shouldn’t slowly turn your herd into cows that fit a fluid market you don’t sell into.
6. Re‑tier your sires by role
Split your bull battery into:
- Core sires (60–70% of matings): High profit index, high CFP, P/F in the 0.50–0.60 range, solid fitness.
- Specialty sires (10–20%): Extreme type or high‑TPI ratio bulls you still want a little of — used intentionally, not across the board.
- Clean‑out sires: Ratio‑heavy or weak‑CFP bulls; finish their straws on lower‑value cows or phase them out.
This keeps your main genetic direction pointed at components and cow style that actually pay, while still letting you play with a few favorites.
7. Re‑score your genomic heifers with a custom index
Ask your genetic provider to compute a simple custom score:
- Custom score = 1.0 × Fat PTA + 0.8 × Protein PTA + fertility/survival credits (PL, DPR, Herd Life).
Use that score for replacement vs beef decisions and prioritizing heifers for sexed semen. If two heifers are similar, the one whose parents are genuine component earners under your grid wins over the one whose parents look good on P/F.
In the Next 365 Days: Let Your Own Data Judge the Indexes
8. Tag daughters by sire group and track components
Pick a few bulls as “test cases”:
- Group R (ratio): 2–3 bulls with high P/F that gained TPI spots in April 2026.
- Group C (CFP): 2–3 bulls with strong total fat + protein and balanced P/F.
For daughters freshening over the next year, tag them by sire group in your records and track fat lb, protein lb, and CFP over 305 days (or good projections). You’re not trying to do a PhD. You want enough signal to see whether your ratio group or your CFP group is doing more work for your cheque.
9. Do a simple “by‑sire” milk check sanity check
Once you’ve got at least a dozen daughters per group, use your actual component prices from the past 12 months:
- Calculate $/cow/year from fat + protein for Group R vs Group C.
If Group C cows are clearly ahead by more than $20–30/cow/year on components and aren’t worse on fertility/survival, that’s your own proof that CFP bulls beat P/F bulls under your grid.
If Group R genuinely beats Group C under your grid and costs, you might be one of the rare operations where a strong protein tilt actually pays. Either way, you’re making decisions off your own data, not somebody else’s formula.
10. Build your own index — and stick to it
Sit down with your advisor or rep and formalize your own weights for fat, protein, fertility, longevity, and maybe feed efficiency. Have them build a custom index in their software that matches your milk check and cull costs rather than TPI’s 24P:14F weights. Commit: new bulls get chosen on that index first, then filtered by TPI, type, or show traits as needed.
At that point, you’re not arguing with Holstein USA or Lactanet. You’re just letting them have their opinion while you follow your money.
What This Means for Your Operation
- Run the P/F sanity check on your lineup. This week, pull the main bulls you’re using and calculate P/F and CFP. If most of your semen is going to P/F ≥0.65 bulls who aren’t top‑end CFP, you’re not maximizing output — you’re redistributing it away from fat instead of maximizing total fat + protein sold.
- Watch the cow type you’re breeding. Your sire choices today decide whether your 2036 herd is built for a fluid market or a component market. If your plant still pays more per pound for fat than protein, you don’t want your index pushing you toward big, fluid‑style cows.
- Your milk check decides your index — not the other way around. A breed index can move toward protein without your grid ever justifying the shift. If your cheque still pays more per pound for fat than for protein, you’re being paid to maximize total components, not to chase a ratio.
- Use the 3× rule as a hard brake. If protein on your check isn’t worth anywhere near three times fat per lb — and in most US Federal Order markets it won’t be — a strong P/F chase won’t pay under the kind of “15 fat for 5 protein” genetic trade the 24P:14F world incentivizes.
- Ask whose economics the index is actually serving. Holstein USA’s own FE$ values put fat at $1.86 and protein at $1.75 — fat wins. But the production weights say protein is 71% more important. If the formula’s own economics don’t justify the weighting, ask who benefits from the direction the breed is being steered.
- Don’t assume Canada’s direction validates the US move. Canada’s formula makes sense for Canadian quota‑based component pricing. Copying the protein pivot without copying the pricing logic is how you end up selecting for the wrong cow in the wrong market.
- Do one contract‑check in the next 30 days. Before you order your next semen, pull your last 12 months of checks and write down average fat and protein prices. Divide protein by fat. If that ratio doesn’t look anything like the weights inside the index you’re following, adjust how you use that index.
Key Takeaways
- Directional shift, not a tweak. If a 500‑cow herd follows the 24P:14F TPI signal hard for five years, scenario math shows it can give up around 15 lb fat per cow per year to gain only about 5 lb protein — and end up roughly $35/cow/year behind a CFP‑anchored strategy under realistic US Federal Order component prices.
- Market vs formula mismatch. Protein would have to be worth more than 3× fat per pound for that kind of trade to win on components alone. Recent Class III/IV data from 2022–2024 haven’t come close.
- The formula contradicts its own economics. TPI’s FE$ engine values fat at $1.86/lb and protein at $1.75/lb — fat wins. But the production weighting gives protein 71% more leverage than fat. The internal economics and the external weighting point in opposite directions.
- Follow the incentives. TPI’s stated rationale includes processor demand for casein. That’s a cheese‑yield argument, not a farmer‑profitability argument. Your milk check pays on total fat + protein sold, not on cheese yield per vat.
- Paper vs tank. It’s now possible for a herd to look better on paper without actually selling more total pounds of components. That’s exactly what happens when a formula rewards a ratio instead of total output.
The Bottom Line
One question matters more than any list or formula: What did your plant actually pay per pound for fat and per pound for protein over the last 12 months — and do the bulls you’re buying make more money under those numbers, or under someone else’s?
Complete references and supporting documentation are available upon request by contacting the editorial team at editor@thebullvine.com.
Learn More
- The Holstein Bulls Bleed Pregnancies in Arizona Heat – Gain an immediate edge in your summer reproduction program. This breakdown delivers the specific DC305 filters needed to expose the high-NM$ bulls failing your herd in the heat, arming you with a $360-per-daughter reproductive rescue plan.
- Bred for $3 Butterfat, Selling at $2.50: Inside the 5-Year Gap That’s Reshaping Genetic Strategy – Master the 5-year genetic timing gap before your next breeding cycle. This analysis exposes the mismatch between $3 butterfat breeding goals and $2.50 market realities, delivering the long-term positioning strategy needed to protect your future margins.
- Gene Editing: The Next Frontier in Dairy Cattle Breeding – Prepare for the most significant disruption in a generation. This technical roadmap reveals how gene editing for heat tolerance and disease resistance could bypass decades of traditional breeding, delivering an unfair advantage to those ready to embrace the next frontier.
 The Sunday Read Dairy Professionals Don’t Skip.
 The Sunday Read Dairy Professionals Don’t Skip.
Every week, thousands of producers, breeders, and industry insiders open Bullvine Weekly for genetics insights, market shifts, and profit strategies they won’t find anywhere else. One email. Five minutes. Smarter decisions all week.