


They announced 12 million tons of soybeans. Shipped 332,000. That’s 2.7%—and the gap between those numbers is where farms go broke.
Back in October, the headlines announced that China had committed to purchasing 12 million tons of U.S. soybeans. By mid-November, USDA export data told a different story: just 332,000 tons had actually been shipped. For operations making real financial commitments based on trade optimism, that gap is everything.
It’s the elephant in the room at every co-op meeting, yet nobody wants to say it out loud: the headlines are lying to us. Not maliciously, maybe. But consistently.

This isn’t a one-off. When the Phase One trade agreement was signed back in January 2020, China committed to purchasing $80.1 billion in U.S. agricultural goods over two years. The Peterson Institute for International Economics tracked what actually happened: $61.4 billion in purchases. That’s about 77% of the agricultural target and just 58% overall.
Whether that’s a freestall expansion in Wisconsin or new milking equipment out in the Central Valley—these numbers matter enormously when you’re penciling out that loan.

The Promise-Delivery Gap: 2.7% to 77%. That’s the range of what trade has actually delivered in recent years. It’s a wide spread—and it’s the reality farm financial planning needs to account for.

| Risk Factor | Phase One (2020-2021) | China Soybean (2025) | What Farmers Assumed |
|---|---|---|---|
| Historical Delivery Rate | 64-87% delivery | 2.7% delivery | 100% delivery |
| Market Dependency | Medium – diversified buyers | High – China-specific | Low – “”guaranteed deal”” |
| Price Impact per Deal | $0.15-0.25/cwt estimated | $0.35/cwt confirmed | Price increases expected |
| Timeline to Farm Impact | 90-180 days | 30-90 days | Immediate benefit |
| Cooperative Protection | Absorbed losses initially | €149M losses, mergers | Co-op will handle it |
| Individual Farm Defense | Limited – most expanded | DMC available if enrolled | No action needed |
The Pattern Nobody Talks About
Trade announcements follow a consistent pattern. Farmers who’ve watched a few cycles are starting to read them differently than the headlines suggest.
The Phase One trajectory:
- 2020: Deal signed with $200 billion in purchase commitments over two years
- 2021-2022: China’s agricultural imports from all sources surged to record levels; U.S. exports to China hit approximately $41 billion
- 2023-2024: Import volumes declined as Phase One commitments expired and China diversified its suppliers
- 2025: New tariff escalations with announced deals delivering at single-digit percentages

Here’s what makes this tricky: those 2021-2022 numbers were real. China genuinely did purchase record agricultural volumes. Processors genuinely did see elevated component prices. You probably saw the improvement in your own milk check.
The data supporting expansion decisions wasn’t fabricated—it was completely accurate for that specific window.
The question most operations didn’t ask was whether those volumes represented a sustainable baseline or a cyclical peak. That’s a hard question to ask when the current numbers look great, and your lender’s nodding along with the business plan.
Why 2022 Was a Peak, Not a Floor

Several indicators were available in real-time. Here’s what the data was showing:
African Swine Fever recovery was completing. China’s hog population lost roughly 40% of its sow inventory in 2018-2019, according to OECD analysis. The rebuilding phase drove massive feed imports through 2021. By early 2022, Iowa State University’s Ag Policy Review documented that herd recovery was largely complete. That import surge had an endpoint built in.
Phase One commitments expired December 31, 2021. The agreement was a two-year commitment with a hard stop date. After expiration, continued purchases became voluntary.
China’s dairy self-sufficiency targets were public. The Chinese government explicitly targeted 70% dairy self-sufficiency. By 2022, according to Hoogwegt analysis, they’d reached 66% and climbing. When you’re managing your fresh cow nutrition and component production here, remember—they’re building their own capacity over there.
Economic growth projections were declining. The Asian Development Bank projected that China’s GDP growth would slow from around 8% in 2021 to 5% by 2024-2025.
These indicators were available to anyone looking. The challenge is that recent strong performance tends to overwhelm forward-looking warning signals. That’s an understandable response to good data, not poor decision-making.
How This Hits Your Milk Check
Trade policy disruptions create cascading effects that move from Washington to your milk check faster than most realize.
The 2025 tariff escalation:
When retaliatory tariffs on U.S. dairy into China escalated from 10% to 125% between February and April, the impacts were immediate:
Whey markets contracted sharply. China had been taking about 42% of U.S. whey exports according to USDEC data. When that market closed, domestic supply backed up and prices compressed. If you’ve been watching whey premiums in your component pricing, you’ve felt this.
Lactose faced similar pressure. With China holding roughly 72% of the U.S. lactose export market share, the tariff wall forced processor restructuring.
USDA revised price forecasts downward. Class III projections dropped by about $0.35 per hundredweight.
In practical terms: For a typical 1,000-cow operation producing around 26,000 pounds per cow annually, that $0.35 reduction works out to roughly $91,000 in annual revenue. That affects replacement heifer decisions, equipment upgrades, everything.

University of Wisconsin-Madison dairy economists project that net farm income across the U.S. dairy industry could decline by $1.6 to $7.3 billion over the next four years due to tariff disruptions, with individual farms facing potential income reductions of 25% or more.
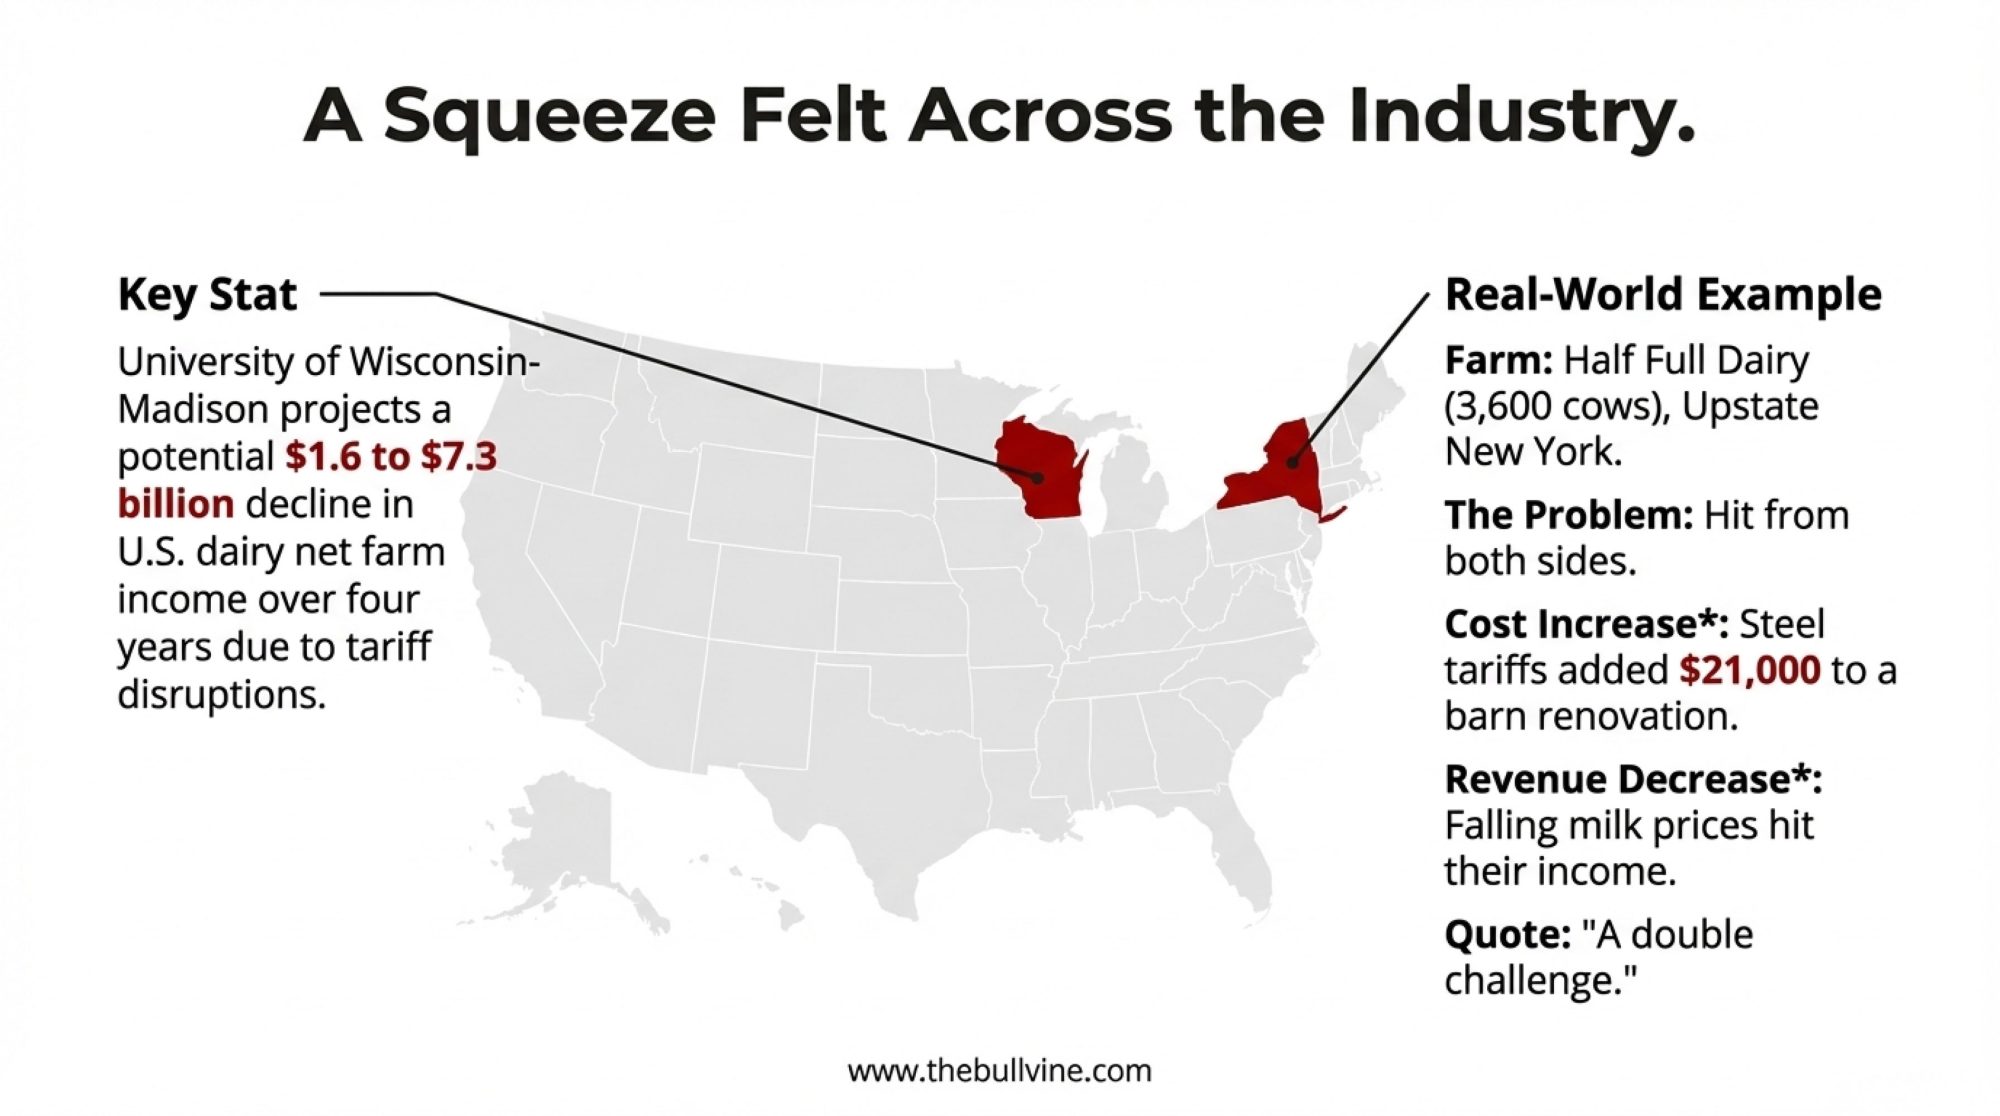
Real example: Half Full Dairy in upstate New York—a 3,600-cow operation run by AJ Wormuth—got hit from both sides. Steel and aluminum tariffs added $21,000 to a barn renovation order while milk revenues fell. As Wormuth told reporters in April, they’re facing “a double challenge” in which they can’t raise prices while expenses keep rising.
Whether you’re running a 200-cow grazing operation in Vermont or a 5,000-cow dry lot in New Mexico, that squeeze feels familiar.
What’s Really Happening with Cooperatives
Common assumption: cooperative membership provides meaningful insulation from trade volatility.
Reality: cooperatives face the same structural pressures as individual farms, just with less flexibility to respond.

Case study: FrieslandCampina-Milcobel merger
FrieslandCampina reported a €149 million loss in 2023. Milcobel posted an €11.6 million loss. These weren’t management failures—they reflected a structural challenge.
The cooperative bind: They must accept all member milk regardless of market conditions. That’s the deal. But when processing capacity gets built for peak-year volumes and deliveries decline, cooperatives face rising per-unit costs with limited ability to adjust.
Unlike private processors who can exit markets quickly, cooperatives are bound by charter obligations. The result: they absorb losses to maintain member pricing, eroding equity over time. When losses become unsustainable, mergers or sales become the path forward.
We saw this with Fonterra’s 88% member vote to sell consumer operations to Lactalis this past October.
Rabobank dairy analyst Emma Higgins put it directly: “For dairy cooperatives, the challenges are even more complex, as lower milk intake generally coincides with members withdrawing capital.”
The counterpoint: Some cooperatives have navigated better. Agropur achieved a significant turnaround by aggressively restructuring its debt and refocusing on high-margin segments such as cheese and specialty ingredients. The model isn’t doomed—but it requires proactive management.
Your cooperative’s financial health directly affects your returns. Ask questions at the next annual meeting.
What Smart Operations Are Doing
Several practical approaches keep coming up:
Applying historical execution rates. Rather than planning for 100% delivery, they’re discounting based on historical performance. If Phase One delivered 77%, that becomes the planning assumption.
Stress-testing against zero deal impact. Before expansion decisions, they’re modeling, assuming the deal contributes nothing. If viability depends entirely on the deal working, that’s a different conversation with your lender and family.
Maximizing DMC enrollment. Dairy Margin Coverage provides protection when margins compress—and it doesn’t depend on trade promises. It depends on actual market prices.
Maintaining working capital flexibility. Operations that kept debt-to-asset ratios conservative have more options when markets shift. It’s not pessimism—it’s room to maneuver.
Exploring market diversification. Direct sales, specialty products like organic or A2, and regional processor relationships. Not for everyone, but it’s optionality that didn’t exist a decade ago.

Your 48-Hour Playbook for Trade Announcements
When the next deal gets announced, work through these steps:
Step 1: Check the History (30 minutes)
The Peterson Institute maintains a tracker showing the promised versus actual purchases under Phase One. Before reacting to any announcement, look at historical delivery rates.
The calculation: New promise × historical execution rate = realistic delivery estimate.
Phase One ran at 58-77%. The 2025 China soybean promise delivered 2.7%. That range gives you boundaries for scenario planning.
Step 2: Model for Zero (1-2 hours)
Have your accountant run a 12-month cash flow assuming no additional revenue from the announced deal.
Questions to answer:
- What’s my debt-service-coverage ratio? (Target: 1.25+ per Farm Credit guidelines)
- Can I cover debt service if export demand doesn’t materialize?
- How many months can working capital sustain at reduced prices?
Document what you find. This strengthens lender conversations later.
Step 3: Verify DMC Status (45 minutes)
Contact your local FSA office and confirm Dairy Margin Coverage enrollment. If open and you’re not enrolled, evaluate immediately.
The timing trap: Trade announcements create optimism. Farmers skip enrollment. Then deals underperform, prices fall, and the window is closed. The 2025 enrollment closed on March 31.
The protection is most valuable when purchased before you think you need it.

Principles That Hold Up
Announcements are risk factors, not guarantees. The gap between announcement and execution is where farm financial planning actually lives.
Peaks aren’t baselines. Strong recent performance may represent cyclical highs, not sustainable floors. Expansion decisions financed over 10-20 years should be stress-tested across multiple scenarios.
Understand your cooperative’s position. Their balance sheet health affects your returns. Request financial information.
Maintain optionality over optimization. Operations preserving flexibility have more choices when conditions shift. There’s value in leaving room, even if it means not maximizing every metric.
Document your process. Whether you expand or hold back, a record of analysis strengthens lender conversations and demonstrates sound management.

The Bottom Line
Trade promises that deliver between 2.7% and 77% of announced targets raise legitimate questions about how agricultural trade policy functions. Whether the gap reflects deliberate choices or institutional limitations is hard to say.
What’s clear: farmers absorb the consequences while having limited ability to influence outcomes.
This doesn’t mean trade agreements lack value. U.S. dairy exports remain significant—Mexico, Canada, and other markets provide important revenue. The question is how to make sound decisions when the market outlook depends on commitments with highly variable execution.
Until the product ships and checks clear, a trade announcement is a press release, not a market.
The framework we covered—checking history, stress-testing for zero, securing DMC—provides concrete steps within 48 hours of any announcement. None guarantees good outcomes, but it positions you for realistic scenarios rather than headline optimism.
The fact that dairy farmers need a defensive playbook for government trade promises tells us something about the system. Whether by design or neglect, the pattern is clear: promises at 100%, delivery between 2.7% and 77%, farmers navigating the gap.
Until that changes, treat every announcement as a risk to manage—not an opportunity to bet the farm on.
That may sound conservative. Given the track record, it’s the smart play.
Key Takeaways:
- The promise-delivery gap: 2.7% to 77%. Never 100%. Budget accordingly.
- The cost: $0.35/cwt price drop = $91,000 annual loss on a 1,000-cow dairy.
- Cooperatives won’t save you: FrieslandCampina lost €149M. Fonterra members voted 88% to sell.
- Your 48-hour playbook: Check historical rates. Model for zero revenue. Verify DMC enrollment.
- The bottom line: Until product ships and checks clear, a trade deal is a press release—not a market.

Executive Summary:
China promised 12 million tons of soybeans. They shipped 332,000. That’s 2.7%—and your lender doesn’t care about the other 97%. Phase One delivered just 58-77% of agricultural targets, and dairy farmers absorbed the gap: $91,000 in annual losses for a typical 1,000-cow operation when Class III dropped $0.35/cwt. Even cooperatives can’t escape—FrieslandCampina lost €149 million; Fonterra’s members voted 88% to sell to Lactalis. The pattern is consistent: promises at 100%, delivery between 2.7% and 77%, farmers managing the difference. Here’s your 48-hour defense plan for the next trade announcement.
Complete references and supporting documentation are available upon request by contacting the editorial team at editor@thebullvine.com.
Learn More:
- Decide or Decline: 2025 and the Future of Mid-Size Dairies – Provides a concrete financial framework for mid-size operations to survive consolidation, detailing specific debt-to-asset ratio targets (<35%) and three distinct business models (Expansion, Right-Sizing, or Optimization) that protect equity during market volatility.
- Trump’s Trade War: Your 9-Month Roadmap to Dairy Profitability – Delivers a strategic timeline for navigating impending USMCA reviews and trade disruptions, offering proven diversification strategies—including beef-on-dairy and renewable energy revenue streams—to insulate your milk check from political crossfire.
- The Tech Reality Check: Why Smart Dairy Operations Are Winning While Others Struggle – Reveals the true ROI benchmarks for dairy automation in 2025, helping producers avoid costly implementation failures by focusing on labor savings that actually materialize and cybersecurity measures that protect operational continuity.
 The Sunday Read Dairy Professionals Don’t Skip.
 The Sunday Read Dairy Professionals Don’t Skip.
Every week, thousands of producers, breeders, and industry insiders open Bullvine Weekly for genetics insights, market shifts, and profit strategies they won’t find anywhere else. One email. Five minutes. Smarter decisions all week.


