
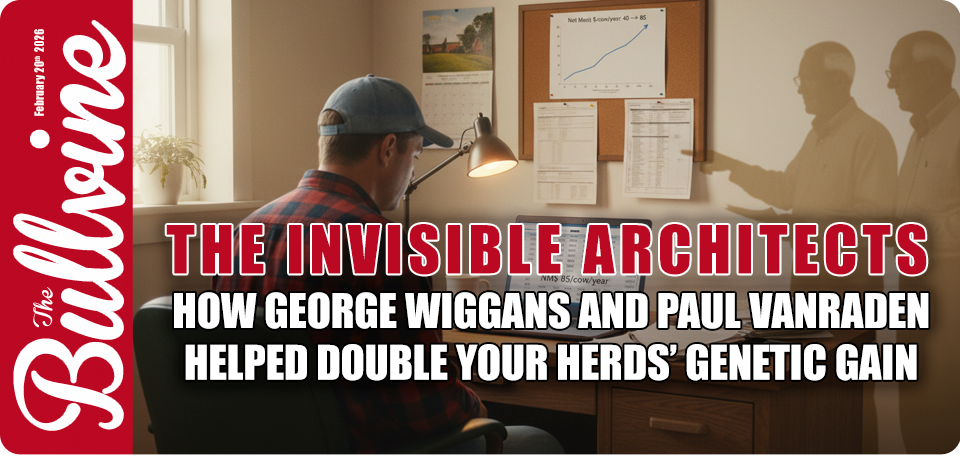


Two scientists doubled your herd’s genetic gain — and you’ve never heard their names.
On September 29, 2025, the National Dairy Shrine honored George Wiggans and Paul VanRaden together with its Pioneer Award at the annual banquet in Madison, Wisconsin. The geneticists in the room didn’t need the introduction. They’d cited the pair’s work for decades. But back on the farms where that work actually lives — in the mating programs, the sire lists, the reliability columns you scroll past — neither name registers much.
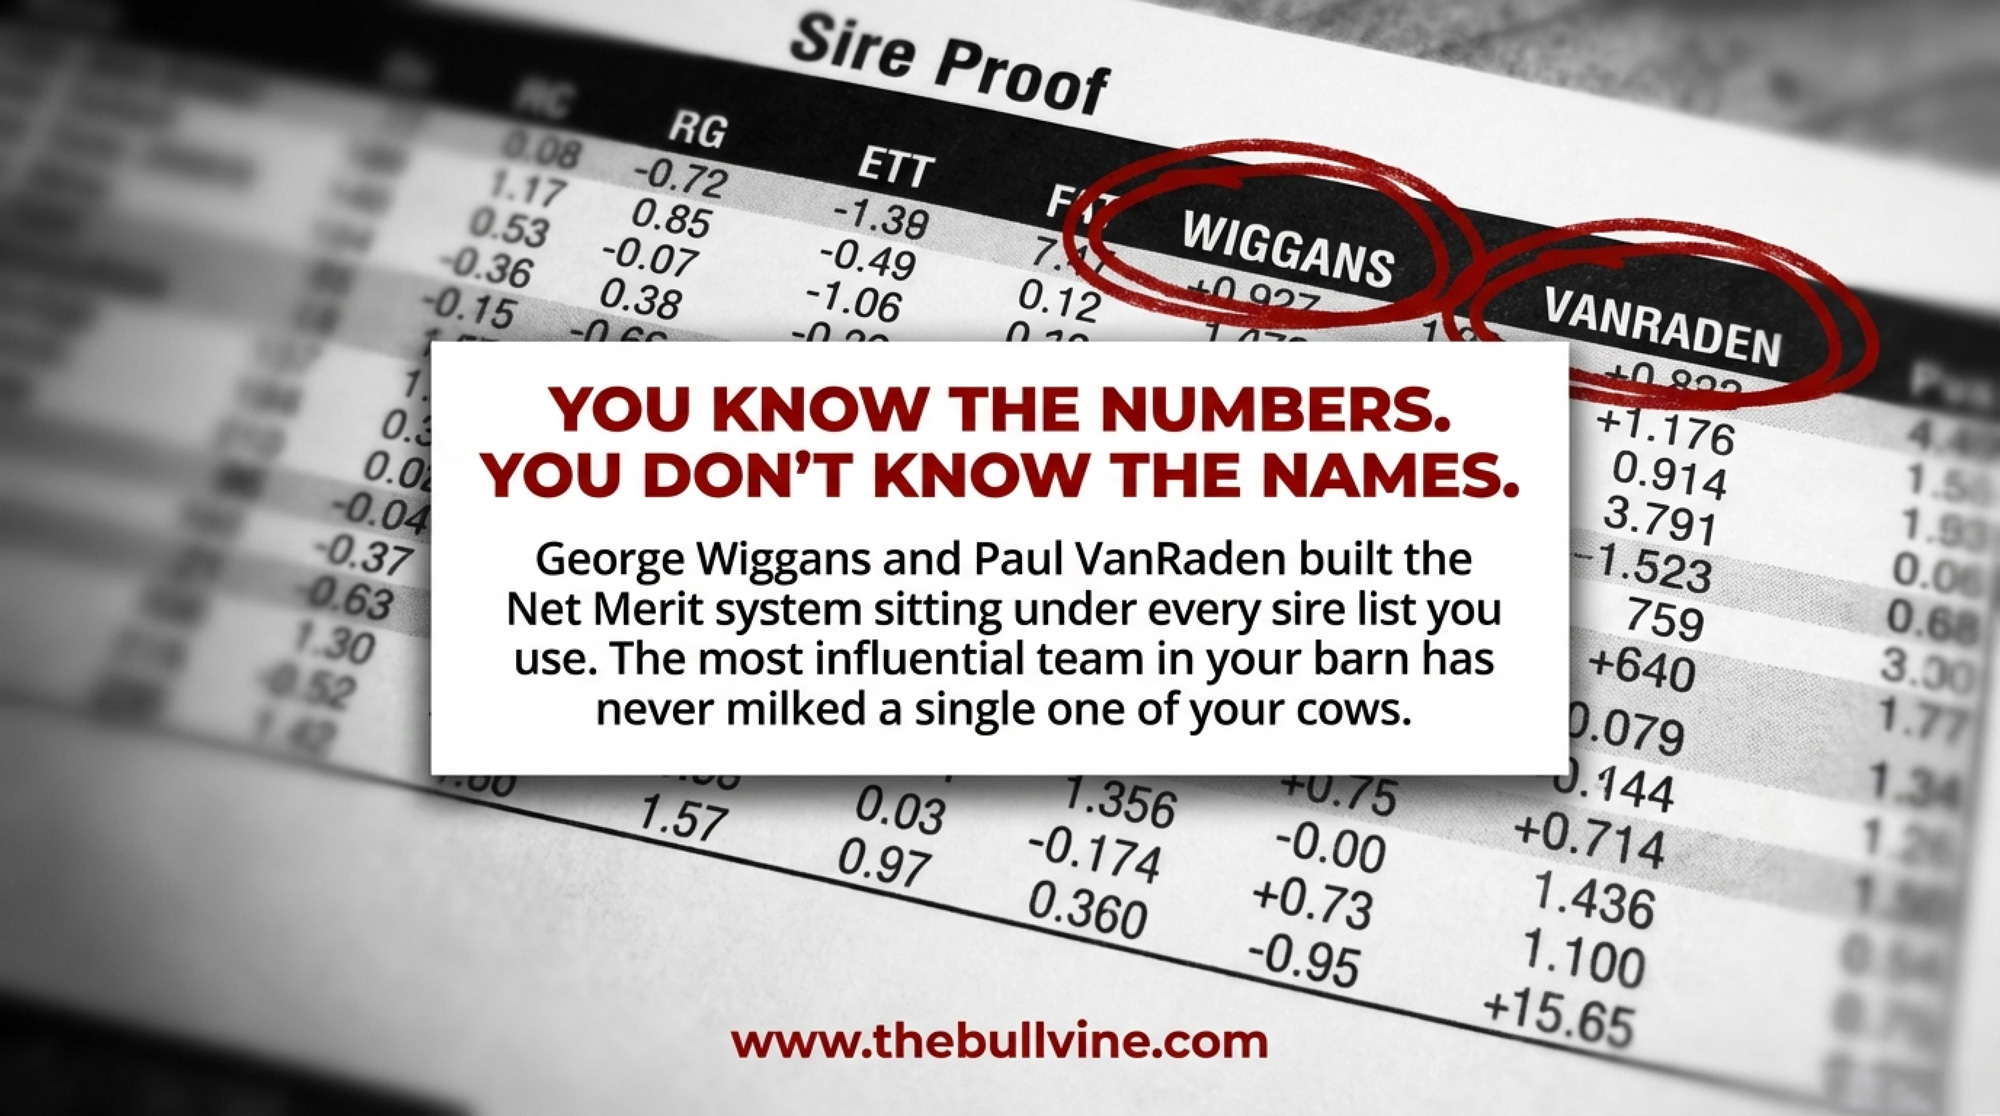
That’s the paradox worth sitting with. Wiggans alone had 335 publications by the time he retired from USDA in June 2016, and VanRaden’s list runs deep as well — the pair have authored more than 500 combined. Between them, they developed and implemented much of the U.S. system for genetic evaluation — Net Merit, genomic reliability, and lethal recessive detection. The Dairy Shrine put it plainly: “Their individual accomplishments and contributions to dairy genetics are immeasurable, yet their names are rarely mentioned apart.”
And the system they built is worth real money to your herd. Wiggans documented in a 2022 Frontiers in Genetics paper that since 2010, the average annual increase in Net Merit has been $85 per cow — up from $40 during the previous five years. Not a projection. Measured genetic gain, validated across millions of U.S. Holsteins.
The Farm Kid Who Preferred Calculus to Milking
Wiggans grew up on a dairy farm near Aurora, New York — right on Cayuga Lake, deep in the Finger Lakes. Up early for milking, fieldwork in the summer — the usual routine. But it was the quantitative side that drew him.

George Wiggans, Ph.D. — After 38 years building the evaluation system that powers every sire list in North America, Wiggans retired from USDA in 2016 and immediately joined CDCB as Technical Advisor. “Nothing breeds — well, success is a good support for happiness,” he told Peggy Coffeen. (Photo: CDCB)
His grandfather was a professor of plant breeding at Cornell, and the family ran a hybrid seed business alongside the dairy, as Wiggans described in a February 2026 interview with Peggy Coffeen for the Uplevel Dairy Podcast. When Wiggans enrolled at Cornell — practically a foregone conclusion for that household — his calculus scores caught an advisor’s attention.
That advisor introduced him to Dr. L. Dale Van Vleck, a professor of animal breeding who had studied under Charles Henderson. Henderson, widely regarded as the father of modern animal breeding methodology, lived just a few houses away from Wiggans’ grandfather in Forest Home. Van Vleck saw the combination that mattered: a dairy kid who could handle the math.
“Working with genetics is really a great deal of managing data and trying to extract the genetic component out of what we observe in the field,” Wiggans told Coffeen. “Computer programs are something where you can do something, you can run it, and you find out immediately whether you’re successful or not.”
That combination — dairy background plus mathematical ability — would prove decisive. But the career that would define him was still a decade away.

Paul VanRaden, Ph.D. — The statistical mind behind genomic predictions and the Net Merit formula. VanRaden developed the primary evaluation procedure that launched official genomic selection in January 2009 and led the haplotype research that identified the lethal recessives now flagged in your mating software. (Photo: USDA-ARS)
The DHI Supervisor Who Followed the Data
VanRaden grew up on a 30-cow Holstein farm near Freeport in northwest Illinois. His father, Walter, ran the herd slightly below the 1972 national DHIA average — 13,324 lbs milk and 497 lbs fat per cow — before selling the cows that year and starting a farm machinery repair business. Each of the six VanRaden kids got a newborn calf as a 4-H project around age nine. Paul’s was a heifer named Spotty.
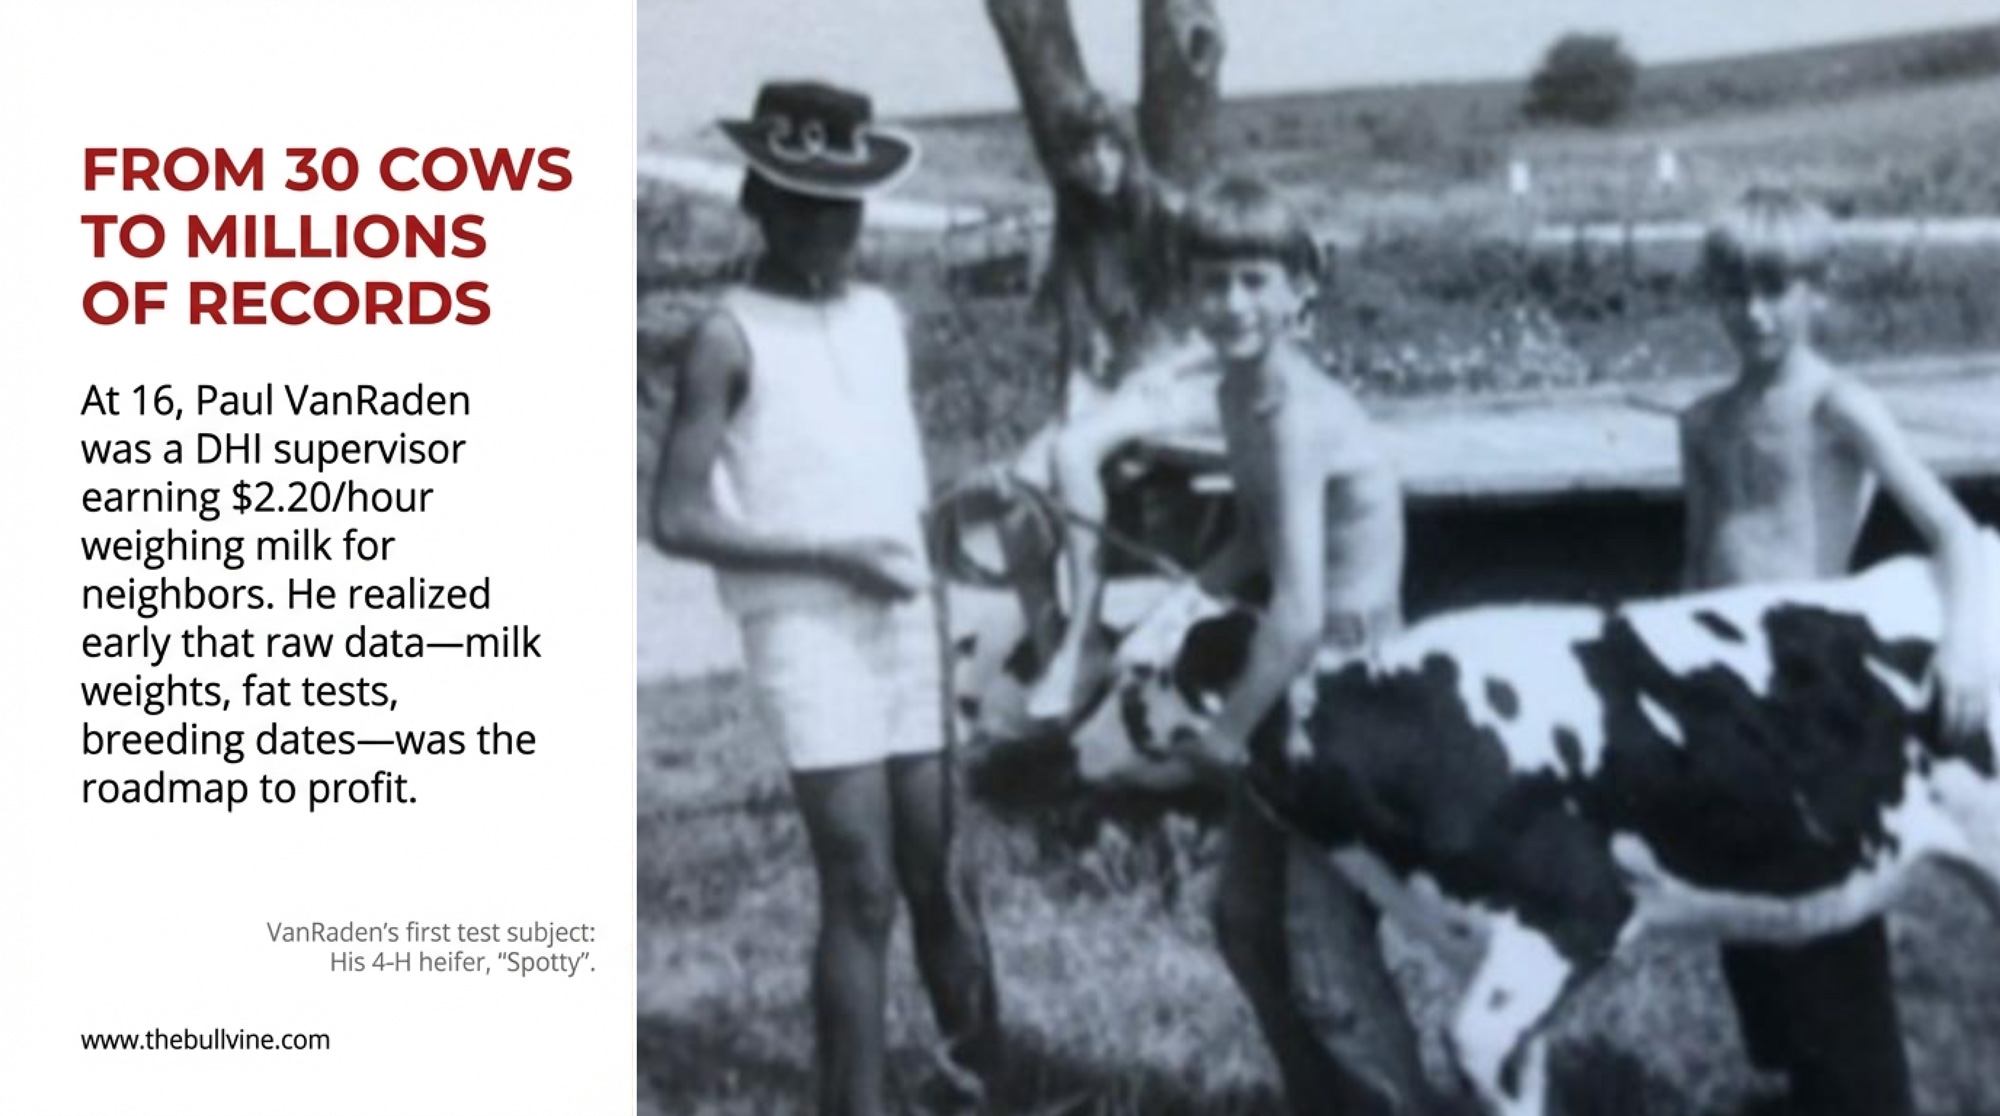
In high school, VanRaden spent two years as a DHI Supervisor — collecting milk weights and samples from several neighbor farms, earning about $2.20 an hour and logging 33 hours a month across five local herds. That work planted something. Every month, he was recording the raw data — the pounds of milk, the fat tests, the breeding dates — that would eventually feed the national evaluation system he’d spend his career building. He just didn’t know it yet.
He liked math more than other subjects, and programming computers was easier and had bigger benefits than baling hay — so he followed the data first to the Iowa State computing center and then to Beltsville.
Laos, Goats, and the Long Road to Beltsville
Before USDA, Wiggans and his wife spent over two years in Laos with International Voluntary Services — an agricultural development program operating during the Vietnam War era. Several volunteers had been assassinated. The couple was restricted to provincial centers.
Back in the U.S., he and his wife joined his sister and brother-in-law working at a school for emotionally disturbed children — a place with a model farm and, crucially, dairy goats. That detour gave him experience with goat breeding that would become one of his first USDA projects: extending dairy cattle evaluation techniques across species. “I was the goat guy initially,” he told Coffeen.
When Wiggans walked into USDA’s Animal Improvement Programs Laboratory in Beltsville, Maryland, he entered a world running on computer punch cards and tapes and batch processing. National evaluations were published twice a year. By the time a proof reached a breeder’s mailbox, the data behind it was already months old.
He would spend the next 38 years transforming that system. Not alone.
The Partnership Nobody Mentioned Apart
John Cole — a co-author on the official 2025 Net Merit revision, now Chief Research and Development Officer at CDCB, and formerly Senior Vice President of Research and Development at PEAK — has watched both careers up close. He put the collaboration bluntly for the National Dairy Shrine: “It’s difficult to think of another pair of animal breeders who were so influential as a team.”
VanRaden joined the Beltsville lab and became Wiggans’ long-running research partner. The division of labor was clear from their respective publication records: VanRaden developed much of the statistical methodology behind genomic predictions and the continuing theoretical underpinnings of genetic analysis, while Wiggans built and managed the operational systems that turned methodology into national evaluations farmers could actually use. (For another story of a data revolutionary who changed what breeders see in a proof sheet, read our profile of Robert Chicoine and the Bull Nobody Wanted.)
In the 1990s, the two took a critical step toward building the dataset that would eventually power genomic selection. Wiggans and VanRaden asked Canadian AI companies if they would contribute DNA to a combined repository. They did — and that collaboration led to the shared data used in genomic predictions for both countries, a cross-border foundation that remains essential to the evaluation system today.
Both men spent their entire careers at the Beltsville lab — a level of continuity that proved essential for the system they were building.
How One Number Replaced Guesswork
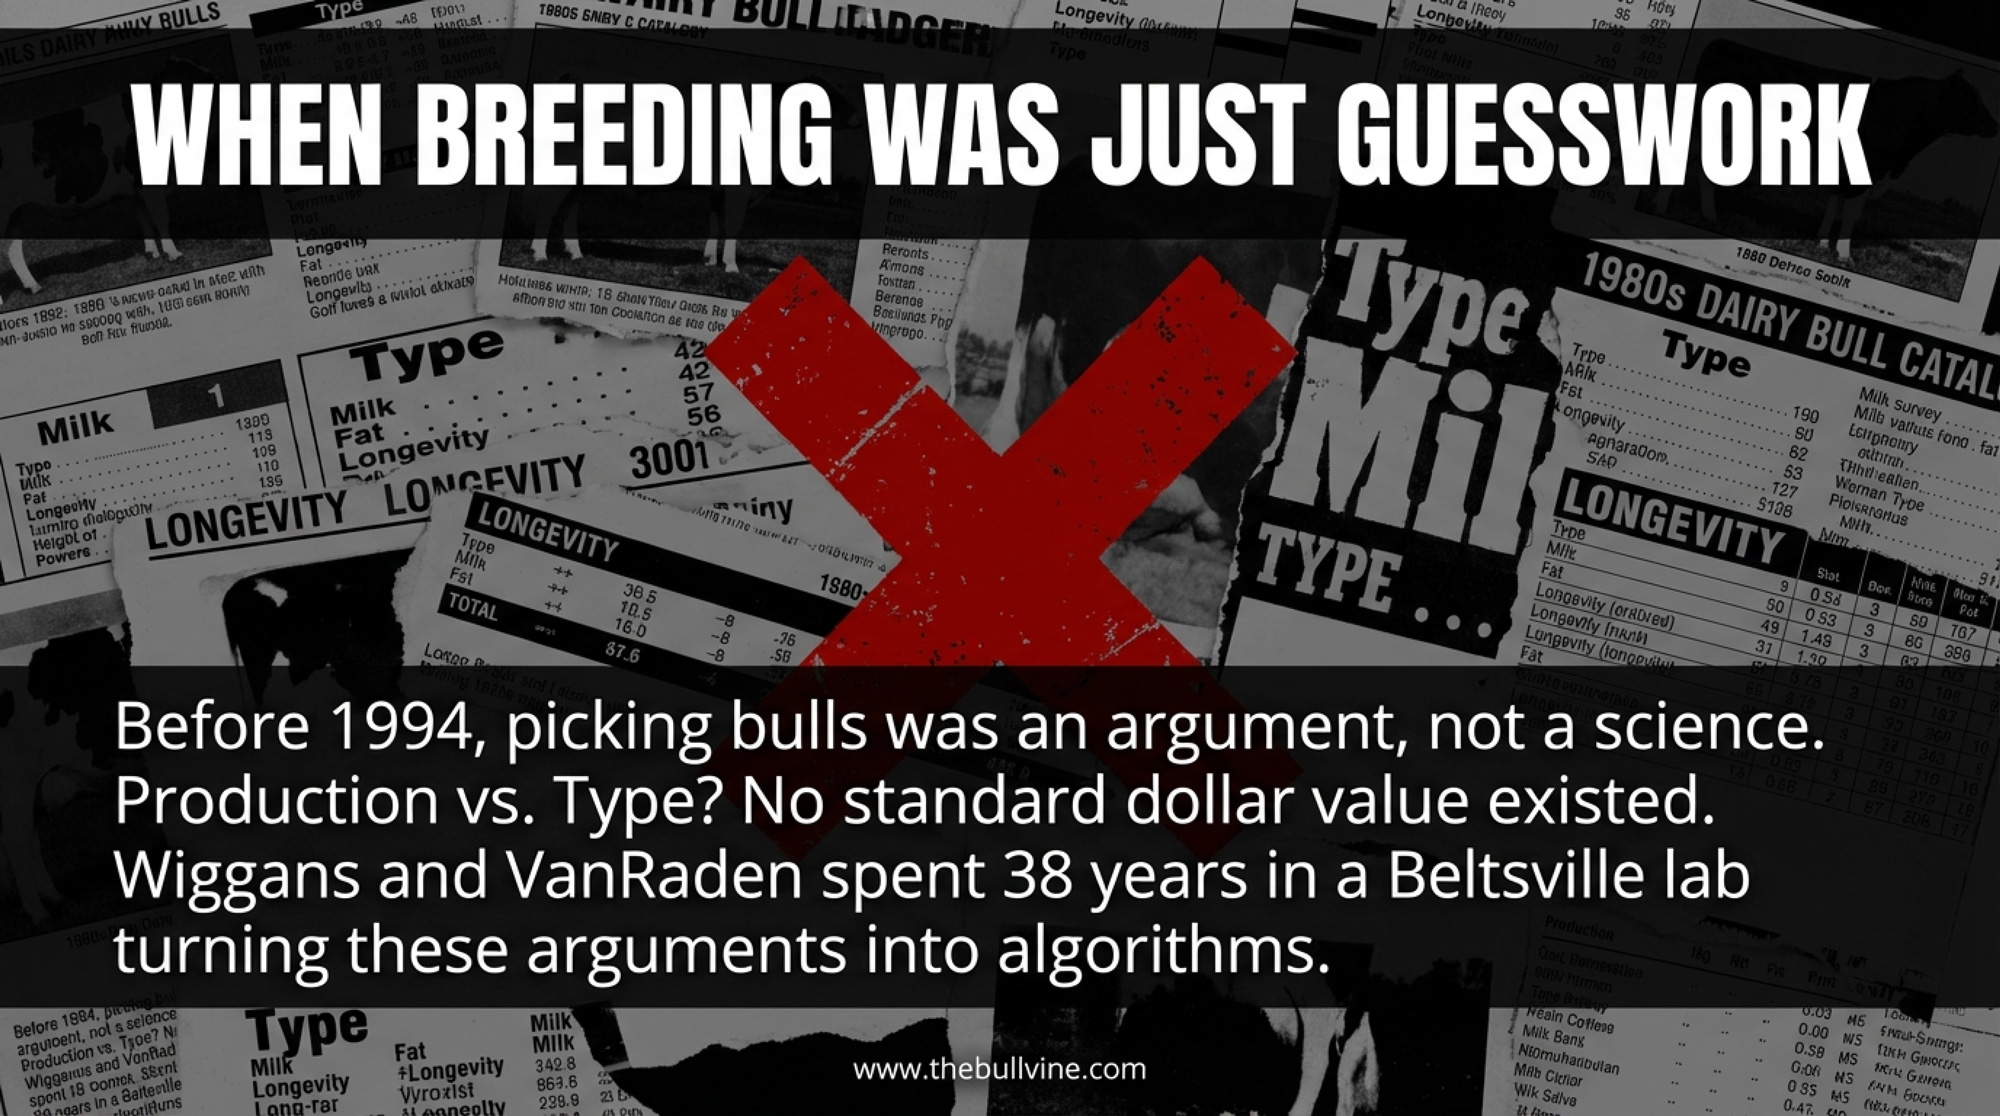
Before Net Merit arrived in 1994, picking bulls was as much an argument as science — weighing milk production against type against longevity against fertility, with no standardized way to compare them in dollar terms.
Net Merit collapsed all of that into one number: production, health, fertility, longevity, conformation — weighted by their actual economic impact on a commercial dairy. Wiggans and VanRaden helped develop the framework. They built the operational system that calculates it for every genotyped animal in the national database.
CDCB’s April 2025 revision — authored by VanRaden, Sajjad Toghiani, Bailey Basiel, and Cole — rebalanced the index against current milk prices, feed costs, and component premiums. The 2025 formula gives more emphasis to butterfat and less to protein, reflecting recent price trends, and bumps up cow livability and heifer livability while dialing down productive life, because cull cow and heifer calf prices have surged. Every time those weights change, your sire list reshuffles. That’s the point.
For Canadian readers: Lactanet also overhauled Canada’s Lifetime Performance Index (LPI) in April 2025, splitting it into six subindexes, including a new Environmental Impact Index specific to the Holstein breed. Canada’s profit-oriented equivalent of Net Merit is Pro$. The underlying science is shared across the border, but the indexes are built for different market conditions — if you ship milk in Canada, our breakdown of the April 2025 Canadian evaluation changes lays out what shifted and why.
What Happened in 2009 — and Why Does Your Sire List Exist?
The work that changed everything started with other people’s breakthroughs. Curt Van Tassell at USDA-ARS and Jerry Taylor at the University of Missouri, working with Illumina, developed a low-cost SNP chip — the initial 50K chip with roughly 54,000 genetic markers — that could profile an animal’s genome at an affordable cost. Wiggans and VanRaden’s team had to figure out what to DO with all that data.
“It turned out to be an inspired choice of markers,” Wiggans told Coffeen, “because they sufficiently represented the entire genome of the cattle that we could come up with good estimates of their productivity.”
In January 2009, USDA’s lab launched official genomic evaluations for U.S. Holsteins and Jerseys, with VanRaden developing the primary evaluation procedure and Wiggans focusing on genotype management and the operational rollout. The impact was immediate and measurable. García-Ruiz et al. documented it in a landmark 2016 PNAS paper (vol. 113, no. 28): rates of genetic gain for yield traits increased 50–100% after genomic selection was introduced.
For fitness traits like fertility and longevity, gains were even larger — threefold to fourfold for lowly heritable traits — though García-Ruiz noted that increased selection emphasis on those traits in the years prior to genomics, not genomics alone, contributed to the acceleration. Generation intervals on the sire-of-bulls pathway dropped from roughly seven years to near the biological minimum.
Wiggans’ 2022 Frontiers in Genetics paper confirmed the sustained effect: annual Net Merit gain of $85/cow since 2010 versus $40/cow in the 2005–2009 period. VanRaden’s own January 2025 Net Merit revision projects continued annual progress at a comparable pace — its expected-progress methodology shows gains broadly consistent with those measured by Wiggans for top-marketed Holstein bulls.
And the reference population underpinning those predictions keeps getting stronger: the CDCB database surpassed 10 million genotypes on December 14, 2024, and 2025 set a record with 1,982,752 new genotypes in a single year — pushing the database past 12 million and growing.
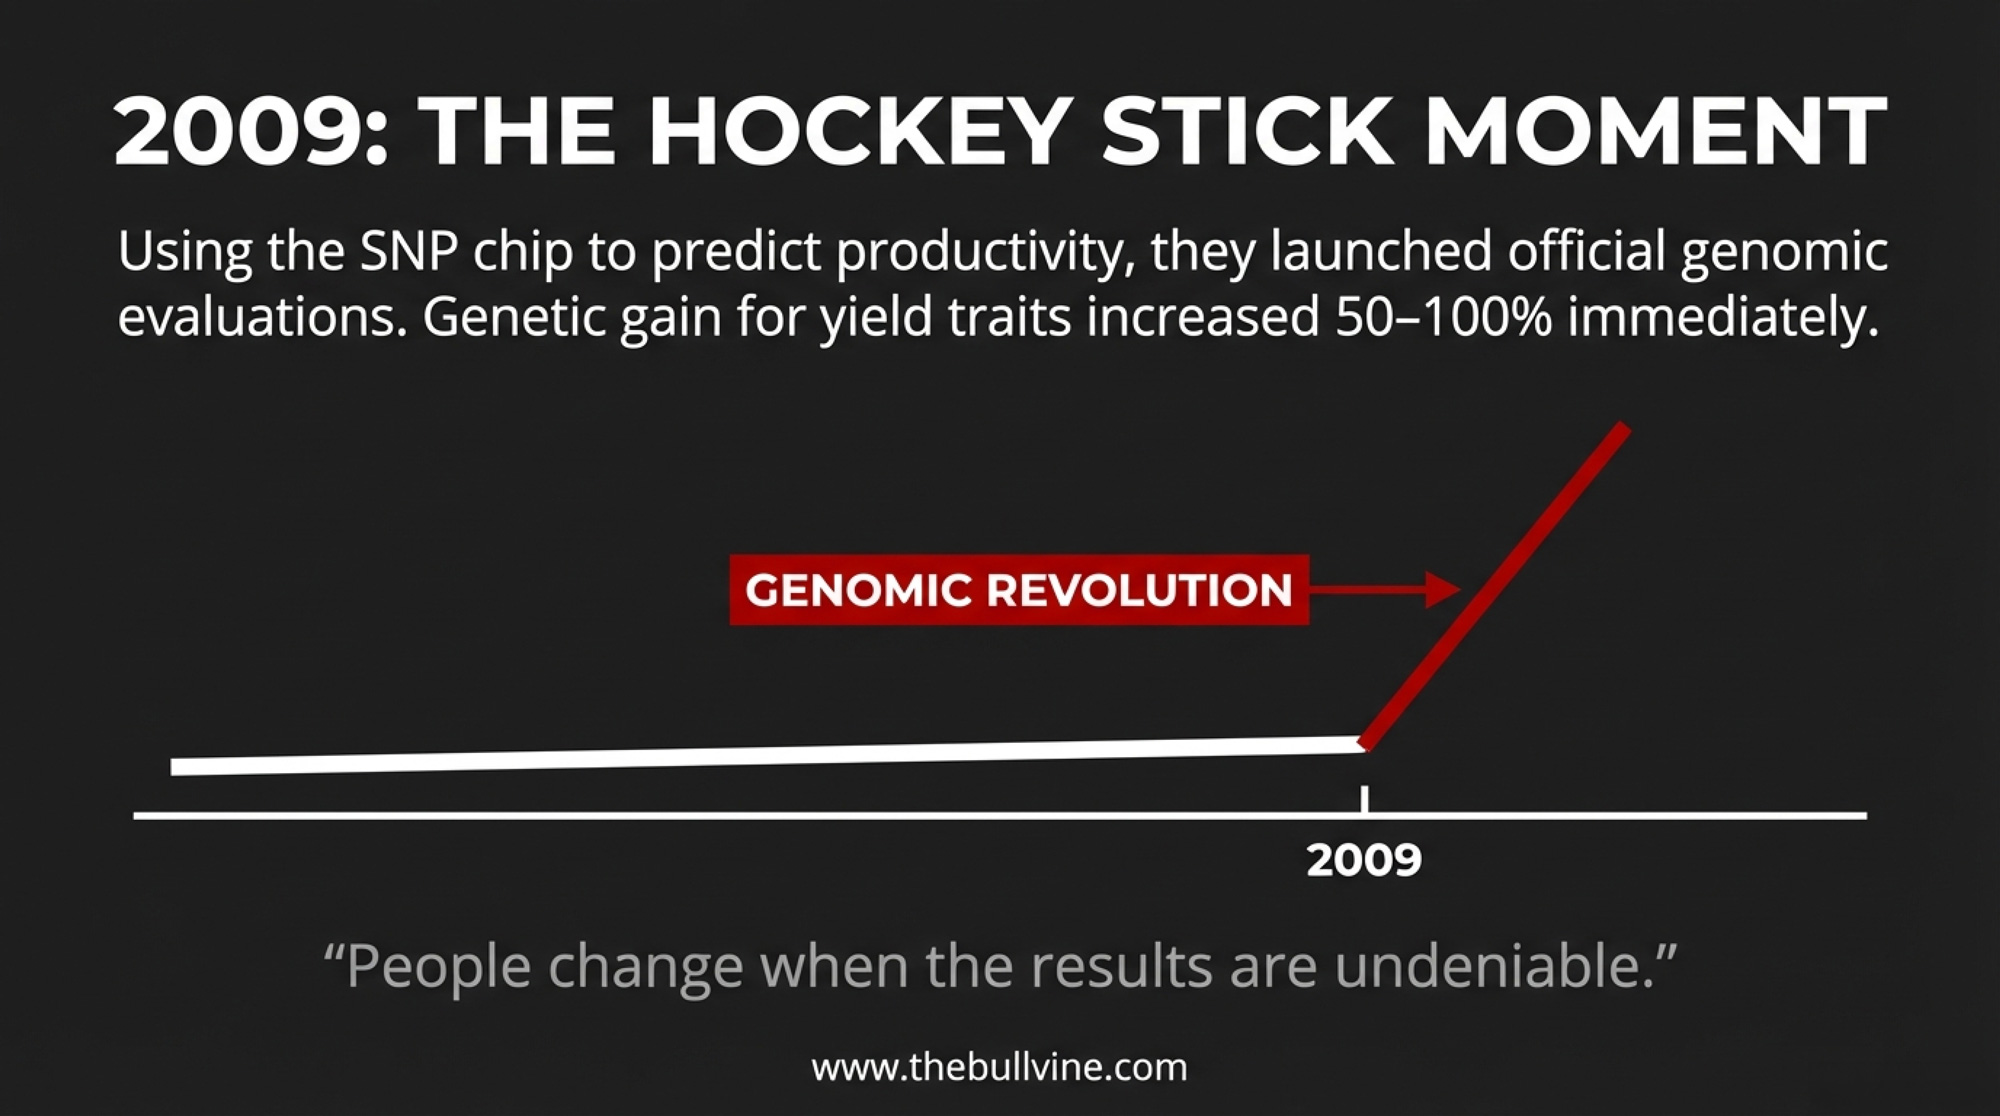
Wiggans learned something in Laos that most lab scientists never experience firsthand: people don’t change practices because you tell them to. They change when the results are undeniable. Genomic selection proved him right.
Today, most inseminations use genomic-only young sires — bulls with no milking daughters at the time of breeding. Farmers switched because bulls born this year are genetically superior to proven bulls born five years ago, and the evaluation system proved reliable enough to trust. “It proved itself on paper, on the numbers,” Wiggans said, “and now we have generations of cattle that prove themselves in the barn.”
The Calves That Never Arrived
One of the quieter contributions — and one of the hardest to quantify — is haplotype analysis for lethal recessives. You’re measuring something that doesn’t happen.
When you break the bovine genome into segments and track them through generations, you occasionally find combinations that never show up in living animals. Both copies from both parents — zero survivors. That absence is a signal: embryos carrying that double dose are dying before birth. (This is the same concentration dynamic that made popular bulls both invaluable and dangerous — an issue we explored in our Walkway Chief Mark profile.)
CDCB currently tracks 27 haplotype conditions across dairy breeds — including fertility-affecting lethal recessives like HH1 through HH6, alongside carrier tests for coat color, polledness, and other economically relevant traits. By identifying the lethal ones among these, the industry gained tools to avoid carrier-by-carrier matings that silently kill embryos.
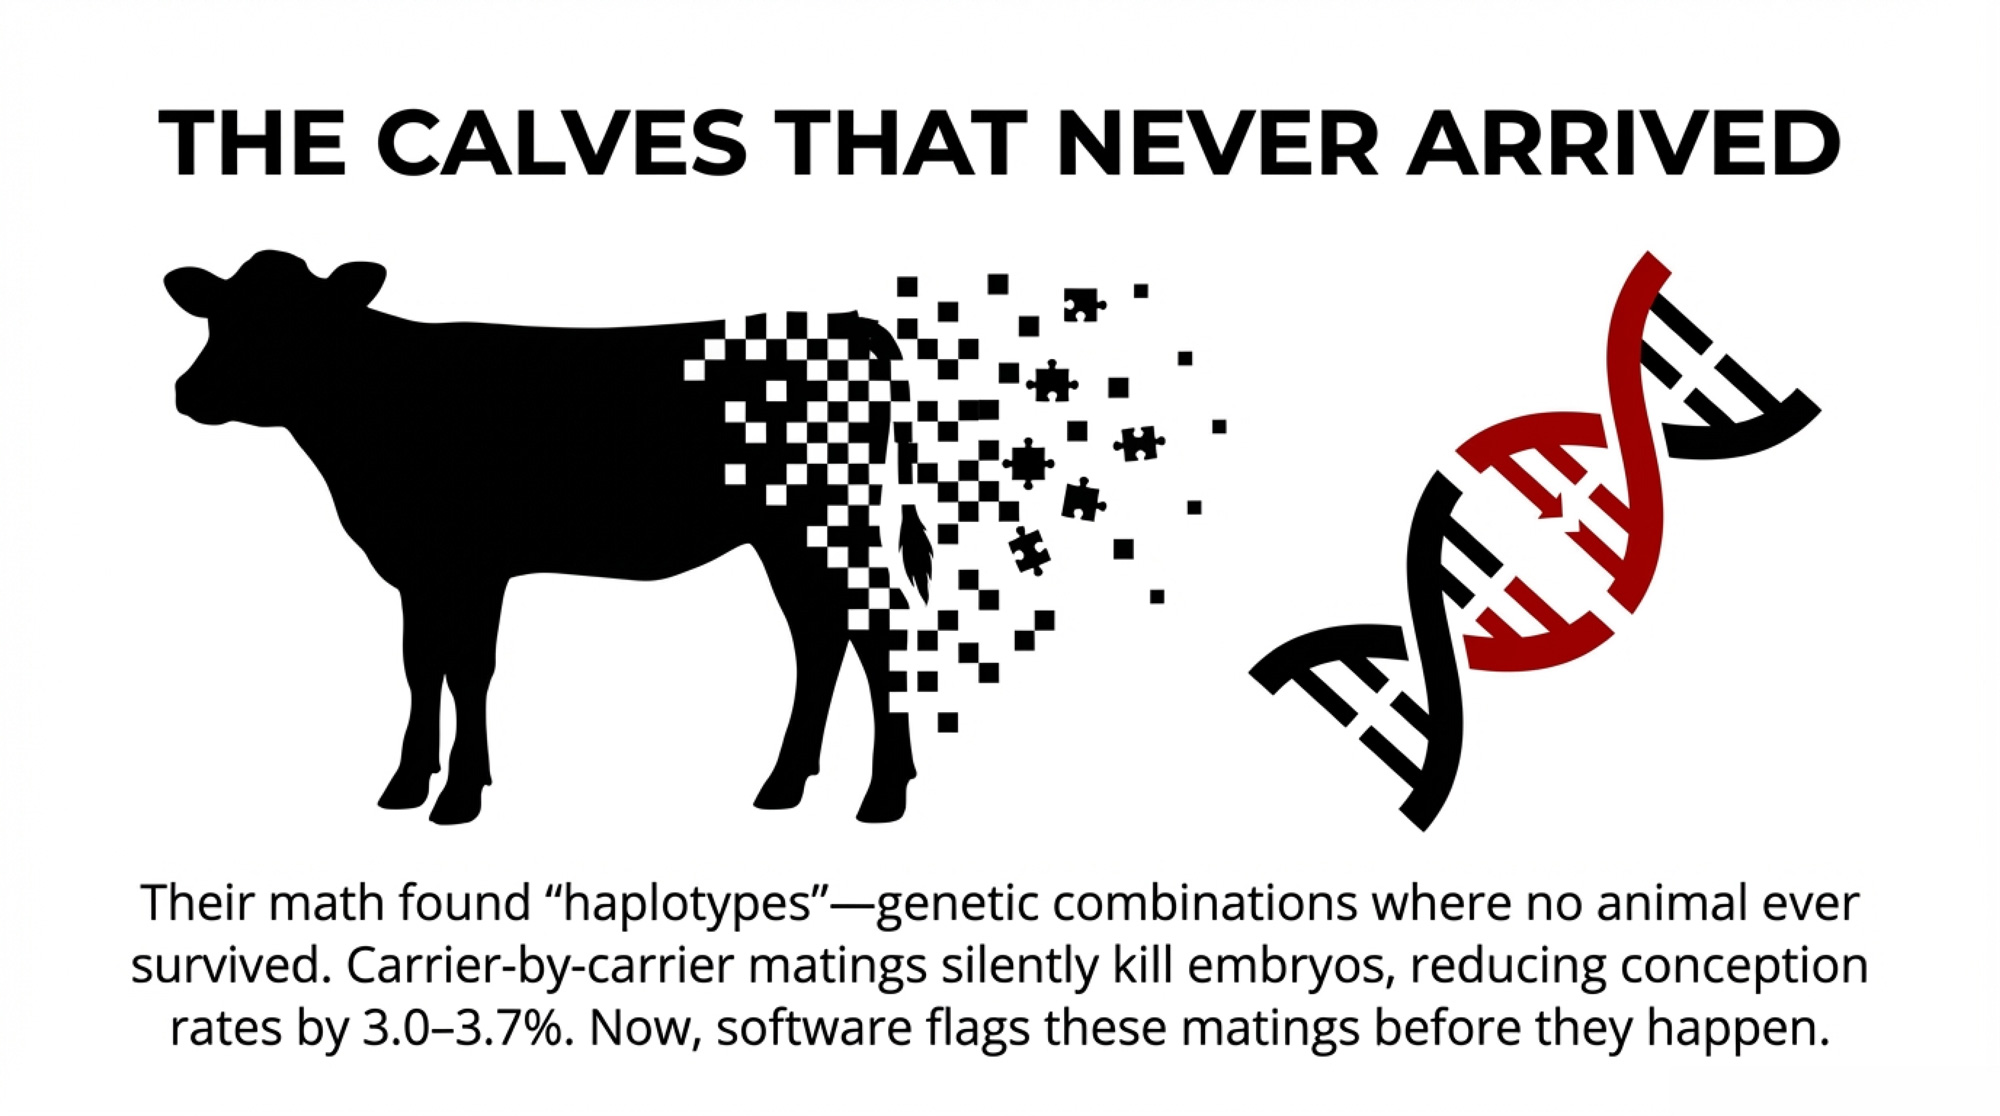
You can’t see a dead embryo in your conception rate. But you CAN see the damage in your data: VanRaden et al. documented in a 2011 Journal of Dairy Science paper that carrier-by-carrier matings reduced conception rate by 3.0 to 3.7 percentage points across the confirmed lethal haplotypes — enough to matter when multiplied across a herd. Across thousands of matings industry-wide, the savings from avoidance add up fast.
“We could add to our system searching for that kind of condition,” Wiggans explained, describing how what started as a parentage-verification tool evolved into a recessive-discovery engine.
What This Means for Your Next Sire Review
Here’s where 38 years of research connects to your breeding decisions this month. Wiggans and VanRaden built the math. But the math assumes you’re paying attention to more than the top-line number.
Start with Net Merit — but don’t stop there. The 2025 formula allocates 31.8% of relative emphasis to butterfat, 13% to protein, and 13% to productive life, with a significant jump in feed efficiency weight (17.8% via Feed Saved, up from the 2021 revision). Those weights reflect the average U.S. commercial dairy. If your milk check rewards components differently, or your barn punishes poor feet more harshly than most, your optimal sire list will look different from the default ranking. The breeders who shaped the modern Holstein breed understood this long before the formula existed — see our profile of the Holstein visionaries who built everything you’re breeding today.
Use $NM to build a shortlist of 15–20 bulls, then filter by what YOUR herd actually needs. Our breakdown of how the April 2025 genetic base change revalued every cow in your barn walks through the new trait weights in detail.
Reliability isn’t optional information. A genomic young sire at 70% reliability is not the same bet as a daughter-proven sire at 95%. That gap is real. Wiggans helped build the reliability framework precisely so you could weigh that risk — and the NM$ revision’s example bull shows how Feed Saved’s lower reliability pulls overall NM$ reliability down to 84% even when yield traits sit at 96%.
Ask your AI rep a pointed question: which recessives does your current sire lineup carry? The haplotype data VanRaden’s team uncovered is baked into your mating software — but only if someone enabled it.
Cross-check against your herd’s genomic results. VanRaden et al. measured the fertility leak at 3.0 to 3.7 percentage points of conception rate per carrier-by-carrier mating. One call to your AI rep fixes it.
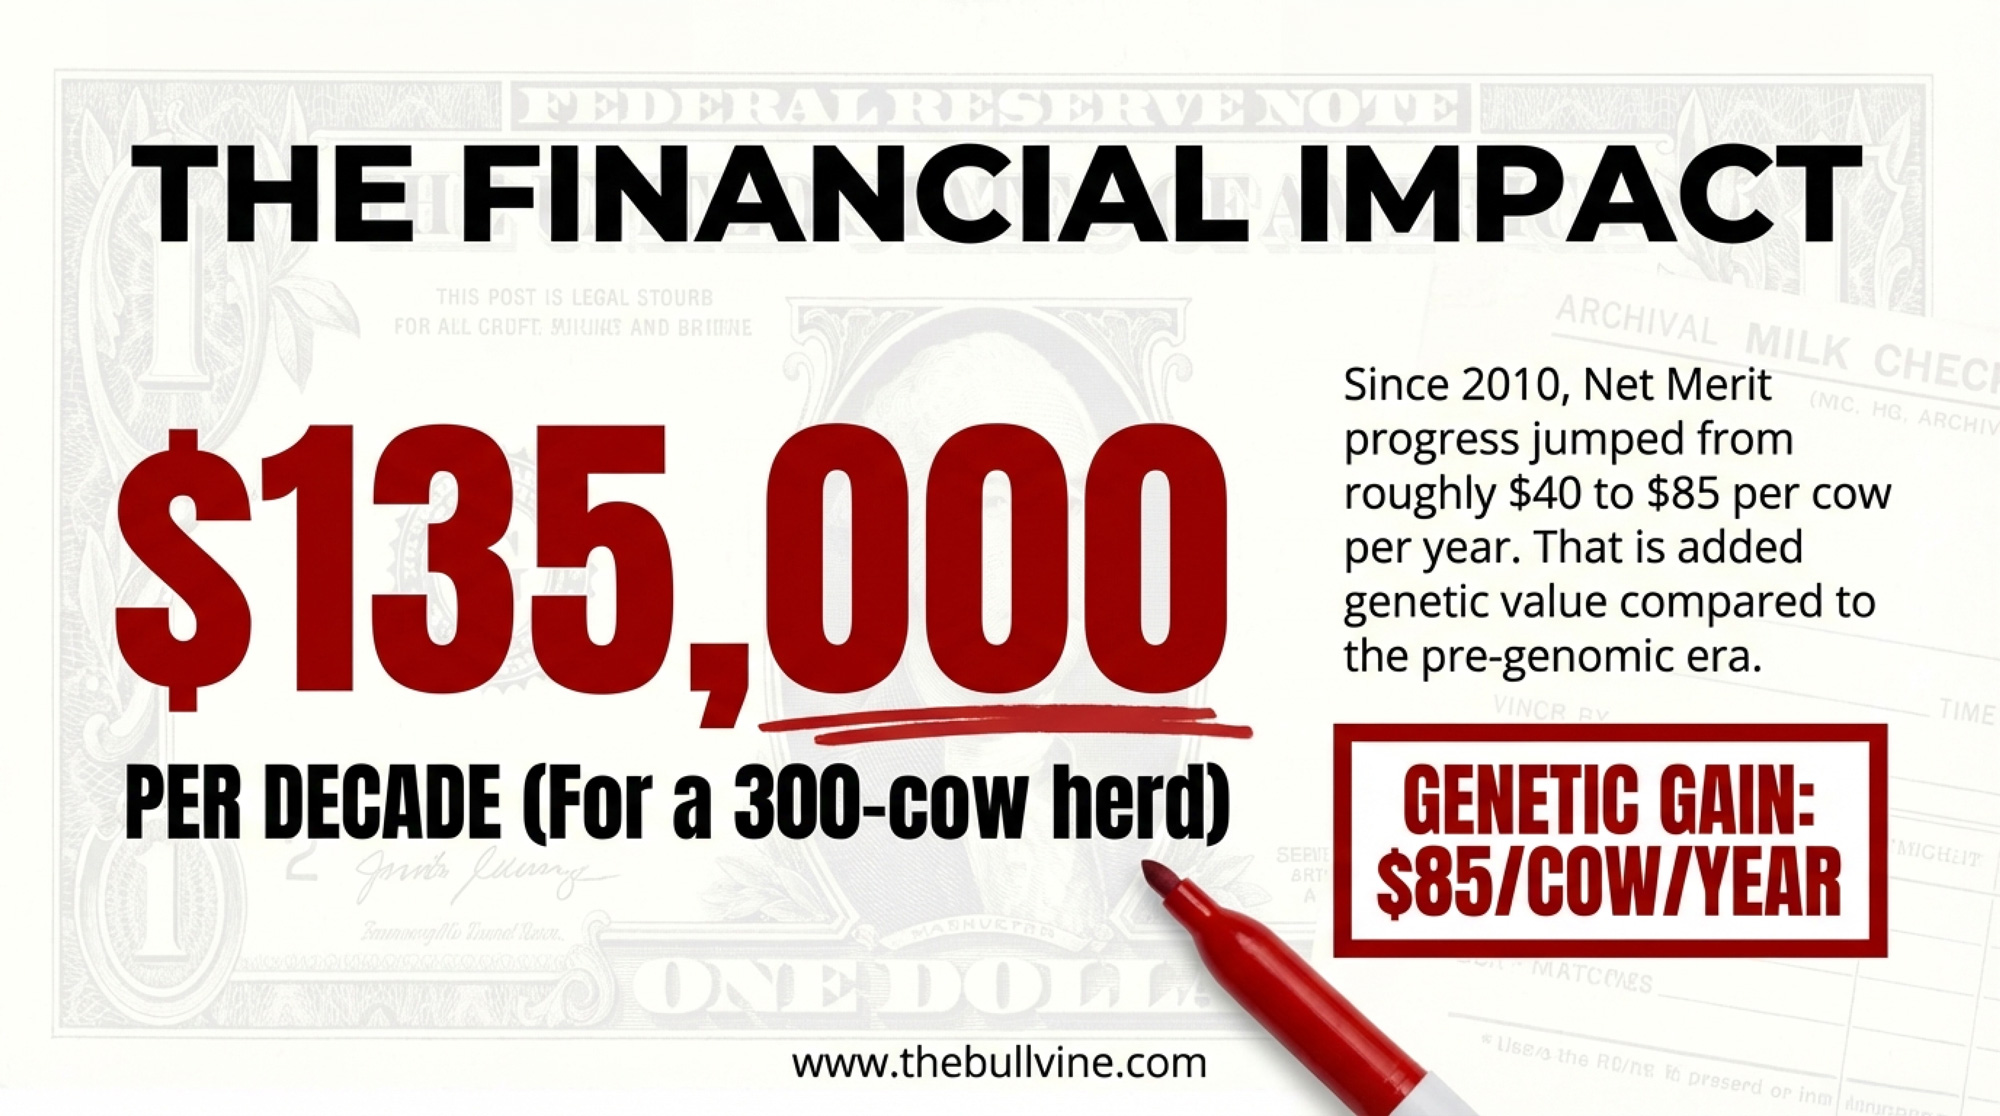
The barn math: Using Wiggans’ own published figures, the difference between pre-genomic and genomic-era genetic gain is roughly $45/cow/year ($85 minus $40). On a 300-cow herd, that’s $13,500 per year in additional Net Merit bred into each new calf crop, above what the pre-genomic era would have produced. Over a decade, roughly $135,000in genetic merit value — the breeding potential your calves carry that simply didn’t exist before genomic selection.
That’s genetic merit, not a check you’ll cash next Tuesday. But it’s the compounding advantage that separates herds trending forward from herds standing still. (For the full cumulative-payoff math, see Did Genomics Really Deliver? $238,000 Says Yes — If You Steer It Right.)
Your 30/90/365-Day Sire Review Checklist
This month:
- Pull your herd’s NM$ average from your genetic management software or your AI company’s herd report. Check it against the new April 2025 base, which represents the average of cows born in 2020. If you’re below $0, your herd’s genetics are below the current national average — and with the breed improving at $85/cow/year, that gap grows fast.
- Ask your AI rep which lethal haplotypes your current sire lineup carries. If you don’t know, you’ve got a potential fertility leak hiding in plain sight.
Within 90 days:
- Audit sire diversity at your next sire review. If more than one sire or closely related sire group accounts for over 15% of your replacement heifers born in any 12-month window, you’ve got a concentration risk the evaluation system can’t protect you from. Diversify before your next semen order.
- Compare your herd’s NM$ trend across the last three proof runs. If the needle isn’t moving, your selection strategy or mating program needs a closer look.
This year:
- Reassess your custom index weights against your actual milk check premiums and cull cow values. The 2025 NM$ revision shifted weight toward butterfat, Feed Saved, and livability—does your sire stack reflect that?
- Evaluate your genomic-to-proven sire ratio. If more than half your matings go to bulls under 75% reliability, that’s a higher-variance breeding program. Fine if it’s deliberate. A problem if it’s accidental.
Key Takeaways
- If your herd’s average NM$ is below $0 on the April 2025 base, you’re breeding below the national genetic average and falling behind by roughly $85/cow/year — pull your numbers this month and reset your sire list, not “someday.”
- If any one sire or close sire family accounts for more than ~15% of your replacement heifers in a 12‑month window, you’ve got a genetic concentration risk — spread your next semen order across more unrelated high‑NM$ bulls.
- If more than half your matings go to genomic young sires under ~75% reliability, you’re trading stability for speed — keep that high‑gear strategy only if you can live with more volatility in daughter performance.
- If you haven’t turned on haplotype avoidance or asked which lethal recessives your sires carry, assume you’re giving up 3.0–3.7 conception‑rate points on some matings — fix it with one call to your AI rep.
- If you don’t know your own herd’s NM$ trend across the last three proof runs, you’re flying blind on genetics — make that graph your starting point before you argue about individual bulls.
The Quiet Architects
Wiggans retired from the USDA in June 2016. He immediately joined CDCB as a Technical Advisor — because the system was too important and too complex to walk away from cold. His 2022 Frontiers in Genetics paper still listed CDCB as his affiliation.
When Coffeen asked what brought him the most satisfaction, Wiggans said: “Nothing breeds — well, success is a good support for happiness.”
He’s already thinking about the next acceleration. Oocyte collection from younger calves — currently reliable at 9–10 months, potentially feasible much earlier — could shave another six months off female generation intervals. Nobody talks about selection limits anymore, he noted. “It seems like we just keep making — you know, herd averages of 25,000 or 30,000 pounds, no big deal. And now that’s average.”
Next time you pull up a sire list, look past the numbers to what’s underneath them: 38 years of two scientists who never left the lab, never chased fame, and never stopped refining the math that runs your breeding program. One grew up on a dairy farm in the Finger Lakes, the other on a 30-cow Holstein place in northwest Illinois. Both followed the data to the same building in Beltsville, and both stayed.
The Dairy Shrine got it right. Now it’s the industry’s turn to know their names.
The Invisible Architects: How George Wiggans and Paul VanRaden Helped Double Your Herds’ Genetic Gain
Two scientists doubled your herd’s genetic gain — and you’ve never heard their names.
Executive Summary: Two almost‑anonymous USDA geneticists, George Wiggans and Paul VanRaden, built the Net Merit and genomic evaluation systems that sit under nearly every sire list you use. Their work helped push U.S. Net Merit progress from roughly $40 to $85 per cow per year, quietly adding about $135,000 in long‑term genetic value to a 300‑cow herd over a decade. Along the way, they turned a Laos goat detour, DHI testing in Illinois, and punch‑card mainframes in Beltsville into a 38‑year partnership that also uncovered lethal recessive haplotypes and the 3.0–3.7‑point fertility hit from carrier‑by‑carrier matings. The article tells that human story, then shows how their math drives the 2025 NM$ revision, today’s genomic‑young‑sire dominance, and the haplotype flags in your mating software. You get a simple 30/90/365‑day playbook: pull your herd’s NM$ average, ask your AI rep which lethal haplotypes your sires carry, audit sire diversity, and rebalance your genomic vs. proven sire ratio. It’s a legacy profile and a practical genetics check‑up rolled into one.
On September 29, 2025, the National Dairy Shrine honored George Wiggans and Paul VanRaden together with its Pioneer Award at the annual banquet in Madison, Wisconsin. The geneticists in the room didn’t need the introduction. They’d cited the pair’s work for decades. But back on the farms where that work actually lives — in the mating programs, the sire lists, the reliability columns you scroll past — neither name registers much.
That’s the paradox worth sitting with. Wiggans alone had 335 publications by the time he retired from USDA in June 2016, and VanRaden’s list runs deep as well — the pair have authored more than 500 combined. Between them, they developed and implemented much of the U.S. system for genetic evaluation — Net Merit, genomic reliability, and lethal recessive detection. The Dairy Shrine put it plainly: “Their individual accomplishments and contributions to dairy genetics are immeasurable, yet their names are rarely mentioned apart.”
And the system they built is worth real money to your herd. Wiggans documented in a 2022 Frontiers in Genetics paper that since 2010, the average annual increase in Net Merit has been $85 per cow — up from $40 during the previous five years. Not a projection. Measured genetic gain, validated across millions of U.S. Holsteins.
The Farm Kid Who Preferred Calculus to Milking
Wiggans grew up on a dairy farm near Aurora, New York — right on Cayuga Lake, deep in the Finger Lakes. Up early for milking, fieldwork in the summer — the usual routine. But it was the quantitative side that drew him.
His grandfather was a professor of plant breeding at Cornell, and the family ran a hybrid seed business alongside the dairy, as Wiggans described in a February 2026 interview with Peggy Coffeen for the Uplevel Dairy Podcast. When Wiggans enrolled at Cornell — practically a foregone conclusion for that household — his calculus scores caught an advisor’s attention.
That advisor introduced him to Dr. L. Dale Van Vleck, a professor of animal breeding who had studied under Charles Henderson. Henderson, widely regarded as the father of modern animal breeding methodology, lived just a few houses away from Wiggans’ grandfather in Forest Home. Van Vleck saw the combination that mattered: a dairy kid who could handle the math.
“Working with genetics is really a great deal of managing data and trying to extract the genetic component out of what we observe in the field,” Wiggans told Coffeen. “Computer programs are something where you can do something, you can run it, and you find out immediately whether you’re successful or not.”
That combination — dairy background plus mathematical ability — would prove decisive. But the career that would define him was still a decade away.
The DHI Supervisor Who Followed the Data
VanRaden grew up on a 30-cow Holstein farm near Freeport in northwest Illinois. His father, Walter, ran the herd slightly below the 1972 national DHIA average — 13,324 lbs milk and 497 lbs fat per cow — before selling the cows that year and starting a farm machinery repair business. Each of the six VanRaden kids got a newborn calf as a 4-H project around age nine. Paul’s was a heifer named Spotty.
In high school, VanRaden spent two years as a DHI Supervisor — collecting milk weights and samples from several neighbor farms, earning about $2.20 an hour and logging 33 hours a month across five local herds. That work planted something. Every month, he was recording the raw data — the pounds of milk, the fat tests, the breeding dates — that would eventually feed the national evaluation system he’d spend his career building. He just didn’t know it yet.
He liked math more than other subjects, and programming computers was easier and had bigger benefits than baling hay — so he followed the data first to the Iowa State computing center and then to Beltsville.
Laos, Goats, and the Long Road to Beltsville
Before USDA, Wiggans and his wife spent over two years in Laos with International Voluntary Services — an agricultural development program operating during the Vietnam War era. Several volunteers had been assassinated. The couple was restricted to provincial centers.
Back in the U.S., he and his wife joined his sister and brother-in-law working at a school for emotionally disturbed children — a place with a model farm and, crucially, dairy goats. That detour gave him experience with goat breeding that would become one of his first USDA projects: extending dairy cattle evaluation techniques across species. “I was the goat guy initially,” he told Coffeen.
When Wiggans walked into USDA’s Animal Improvement Programs Laboratory in Beltsville, Maryland, he entered a world running on computer punch cards and tapes and batch processing. National evaluations were published twice a year. By the time a proof reached a breeder’s mailbox, the data behind it was already months old.
He would spend the next 38 years transforming that system. Not alone.
The Partnership Nobody Mentioned Apart
John Cole — a co-author on the official 2025 Net Merit revision, now Chief Research and Development Officer at CDCB, and formerly Senior Vice President of Research and Development at PEAK — has watched both careers up close. He put the collaboration bluntly for the National Dairy Shrine: “It’s difficult to think of another pair of animal breeders who were so influential as a team.”
VanRaden joined the Beltsville lab and became Wiggans’ long-running research partner. The division of labor was clear from their respective publication records: VanRaden developed much of the statistical methodology behind genomic predictions and the continuing theoretical underpinnings of genetic analysis, while Wiggans built and managed the operational systems that turned methodology into national evaluations farmers could actually use. (For another story of a data revolutionary who changed what breeders see in a proof sheet, read our profile of Robert Chicoine and the Bull Nobody Wanted.)
In the 1990s, the two took a critical step toward building the dataset that would eventually power genomic selection. Wiggans and VanRaden asked Canadian AI companies if they would contribute DNA to a combined repository. They did — and that collaboration led to the shared data used in genomic predictions for both countries, a cross-border foundation that remains essential to the evaluation system today.
Both men spent their entire careers at the Beltsville lab — a level of continuity that proved essential for the system they were building.
How One Number Replaced Guesswork
Before Net Merit arrived in 1994, picking bulls was as much an argument as science — weighing milk production against type against longevity against fertility, with no standardized way to compare them in dollar terms.
Net Merit collapsed all of that into one number: production, health, fertility, longevity, conformation — weighted by their actual economic impact on a commercial dairy. Wiggans and VanRaden helped develop the framework. They built the operational system that calculates it for every genotyped animal in the national database.
CDCB’s April 2025 revision — authored by VanRaden, Sajjad Toghiani, Bailey Basiel, and Cole — rebalanced the index against current milk prices, feed costs, and component premiums. The 2025 formula gives more emphasis to butterfat and less to protein, reflecting recent price trends, and bumps up cow livability and heifer livability while dialing down productive life, because cull cow and heifer calf prices have surged. Every time those weights change, your sire list reshuffles. That’s the point.
For Canadian readers: Lactanet also overhauled Canada’s Lifetime Performance Index (LPI) in April 2025, splitting it into six subindexes, including a new Environmental Impact Index specific to the Holstein breed. Canada’s profit-oriented equivalent of Net Merit is Pro$. The underlying science is shared across the border, but the indexes are built for different market conditions — if you ship milk in Canada, our breakdown of the April 2025 Canadian evaluation changes lays out what shifted and why.
What Happened in 2009 — and Why Does Your Sire List Exist?
The work that changed everything started with other people’s breakthroughs. Curt Van Tassell at USDA-ARS and Jerry Taylor at the University of Missouri, working with Illumina, developed a low-cost SNP chip — the initial 50K chip with roughly 54,000 genetic markers — that could profile an animal’s genome at an affordable cost. Wiggans and VanRaden’s team had to figure out what to DO with all that data.
“It turned out to be an inspired choice of markers,” Wiggans told Coffeen, “because they sufficiently represented the entire genome of the cattle that we could come up with good estimates of their productivity.”
In January 2009, USDA’s lab launched official genomic evaluations for U.S. Holsteins and Jerseys, with VanRaden developing the primary evaluation procedure and Wiggans focusing on genotype management and the operational rollout. The impact was immediate and measurable. García-Ruiz et al. documented it in a landmark 2016 PNAS paper (vol. 113, no. 28): rates of genetic gain for yield traits increased 50–100% after genomic selection was introduced.
For fitness traits like fertility and longevity, gains were even larger — threefold to fourfold for lowly heritable traits — though García-Ruiz noted that increased selection emphasis on those traits in the years prior to genomics, not genomics alone, contributed to the acceleration. Generation intervals on the sire-of-bulls pathway dropped from roughly seven years to near the biological minimum.
Wiggans’ 2022 Frontiers in Genetics paper confirmed the sustained effect: annual Net Merit gain of $85/cow since 2010 versus $40/cow in the 2005–2009 period. VanRaden’s own January 2025 Net Merit revision projects continued annual progress at a comparable pace — its expected-progress methodology shows gains broadly consistent with those measured by Wiggans for top-marketed Holstein bulls.
And the reference population underpinning those predictions keeps getting stronger: the CDCB database surpassed 10 million genotypes on December 14, 2024, and 2025 set a record with 1,982,752 new genotypes in a single year — pushing the database past 12 million and growing.
Wiggans learned something in Laos that most lab scientists never experience firsthand: people don’t change practices because you tell them to. They change when the results are undeniable. Genomic selection proved him right.
Today, most inseminations use genomic-only young sires — bulls with no milking daughters at the time of breeding. Farmers switched because bulls born this year are genetically superior to proven bulls born five years ago, and the evaluation system proved reliable enough to trust. “It proved itself on paper, on the numbers,” Wiggans said, “and now we have generations of cattle that prove themselves in the barn.”
The Calves That Never Arrived
One of the quieter contributions — and one of the hardest to quantify — is haplotype analysis for lethal recessives. You’re measuring something that doesn’t happen.
When you break the bovine genome into segments and track them through generations, you occasionally find combinations that never show up in living animals. Both copies from both parents — zero survivors. That absence is a signal: embryos carrying that double dose are dying before birth. (This is the same concentration dynamic that made popular bulls both invaluable and dangerous — an issue we explored in our Walkway Chief Mark profile.)
CDCB currently tracks 27 haplotype conditions across dairy breeds — including fertility-affecting lethal recessives like HH1 through HH6, alongside carrier tests for coat color, polledness, and other economically relevant traits. By identifying the lethal ones among these, the industry gained tools to avoid carrier-by-carrier matings that silently kill embryos.
You can’t see a dead embryo in your conception rate. But you CAN see the damage in your data: VanRaden et al. documented in a 2011 Journal of Dairy Science paper that carrier-by-carrier matings reduced conception rate by 3.0 to 3.7 percentage points across the confirmed lethal haplotypes — enough to matter when multiplied across a herd. Across thousands of matings industry-wide, the savings from avoidance add up fast.
“We could add to our system searching for that kind of condition,” Wiggans explained, describing how what started as a parentage-verification tool evolved into a recessive-discovery engine.
What This Means for Your Next Sire Review
Here’s where 38 years of research connects to your breeding decisions this month. Wiggans and VanRaden built the math. But the math assumes you’re paying attention to more than the top-line number.
Start with Net Merit — but don’t stop there. The 2025 formula allocates 31.8% of relative emphasis to butterfat, 13% to protein, and 13% to productive life, with a significant jump in feed efficiency weight (17.8% via Feed Saved, up from the 2021 revision). Those weights reflect the average U.S. commercial dairy. If your milk check rewards components differently, or your barn punishes poor feet more harshly than most, your optimal sire list will look different from the default ranking. The breeders who shaped the modern Holstein breed understood this long before the formula existed — see our profile of the Holstein visionaries who built everything you’re breeding today.
Use $NM to build a shortlist of 15–20 bulls, then filter by what YOUR herd actually needs. Our breakdown of how the April 2025 genetic base change revalued every cow in your barn walks through the new trait weights in detail.
Reliability isn’t optional information. A genomic young sire at 70% reliability is not the same bet as a daughter-proven sire at 95%. That gap is real. Wiggans helped build the reliability framework precisely so you could weigh that risk — and the NM$ revision’s example bull shows how Feed Saved’s lower reliability pulls overall NM$ reliability down to 84% even when yield traits sit at 96%.
Ask your AI rep a pointed question: which recessives does your current sire lineup carry? The haplotype data VanRaden’s team uncovered is baked into your mating software — but only if someone enabled it.
Cross-check against your herd’s genomic results. VanRaden et al. measured the fertility leak at 3.0 to 3.7 percentage points of conception rate per carrier-by-carrier mating. One call to your AI rep fixes it.
The barn math: Using Wiggans’ own published figures, the difference between pre-genomic and genomic-era genetic gain is roughly $45/cow/year ($85 minus $40). On a 300-cow herd, that’s $13,500 per year in additional Net Merit bred into each new calf crop, above what the pre-genomic era would have produced. Over a decade, roughly $135,000in genetic merit value — the breeding potential your calves carry that simply didn’t exist before genomic selection.
That’s genetic merit, not a check you’ll cash next Tuesday. But it’s the compounding advantage that separates herds trending forward from herds standing still. (For the full cumulative-payoff math, see Did Genomics Really Deliver? $238,000 Says Yes — If You Steer It Right.)
Your 30/90/365-Day Sire Review Checklist
This month:
- Pull your herd’s NM$ average from your genetic management software or your AI company’s herd report. Check it against the new April 2025 base, which represents the average of cows born in 2020. If you’re below $0, your herd’s genetics are below the current national average — and with the breed improving at $85/cow/year, that gap grows fast.
- Ask your AI rep which lethal haplotypes your current sire lineup carries. If you don’t know, you’ve got a potential fertility leak hiding in plain sight.
Within 90 days:
- Audit sire diversity at your next sire review. If more than one sire or closely related sire group accounts for over 15% of your replacement heifers born in any 12-month window, you’ve got a concentration risk the evaluation system can’t protect you from. Diversify before your next semen order.
- Compare your herd’s NM$ trend across the last three proof runs. If the needle isn’t moving, your selection strategy or mating program needs a closer look.
This year:
- Reassess your custom index weights against your actual milk check premiums and cull cow values. The 2025 NM$ revision shifted weight toward butterfat, Feed Saved, and livability—does your sire stack reflect that?
- Evaluate your genomic-to-proven sire ratio. If more than half your matings go to bulls under 75% reliability, that’s a higher-variance breeding program. Fine if it’s deliberate. A problem if it’s accidental.
Key Takeaways
- If your herd’s average NM$ is below $0 on the April 2025 base, you’re breeding below the national genetic average and falling behind by roughly $85/cow/year — pull your numbers this month and reset your sire list, not “someday.”
- If any one sire or close sire family accounts for more than ~15% of your replacement heifers in a 12‑month window, you’ve got a genetic concentration risk — spread your next semen order across more unrelated high‑NM$ bulls.
- If more than half your matings go to genomic young sires under ~75% reliability, you’re trading stability for speed — keep that high‑gear strategy only if you can live with more volatility in daughter performance.
- If you haven’t turned on haplotype avoidance or asked which lethal recessives your sires carry, assume you’re giving up 3.0–3.7 conception‑rate points on some matings — fix it with one call to your AI rep.
- If you don’t know your own herd’s NM$ trend across the last three proof runs, you’re flying blind on genetics — make that graph your starting point before you argue about individual bulls.
The Quiet Architects
Wiggans retired from the USDA in June 2016. He immediately joined CDCB as a Technical Advisor — because the system was too important and too complex to walk away from cold. His 2022 Frontiers in Genetics paper still listed CDCB as his affiliation.
When Coffeen asked what brought him the most satisfaction, Wiggans said: “Nothing breeds — well, success is a good support for happiness.”
He’s already thinking about the next acceleration. Oocyte collection from younger calves — currently reliable at 9–10 months, potentially feasible much earlier — could shave another six months off female generation intervals. Nobody talks about selection limits anymore, he noted. “It seems like we just keep making — you know, herd averages of 25,000 or 30,000 pounds, no big deal. And now that’s average.”
Next time you pull up a sire list, look past the numbers to what’s underneath them: 38 years of two scientists who never left the lab, never chased fame, and never stopped refining the math that runs your breeding program. One grew up on a dairy farm in the Finger Lakes, the other on a 30-cow Holstein place in northwest Illinois. Both followed the data to the same building in Beltsville, and both stayed.
The Dairy Shrine got it right. Now it’s the industry’s turn to know their names.
Learn More
- Stop Breeding by Color: Genomics, Heat Stress and Beef-on-Dairy Math That Can Add Over $4/cwt to Holstein Margins – Gain a 12-month genomic trial framework that exposes the hidden costs of visual selection. This blueprint delivers a tier-based semen strategy to capture an extra $4/cwt by leveraging the exact math Wiggans helped build.
- Bred for $3 Butterfat, Selling at $2.50: Inside the 5-Year Gap That’s Reshaping Genetic Strategy – Gain a systematic approach to hedging against market volatility as this article exposes the multi-year lag in genetic expression. It arms you with a strategy to navigate the 2025 NM$ revision’s “index trap.”
- The Next Frontier: What’s Really Coming for Dairy Cattle Breeding (2025-2030) – Gain a massive early-adopter advantage with a roadmap of AI-driven selection and microbiome markers that promise 70% labor reductions. This breakdown delivers the disruptive insights needed to outpace tomorrow’s “average” herd performance.
 Join the Revolution!
 Join the Revolution!
Join over 30,000 successful dairy professionals who rely on Bullvine Weekly for their competitive edge. Delivered directly to your inbox each week, our exclusive industry insights help you make smarter decisions while saving precious hours every week. Never miss critical updates on milk production trends, breakthrough technologies, and profit-boosting strategies that top producers are already implementing. Subscribe now to transform your dairy operation’s efficiency and profitability—your future success is just one click away.


