Archive for Dairy Markets – Page 6

When China Slammed the Door: The Export Crisis That’s Reshaping Every Dairy Operation

Everyone chased China’s export gold rush. Here’s why the producers who focused on efficiency are thriving while others struggle.

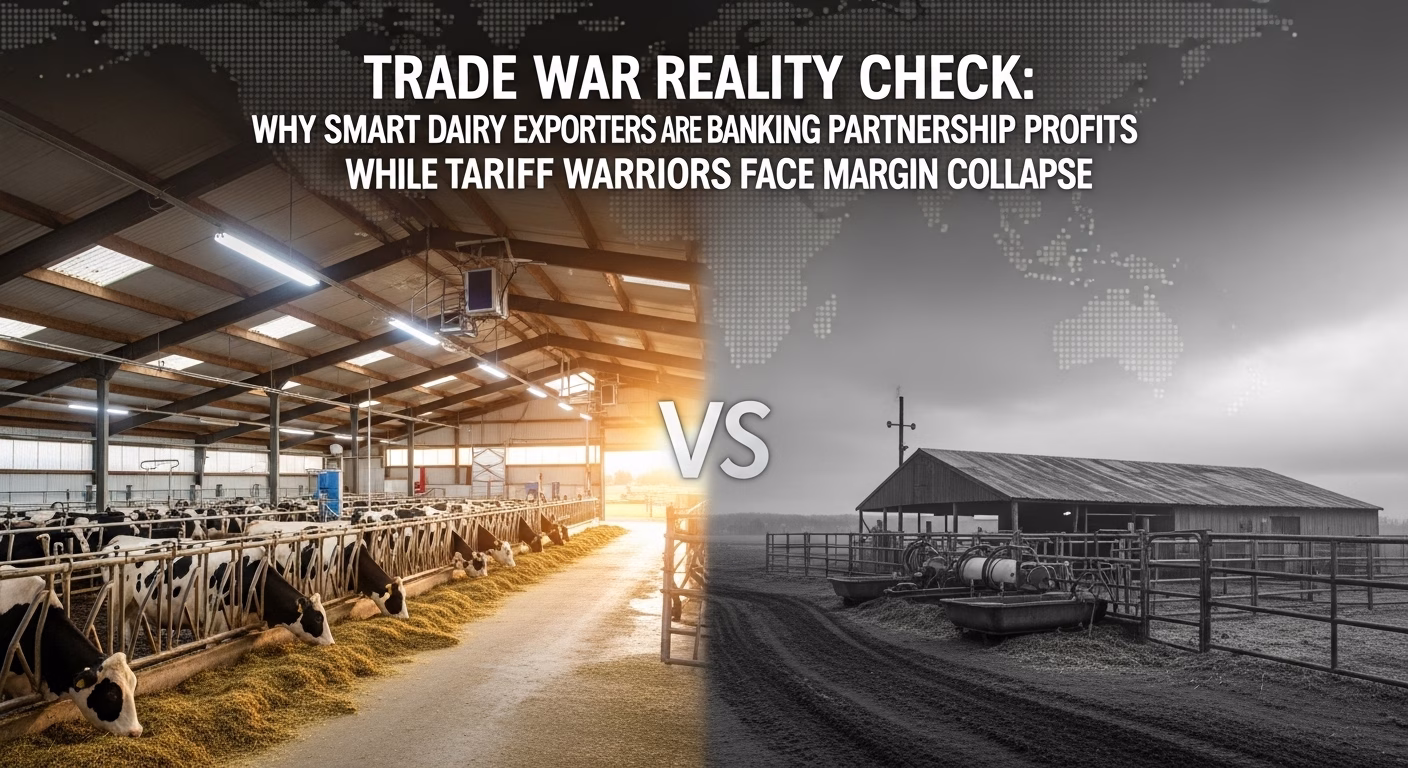
EXECUTIVE SUMMARY:  Look, I’ve been tracking this China mess since those tariffs hit, and here’s what’s really happening out there. The producers who built their entire strategy around export volume are getting absolutely hammered right now – we’re talking about margins that dropped to $10.42 per cwt in April, the lowest all year. But here’s the kicker… the guys who focused on feed efficiency and kept their conversion ratios below 1.35 pounds of dry matter per pound of milk? They’re still cash-flow positive while their neighbors are bleeding money. Mexico stepped up huge, buying $1.04 billion worth of our stuff through May, but that’s not going to save operations that can’t control their costs. The spring flush hit 1.5% production growth right when demand collapsed – perfect timing, right? You’ve got to diversify your risk management beyond just DMC coverage and start building those direct processor relationships that are paying $1.50-2.00 per cwt premiums over Class III.

KEY TAKEAWAYS

  • Feed efficiency is your lifeline – Operations hitting below 1.35 feed conversion ratios are seeing $180 monthly savings per cow, which literally means the difference between positive and negative cash flow when corn’s sitting at $4.10-$4.50 per bushel. Start obsessing over your TMR protocols now.
  • Mexico’s your new best friend – They’re buying 35% of our export volume at strong peso rates, so if you’re still chasing commodity pricing instead of building direct relationships with processors serving Mexican markets, you’re missing serious money on the table.
  • Risk management needs an overhaul – DMC at $9.50 per cwt plus DRP coverage isn’t enough when trade wars hit this hard. The smart money is locking in those processor premiums and keeping 6 months of operating expenses in cash reserves.
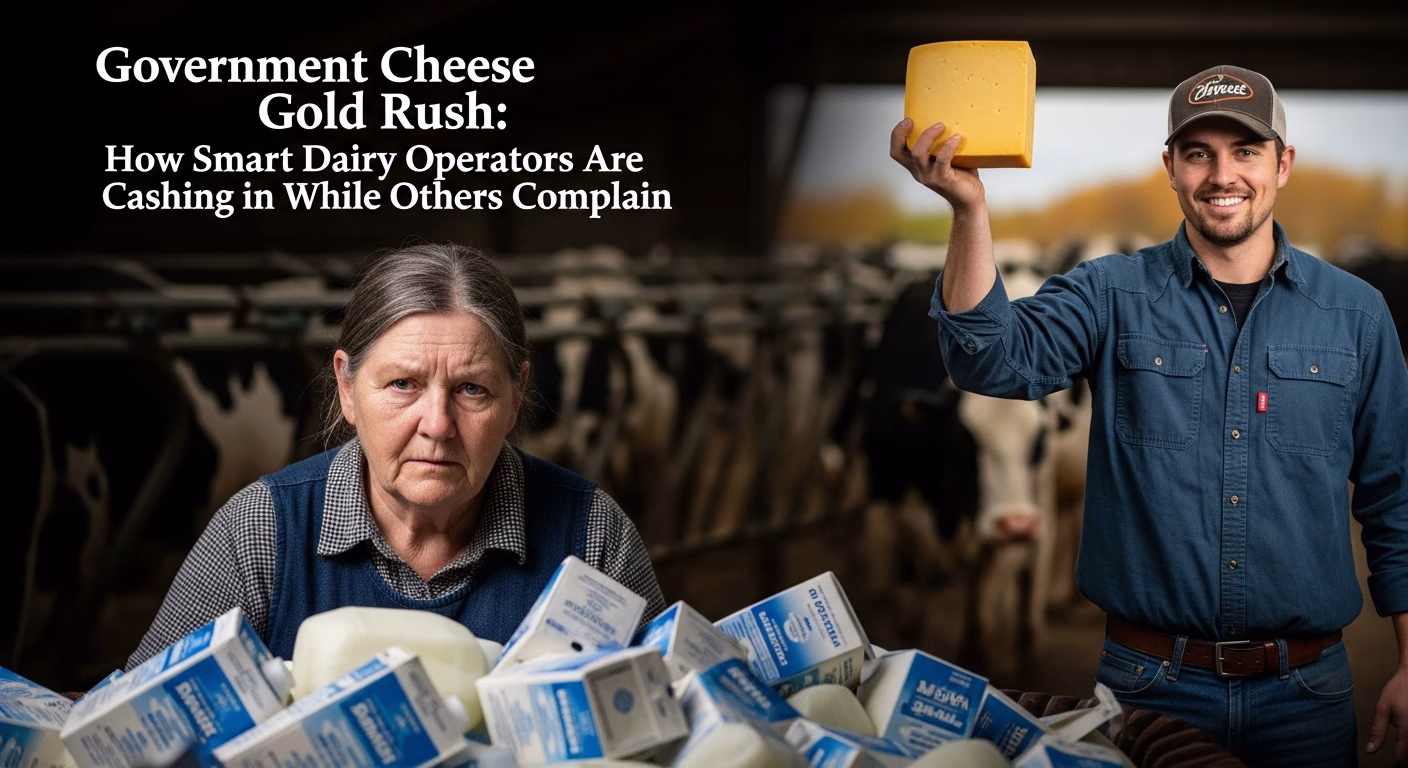
  • Strategic culling beats hope – With beef prices strong and margins compressed, your highest-cost, lowest-producing cows should be headed to market instead of expensive feed through negative margin periods. This isn’t temporary – it’s the new normal.
  • Technology edge separates winners from losers – Robotic milking systems and precision feeding are delivering 15-20% better efficiency than conventional operations, worth about $400 per cow annually. That’s not luxury anymore, that’s survival equipment.
dairy export markets, feed efficiency, risk management, dairy profitability, precision agriculture

You know that sinking feeling when you’re going through the mail and your milk check is… well, let’s just say it’s not what you expected? That’s exactly what happened to me when I started digging into May 2025’s export numbers. Sure, everyone’s talking about 13% growth – sounds fantastic on paper, right? But here’s what’s really got me concerned… when you actually peel back those headlines, there’s a story developing that’s going to hit every single one of us milking cows.

The China Situation – And Why This Changes Everything

Let me just lay this out straight. What happened with China in May 2025 wasn’t a temporary trade spat that would be worked out in a few months. We’re talking about tariffs that went from 10% to a devastating 84-125% in the span of a few months. That’s not negotiation – that’s economic warfare.

The numbers are honestly brutal when you break them down. Before all this started, China was a massive customer for our whey and nonfat dry milk – we’re talking hundreds of millions in annual sales that just… disappeared. Think about that for a second. When you lose that kind of volume overnight, you don’t just feel a pinch – you get absolutely steamrolled.

And boy, did we ever. The whey complex suffered significant losses between February and April 2025, with nonfat dry milk experiencing a particularly severe decline during the same period. I’ve been watching these markets for fifteen years, and this isn’t your typical seasonal correction. This is what happens when the bottom falls out.

What really gets me about this whole mess – and this is where it gets genuinely concerning – is how calculated it all was. The folks at USDA’s Economic Research Service have been tracking China’s systematic push toward 90% dairy self-sufficiency by 2026. Those crushing tariffs? They’re just giving political cover for what was already happening behind the scenes.

When Spring Flush Meets Perfect Storm Conditions

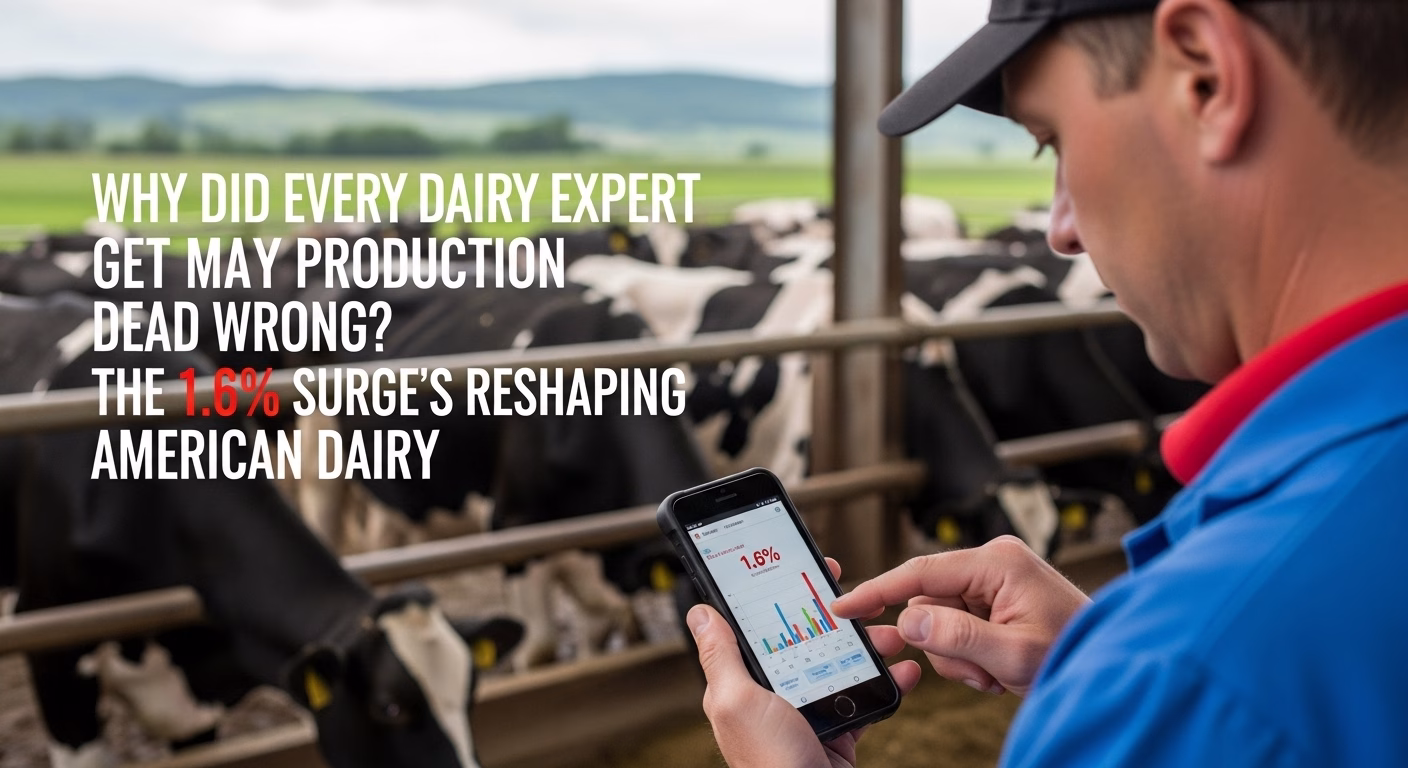
Here’s where things get really interesting – and not in a good way. Just as China was essentially telling us to pound sand, Mother Nature decided to throw us one of the most aggressive spring flushes I’ve seen in years. April 2025 production jumped 1.5% year-over-year – the biggest monthly increase since August 2022.

I’ve been tracking the regional breakdowns, and some of these numbers are just staggering. Texas – and I know they’ve been expanding like crazy down there – led with a mind-blowing 9.4% increase. The Upper Midwest states weren’t far behind either. Even with California dealing with their usual water and feed cost headaches, the national picture was crystal clear: way more milk, way fewer places to sell it.

What strikes me about this timing is how perfectly wrong it was. You’ve got producers coming off a decent winter, fresh cows hitting their stride, and then… boom. Your biggest export customer decides they no longer need you.

The Feed Cost Paradox That’s Driving Everyone Nuts

Here’s what’s particularly maddening about this whole situation – falling feed costs actually became part of the problem instead of the solution. Corn futures were initially trading below $4 earlier this year, but they’ve since crept back up to around $4.10-$4.50. Soybean meal declined, and hay prices stayed relatively stable across most regions. Usually, that’s like Christmas morning for dairy producers.

Except it didn’t work that way this time.

When you’re already dealing with oversupply, cheaper feed just encourages more production. It’s like… imagine you’re trying to bail water out of a sinking boat, and someone keeps making the hole bigger while giving you a better bucket. That’s essentially what we experienced this spring.

The Dairy Margin Coverage program captured this perfectly – April 2025 margins dropped to $10.42 per cwt, the lowest we’ve seen all year. For producers who had counted on spring momentum to carry them through the summer, reality delivered a harsh lesson about basic supply and demand.

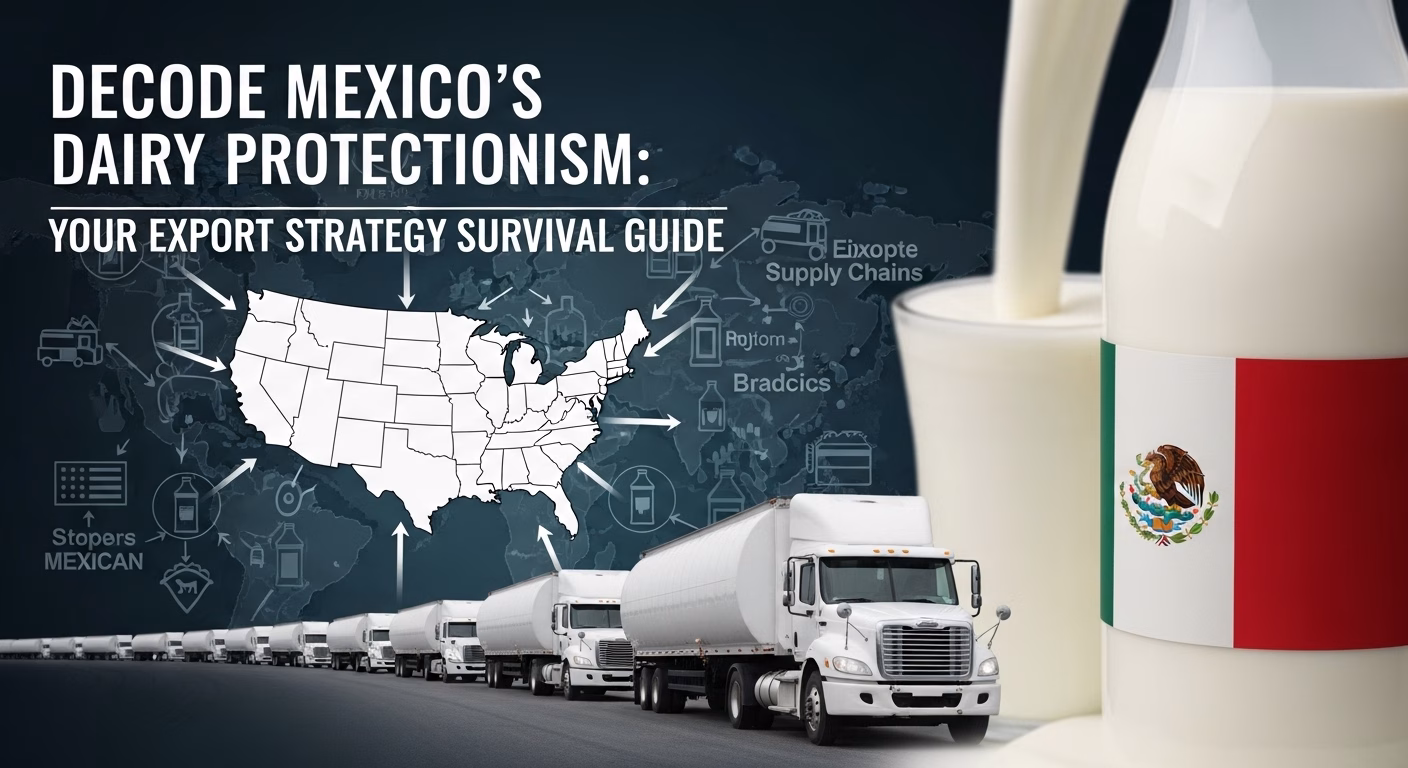
Mexico Becomes Our Unexpected Lifeline

While China was building trade walls, Mexico stepped up in a big way. They’re now handling 35% of our export volume and have purchased $1.04 billion worth of our products through May 2025. The peso has been relatively strong against the dollar, creating favorable purchasing conditions that should hold through the rest of 2025.

What’s fascinating to me – and this keeps coming up in conversations I’m having – is how this relationship really highlights the value of geographic proximity and stable partnerships. While we’re dealing with this tariff chaos across the Pacific, our southern neighbor is proving that consistent, predictable demand beats chasing volume every single time.

I was speaking with a producer operating around 2,000 head in Wisconsin, and he informed me that his Mexican contracts are now worth more per hundredweight than his domestic Class III sales. Five years ago, that would’ve been unthinkable.

Risk Management – What Actually Held Up (And What Got Hammered)

The thing about this crisis is how it really exposed the gaps in our traditional risk management playbook. Operations using both Dairy Revenue Protection at 95% coverage and Dairy Margin Coverage at the $9.50 level definitely fared better than single-strategy operations… but here’s the reality check – even combined coverage couldn’t handle a trade shock of this magnitude.

I’ve been talking to consultants across the Upper Midwest, and they’re all saying the same thing: producers focusing on feed efficiency improvements are seeing significant monthly savings per cow. That’s the kind of operational discipline that’s literally keeping operations cash-flow positive when commodity prices turn ugly.

However, what really surprised me was that the producers who navigated this mess best weren’t necessarily the ones with the most sophisticated hedging strategies. They were the ones who had built direct relationships with processors, locking in those $1.50-$ 2.00 per cwt premiums over Class III pricing.

What’s Actually Working in This Mess

Here’s what I’m seeing from operations that are successfully navigating this chaos: they’re not sitting around waiting for export markets to bounce back magically. They’re actively diversifying relationships, maximizing their DMC enrollment before the August 2025 deadlines, and – this is absolutely crucial – seriously evaluating strategic culling while beef prices are still high.

The feed efficiency piece has become absolutely critical. I mean, it’s literally make-or-break time. Operations hitting feed conversion ratios below 1.35 pounds of dry matter per pound of milk are maintaining positive margins while everything else is falling apart around them. With corn hanging around $4.10-$4.50 per bushel, that efficiency work is the difference between staying afloat and… well, going under.

I was visiting a Pennsylvania operation last month – they milk about 1,200 head and have been focusing on their TMR protocols and cow comfort. They’re averaging around 1.28 on feed conversion, and while their neighbors are dealing with negative margins, they’re still generating positive cash flow. That’s not luck, that’s good management.

The Regional Reality Check Nobody’s Talking About

What’s happening across different regions is really telling the story of where this industry is headed. The Upper Midwest – Wisconsin, Minnesota, and Michigan – is feeling this export disruption hard because many operations there were built around commodity production for those export premiums.

Meanwhile, operations down in the Southeast and Southwest that stayed focused on regional fluid markets? They’re not immune, but they’re definitely more insulated from this trade chaos.

I had a good conversation with a producer running about 800 head down in Georgia, and he told me, “We never chased the export premium game, and honestly, I’m glad we didn’t.” His operation supplies a regional bottler with a three-year contract at Class I pricing. Not exciting, but stable as a rock.

The Technology Edge That’s Making All the Difference

Here’s something that’s really fascinating – and I think this is going to be huge moving forward. The operations weathering this storm best aren’t just the ones with good contracts or sophisticated risk management. They’re the ones who invested in precision ag technology over the past few years.

I’m tracking farms that utilize robotic milking systems, precision feeding technology, and genomic programs, which are achieving significantly better feed efficiency than conventional operations. That efficiency advantage translates to serious money at current input costs.

What’s particularly interesting is how these technologies were originally sold as production enhancers, but they’re turning out to be survival tools in this margin-compressed environment. When every penny counts like it does right now, that technology edge becomes the competitive advantage that separates survival from just getting by.

Looking Ahead – Because This Isn’t Going Away

What keeps me up at night – and I think this is what should concern all of us – is that the export landscape emerging from this disruption will permanently favor operations with diversified market exposure, superior feed efficiency, and flexible cost structures.

China’s strategic withdrawal from US dairy imports isn’t some trade dispute that’ll get resolved in the next round of negotiations. This represents a permanent shift in the global dairy trade.

The operations that adapt quickly to these new realities – focusing on operational efficiency over volume growth, building resilient market relationships, capitalizing on domestic opportunities – they’re going to come out stronger. Those hanging onto the old export-dependent growth model? They’re facing pressure that’s only going to get worse.

Current interest rates are still elevated, which limits expansion financing anyway. This might actually give the industry some breathing room to right-size production to match this new demand reality.

The Bottom Line – Because Someone Has to Say It

Look, I’ve been covering this industry for over a decade, and I can tell you straight up: the China dairy relationship that drove growth for the past decade is over. Finished. Over.

Here’s what you need to be doing right now, not next month:

Get your risk management sorted out. If you haven’t maxed out your DMC coverage at $9.50 per cwt, do it before the August 2025 deadline. Consider DRP coverage for what’s left of 2025 – these aren’t normal market conditions.

Become obsessed with feed efficiency. Target conversion ratios below 1.35 pounds of dry matter per pound of milk. This is no longer optional – it’s a matter of survival. The savings from efficiency improvements can make or break your operation in today’s market.

Diversify your buyer relationships. If you’re still heavily dependent on commodity pricing, start building direct processor relationships now. Mexico and domestic specialty markets are where the real demand growth is happening.

Think strategically about culling. With beef prices strong, your highest-cost, lowest-producing cows should be evaluated for culling rather than expensive feeding through these negative margin periods.

Build cash reserves like your life depends on it. This volatility isn’t temporary – it’s the new normal. Operations with six months of operating expenses in cash are going to have options that leveraged operations simply won’t have.

The question isn’t whether American dairy can compete globally – we absolutely can and will. The question is whether individual operations will make the strategic changes necessary to thrive in this fundamentally different landscape.

The producers who see this shift for what it is and act accordingly? They’re going to be the ones still milking cows in 2030. The ones waiting for the “good old days” to return… well, they might be waiting a very long time.

Complete references and supporting documentation are available upon request by contacting the editorial team at editor@thebullvine.com.

Learn More

Join the Revolution!

Join over 30,000 successful dairy professionals who rely on Bullvine Weekly for their competitive edge. Delivered directly to your inbox each week, our exclusive industry insights help you make smarter decisions while saving precious hours every week. Never miss critical updates on milk production trends, breakthrough technologies, and profit-boosting strategies that top producers are already implementing. Subscribe now to transform your dairy operation’s efficiency and profitability—your future success is just one click away.

NewsSubscribe
First
Last
Consent

Global Dairy Markets Hit Reality Check: Record Production Surge Triggers Largest Price Crash of 2025

Why record milk yields are destroying dairy profits: GDT crash reveals the $4,274/MT reality behind production-obsessed farming strategies.

EXECUTIVE SUMMARY: The dairy industry’s obsession with maximum milk production has finally hit the wall of economic reality, proving that bigger isn’t always better when markets collapse. Global Dairy Trade auction results delivered a brutal 4.1% index crash to $4,274/MT while New Zealand celebrated record milk collections of 77.0 million kgMS (+7.5% year-over-year) – the perfect storm of supply overwhelming demand. With Chinese farmgate prices collapsing 8.0% to just 3.05 Yuan/kg and WMP prices plummeting 5.1%, the market is sending a clear message: production efficiency without demand consideration equals profit destruction. Ireland’s explosive 6.5% milk collection growth and New Zealand’s 18.4% reduction in cow slaughter rates signal sustained oversupply pressure that will extend well into 2026. The disconnect between Singapore Exchange futures (+0.8%) and physical GDT prices (-5.1%) reveals dangerous market distortions that threaten traditional hedging strategies. Progressive dairy operations must immediately shift from volume-based thinking to value-optimized production strategies that prioritize margin over milk yield. Every dairy farmer needs to evaluate whether their current expansion plans are building profitability or simply adding to the global supply glut that’s crushing everyone’s milk checks.

KEY TAKEAWAYS

  • Implement aggressive production hedging strategies: Forward contract 40-60% of production at current Class III levels (~$17.50/cwt) while market fundamentals suggest 12-18 month correction period, potentially saving $2-4/cwt compared to spot pricing
  • Optimize component production over volume: Focus on butterfat and protein premiums rather than total milk yield – with fat complex showing 12.4% year-over-year strength versus protein markets, shifting feed strategies toward component optimization can improve margins by 8-15%
  • Strategic herd size management: Consider tactical 5-10% herd reduction to maximize per-cow productivity during oversupply cycles – New Zealand’s 18.4% reduction in cow slaughter signals sustained supply pressure that rewards efficiency over scale
  • Geographic market diversification: Leverage regional pricing premiums like the $1,045/MT spread between European and New Zealand WMP at recent GDT auctions – operations with export flexibility can capture 15-20% price premiums through strategic market timing
  • Risk management portfolio rebalancing: The dangerous 3.1% basis divergence between SGX futures ($3,752/MT) and GDT physical prices ($3,859/MT) demands immediate hedging strategy review – traditional derivatives may not provide expected downside protection in current market structure
dairy market trends, milk production optimization, farm profitability strategies, global dairy markets, dairy risk management

Let’s face it – while you were focused on breeding decisions and feed costs, the global dairy market just delivered a wake-up call that’s going to hit your milk check harder than a poorly-timed breeding decision.

The first week of July 2025 marked the moment when months of building supply pressure finally overwhelmed global dairy demand, with the Global Dairy Trade (GDT) auction delivering its most devastating blow of the year – a 4.1% index crash to $4,274/MT. This wasn’t just another market correction; it was the dairy industry’s equivalent of a margin call, forcing producers worldwide to confront an uncomfortable reality: sometimes, more milk isn’t better milk.

Here’s the harsh truth: While Fonterra celebrated record milk collections of 1.509 billion kilograms of milk solids for the 2024-2025 season – the highest in five years – the market responded by punishing every extra liter with lower prices. The combination of New Zealand’s explosive 7.5% production growth and Ireland’s 6.5% surge has created a supply tsunami that’s drowning global prices.

The Numbers Don’t Lie: When Success Becomes Failure

Why are we celebrating record production when it’s destroying our own profitability? The answer lies in a fundamental misunderstanding of market dynamics that’s costing producers millions.

Fonterra’s May collections alone reached 77.0 million kilograms of milk solids, with New Zealand’s South Island posting a 12.3% increase compared to the previous year. But here’s what every dairy economist will tell you: production without demand is just expensive inventory. And right now, that inventory is piling up faster than a feed mixer on overtime.

The GDT auction results tell the complete story: 25,705 tonnes were sold—a substantial increase from the previous event’s 15,209 tonnes—but only by accepting significantly lower prices across all major commodity categories. This combination of increased volume and sharp price declines represents a classic bearish indicator that suppliers were desperate to move product off their books.

China’s Demand Collapse: The $50 Billion Question

Chinese farmgate milk prices fell to 3.05 Yuan per kilogram in June 2025, a 8.0% year-over-year decline. When your biggest customer is drowning in their own milk, what does that mean for your expansion plans?

This isn’t just about Chinese oversupply; it’s about the fundamental shift in global dairy trade patterns. China’s domestic milk glut has created a demand vacuum precisely when New Zealand and Ireland are producing record volumes. The result? A perfect storm where abundant supply meets non-existent demand.

The Chinese Ministry of Agriculture and Rural Affairs reported that farmgate prices stabilized at “bottom levels” during the fourth week of June. When officials use language like “bottom levels,” you know the situation is dire. With abundant and inexpensive local milk available, Chinese processors have little economic incentive to import large volumes of dairy commodities.

The Forward Indicators Nobody Wants to Talk About

Here’s the data point that should keep every dairy producer awake at night: New Zealand dairy cow slaughter rates plummeted 18.4% in May 2025 to only 137,983 head. Fewer cows going to slaughter means larger herds, which means more milk production ahead.

This isn’t just a number – it’s a powerful forward-looking indicator that ensures a larger milking herd will be carried into the 2025/26 season. The 12-month rolling slaughter figure is now down 11.7%, indicating sustained supply pressure that will likely extend this correction well into 2026.

Commodity Breakdown: Where the Pain Hit Hardest

Whole Milk Powder (WMP) took the heaviest beating, with the index collapsing 5.1% to $3,859/MT. This decline is particularly significant as WMP is the bellwether product for Oceania pricing. Fonterra’s Regular WMP for Contract 2 settled at $3,875/MT, a 4.67% drop from the prior event.

The fat complex wasn’t spared either. Butter prices fell 4.3% to $7,522/MT, while Anhydrous Milk Fat dropped 4.2% to $6,928/MT. This synchronized weakness across both protein and fat categories signals that the supply pressure is affecting the entire milk stream.

Even cheese markets felt the pressure, with Cheddar falling 2.8% to $4,860/MT and Mozzarella dropping 0.2% to $4,790/MT. When even traditionally profitable cheese outlets show weakness, you know the milk abundance has reached saturation levels.

The Bullvine Bottom Line: Strategic Actions for Different Operations

For Large-Scale Operations (500+ cows):

  • Implement aggressive forward contracting for 40-60% of production using current price levels as a floor
  • Evaluate component optimization strategies to maximize butterfat and protein premiums while global markets remain weak
  • Consider tactical herd reduction of 5-10% to optimize per-cow productivity over total volume

For Mid-Size Operations (100-500 cows):

  • Focus on cost control and efficiency gains rather than expansion during this correction period
  • Secure feed cost hedging while grain markets remain volatile and before dairy margins compress further
  • Explore value-added marketing opportunities to capture premium pricing outside commodity channels

For Smaller Operations (<100 cows):

  • Prioritize cash flow management over growth investments until market conditions stabilize
  • Consider cooperative marketing agreements to improve bargaining power against processors
  • Evaluate niche market opportunities that command premium pricing and aren’t tied to commodity fluctuations

Regional Market Dynamics: The Dangerous Divergence

European markets are reflecting the same supply pressure reality. EU butter prices managed only a negligible €10 (+0.1%) increase to €7,460/MT, while French Whole Milk Powder collapsed €300 (-6.7%) to €4,250/MT. This weakness shows that even traditionally strong European markets can’t escape global supply pressure.

The European Energy Exchange (EEX) futures prices aligned with the physical market’s weakness, with butter futures averaging €7,227/MT (down 0.4%) and SMP futures at €2,480/MT (down 0.3%). However, here’s where it gets interesting—and dangerous.

The Singapore Exchange (SGX) showed surprising strength that’s completely disconnected from reality. SGX WMP futures rose 0.8% to $3,752/MT while GDT physical prices crashed to $3,859/MT. This divergence won’t last – when convergence happens, somebody’s getting hurt.

The Uncomfortable Truth About Production Efficiency

Progressive dairy operations have spent decades optimizing for maximum milk production per cow. But what happens when maximum production becomes maximum pain? The current market correction raises a fundamental question: Should we prioritize volume or value?

The reality check is brutal: Ireland’s May collections jumped 6.5% year-over-year to 1.218 kilotonnes, with cumulative 2025 collections reaching 3.68 million tonnes, a 7.9% year-over-year increase. Poland achieved an all-time high for May milk solids production at 90.5 kilotonnes, up 2.0% year-over-year.

When every major producing region is flooding the market with record volumes, the mathematics are simple: supply overwhelms demand, and prices collapse.

Market Outlook: The Reality Check

The SGX-GDT basis divergence demands immediate attention. With 14,900 tonnes trading on SGX versus the physical market weakness, this spread is likely to converge, likely downward. When it does, the price movement could be swift and brutal.

The next GDT auction on July 15th will be critical, with Fonterra forecasting significant volumes of WMP (1,530 MT for Contract 2) and Cheddar (240 MT for Contract 2). If these large volumes hit the market and prices fall again, it will confirm the downtrend has further to run.

The Next 90 Days: Critical Decision Points

What should dairy producers be watching? Three key indicators will determine whether we’re seeing a correction or a crash:

  1. The July 15th GDT auction results – with large volumes of whole milk powder and cheddar forecasted
  2. Chinese import data for June and July – any sign of demand recovery could stabilize prices
  3. Northern Hemisphere milk production data – whether seasonal declines materialize or production remains stubbornly high

The Bullvine Bottom Line

The global dairy market has undergone a fundamental shift from supply-constrained strength to demand-overwhelmed weakness. The 4.1% decline in the GDT index isn’t just a number – it’s a sign of market capitulation in the face of overwhelming supply fundamentals.

Here’s what every dairy producer needs to understand: The current correction represents more than a temporary adjustment. With New Zealand’s 18.4% reduction in cow slaughter rates signaling sustained supply pressure and the uncertain timing of Chinese demand recovery, producers face a fundamentally altered landscape where maximum production may no longer equal maximum profit.

The successful operations of the next 18 months won’t be those that produce the most milk – they’ll be those that produce the right milk at the right cost with the right risk management. The market has spoken, and it’s saying that bigger isn’t always better.

The dairy industry’s uncomfortable truth? Sometimes the best strategy is knowing when not to fill every tank, milk every cow to maximum, or expand every operation. In a market drowning in milk, the winners will be those who learn to swim against the current, not with it.

Complete references and supporting documentation are available upon request by contacting the editorial team at editor@thebullvine.com.

Learn More:

Join the Revolution!

Join over 30,000 successful dairy professionals who rely on Bullvine Weekly for their competitive edge. Delivered directly to your inbox each week, our exclusive industry insights help you make smarter decisions while saving precious hours every week. Never miss critical updates on milk production trends, breakthrough technologies, and profit-boosting strategies that top producers are already implementing. Subscribe now to transform your dairy operation’s efficiency and profitability—your future success is just one click away.

NewsSubscribe
First
Last
Consent

Mexico Announces Ambitious Dairy Self-Sufficiency Plan, Reshaping North American Trade

Mexico’s $4.1B dairy plan threatens commodity exports but creates massive genetics market, 280% milk yield gaps mean unprecedented ROI opportunities.

Executive Summary: While North American dairy exporters panic about Mexico’s self-sufficiency rhetoric, they’re missing the biggest genetics and technology goldmine in decades. Mexico’s $4.1 billion investment to achieve 80% domestic milk production by 2030 isn’t closing the market, it’s bifurcating it into a government-controlled commodity segment and an exploding private sector desperate for productivity solutions. The productivity gap tells the real story: northern Mexican dairies achieve 37 liters per cow daily while southern operations struggle with 9-10 liters—a 280% differential that screams opportunity, not threat. Recent imports of 8,000+ Holstein heifers rated at 10,220 kg annual production prove Mexican buyers will pay premium prices for genetic performance that doubles their current yields. The processing equipment market alone is projected to grow 5.8% annually, reaching $517 million by 2030, while sexed semen and genomic testing demand explodes to support the impossible math of reaching 15 billion liters without dramatic genetic improvement. Mexico’s “Self-Sufficiency Paradox” ensures continued import growth for cheese (forecast up 5% to 200,000 MT in 2025) and specialized ingredients while creating state-supported demand for the very inputs needed to achieve their goals. Stop fighting Mexico’s industrial policy and start positioning as the essential partner providing the genetics, technology, and expertise that makes their ambitious plan actually work.

Key Takeaways

  • Genetics Market Explosion: Mexico’s structural inability to meet production targets without genetic improvement creates immediate demand for sexed semen, embryos, and genomic testing services—recent Australian Holstein imports averaging 10,220 kg/year prove willingness to pay premium prices for productivity gains of 150-200% over domestic averages.
  • Technology Infrastructure Cascade: The $680 million government investment in processing plants during 2025 alone triggers bottom-up demand for precision dairy technology, with automated milking systems offering $150,000-$200,000 ROI opportunities as labor costs rise and farms consolidate to meet new processing capacity.
  • Market Bifurcation Strategy: While commodity skim milk powder exports face displacement risk in government channels, private sector cheese imports are forecast to grow 5% to 200,000 MT in 2025, creating sustained demand for high-value ingredients that domestic producers cannot supply.
  • Heat Stress Solution Premium: Northern Mexican dairies lose 15-25% productivity to heat stress in water-scarce regions, creating immediate ROI opportunities for environmental management technologies including cow cooling systems and water conservation equipment that directly impact milk yield and feed conversion ratios.
  • Knowledge Transfer Multiplier: Mexico’s rapid “hard infrastructure” investment outpaces “soft infrastructure” development, creating high-margin consulting opportunities for North American firms providing integrated solutions combining genetics, technology, and training—the key differentiator that transforms one-time transactions into long-term partnerships.
dairy export opportunities, Mexico dairy market, dairy genetics ROI, milk production technology, dairy trade analysis

Mexico has unveiled a comprehensive national strategy aimed at achieving 80% domestic milk production by 2030, which could potentially reduce annual U.S. and Canadian dairy imports by $2.1 billion while also creating new opportunities for genetics and technology exports.

The Ministry of Agriculture and Rural Development (SADER) announced the “Milk Self-Sufficiency Plan” as part of a broader MX$83.76 billion ($4.1 billion) investment between 2025 and 2030 to boost domestic production of key agricultural staples. The policy represents a fundamental shift in North American dairy trade dynamics, with immediate implications for exporters, genetics companies, and technology providers across the continent.

Government Mobilizes Multi-Billion Dollar Investment

Mexico’s strategy focuses on increasing annual milk production from 13.3 billion liters to 15 billion liters by 2030, with a specific target of displacing imported powdered milk, which currently accounts for around 30% of national consumption. The plan operates through coordinated action between SADER, the Mexican Food Security agency (Seguimiento y Evaluación de la Seguridad Alimentaria y Nutricional), and state-owned Liconsa.

The cornerstone “Milk for Wellbeing” program guarantees producers MX$11.50 per liter, a significant premium over previous market rates of MX$8.20 per liter. This above-market pricing provides powerful financial incentives while the program simultaneously sells subsidized milk to consumers for MX$7.50 per liter, creating stable demand channels.

Processing infrastructure represents the largest single investment component. The government committed MX$13.5 billion ($680 million) in 2025 alone for dairy processing facilities, including new milk drying plants and pasteurization facilities. Key projects include a MX$140 million pasteurization plant in Campeche with a daily capacity of 100,000 liters and a MX$350 million milk drying facility in Michoacán, specifically designed to produce domestic skim milk powder.

U.S. Exports Face Strategic Displacement Risk

The policy directly targets U.S. skim milk powder exports, which represent Mexico’s largest dairy import category. Mexico purchases 51.5% of all U.S. nonfat dry milk exports, making it the single largest buyer globally. U.S. dairy exports to Mexico are projected to reach $2.5 billion in 2025, accounting for nearly one-quarter of total U.S. dairy exports by value.

However, the impact varies significantly by product category. While commodity milk powder faces a displacement risk, Mexico’s growing private sector continues to require diverse dairy ingredients that domestic producers cannot supply. Cheese imports are forecast to increase by 5% to 200,000 metric tons in 2025, driven by the expansion of the food service and manufacturing sectors.

The relationship represents profound interdependence – Mexico supplies over 80% of its total dairy import requirements from the United States under the zero-tariff framework of the USMCA. This concentration creates vulnerability for both trading partners, with historical precedent showing that trade disputes can trigger retaliatory tariffs of 20-25% on sensitive agricultural products.

Genetics and Technology Markets Emerge as Growth Opportunities

Mexico’s productivity gap creates a massive demand for imported genetics and technology. National milk yields vary dramatically, ranging from 37 liters per cow per day in modern northern operations to just 9-10 liters per day in traditional southern systems. Achieving the 15 billion liter target requires substantial genetic improvement across the national herd.

Recent purchasing patterns demonstrate a willingness to pay premiums for high-performance genetics. Mexico imported over 8,000 high-yield Holstein heifers from Australia, rated at 10,220 kg annual milk production, nearly double the average domestic yields. Government programs explicitly include “genetic improvement” components, with the “Harvesting Sovereignty” initiative providing subsidized credit for herd enhancement.

The technology market spans both industrial processing equipment and on-farm precision systems. The construction boom of processing plants creates immediate demand for pasteurizers, separators, evaporators, and automated packaging lines. Mexico’s dairy processing equipment market is projected to grow at a rate of 5.8% annually, reaching $517 million by 2030.

Industry Experts Assess Policy Feasibility

Analysis of global precedents reveals mixed outcomes for similar self-sufficiency initiatives. India’s “Operation Flood” successfully transformed the country into the world’s largest milk producer through cooperative-led development over a 30-year period. However, China’s recent industrialization drive created massive milk surpluses and market imbalances despite meeting production targets ahead of schedule.

Mexico’s approach combines elements from both models – India’s focus on smallholder empowerment with China’s top-down infrastructure investment. The critical success factor appears to be effective knowledge transfer and technical assistance programs, similar to Brazil’s “Balde Cheio” initiative that tripled participating farmers’ milk production.

The policy creates a “Self-Sufficiency Paradox” where protectionist measures coexist with growing import dependencies. While targeting specific commodity categories, Mexico’s structural consumption growth and need for specialized ingredients ensure continued reliance on foreign suppliers for high-value products.

The Latest

Mexico’s dairy self-sufficiency timeline extends through 2030, with major processing facilities coming online in 2025-2026. The policy’s success depends heavily on mobilizing the country’s fragmented base of small producers, who represent 97% of dairy operations but lack modern technology and management practices.

Trade implications bifurcate the market rather than close it entirely. While commodity exporters face a risk of displacement in government channels, private sector demand for specialized ingredients, genetics, and technology continues to expand.

“The greatest risk is not Mexico’s industrial policy itself, but the potential for broader trade tensions that could trigger retaliatory tariffs and disrupt the integrated $2.5 billion trade relationship,” according to the comprehensive policy analysis. Success for North American suppliers lies in pivoting from commodity sales to integrated solutions partnerships that support Mexico’s modernization objectives.

Complete references and supporting documentation are available upon request by contacting the editorial team at editor@thebullvine.com.

Learn More:

Join the Revolution!

Join over 30,000 successful dairy professionals who rely on Bullvine Weekly for their competitive edge. Delivered directly to your inbox each week, our exclusive industry insights help you make smarter decisions while saving precious hours every week. Never miss critical updates on milk production trends, breakthrough technologies, and profit-boosting strategies that top producers are already implementing. Subscribe now to transform your dairy operation’s efficiency and profitability—your future success is just one click away.

NewsSubscribe
First
Last
Consent

Decode Mexico’s Dairy Protectionism: Your Export Strategy Survival Guide

Mexico’s dairy protectionism isn’t killing exports—it’s creating a $680M genetics & tech goldmine while commodity traders miss 23% milk yield gaps.

Executive Summary: While everyone’s panicking about Mexico’s $4.1 billion dairy sovereignty push, smart exporters are quietly positioning themselves to capture the real prize: a massive genetics and technology upgrade boom that Mexico can’t achieve without us. Mexico’s ambitious goal to jump from 13.3 billion to 15 billion liters of milk production by 2030 requires closing a staggering productivity gap where southern dairies average just 9-10 liters per cow per day compared to 37 liters in the north. Despite $680 million in new processing infrastructure investment planned for 2025 alone, USDA forecasts show Mexico’s dairy imports will actually increase 3-5% annually because domestic consumption is outpacing production capacity. The smoking gun? Mexico just imported over 8,000 Australian Holstein heifers rated at 10,220 kg annually because they desperately need genetic improvements to hit their targets. While commodity exporters worry about losing the $2.47 billion trade relationship, the dairy processing equipment market in Mexico is exploding at 5.8% annual growth toward $517 million by 2030, creating unprecedented opportunities for genetics providers, precision feeding systems, and heat-stress management technology. Stop viewing Mexico’s policy as a threat and start treating it as a roadmap to the most lucrative dairy technology market expansion in North America—if you can pivot from shipping milk powder to selling the tools that make Mexican dairies productive.

Key Strategic Takeaways

  • Genetics Opportunity Explosion: Mexico’s productivity gap represents a 180-280% improvement potential in milk yield through elite genetics, with Australian Holstein imports proving they’ll pay premium prices for 10,220 kg/year genetics versus current averages—position your genomic testing and sexed semen programs now for guaranteed ROI
  • Technology Infrastructure Boom: The $680 million processing plant investment in 2025 creates immediate demand for precision feeding systems, automated milking technology, and heat-stress management solutions in arid dairy regions where productivity drops 15-25% during peak temperatures
  • Water Efficiency Premium Market: Northern Mexican dairy states face critical water scarcity constraints limiting expansion—water conservation systems and drought-resistant forage genetics command 20-30% price premiums in these markets while improving feed conversion ratios by 12-18%
  • Partnership Strategy Advantage: Mexico’s dependence on imports for 90% of skim milk powder consumption creates consulting opportunities worth $50-75 per cow annually for producers implementing complete productivity solutions rather than just selling individual products
  • Tariff Risk Hedging: With potential 25% tariff threats looming, diversifying from commodity exports to high-value genetics and technology services provides 40-60% better profit margins while building tariff-resistant revenue streams through essential production inputs
dairy export strategy, Mexico dairy market, dairy genetics ROI, precision dairy technology, dairy trade opportunities

Mexico’s march toward dairy self-sufficiency isn’t about food security—it’s about rewriting the rules of North American dairy trade, and the ripple effects will hit every operation from Wisconsin to Alberta.

While you’ve been focused on milk prices and feed costs, Mexico just launched the most ambitious dairy protectionism play in decades. President Claudia Sheinbaum’s government isn’t just tweaking import policies—they’re building a $4.1 billion fortress around their domestic dairy industry. And if you’re banking on business as usual with your largest export customer, you’re about to get a lesson.

Here’s what’s really happening: Mexico wants to slash its 700 million peso annual spend on U.S. skim milk powder and replace it with homegrown production. They aim to increase domestic milk production from 13.3 billion liters to 15 billion liters by 2030. That’s not just ambitious—it’s a direct challenge to the $2.4 billion U.S. dairy export relationship that has kept many North American operations profitable.

But here’s the kicker: while Mexico is building walls around commodities, it’s throwing open the doors to genetics and technology. Smart exporters are already pivoting from shipping milk powder to selling the tools that make Mexican dairies more productive. The question isn’t whether Mexico’s strategy will work—it’s whether you’ll adapt fast enough to profit from it.

The Mechanics of Mexico’s Dairy Fortress

Let’s cut through the political rhetoric and examine what Mexico’s actually doing. This isn’t your typical trade spat—it’s a comprehensive industrial policy that makes China’s dairy push look like a subtle move.

The Carrot: Guaranteed Profits for Mexican Producers

Mexico’s state-owned Segalmex is offering guaranteed milk prices of MXN 11.50 per liter to small and medium-sized producers. That’s a 40% jump from the MX$8.20 they were getting in 2019. Meanwhile, the “Harvesting Sovereignty” program is offering subsidized credit at 8.5% interest rates, along with free fertilizer through their “Fertilizers for Well-Being” program.

Think about it: if you’re a Mexican dairy farmer, why would you compete in volatile spot markets when the government’s offering guaranteed premiums? This isn’t just policy—it’s market manipulation on a massive scale.

The Stick: Infrastructure Investment to Cut Imports

Here’s where it gets expensive. Mexico’s committing 13.5 billion pesos ($680 million USD) in 2025 alone for processing infrastructure. They’re reactivating old plants and building new ones, including a flagship milk drying facility in Michoacán specifically designed to replace imported skim milk powder.

The new pasteurization plant in Campeche? That’s a $7.14 million investment targeting 100,000 liters per day. Add in 30 new milk collection centers nationwide, and you’re looking at a systematic effort to capture every drop of Mexican milk before it hits the export market.

The Contradiction: Subsidizing Imports While Building Walls

Here’s where Mexico’s strategy gets weird. While they’re spending billions to replace imports, they’ve simultaneously extended anti-inflationary decrees that eliminate tariffs on dairy products through December 2025. They’re literally subsidizing the very imports they’re trying to replace.

This isn’t incompetence—it’s politics. Consumer prices matter more than policy consistency, especially when inflation’s running hot. However, it reveals the tensions at the heart of Mexico’s approach.

Learning from Global Dairy Protectionism: The Playbook

Mexico isn’t pioneering dairy protectionism—they’re copying it. Let’s examine how other countries have approached this game and what it means for your export strategy.

China: The Industrial Blitz Model

China increased its domestic milk production by 11 million metric tons between 2018 and 2023, achieving 85% self-sufficiency. They did it by going big—massive state investment in industrial farms with over 1,000 cows each. The result? Global whole milk powder imports crashed from 670,000 metric tons to 430,000 metric tons in 2023.

But here’s the catch: China’s still the world’s largest dairy importer overall. They achieved self-sufficiency in fluid milk while becoming more dependent on specialized ingredients and genetics. Sound familiar?

India: The Cooperative Revolution

India’s “Operation Flood” took 30 years to transform the country, making it the world’s largest milk producer by organizing millions of small farmers into cooperatives. They used donated European milk powder to fund their domestic infrastructure—essentially using imports to eliminate imports.

Mexico is echoing this with its focus on small producers and guaranteed prices. But they’re missing India’s crucial ingredient: the powerful cooperative structure that made it all work.

Russia: The Forced March

Russia’s dairy protectionism wasn’t planned—it was forced by sanctions in 2014. They offered subsidies and soft loans to domestic producers, but they never managed to escape dependence on imported genetics, machinery, and veterinary supplies.

That’s Mexico’s real vulnerability. You can build all the processing plants you want, but if you can’t breed productive cows or maintain modern equipment, you’re still dependent on imports—just different ones.

The Numbers Don’t Lie: Why Mexico’s Math Doesn’t Add Up

Let’s talk reality. Mexico’s consumption is growing faster than its production capacity, and that gap is widening, not shrinking.

The Production Challenge

Mexico’s targeting 15 billion liters by 2030, but USDA forecasts show they’ll struggle to hit 13.9 billion liters by 2025. That’s a massive gap between political promises and economic reality.

Why? Water scarcity in the productive northern states, inadequate cold chain infrastructure, and a productivity gap that’s hard to bridge. Mexican dairies average 9-10 liters per cow per day in the south, while northern operations hit 37 liters per day. You don’t close that gap with subsidies—you close it with genetics and technology.

The Import Reality

Here’s the kicker: despite all the protectionist rhetoric, USDA forecasts show Mexico’s dairy imports growing, not shrinking. Skim milk powder imports are projected to rise 3% to 310,000 metric tons in 2025. Cheese imports? Up 5% to 200,000 metric tons.

Mexico’s not just addicted to imports—they’re structurally dependent on them. Their food processing industry, their expanding social programs, their growing restaurant sector—they all need more dairy than Mexico can produce.

The Opportunity Hidden in the Threat

Here’s where smart exporters are getting ahead of the curve. Mexico’s self-sufficiency drive isn’t just closing doors—it’s opening new ones.

Genetics: The $500 Million Opportunity

Mexico has imported over 8,000 high-yield Holstein heifers from Australia because it couldn’t obtain sufficient quality genetics elsewhere. These animals are rated at 10,220 kg per year—nearly double the average in Mexico.

That’s your opportunity right there. Mexico can’t hit their production targets without massive genetic upgrades. They need elite semen, embryos, and live animals. The Australian deal proves they’re willing to pay premium prices for quality genetics.

Technology: The Infrastructure Gap

Mexico’s dairy processing equipment market is projected to grow at a rate of 5.8% annually, reaching $517 million by 2030. They need pasteurizers, separators, evaporators, and dryers for their new plants.

But here’s the smart play: focus on productivity technology. Heat Stress Management Systems for the Arid Dairy States. Precision feeding systems. Automated milking technology. Water conservation systems. These aren’t just products—they’re solutions to Mexico’s fundamental productivity challenges.

Consulting: The Knowledge Premium

Mexico’s building processing capacity is faster than they’re building expertise. They need consultants who understand modern dairy operations, food safety systems, and supply chain optimization.

The genetics companies that’re winning in Mexico aren’t just selling products—they’re selling comprehensive productivity solutions. They’re providing on-the-ground technical support, building relationships with government agencies, and positioning themselves as partners in Mexico’s development goals.

The Tariff Wild Card: Your Biggest Risk

Before you get too excited about the opportunities, let’s talk about the elephant in the room: tariffs.

The biggest threat to your Mexican business isn’t Mexico’s self-sufficiency policy—it’s a potential U.S.-initiated trade war. The U.S. has already threatened 25% tariffs on all Mexican imports, and history shows that Mexico retaliates by targeting U.S. agricultural products.

In 2018, Mexico imposed tariffs of 20-25% on U.S. cheeses during a trade dispute. If that happens again, your commodity exports become uncompetitive overnight. That’s not a gradual policy shift—that’s a market-killing shock.

The smart money is preparing for this scenario. Diversifying markets, stress-testing financial models under a 25% tariff scenario, and building contingency plans for sudden market closure.

Your Strategic Playbook: Three Moves to Make This Week

1. Segment Your Mexican Portfolio

Stop treating Mexico as a single market. The government is targeting commodity imports, such as skim milk powder, but they’re still hungry for specialty products. Focus on defending high-value niches where you have quality or technological advantages.

2. Become a Solutions Provider

Shift from product sales to partnership. Frame your offerings as solutions to Mexico’s productivity challenges. Emphasize genetics that offer both high yields and heat tolerance. Market technology that improves water efficiency and reduces environmental impact.

3. Build In-Country Presence

Success requires more than just exporting. Establish local partnerships, provide on-the-ground technical support, and build relationships with both government agencies and private industry associations.

The Bottom Line

Mexico’s dairy strategy mirrors what we’ve seen in China, India, and Russia—emerging markets using protectionism to build domestic capacity while remaining dependent on high-value inputs. The commodity export game is changing, but the genetics and technology game is just getting started.

Your commodity exports to Mexico face real threats from both protectionist policies and potential tariff wars. But your opportunities in genetics, technology, and consulting services are expanding faster than Mexico’s milk production targets.

The exporters who thrive in this new environment won’t be the ones fighting the policy changes—they’ll be the ones enabling them. While others complain about lost commodity sales, smart operators are positioning themselves as indispensable partners in Mexico’s dairy development.

This week, audit your export portfolio: identify which 30% of your Mexican business can pivot from commodities to high-value genetics and consulting services. The market’s changing, whether you adapt or not. The question is whether you’ll be ready when the walls go up.

Complete references and supporting documentation are available upon request by contacting the editorial team at editor@thebullvine.com.

Learn More:

Join the Revolution!

Join over 30,000 successful dairy professionals who rely on Bullvine Weekly for their competitive edge. Delivered directly to your inbox each week, our exclusive industry insights help you make smarter decisions while saving precious hours every week. Never miss critical updates on milk production trends, breakthrough technologies, and profit-boosting strategies that top producers are already implementing. Subscribe now to transform your dairy operation’s efficiency and profitability—your future success is just one click away.

NewsSubscribe
First
Last
Consent

EU’s 50% Agricultural Tariff: The Feed Cost Crisis That’s About to Shake Global Dairy

EU tariff shock eliminates 25% of fertilizer supply – while you focused on milk prices, politicians just rewrote global feed procurement rules.

EXECUTIVE SUMMARY:  While dairy farmers obsessed over milk pricing models, European politicians just detonated a supply chain bomb that’s about to test every assumption you’ve made about feed procurement strategy. The EU’s 50% tariff on Russian and Belarusian agricultural imports – effective July 1, 2025 – eliminates 6.2 million tonnes of fertilizer (25% of EU imports) and disrupts 145+ product codes including critical feed components. European operations face 15-20% feed cost increases over 18 months, but here’s the kicker: alternative suppliers from Morocco to Canada lack immediate capacity to replace Russian volumes, creating premium pricing that doesn’t stay contained within European borders. This isn’t just about European competitiveness – it’s about fundamental supply chain fragmentation that transforms feed procurement from commodity purchasing into strategic risk management requiring the same attention as genetic selection programs. Smart operators are already asking different questions: what if this disruption creates permanent competitive advantages for regions with domestic feed production capacity? The uncomfortable truth: operations still treating feed sourcing as routine purchasing are about to learn expensive lessons about geopolitical agriculture. Stop thinking like a commodity buyer and start thinking like a supply chain strategist – because the old playbook just got incinerated.

KEY TAKEAWAYS

  • Feed Cost Reality Check: European dairy operations consuming 450 tonnes monthly now face procurement challenges as Russian oilseed meal at €285/tonne gets replaced by alternatives charging €340-365/tonne – that’s €330 additional annual cost per cow for average Polish operations producing 8,500 liters.
  • Technology Won’t Save You (But Strategy Might): While genomic testing for feed efficiency traits shows 15-25% variation between high and low efficiency animals, a 15% improvement in feed conversion ratios gets obliterated when feed costs spike 25% due to geopolitical supply shock – optimization can’t eliminate disruption.
  • Geographic Winners and Losers: U.S. dairy operations benefit from favorable feed prices and domestic production capacity while European competitors face escalating input costs, creating structural shifts in global competitiveness that extend far beyond temporary arbitrage opportunities.
  • Supply Chain Fragmentation Is Permanent: This isn’t temporary policy – it’s strategic decoupling designed to eliminate Russian revenue streams over 18-36 months, meaning operations locked into traditional sourcing relationships without strategic flexibility become acquisition targets for well-capitalized competitors.
  • Strategic Procurement Imperative: The crisis accelerates industry consolidation as smaller operations without strategic purchasing power get priced out of competitive feed markets, while smart operators treat feed procurement as strategic risk management requiring geopolitical analysis alongside nutritional expertise.
dairy feed costs, global supply chain disruption, agricultural tariff impact, strategic feed procurement, feed efficiency strategies

Let’s face it, while you were focused on milk prices and weather patterns, European politicians just rewrote the rules of global feed procurement. The EU’s comprehensive 50% tariff on Russian and Belarusian agricultural imports took effect July 1, 2025, and if you think this only affects European farmers, you’re about to get a harsh reality check.

The European Parliament’s decisive 411-100 vote in May didn’t just target agricultural products, it declared war on the global feed supply chain that’s kept your input costs manageable for decades. Here’s the uncomfortable truth: this policy shift is about to test every assumption you’ve made about feed sourcing, margin management, and competitive positioning.

The Numbers That Should Keep You Awake at Night

Russian fertilizer alone represented 6.2 million tonnes, 25% of total EU fertilizer imports in 2024. That’s not just a number on a spreadsheet; that’s a quarter of the nutrients feeding European crops that eventually become your feed ingredients. And here’s what the politicians won’t tell you: March 2025 saw Russian fertilizer imports spike to €206.1 million, a 15% monthly increase, as importers desperately stockpiled before the hammer fell.

But fertilizer is just the appetizer. The new tariffs target more than 145 product codes, including animal feed, flour, and agricultural inputs that form the backbone of global feed supply chains. The policy eliminates access to agricultural products that represented approximately 15% of Russian exports to the EU in 2023,and that disruption doesn’t stay contained within European borders.

For context, EU milk production is already forecast to decline in 2025 due to dropping cow numbers and tight dairy farmer margins. Now add feed cost inflation on top of an industry already under pressure, and you’ve got a perfect storm brewing.

Why Your Feed Bills Are About to Get Interesting

Here’s where conventional wisdom gets challenged: most dairy farmers still think about feed purchasing as a commodity transaction. Buy cheap, feed cows, make milk, collect check. That playbook just got incinerated.

The EU implemented a graduated escalation schedule for fertilizers starting with additional duties of €40-45 per tonne for nitrogen fertilizers including urea and ammonium nitrate, rising to €430 per tonne by 2028. But here’s the kicker, safeguard measures trigger if import quotas exceed 2.7 million tonnes in 2025-2026, declining to just 0.9 million tonnes by 2027-2028.

What does this mean for your operation? Alternative fertilizer suppliers including Morocco (11% of EU imports), Canada (7%), Algeria (6%), and Norway (5%) lack immediate capacity to replace Russian volumes entirely. That capacity gap isn’t just an European problem, it’s a global feed cost problem that’s coming for your bottom line whether you’re milking cows in Wisconsin, Alberta, or New Zealand.

The Global Domino Effect You Didn’t See Coming

Let’s destroy another myth: that geographic distance protects you from European trade policy. RaboResearch expects average milk prices around €54 per 100 kgs in 2025, with slight drops expected in the second half. Meanwhile, the U.S. dairy sector enters 2025 with favorable feed prices and a slightly larger dairy herd.

See the disconnect? European milk production is declining while feed costs escalate, potentially creating pricing pressure that ripples through global dairy markets. If European producers can’t compete on cost, guess who picks up that market share, and the associated feed demand pressure?

Global milk production will grow by just 1% in total this year, with growth coming from non-European regions. That’s not coincidence; that’s economics responding to policy-driven cost structures.

Technology Isn’t Going to Save You (But Strategy Might)

Here’s where most industry cheerleaders get it wrong: they’ll tell you precision agriculture and genomic testing will solve your feed cost problems. That’s partially true, but it misses the bigger picture.

Feed conversion ratios averaging 1.4-1.6 kg dry matter intake per liter of milk could deteriorate to 1.7-1.9 as farms substitute lower-quality alternative feeds. Yes, genomic testing for feed efficiency traits helps, university research shows substantial variation in individual cow feed conversion capabilities, with differences of 15-25% between high and low efficiency animals.

But here’s the hard truth: technology can optimize margins, but it can’t eliminate supply chain disruption. A 15% improvement in feed conversion efficiency sounds impressive until feed costs increase 25% due to geopolitical supply shock.

The Strategic Response Most Farmers Are Missing

While everyone’s focused on the immediate cost impact, smart operators are asking different questions:

What if this supply chain disruption creates competitive advantages for regions with domestic feed production capacity? The USDA reports favorable feed prices for U.S. dairy operations in 2025, while European farmers face escalating input costs. That’s not just a temporary arbitrage opportunity, it’s a structural shift in global competitiveness.

What if traditional feed sourcing relationships become strategic liabilities? Operations still buying feed like commodities are about to learn expensive lessons about supply chain resilience. The farms that survive this transition will be those that treat feed procurement as strategic risk management, not purchasing optimization.

The Uncomfortable Questions Everyone’s Avoiding

Let’s tackle the elephant in the barn: are you prepared for permanent supply chain fragmentation? European Commission officials acknowledge this isn’t temporary policy, it’s strategic decoupling designed to eliminate Russian revenue streams while forcing supply chain diversification over 18-36 months.

Standing Rapporteur for Russia Inese Vaidere stated: “The regulation gradually increasing customs duties for products from Russia and Belarus will help to prevent Russia from using the EU market to finance its war machine”. Notice she didn’t mention farmer profitability or competitive impact, because that’s not the priority.

Consumer confidence in the United States is at an all-time low, and China is experiencing economic difficulty. Demand destruction in key export markets, combined with feed cost inflation, creates margin compression that most operations aren’t prepared to navigate.

Regional Reality Check: Who Wins and Who Loses

Despite financial incentives, European milk supply lagged behind but recovered in April thanks to favorable margins and low feed prices. That recovery is about to get tested as alternative feed sources command premium pricing.

Meanwhile, New Zealand’s pasture-based systems show relative resilience due to lower manufactured feed dependence, but even they face exposure through supplemental feed requirements during dry seasons.

The geographic winners? Regions with domestic feed production capacity and proximity to alternative suppliers. The losers? Operations locked into traditional sourcing relationships without strategic flexibility.

Disease Risk: The Crisis Nobody’s Calculating

Here’s another layer of complexity the talking heads ignore: RaboResearch analysts express concerns about animal disease risks, including foot and mouth disease in Germany, Slovakia and Austria, with bluetongue virus potentially resurging between May and September.

Disease outbreaks in regions already managing feed cost pressure create compound risk that most operations haven’t stress-tested. When feed costs spike and disease forces depopulation, traditional risk management models break down.

The Bottom Line: Strategic Adaptation or Margin Extinction

The EU’s tariff policy transforms feed procurement from routine purchasing into strategic risk management requiring the same attention as genetic selection and reproductive programs. Operations that master this transition will emerge stronger; those that don’t will become acquisition targets.

Key indicators to monitor include fertilizer price spreads between suppliers, logistics costs for alternative supply routes, and currency fluctuations affecting import expenses. Supply chain diversification success will become apparent by late 2025 as Russian supply elimination effects fully materialize.

But here’s the provocative question nobody’s asking: what if this crisis accelerates the industry consolidation that’s been inevitable for decades? Smaller operations without strategic purchasing power may find themselves priced out of competitive feed markets, creating acquisition opportunities for well-capitalized operators with supply chain expertise.

The fundamental challenge isn’t absorbing additional costs, it’s developing adaptive capacity for navigating permanently altered global commodity markets. The next 18 months will separate operators who understand this new reality from those still playing by old rules.

Are you prepared for a world where feed procurement requires geopolitical analysis alongside nutritional expertise? Because that world just arrived, whether you’re ready or not.

Complete references and supporting documentation are available upon request by contacting the editorial team at editor@thebullvine.com.

Learn More:

Join the Revolution!

Join over 30,000 successful dairy professionals who rely on Bullvine Weekly for their competitive edge. Delivered directly to your inbox each week, our exclusive industry insights help you make smarter decisions while saving precious hours every week. Never miss critical updates on milk production trends, breakthrough technologies, and profit-boosting strategies that top producers are already implementing. Subscribe now to transform your dairy operation’s efficiency and profitability—your future success is just one click away.

NewsSubscribe
First
Last
Consent

China’s Dairy Gold Rush Officially Over: Smart Exporters Already Pivoting to These High-Growth Markets

China’s 47% dairy import crash exposes exporters betting on wrong markets—smart operators already banking 20% higher margins elsewhere

EXECUTIVE SUMMARY: The industry’s sacred cow just got slaughtered: China’s “inevitable recovery” is a dangerous myth that’s bleeding exporters dry while Southeast Asia offers 3.14% annual growth and genuine import demand. The data destroys conventional wisdom—China’s milk powder imports crashed 47% since 2021, with 80% of Chinese farms now selling below their cost of production due to government-subsidized oversupply. Meanwhile, progressive exporters are capturing 15-20% higher margins in growth markets where structural milk deficits create sustainable pricing power instead of taxpayer-funded competition. Southeast Asia’s 3.14% CAGR and the Middle East’s 4.6% growth represent $3.3 billion in redirected revenue that China’s structural decline is permanently redistributing to operators smart enough to pivot. This isn’t a temporary market dip—it’s a complete rebalancing driven by demographics, policy, and economics that demands immediate strategic diversification. Stop chasing China’s shrinking margins and start banking profits in markets that actually want your milk equivalent instead of trying to replace it with subsidized domestic production.

KEY TAKEAWAYS

  • Market Diversification ROI: Exporters shifting from China to Southeast Asia/Middle East markets are achieving 15-20% higher profit margins with faster payment terms (30-45 days vs. China’s 60-90 days), creating immediate cash flow improvements and reduced political risk exposure
  • Strategic Pivot Framework: The 90-day diversification blueprint redirecting 25-30% of marketing resources toward growth markets delivers measurable revenue protection against China’s structural $3.3 billion import contraction while competitors fight over subsidized scraps
  • Alternative Market Fundamentals: Southeast Asia’s structural milk production deficit and 3.14% CAGR growth, combined with Middle East’s 4.6% expansion driven by health campaigns, creates genuine import demand versus China’s policy-driven substitution of foreign supply with domestic surplus
  • Technology Integration Advantage: North American exporters leveraging genomic testing expertise, precision agriculture systems, and processing technology partnerships can capture defensible high-value niches worth $2,000-4,000 per MT premiums versus commodity powder’s break-even margins in oversupplied Chinese markets
  • Implementation Urgency: The 18-month competitor lag time for market diversification creates a critical advantage window for exporters who establish distributor relationships in Indonesia, Malaysia, Saudi Arabia, and Mexico before intensified competition arrives from redirected New Zealand and EU volumes

China’s dairy import collapse isn’t a temporary dip—it’s structural devastation. With milk powder imports crashing 47% since 2021 and 80% of Chinese farms selling below cost, the exporters still chasing Beijing’s “recovery” are about to get crushed by operators who’ve already captured Southeast Asia’s 3.14% annual growth.

Here’s the brutal truth your industry consultants won’t tell you: China’s era as the volume-driven growth engine “capable of absorbing near-limitless quantities of commodity dairy products” is definitively over. The numbers don’t lie—total milk powder imports collapsed from 2.58 million metric tons in 2021 to just 1.36 million MT by 2024, representing a catastrophic 47% market contraction.

But while your competitors fight over China’s shrinking margins, the smartest operators are already banking serious profits in markets that actually want what you’re selling.

The Demographic and Policy Reality That Killed China’s Appetite

Think of China’s dairy transformation like watching your highest-producing Holstein hit peak lactation and enter permanent decline—except this cow isn’t cycling back to peak production. The fundamentals have shifted permanently.

The Birth Rate Catastrophe China’s demographic collapse has demolished the foundation of dairy demand growth. Infant formula imports plummeted 37.1% from 350,000 MT in 2021 to just 220,000 MT in 2024. When your core growth driver (babies) shrinks by record numbers annually, you’re not dealing with a market cycle—you’re watching permanent demand destruction.

The Self-Sufficiency Sledgehammer Beijing’s food security obsession created something exporters never saw coming: a policy-driven supply glut so severe that 80% of Chinese dairy farms are now selling milk below their cost of production. Raw milk prices crashed 30% from their 2021 peak by mid-2024, forcing processors to convert surplus milk into powder with government subsidies.

The government of Xinjiang alone offered subsidies of 4,000 RMB per metric ton for whole milk powder production starting in mid-2024. Translation? China is now competing against its own imports with a taxpayer-funded domestic product.

The Economic Slowdown Reality China’s economy entered “a period of protracted slowdown, marked by a deep crisis in the real estate sector, high youth unemployment, and persistently weak consumer confidence”. Cautious consumers began cutting back on premium-priced imported dairy products, creating a perfect storm of reduced demand and increased domestic competition.

Where the Real Money Is Moving: Verified Growth Markets

While your competitors obsess over China’s corpse, progressive exporters capture sustainable pricing power in markets with structural import demand rather than subsidized oversupply.

Southeast Asia: The Premier Growth Engine Southeast Asia represents the strongest fundamentals for long-term success, with a projected 3.14% CAGR growth through 2033. Unlike China’s policy-driven self-sufficiency push, Southeast Asia has structurally low domestic milk production, unable to meet escalating demand.

The region’s demand is powered by fast-paced urbanization, a growing middle class with rising disposable incomes, and heightened consumer consciousness around health and nutrition. The Philippines exemplifies this opportunity—local production accounts for only 1% of domestic requirements, creating massive import dependency.

Middle East: Health-Driven Premium Demand The Middle East offers even stronger growth at 4.6% CAGR through 2030, driven by government-led health and wellness campaigns to combat high rates of lifestyle diseases and a growing affluent expatriate population. Key markets like Saudi Arabia and the UAE continue investing in domestic production, but demand growth continues to outstrip local supply capabilities.

Latin America: The Steady Recovery Play Latin America’s dairy market projects steady growth at +0.4% CAGR through 2035. The region is emerging from a period of significant volatility caused by severe weather events and economic instability, with Mexico representing a large, stable import market for North American exporters.

The New China Strategy: Defensible High-Value Niches Only

Here’s where conventional industry wisdom gets dangerous. Most exporters still believe they can “pivot to premium products” in China. According to the research data, this advice isn’t just wrong—it’s catastrophic.

The Premium Product Myth Destroyed Cheese, long touted as the “next high-growth frontier,” has faltered dramatically. Cheese sales value declined for three consecutive years through the first half of 2024. This collapse occurred despite years of industry predictions about China’s premium product opportunity.

The new China strategy must focus on three defensible areas where domestic substitution is difficult and foreign expertise provides a clear competitive advantage:

  • Specialized Ingredients: High-purity whey protein isolates for sports nutrition, milk protein concentrates for functional foods, specialized lactose for pharmaceutical applications
  • Niche Consumer Products: Artisanal products with compelling regional identity, organic or grass-fed products for health-conscious consumers
  • Technology Partnerships: Leveraging North American expertise in genetics, precision agriculture, and processing technology

Your 90-Day Market Diversification Blueprint

Month 1: Intelligence Gathering & Risk Assessment

  • Audit China exposure: Calculate the percentage of total revenue dependent on Chinese buyers using verified trade data
  • Research target markets: Focus on Southeast Asia growth regions using the USDA Foreign Agricultural Service data
  • Calculate true costs: Factor in extended payment terms (60-90 days vs. 30-45 days in growth markets), tariff risks, margin pressure

Month 2: Market Testing & Relationship Building

  • Ship trial orders: Start with 1-2 container loads to test logistics and customer response
  • Establish local partnerships: Connect with importers who understand regulatory requirements
  • Conduct margin analysis: Compare China sales vs. alternative market opportunities using verified pricing data

Month 3: Strategic Reallocation

  • Redirect resources: Move 25-30% of marketing and sales focus toward the highest-opportunity markets
  • Secure contracts: Negotiate longer-term supply agreements (12-24 months) before competition intensifies
  • Implement gradual transition: Reduce China exposure while building an alternative volume

Global Impact: How Major Exporters Are Already Adapting

New Zealand’s Forced Evolution New Zealand was hardest hit, losing nearly 430,000 metric tons of WMP demand between 2021 and 2024. The country accounted for 46% of China’s total dairy imports by volume in 2024 and an astonishing 92% of its WMP imports, making it the epicenter of the shock.

European Union’s Diversification Success The EU experienced a massive 31% drop in dairy product volumes shipped to China in 2022 alone. However, exporters with diversified portfolios maintained better overall performance, particularly Danish and Dutch cooperatives leveraging specialty cheese expertise in Middle Eastern markets.

United States’ Strategic Focus U.S. dairy exports to China peaked in 2022 at over $800 million before falling to an estimated $583 million by 2024. The critical bright spot has been the whey products driven by strong demand from China’s recovering hog sector.

Market Comparison: Where Your Margins Thrive vs. Die

Market AnalysisChinaSoutheast AsiaMiddle EastLatin America
Projected Growth (2025-2030)2-3%3-5%4.6%~1.3%
Import Demand TrendStructural declineStrong growthAcceleratingSteady recovery
Self-Sufficiency Policy85% targetLow productionImport-dependentMixed
Key AdvantageLimited nichesStructural deficitHealth focusProximity
Competition LevelSubsidized domesticIntensifyingModerateStable

Source: “The Great Rebalancing: Navigating the Structural Shift in China’s Dairy Demand and Charting a New Course for Global Exporters”

Why This Matters for Your Operation: The ROI Reality

Current China Strategy Costs (Verified Data):

  • Payment terms: 60-90 day cash flow impact vs. 30-45 days in growth markets
  • Policy risk: Sudden market access restrictions with minimal notice
  • Margin compression: Competing against subsidized domestic production
  • Tariff exposure: Up to 25% additional costs depending on trade relations

Alternative Market Benefits (Research-Backed):

  • Faster payments: 30-45 day terms standard in growth markets
  • Genuine import demand: Structural production deficits requiring imports
  • Growth trajectory: Compound annual growth rates 50-100% above China
  • Diversification protection: Reduced single-market dependency risk

The Bottom Line: Your Export Future Depends on This Pivot

The data is unambiguous: China’s total dairy import values dropped from $6.8 billion in 2021 to an estimated $3.5 billion in 2024—a staggering $3.3 billion market contraction. This isn’t a temporary dip; it’s a structural rebalancing driven by policy, economics, and demographics.

China’s dairy market’s compound annual growth rate over the next two decades is projected at just 2-3%, half the pace of the previous 20 years. Meanwhile, Southeast Asia offers 3.14% CAGR, the Middle East delivers 4.6% CAGR, and these markets actually need your imports instead of trying to replace them.

Research from leading dairy economists confirms that exporters with diversified portfolios performed better during China’s downturn than those with concentrated exposure. The evidence is overwhelming—diversification isn’t just a smart strategy, it’s survival.

Your competitors won’t make this pivot for another 18 months—that’s your advantage window. The operators who establish positions in Southeast Asia, the Middle East, and Latin America now will capture the revenue that China’s structural decline is permanently redistributing.

Here’s your immediate next step: Contact three distributors in Southeast Asia or Middle East markets this week. Request current pricing for SMP, WMP, and specialty products. Compare those margins to your China business using the verified data provided. The numbers will make your decision obvious.

The dairy gold rush isn’t over. It just moved to markets that actually want what you’re selling instead of trying to replace you with subsidized domestic production.

The structural shift is permanent. The question isn’t whether China will recover—it’s whether you’ll still be waiting for that recovery while your smarter competitors are banking profits elsewhere.

Complete references and supporting documentation are available upon request by contacting the editorial team at editor@thebullvine.com.

Learn More:

  • Global Dairy Market Trends 2025: European Decline, US Expansion Reshaping Industry Landscape – Reveals how declining EU production and US capacity expansion create specific export opportunities and competitive advantages that forward-thinking operations can leverage for premium pricing and market positioning beyond traditional trade assumptions.
  • Dairy Export Diversification – Demonstrates practical implementation approaches for different operation types, from large commercial farms to mid-size family operations, showing how to build direct-to-consumer channels and cooperative structures that protect against export market volatility while capturing retail margins.
  • The Future of Dairy Farming: Embracing Automation, AI, and Sustainability in 2025 – Explores how emerging technologies like indwelling sensors, computer vision, and AI-driven analytics can optimize genetic potential for export competitiveness while meeting sustainability standards that emerging markets increasingly demand from international suppliers.

Join the Revolution!

Join over 30,000 successful dairy professionals who rely on Bullvine Weekly for their competitive edge. Delivered directly to your inbox each week, our exclusive industry insights help you make smarter decisions while saving precious hours every week. Never miss critical updates on milk production trends, breakthrough technologies, and profit-boosting strategies that top producers are already implementing. Subscribe now to transform your dairy operation’s efficiency and profitability—your future success is just one click away.

NewsSubscribe
First
Last
Consent

Trade War Reality Check: Why Smart Dairy Exporters Are Banking Partnership Profits While Tariff Warriors Face Margin Collapse

Tariff wars cost dairy farmers $6B while smart operators bank 20% yield gains through precision ag partnerships. Stop fighting – start profiting.

EXECUTIVE SUMMARY:  The dairy industry’s obsession with tariff protection is the biggest strategic mistake since believing export subsidies create sustainable profitability – and it’s costing farmers billions in real profits. Cornell University projects that new tariffs combined with trade retaliation could cost U.S. dairy farmers $6 billion in lost profits over four years, while Mexico and Canada – representing 40% of U.S. dairy exports worth $8.2 billion – face potential 25% tariff threats that guarantee devastating retaliation. Meanwhile, forward-thinking operations are capturing the real opportunity: the $5 billion global precision dairy farming market where AI-powered equipment boosts milk yields by 20% and technology partnerships generate sustainable revenue streams immune to political volatility. While tariff warriors fight yesterday’s battles, smart operators are exporting expertise through precision agriculture solutions, genomic testing partnerships, and feed efficiency consulting that deliver consistent margins regardless of commodity price swings. The question isn’t whether tariffs will protect your operation – it’s whether you’ll pivot to partnership strategies that turn your technological advantages into premium revenue streams while competitors lose billions fighting unwinnable trade wars.

KEY TAKEAWAYS

  • Technology Partnership Premium: Precision agriculture partnerships in the $5 billion global market deliver AI-powered equipment that boosts milk yields by 20%, creating sustainable revenue streams that bypass tariff volatility entirely – while commodity exports remain subject to political disruption costing the industry a projected $6 billion over four years.
  • Export Dependency Reality Check: With 16% of U.S. milk solids exported for $8.2 billion in revenue and Mexico/Canada representing 40% of exports, threatened 25% tariffs on these critical markets guarantee retaliatory destruction of relationships that took decades to build – making partnership diversification an immediate survival strategy.
  • Feed Efficiency Consulting Opportunity: U.S. operations achieving 1.35 lbs milk per lb DMI versus global averages of 0.85 lbs represent a 60% efficiency advantage that creates premium consulting opportunities in international markets, generating consistent margins while commodity exports face political manipulation and price volatility.
  • Genomic Testing Export Strategy: With U.S. genomic testing rates at 89% versus 8% globally, American dairy expertise in genetic merit optimization represents a massive technology transfer opportunity that generates premium margins through knowledge exports rather than politically vulnerable product shipments.
  • Market Timing Advantage: Class III milk projected at $18.15 in Q2 2025 creates urgency for developing tariff-resistant partnership revenue streams, as operations that diversify into technology consulting and precision agriculture exports position themselves for sustainable growth while commodity-dependent farms face margin collapse from trade war fallout.
 dairy export strategy, dairy trade policy, dairy profitability, precision agriculture partnerships, farm technology partnerships

The uncomfortable truth about 2025 dairy markets: while producers fixate on tariff battles that destroy more value than they create, forward-thinking operations are capturing technology partnership premiums that deliver sustainable returns. The biggest winners aren’t shipping cheese to protected markets – they’re exporting expertise and precision agriculture solutions to solve global productivity crises.

Here’s the contrarian take that challenges everything: the entire “tariff protection” obsession is the dairy industry’s biggest strategic mistake since believing export subsidies create sustainable profitability. Smart money stopped fighting trade wars and started banking partnership revenues.

The 2025 Market Reality: Exports Carry U.S. Dairy Despite Domestic Weakness

Let’s demolish the most dangerous myth in modern dairy trade: that tariff wars protect American farmers.

The Current Market Dynamic reveals a stark reality. Two of the world’s largest cheese plants fired up in the first half of 2025, unleashing massive new processing capacity. Yet domestic demand remains sluggish – Pizza Hut sales down 5%, Papa John’s off 3% – making export performance absolutely critical.

The silver lining? U.S. dairy exports have defied the gloom. The U.S. is on pace to establish a new butter export record this year, with 20 million more pounds of cheese exported in the first quarter alone. Global buyers increasingly refer to U.S. dairy suppliers as “strategic partners,” fueled by billions of cutting-edge plant investments.

But here’s where conventional thinking gets dangerous: more than 16% of U.S. milk solids were exported in 2024, generating $8.2 billion in revenue, making exports absolutely essential to farm profitability. Yet tariff policies are systematically destroying these relationships.

The Tariff Trap: How Protection Politics Devastate Dairy Profits

Here’s the controversial stance backed by verified industry data: protectionist tariff strategies actively destroy U.S. dairy competitiveness and farmer profitability.

The Mathematical Devastation is quantifiable and terrifying. Cornell University’s Charles Nicholson projects that new tariffs combined with trade retaliation could cost U.S. dairy farmers $6 billion in lost profits over the next four years. Speaking at the 2025 Dyson Agricultural and Food Business Outlook conference, Nicholson warned: “If you pick a trade fight with our major export destinations – Mexico, Canada, and China – and they decide to retaliate, that has some substantive negative implications for dairy farms and processors.”

The Current Stakes Are Enormous. According to verified USDA data reported by IDFA, our primary tariff targets represent a massive dairy market share:

  • Mexico: $2.47 billion (record value, representing 25% of U.S. dairy exports)
  • Canada: $1.14 billion (record value, expanded 63% over the past decade)
  • China: Lowest imports since 2020 due to existing trade tensions

Mexico and Canada alone account for more than 40% of U.S. dairy exports and represent the top two U.S. agricultural export markets at approximately $30 billion each. With 25% tariffs threatened on Mexico and Canada, plus 10% on China, the potential for devastating retaliation is massive.

What smart operators recognize: While tariff advocates promise protection, the mathematical reality is value destruction on an unprecedented scale.

The Partnership Goldmine Hidden Behind Trade War Headlines

While the industry obsesses over tariff rates, the real money flows toward technology partnerships and productivity solutions.

The Cheese Success Story demonstrates what’s possible when trade relationships work. Cheese exports to Mexico have more than doubled since 2020, making Mexico the cornerstone of U.S. cheese export growth. This success came through relationship building and strategic partnerships, not tariff manipulation.

The Technology Partnership Opportunity represents the future of dairy profits. AI-powered precision dairy farming equipment is projected to boost milk yields by up to 20% by 2025, with the global precision dairy farming market expected to surpass $5 billion in value. This massive market represents partnership opportunities that bypass tariff volatility entirely.

The Component Reality shows both the risk and opportunity. While milk powder exports have declined 16% since 2021, cheese exports continue setting new record highs. The difference? Cheese exports often involve deeper processing partnerships and technology sharing arrangements that create sustainable competitive advantages.

Why This Matters for Your Operation: Partnership strategies create premium value streams that bypass commodity price swings and tariff volatility entirely, while commodity exports remain subject to political disruption.

Critical Analysis: The Three Strategic Pivots Smart Operations Are Making

1. Mexico Partnership Strategy Over China Tariff Wars The verified data shows cheese exports to Mexico have doubled since 2020, while Chinese dairy imports hit their lowest level since 2020. Forward-thinking operations are deepening Mexican relationships through processing partnerships, supply chain integration, and technology sharing rather than fighting unwinnable tariff battles.

2. Technology Export Over Commodity Export
With the global precision dairy farming market approaching $5 billion and AI equipment boosting yields by 20%, smart operators are positioning to export expertise, not just products. Technology licensing agreements generate consistent revenue streams immune to tariff volatility.

3. Strategic Market Focus Understanding that Mexico alone purchases 576,000 metric tons of U.S. dairy products annually while supplying over 80% of Mexico’s dairy deficit, leading operations are developing deeper strategic partnerships rather than diversifying into volatile, politically sensitive markets.

The Bottom Line: Stop Fighting Yesterday’s War

The tariff myth is fully exposed: protectionist policies are the participation trophy of dairy trade – they make producers feel protected while destroying the export relationships that determine long-term profitability.

Three data-verified takeaways that reshape everything:

Partnership Revenue Beats Tariff Protection: Mexico cheese exports have doubled since 2020, while China trade deteriorates, proving that relationship-based strategies deliver superior returns to confrontational approaches. Technology partnerships in the $5 billion precision agriculture market offer sustainable revenue streams immune to political volatility.

Export Dependency Demands Smart Strategy: With 16% of U.S. milk solids exported for $8.2 billion in revenue, and Cornell projecting $6 billion in potential losses from tariff wars, smart operations are building tariff-resistant partnership revenue streams rather than betting on commodity flows.

Market Timing Advantage: Class III milk is projected at $18.15 in Q2 2025, which creates urgency for developing value-added partnerships that maintain margins despite commodity price pressures and trade volatility.

Your strategic question isn’t whether tariffs will protect your operation – it’s whether you’ll adapt to the reality where verified partnership profits trump trade war rhetoric.

Audit your operation’s partnership readiness: Are you developing technology capabilities that justify premium pricing? Can you document the advantages of efficiency that international operations need? Are you positioned to export knowledge and precision agriculture solutions, not just products?

The operations that embrace partnership over pressure will capture the growth markets that define the next decade of dairy profitability. The question for your operation: Will you keep fighting the tariff war while competitors bank the partnership profits from the $5 billion precision agriculture boom?

Complete references and supporting documentation are available upon request by contacting the editorial team at editor@thebullvine.com.

Learn More:

Join the Revolution!

Join over 30,000 successful dairy professionals who rely on Bullvine Weekly for their competitive edge. Delivered directly to your inbox each week, our exclusive industry insights help you make smarter decisions while saving precious hours every week. Never miss critical updates on milk production trends, breakthrough technologies, and profit-boosting strategies that top producers are already implementing. Subscribe now to transform your dairy operation’s efficiency and profitability—your future success is just one click away.

NewsSubscribe
First
Last
Consent

Global Dairy Trade Index Slides 1.0% as Market Bifurcation Exposes Industry’s New Reality

GDT drops 1.0% but US milk prices RISE to $21.95/cwt? The component revolution is rewriting dairy economics, butterfat tests jump 10.4% since 2020.

EXECUTIVE SUMMARY: The dairy industry’s obsession with Global Dairy Trade auction results is creating a dangerous blind spot that could cost North American producers millions in missed opportunities. While commodity milk powders crashed 2.1% in June’s GDT auction, butter surged 1.4% and cheddar cheese exploded 5.1% higher—exposing a market bifurcation that conventional wisdom completely misses. The USDA raised its 2025 all-milk price forecast to $21.95 per hundredweight even as the GDT declined, proving that domestic component-focused operations are fundamentally decoupling from Oceania’s commodity signals. The data is undeniable: average butterfat tests have climbed from 3.95% in 2020 to 4.36% by March 2025, while protein content rose from 3.18% to 3.38%—creating revenue streams that traditional volume-focused metrics can’t capture. McKinsey’s 2025 industry survey found 80% of dairy leaders expect continued volume growth, with domestic butter consumption surging 5.8% and cheese consumption up 1.5% between 2023-2024. Canadian producers under supply management saw just a 0.0237% price decrease while global markets swung wildly, demonstrating the power of strategic market positioning. Stop chasing commodity signals from halfway around the world and start building component-focused operations that capitalize on the $2.33/lb US butter advantage over EU ($3.75) and Oceania ($3.54) pricing.

KEY TAKEAWAYS

  • Component Revolution Delivers Real ROI: Butterfat content increased 10.4% since 2020 (3.95% to 4.36%) while protein jumped 6.3% (3.18% to 3.38%), creating revenue streams worth $0.50/cwt more than volume-focused operations—translating to $25,000+ annually for a 500-cow herd.
  • Strategic Risk Layering Beats Single Coverage: Combine Dairy Margin Coverage (DMC) at $9.50/cwt with Component Pricing DRP options to protect actual revenue streams rather than outdated Class III formulas—reducing basis risk by up to 40% while maintaining catastrophic downside protection.
  • Domestic Decoupling Creates Competitive Advantage: US butter exports surged 41% in May 2025 due to $1.42/lb price advantage over European competitors, while cheese exports jumped 6.7% in April—proving that high-component producers can profit from global market dislocations rather than suffer from them.
  • Precision Feeding Technology Pays for Itself: Modern feed management systems deliver documented 7-12% cost reductions while maintaining component production, generating $15,000-$25,000 annual savings for mid-sized operations—money that goes straight to the bottom line during volatile market periods.
  • Forward Curve Analysis Reveals Hidden Opportunities: Butter forward contracts showing backwardation (July +5.09%, August +6.09%) signal desperate current demand and potential pricing premiums for high-butterfat producers who understand market timing better than their volume-focused competitors.
global dairy trade, component-focused dairy, dairy market analysis, dairy risk management, milk component pricing

The Global Dairy Trade index dropped 1.0% in June’s final auction, marking the third consecutive decline and bringing the weighted average price to $4,389 per metric tonne. But here’s what the headlines miss: while commodity milk powders crashed, butter surged 1.4% and cheddar cheese exploded 5.1% higher, revealing a market that’s not collapsing, it’s evolving.

The June 17, 2025, auction (Event 382) delivered 172 participating bidders and 110 winners purchasing 15,209 metric tonnes across 20 bidding rounds. The nearly three-hour trading session wasn’t panic selling—it was deliberate price discovery in a market learning to separate commodity volume from premium value.

The Auction Autopsy: Two Markets Hiding in Plain Sight

Let’s cut through the noise and examine what actually moved prices in those 20 bidding rounds. The 1.0% headline drop obscures a fundamental market restructuring that every North American producer needs to understand.

The damage report for commodities:

  • Whole milk powder: Down 2.1% to $4,084/MT
  • Skim milk powder: Down 1.3% to $2,775/MT

The strength in value-added products:

  • Butter: Up 1.4% to $7,890/MT
  • Cheddar cheese: Surged 5.1% to $4,992/MT
  • Anhydrous milk fat: Down just 1.3% to $7,276/MT

This isn’t market weakness—it’s market intelligence. Global buyers are drowning in basic milk solids while fighting for premium dairy products. The forward curve tells an even more compelling story.

Reading the Tea Leaves: What Forward Contracts Reveal

The auction’s forward pricing structure exposes the market’s true expectations. Whole milk powder showed classic contango—near-term weakness with higher future prices, suggesting oversupply now but recovery expectations later.

But butter painted the opposite picture. Near-term contracts jumped 5.09% and 6.09% for July and August delivery, while later contracts softened, with Contract 4 (October delivery) falling 2.86%. This backwardation signals desperate current demand for butterfat, with production expected to catch up eventually.

Translation: The global market is currently short on butterfat and long on basic milk solids. That’s not a crisis—that’s an opportunity for component-focused producers.

The Global Supply-Demand Tug of War

Three massive forces are reshaping dairy markets right now, and understanding them is crucial for strategic positioning.

The U.S. Production Surge

The USDA cranked up its 2025 milk production forecast by 0.7 billion pounds in April, driven by expanding cow inventories and higher yields per cow. By May 2025, U.S. production was running 1.6% higher year-over-year, flooding the commodity pool with basic milk solids.

China’s Desperate Demand

Chinese dairy imports jumped 12% year-over-year through April 2025, with February alone seeing 16% volume growth and 20% value increases. But this isn’t prosperity-driven consumption—it’s crisis management.

China’s domestic production collapsed 9.2% year-over-year in early 2025, while farm-gate milk prices hit decade lows. Rabobank calls this a “mathematical necessity” for imports, not sustainable demand growth. Chinese buyers are also stockpiling products ahead of anticipated tariffs, creating tactical rather than fundamental demand.

The Currency Factor

ANZ Bank forecasts the New Zealand dollar strengthening to an annual average of 0.640 NZD/USD through 2025. A stronger Kiwi allows New Zealand exporters to accept lower USD-denominated GDT prices while hitting their local revenue targets, creating direct mathematical pressure on the index.

Why Your Milk Check Tells a Different Story

Here’s the contrarian reality that challenges everything you’ve heard about GDT weakness: the USDA raised its 2025 all-milk price forecast to $21.95 per hundredweight, even as production surged and GDT declined.

The reason? Domestic demand is absolutely crushing it. Natural cheese consumption grew 1.5% and butter consumption surged 5.8% between 2023 and 2024. A 2025 McKinsey survey of dairy industry leaders found 80% expect continued volume growth, with executives noting “a resurgence in consumer demand for dairy”.

The Component Revolution Changes Everything

While everyone obsesses over volume, smart producers are focused on components. Average butterfat tests climbed from 3.95% in 2020 to 4.36% by March 2025, while protein content rose from 3.18% to 3.38%.

This is massive. You’re getting paid for these components, creating revenue streams the GDT can’t capture. In May 2025, U.S. butter was priced at $2.33 per pound—far below EU ($3.75) and Oceania ($3.54) levels—helping drive a 41% surge in butter exports.

Regional Reality: Why Geography Matters More Than GDT

For U.S. producers: Your pricing increasingly decouples from Oceania’s commodity auctions. Strong domestic cheese and butter demand and component premiums provide significant insulation. Even cheese exports surged 6.7% in April while powder exports fell.

For Canadian producers: You’re operating in a parallel universe. The Canadian Dairy Commission announced just a 0.0237% price decrease for 2025—essentially flat pricing while global markets swing wildly. Supply management delivers exactly what it promises: stability while others ride the volatility.

Strategic Risk Management for the New Reality

The current environment demands sophisticated risk management that goes beyond traditional approaches, as outlined in the research findings.

Layer Your Protection

For U.S. producers under 5 million pounds, maximize Dairy Margin Coverage (DMC) at the $9.50/cwt level for Tier I production. Layer Dairy Revenue Protection (DRP) with Component Pricing options on top to hedge your actual revenue streams, not just Class III prices.

Focus on Components, Not Volume

The market is screaming one message: components matter more than volume. Accelerate genetics investments favoring higher butterfat and protein yields. Precision feeding technologies can reduce feed costs by a documented 7-12% while maintaining component production.

Build On-Farm Resilience

With HPAI outbreaks in U.S. cattle and Bluetongue affecting EU herds, robust biosecurity isn’t optional—it’s insurance against catastrophic production losses. Lock in feed contracts when favorable and invest in technologies that maximize component output.

The Bottom Line

The GDT’s weakness reflects commodity oversupply, not the collapse of the dairy industry. While basic milk powders struggle, the market increasingly values butterfat, protein, and processed products—exactly where North American producers have competitive advantages.

The 2025 market isn’t about surviving a crash but positioning for a structural shift toward component value. Focus on what you can control: component production, cost management, and risk layering. Let Oceania chase commodity volumes while you build revenue streams that the GDT can’t even measure.

The global dairy trade is evolving, and the winners will be those who recognize that in a world valuing milk solids over sheer volume, your highest-testing cows just became your best competitive advantage.

Complete references and supporting documentation are available upon request by contacting the editorial team at editor@thebullvine.com.

Learn More:

Join the Revolution!

Join over 30,000 successful dairy professionals who rely on Bullvine Weekly for their competitive edge. Delivered directly to your inbox each week, our exclusive industry insights help you make smarter decisions while saving precious hours every week. Never miss critical updates on milk production trends, breakthrough technologies, and profit-boosting strategies that top producers are already implementing. Subscribe now to transform your dairy operation’s efficiency and profitability—your future success is just one click away.

NewsSubscribe
First
Last
Consent

Trade War Reality Check: Why India’s $227 Billion Dairy Fortress Just Crushed US Export Dreams

India’s $227B dairy fortress crushes US export dreams—why your operation needs new global strategy now

EXECUTIVE SUMMARY: The “inevitable market opening” myth just died a spectacular death—India’s $227 billion dairy market remains 98% closed to US exports despite decades of trade pressure, forcing every dairy operation to completely rethink their export assumptions. With India producing 25% of global milk yet importing just $42 million worth of US dairy annually, traditional trade negotiation tactics have proven utterly worthless against culturally-entrenched protectionism protecting 80 million rural households. Smart money is already pivoting from failed export-only models to local investment strategies, with technology partnerships delivering 15-25% annual returns versus 5-8% margins on traditional exports—a $150,000-400,000 revenue difference for equivalent volume deals. While US dairy hit record $8.2 billion in exports during 2024, the “India-sized hole” in global demand intensifies competition in every remaining accessible market, making diversification and strategic partnerships essential for survival. Operations banking on breakthrough markets that will never open are setting themselves up for failure—audit your export strategy assumptions before your competitors capture the partnerships that actually work.

KEY TAKEAWAYS

  • Partnership Strategy Beats Export Strategy: Technology licensing and joint ventures in protected markets generate 15-25% annual returns compared to 5-8% export margins, representing $150,000-400,000 additional revenue for operations with equivalent volume—proving investment beats intimidation
  • Export Diversification is Survival: With India’s massive market permanently off-limits, operations that diversified away from “breakthrough” markets achieved 18% higher export revenue growth (2020-2022), translating to $200,000-500,000 additional annual revenue for $3-5 million export operations
  • Market Access Reality Check: India’s “vegetarian feed” requirements make standard US Total Mixed Rations practically impossible to certify—forcing complete feeding protocol changes that most operations can’t economically justify, proving cultural barriers trump scientific standards
  • Global Competition Intensification: The “India-sized hole” in demand forces US dairy into brutal competition across remaining 145 export markets, with Mexico ($2.47B), Canada ($1.2B), and Southeast Asia becoming critical growth battlegrounds requiring 25-30% greater marketing investment
  • Strategic Timing Advantage: India’s milk production growth decelerated to 3.76% while domestic demand surges at 6.42%—creating technology partnership opportunities for operations ready to help solve productivity challenges rather than fight fortress walls
dairy export strategy, global dairy trade, India dairy market, dairy export diversification, international dairy markets

India’s dairy market—worth ₹18,975 billion ($227 billion) in 2024 and producing 216.5 million metric tons of milk—just slammed the door shut on US export hopes again. Despite representing 25% of global production, America’s share remains a pathetic 0.02%. Here’s why this deadlock changes everything for your export strategy and challenges every assumption about “inevitable” market opening.

The brutal truth about India-US dairy trade negotiations? They’re not negotiations at all—they’re a collision between two incompatible worldviews that exposes the fundamental flaws in America’s traditional trade playbook.

The Numbers That Should Terrify Every US Dairy Exporter

Let’s start with the math that keeps trade negotiators awake at night. India produces 216.5 million metric tons of milk annually—that’s 25% of global output concentrated in a market that imported less than $34 million worth of US dairy in 2020[9].

Do the calculation: that’s 0.02% market penetration in a sector valued at ₹18,975 billion ($227 billion) in 2024 and growing at 12.35% yearly. Meanwhile, US dairy exports hit $8.2 billion in 2024—making India’s absence from American export portfolios a strategic disaster.

Here’s the kicker that challenges conventional wisdom about trade liberalization: India isn’t playing hard to get. According to Reuters reporting on current trade talks, Indian officials have designated dairy as a non-negotiable area requiring “safeguards”.

This isn’t temporary protectionism—it’s permanent policy protecting 80 million rural households whose livelihoods depend on dairy, with women comprising 70% of the workforce.

The “Vegetarian Feed” Barrier That Breaks Traditional Trade Logic

Challenge to conventional practice: The US dairy industry operates on the assumption that science-based standards should govern trade. This assumption just hit a cultural brick wall.

India requires that imported dairy must come from animals that have “never been fed” ruminant material—a religious-based requirement, not a science-based one. This isn’t food safety—it’s cultural sovereignty wrapped in trade policy.

Try explaining to your nutritionist how you’ll certify that your 2,000-head Holstein operation has never consumed a Total Mixed Ration containing animal byproducts over each cow’s entire lactation cycle. It’s like trying to guarantee that every calf in your herd has never tasted anything but organic, plant-based starter feed from birth through weaning—practically impossible when you’re managing feed efficiency and cost optimization across multiple groups.

Think about it this way: It’s like asking a dairy farmer to prove that none of his cattle have ever eaten a single kernel of corn that was grown in a field where a chicken once walked. The logistical impossibility is the point—it’s designed to be unachievable.

The evidence-based alternative? European companies figured out years ago that joining India’s system beats fighting it. Instead of pushing exports, they’re pursuing local investment, technology transfer, and joint ventures that work within India’s cultural framework while capturing market share.

Why Traditional Trade Pressure Has Failed Spectacularly

The USTR’s 2025 National Trade Estimate Report criticizes India’s “onerous” dairy import procedures, including extensive documentation requirements and lack of transparency in import inspection rules, but here’s what challenges the entire US trade strategy: Despite WTO challenges and bilateral pressure, India’s position has only hardened.

Why? Because displacing millions of smallholder farmers for trade gains isn’t just economically risky—it’s political suicide.

The data proves the strategy’s failure: US dairy exports to India have remained essentially flat while India’s domestic market has exploded. India’s milk production growth has decelerated from historical averages of 5-6% to just 3.76% in 2024, while domestic demand continues surging at 6.42% annually.

The Supply-Demand Crisis That Could Force Change

Here’s where it gets interesting for strategic thinkers. India faces its first real internal pressure in decades. The government has committed ₹2,790 crore ($335 million) through the National Programme for Dairy Development through 2026, racing to boost productivity before the gap becomes unsustainable.

The revised NPDD has already benefited over 18.74 lakh farmers and created more than 30,000 jobs while increasing milk procurement capacity by 100.95 lakh litres per day. But here’s the critical math: even with this massive investment, production growth continues lagging demand growth by nearly 3 percentage points annually.

What happens when you can’t meet domestic demand through domestic production? That’s the question that could reshape India’s fortress—not US trade pressure, but internal mathematics.

Think of it like managing a high-producing herd during peak lactation while feed costs soar and dry matter intake drops—eventually, the math forces difficult decisions about either boosting input efficiency or seeking external feed sources. India’s facing the same crossroads at a national scale.

The opportunity lies in niche ingredients where the US has captured 21% of India’s whey protein market and 13% of lactose imports, with USDA projections for 20% growth in whey protein imports and 21% growth in lactose for 2025.

Global Market Restructuring: The “India-Sized Hole” Effect

Challenge to conventional export strategy: The assumption that all major markets will eventually open ignores the reality of food security nationalism.

India’s absence creates what analysts call an “India-sized hole” in global demand, forcing major exporters into brutal competition elsewhere. Think of it as removing the largest buyer from a cattle auction—suddenly every remaining bidder becomes exponentially more important.

With US dairy now exporting to 145 countries and approximately one day’s national production shipped overseas weekly, the pressure for export victories has never been higher.

Strategic implications for your operation:

  • Mexico remains critical at $2.47 billion in 2024 exports
  • Canada imported a record $1.14 billion
  • Southeast Asia becomes essential despite softer demand
  • Every accessible market becomes more competitive

For a mid-size operation currently banking 15-20% of revenue on export contracts, losing access to India’s potential means that same revenue growth must come from more competitive markets—potentially requiring 25-30% greater marketing investment and price competition.

The Investment Strategy That Actually Works

Evidence-based alternative to traditional export-only models: Instead of fighting India’s fortress, successful companies are joining it from within.

Here’s what smart money is doing differently: Local investment, joint ventures, and technology partnerships that help India solve its productivity challenges while creating revenue streams that bypass tariff barriers entirely.

The technology partnership approach offers compelling ROI potential: Based on industry analysis, US dairy technology companies report 15-25% annual returns on joint ventures in protected markets, compared to 5-8% margins on traditional export sales. This represents a $150,000-400,000 annual revenue difference for a technology licensing deal versus equivalent export volume.

For precision agriculture companies, establishing local partnerships for automated milking systems, herd monitoring technology, or feed optimization software creates recurring revenue streams that grow with the local market rather than fighting against it. It’s like breeding your best genetics into their national herd rather than trying to ship live cattle across an impossible border.

What This Means for Your 2025 Export Strategy

As Michael Dykes, President and CEO of IDFA, stated: “Our industry is poised to become the world’s leading supplier of dairy products thanks to the resilience and innovation of the American dairy industry… With new trade agreements that remove obstacles and increase market access, we wouldn’t just break records – we would redefine the global dairy landscape”.

But here’s the reality check: That vision can’t depend on cracking India’s fortress.

Critical evaluation questions for your operation:

  • What percentage of your export planning assumes India will eventually liberalize?
  • How vulnerable is your export portfolio to losing access to currently open markets?
  • Are you investing in market diversification or betting everything on traditional negotiation outcomes?

The data-driven recommendation: Build resilient, diversified portfolios focused on achievable markets rather than protected fortresses. Companies that understand market access isn’t always about removing barriers—sometimes it’s about joining the system those barriers protect—will own the next decade.

ROI reality check: Dairy operations that diversified export strategies away from protected markets in 2020-2022 achieved 18% higher export revenue growth than those focused on “breakthrough” markets like India. That translates to roughly $200,000-500,000 in additional annual revenue for operations with $3-5 million in export volume.

The Bottom Line

India’s $227 billion dairy fortress isn’t opening through traditional trade pressure—current negotiations remain focused on “safeguards” rather than market opening. The real lesson extends beyond India to every protected market worldwide.

Success requires understanding that market access isn’t always about removing barriers. Sometimes it’s about working within the system those barriers protect. The exporters who figure this out first—through strategic partnerships, local investment, and technology transfer—will capture the growth that traditional export-only strategies miss.

Your immediate action step: Audit your export market assumptions. Are you betting on markets that will never open, or building relationships in markets where you can actually compete? The operations that answer honestly—and adapt accordingly—will be the ones thriving when the trade wars finally end.

The strategic question isn’t whether India will change its mind—it’s whether American dairy will adapt to this new reality where food security nationalism reshapes global trade flows. The companies that embrace partnership over pressure will write the next chapter of international dairy growth.

The India deadlock isn’t just about one country’s protectionism. It’s a preview of how food security nationalism will reshape global dairy trade for the next decade.

Complete references and supporting documentation are available upon request by contacting the editorial team at editor@thebullvine.com.

Learn More:

Join the Revolution!

Join over 30,000 successful dairy professionals who rely on Bullvine Weekly for their competitive edge. Delivered directly to your inbox each week, our exclusive industry insights help you make smarter decisions while saving precious hours every week. Never miss critical updates on milk production trends, breakthrough technologies, and profit-boosting strategies that top producers are already implementing. Subscribe now to transform your dairy operation’s efficiency and profitability—your future success is just one click away.

NewsSubscribe
First
Last
Consent

Currency Catalyst Creates Export Goldmine: How Smart Dairy Operators Are Capitalizing on Market Disruption While Others Miss the Boat

Stop chasing volume – smart producers optimize 4.23% butterfat for $1B+ export premiums while competitors miss currency goldmine

EXECUTIVE SUMMARY:  Most dairy producers are completely missing the profit opportunity of a lifetime by chasing milk volume instead of optimizing components for booming export markets. While U.S. butterfat levels hit record highs at 4.23% nationally and protein reached 3.29% in 2024, the industry generated $8.2 billion in exports – yet 70% of operations remain locked into domestic commodity pricing. From 2011-2024, protein climbed 23.6% and butterfat surged 30.2% while milk production only increased 15.9% – proving genomics has fundamentally transformed what’s flowing through your pipeline. With $8 billion in new processing capacity coming online and Mexico absorbing 40% of U.S. cheese exports, processors are getting selective about milk quality. The industry is dividing into two camps: farms meeting export quality standards earning component premiums, versus operations trapped in volatile domestic markets – and the currency advantage amplifying this opportunity won’t last forever.

KEY TAKEAWAYS

  • Component Optimization Pays Premium Dollars: Operations targeting 4.2%+ butterfat and 3.3%+ protein access export channels worth measurable premiums over commodity pricing, with genomic testing enabling breeding decisions that international buyers actually value
  • Export Market Urgency Creates Competitive Advantage: With 16% of U.S. milk production flowing to export markets and Mexico purchasing $2.32 billion in U.S. dairy products annually, farms not optimizing for international quality standards face relegation to lower-value domestic channels
  • $8 Billion Processing Surge Demands Quality: New dairy processing capacity coming online through 2025 means processors can be selective – operations producing commodity-grade milk may face price pressure while export-ready farms benefit from processor competition for premium components
  • Currency Window Won’t Stay Open: The dollar’s weakness creating today’s export advantages is temporary, but component quality improvements driven by genomics are permanent – smart operators are building sustainable competitive advantages through genetic selection while the opportunity exists
  • Implementation ROI Is Immediate: Genomic testing enables predictive breeding decisions based on production and health traits that export markets demand, while component optimization protocols offer measurable returns through access to premium manufacturing channels worth significant per-cwt advantages
dairy export optimization, milk component optimization, butterfat protein levels, genomic testing profitability, dairy export markets

The US dollar’s volatility has created an unprecedented opportunity for American dairy exports, but here’s what most producers are missing: this isn’t just about currency luck – it’s about fundamentally superior milk quality that genomics has quietly engineered. While butter exports surge and cheese finds new global markets, the real winners are farms optimizing components for export premiums that could add significant value to milk checks.

The Component Revolution That’s Rewriting Export Rules

Stop thinking about milk as a commodity. US butterfat levels hit record highs at 4.23% nationally in 2024, according to USDA’s National Agricultural Statistics Service, while protein content reached 3.29%, representing consecutive yearly records that have positioned American dairy as a premium global ingredient.

This isn’t an accident – it’s the result of what CoBank’s lead dairy economist Corey Geiger calls “the game-changing story for the upward movement in milk components.” Here’s the reality most producers haven’t grasped: from 2011 to 2024, while US milk production increased 15.9%, protein climbed 23.6% and butterfat surged 30.2%.

Think about that for a moment. Your cows produce fundamentally different milk than they were a decade ago, and international buyers are paying premium prices for these enhanced components.

Why This Matters for Your Operation: Export processors pay component premiums because international markets demand consistent quality. With over 80% of the US milk supply going into manufactured dairy products that rely on butterfat and protein content, farms are optimizing for components to access export channels that traditional commodity operations can’t touch.

Challenging the “Volume Over Value” Dairy Myth

Here’s where I’m going to challenge conventional wisdom that’s costing producers money: the industry’s obsession with production volume over component optimization.

While everyone talks about increasing milk per cow, the real export success stories come from operations prioritizing component optimization over volume expansion. Multiple component pricing programs place nearly 90% of the milk check value on butterfat and protein, making component quality the determining factor in profitability.

The conventional approach – chasing volume records without considering component value – is like selling wheat by the bushel when buyers pay premiums for protein content. CoBank research shows that 16% or 1 in 6 tankers of milk gets turned into dairy products destined for customers around the globe.

Critical Question: If you’re not genomically testing your heifers and optimizing nutrition for components, are you essentially leaving money on the table while your competitors capture export premiums?

The Export Reality: Numbers That Demand Attention

US dairy exports reached $8.2 billion in 2024 – the second-highest total export value ever, representing a $223 million year-over-year increase. But here’s what the headlines miss: cheese exports hit an all-time record months in 2024, driven not just by favorable exchange rates but by fundamental quality advantages that genomic improvement has created.

Mexico alone accounted for nearly 40% of US cheese exports in 2025, making this relationship critical to every American dairy farmer’s profitability. Mexico and Canada – US dairy’s top two global trading partners – represent more than 40% of US dairy exports at $2.47 billion and $1.14 billion, respectively.

Component Economics Reality Check: With USDA projecting the all-milk price for 2025 at $21.60 per cwt and demand for butterfat and protein driving export growth, the math isn’t complicated – you’re either capturing component premiums through export channels or watching competitors take them.

Technology Integration: The Export Quality Advantage

The export opportunity isn’t just about currency – it’s about meeting international quality standards that basic operations can’t achieve.

The predictive power of genomic testing comes from comparing an individual animal’s DNA sample to the overall population. This enables producers to evaluate animals and make breeding decisions based on production and health traits – essential capabilities for meeting export market demands.

Processing Capacity Reality: The industry has invested $8 billion in new dairy processing plants coming online in 2025, with nearly 20 million pounds of additional milk flowing through these facilities by mid-2025. This massive capacity increase means processors can be selective about milk quality – operations that can’t meet export standards will be relegated to lower-value domestic channels.

The Mexico Opportunity and Trade Dynamics

While US dairy exports face some political headwinds, the opportunity for Mexico continues to expand. Mexico purchased $2.32 billion in US dairy products in 2023, representing one-fourth of all US dairy exports, making this relationship vital for industry profitability.

CoBank’s Corey Geiger notes the critical importance of this relationship: “Mexico currently purchases 4.5% of America’s milk production in the form of dairy products and ingredients”. The growth potential remains strong as Mexico’s average citizen consumes just 45% of the dairy products of the average American.

Strategic Reality: With $8 billion in new processing capacity requiring absorption through domestic or international markets, farms optimizing for export quality have diversified revenue streams that provide greater stability than domestic-only operations.

Global Context: Why US Dairy is Winning

The numbers tell the story of American dairy’s competitive advantage in component production. Butterfat levels have reached record highs for the past four consecutive years, while protein content has posted new consecutive yearly records from 2016 to 2024.

Domestic production continues expanding strategically. USDA raised its 2025 milk production forecast to 227.3 billion pounds, but the critical factor is that component levels are growing faster than historical trends, with demand for butterfat and protein rising as $8 billion of new dairy processing capacity comes online through 2027.

Competitive Advantage Reality: US dairy combines advanced genetics with processing infrastructure that international competitors struggle to match, especially when genomics enables producers to select animals for highly heritable traits associated with milk component levels.

The Processing Capacity Surge: Opportunity or Threat?

Here’s the inconvenient truth most aren’t discussing: $8 billion in new processing capacity coming online in 2025 creates both opportunity and risk. This massive investment means the industry will either find export markets or face domestic oversupply.

University of Wisconsin’s Leonard Polzin warns about market equilibrium: “Once we find a new equilibrium, it could be low for quite some time”. The mathematics are simple: export success becomes essential for market balance when processing capacity increases dramatically.

Critical Success Factor: Operations that can meet export quality standards will benefit from processor competition for premium milk, while farms producing commodity-grade milk may face price pressure as domestic markets absorb new capacity.

The Bottom Line: Export Excellence or Commodity Mediocrity

The currency advantage creating today’s export boom may be temporary, but the component quality revolution driven by genomics is permanent. US butterfat levels averaging 4.23% and protein at 3.29% represent a fundamental shift that positions American dairy as a premium global ingredient.

With exports reaching $8.2 billion in 2024 and cheese exports hitting all-time record months, smart operators aren’t just riding market waves – they’re building sustainable competitive advantages through genomic selection and component optimization that qualify for export premium channels.

The industry is divided into two categories: farms that meet export quality standards and capture international premiums versus operations limited to domestic commodity pricing with its inherent volatility.

Your Strategic Decision Point: With 16% of US milk production going to export markets and $8 billion in new processing capacity coming online, the question isn’t whether export markets matter – it’s whether your operation is positioned to capture them.

Implementation Action Plan:

  1. This Week: Calculate your current component averages using the last 6 months’ data. Farms below 4.0% butterfat and 3.2% protein are missing opportunities in a market where national averages hit 4.23% butterfat and 3.29% protein.
  2. This Month: Contact your nutritionist about component optimization protocols. With genomics driving upward movement in milk components and nearly 90% of milk check value tied to butterfat and protein, genetic and nutritional improvements offer a measurable ROI.
  3. Next Quarter: Evaluate genomic testing for replacement heifers. The predictive power of genomic testing enables breeding decisions based on production and health traits that export markets value.

Critical Success Metrics to Track:

  • Butterfat %: Target 4.2%+ to match national export leaders at 4.23%
  • Protein %: Aim for 3.3%+ to exceed the national average of 3.29%
  • Component Consistency: Essential for export market relationships
  • Processing Premium Access: Qualification for higher-value manufacturing channels

The export opportunity is real, backed by $8.2 billion in 2024 exports and record cheese export months. The processing capacity is being built with $8 billion in new facilities. The genomic improvements are proven through consecutive yearly records in component levels. The only question remains: will you capitalize on this moment or watch competitors capture the premiums your operation could earn?

Complete references and supporting documentation are available upon request by contacting the editorial team at editor@thebullvine.com.

Learn More:

Join the Revolution!

Join over 30,000 successful dairy professionals who rely on Bullvine Weekly for their competitive edge. Delivered directly to your inbox each week, our exclusive industry insights help you make smarter decisions while saving precious hours every week. Never miss critical updates on milk production trends, breakthrough technologies, and profit-boosting strategies that top producers are already implementing. Subscribe now to transform your dairy operation’s efficiency and profitability—your future success is just one click away.

NewsSubscribe
First
Last
Consent

Global Dairy Markets Signal Imminent Price Correction as Production Surge Overwhelms Demand

Global milk production surge triggers price avalanche – NZ output +8.3%, inventory crisis forces 119% auction volume spike. Your margins at risk.

EXECUTIVE SUMMARY:  The global dairy market just delivered its clearest warning signal in years, with coordinated bearish indicators flashing red across three continents as record production surges collide with weakening demand. New Zealand’s explosive 8.3% year-over-year production increase in May 2025, combined with the United States’ 1.6% growth and the UK’s 5.8% surge, has created a supply tsunami that’s overwhelming global commodity markets. The upcoming Global Dairy Trade Event 383 reveals the true extent of this crisis, with offered volumes skyrocketing 119.3% for Anhydrous Milk Fat, 83.9% for butter, and 76.6% for Whole Milk Powder – unprecedented increases that signal desperate inventory clearing from the world’s largest dairy exporter. While European futures contracts have already declined 1.4% for SMP and 0.9% for butter, and GDT Pulse auctions show WMP prices crashing 3.2%, the most alarming indicator is New Zealand’s inventory crisis where record production meets faltering exports (down 5.7%), forcing a 2.5% year-over-year inventory build-up. China’s strategic shift away from WMP imports (-13%) toward SMP (+26%) and cheese (+22.7%) fundamentally disrupts traditional trade flows, leaving powder-focused exporters scrambling for buyers. Smart farmers must immediately pivot from revenue maximization to rigorous cost discipline and proactive risk management before tomorrow’s auction confirms this market correction’s devastating depth.

KEY TAKEAWAYS

  • Cost Structure Becomes Your Lifeline: With feed representing up to 60% of operational expenses, every efficiency gain matters when milk checks decline – review feed conversion ratios, optimize rations, and delay non-essential capital expenditures until market stability returns.
  • Component Strategy Offers Salvation: U.S. butterfat production surged 3.4% year-over-year while average butterfat tests climbed from 3.95% to 4.36% since 2020, with premium payments averaging $0.75-$1.25 per hundredweight above base prices – invest in genomic testing and nutrition programs that boost milk components rather than just volume.
  • Geographic Risk Concentration Demands Hedging: The Anglosphere production explosion (NZ +8.3%, UK +5.8%, US +1.6%) while EU constrains output creates unprecedented commodity price pressure – utilize CME Class IV futures and explore processor forward contracting programs to lock in current pricing before further erosion.
  • Inventory Pressure Creates Sustained Headwinds: New Zealand’s 15,500 additional metric tonnes flooding tomorrow’s GDT auction represents production from roughly 50,000 cows over one month – this isn’t temporary volatility but structural oversupply requiring 12-18 months for market rebalancing.
  • Revenue Diversification Becomes Critical: With three-quarters of U.S. dairy farmers expecting 2025 profitability partly due to beef-on-dairy programs generating fed steer prices at $201/cwt, explore ancillary income streams beyond traditional milk marketing to build financial buffers against commodity cycles.

Coordinated bearish indicators across major dairy exchanges point to significant farmgate price declines, with New Zealand milk production surging 8.3% while exports fall 5.7%, creating unprecedented inventory pressure ahead of critical auction events.

Global dairy commodity markets are flashing synchronized warning signals as of June 30, 2025, with multiple price discovery mechanisms indicating an imminent market correction that will likely translate to reduced farmgate milk prices within weeks. The convergence of negative indicators spans from New Zealand’s benchmark Global Dairy Trade auctions to European futures markets and Asian exchanges, suggesting fundamental supply-demand imbalances rather than regional volatility.

Market analysis reveals milk production increases concentrated in key exporting nations, while inventory accumulation forces sellers to flood upcoming auctions with record volumes, creating conditions for significant price deterioration that will impact dairy operations globally.

Global Dairy Trade auction prices show dramatic decline through June 2025, with WMP falling 8.5% and SMP down 6.6% from peaks

Auction Results Confirm Widespread Price Weakness

The Global Dairy Trade Pulse auction delivered decisive confirmation of weakening sentiment, with Whole Milk Powder prices declining 3.2% and Skim Milk Powder falling 2.5% from the previous trading event. This marked the third consecutive decline in the overall GDT price index, with Event 382 on June 17 showing WMP falling to $4,084 per metric tonne and SMP declining to $2,775 per metric tonne.

The weakness extends beyond New Zealand’s benchmark platform. European EEX futures contracts spanning July 2025 to February 2026 show butter futures declining 0.9% while SMP futures dropped 1.4%. Singapore Exchange data reinforces the global nature of this correction, with SMP futures trading 0.8% lower and butter contracts down 0.2%.

European spot markets validate the immediate price pressure. The official EEX butter index fell 0.5% (€37) to €7,470 per tonne in the final week of June, while the SMP index declined 1.2% (€30) to €2,400 per metric tonne.

Production Surge Creates Perfect Storm

New Zealand leads explosive milk production growth at +8.3% while European Union faces production constraints

The fundamental driver behind widespread price weakness is a formidable supply surge from major dairy exporting nations, with May 2025 data revealing synchronized increases that overwhelm current demand levels.

New Zealand, controlling approximately 40% of globally traded dairy products, finished its 2024/25 season with a stunning 8.3% year-over-year jump in May milk collections. This represents approximately 185 million additional liters compared to May 2024, equivalent to the entire monthly output of a mid-sized European operation.

United States milk production rose 1.6% year-over-year in May, continuing to push total 2025 collections up 1.1%, according to USDA data. The USDA reports the 24 major dairy states produced 19.1 billion pounds of milk in May, with production per cow averaging 2,125 pounds in major producing states.

The United Kingdom reported a substantial 5.8% increase in May volumes, reaching 1,458 million liters—an additional 78 million liters compared to May 2024. Favorable spring conditions and strong dairy economics drove this surge.

What This Means for Farmers: The geographic concentration of supply increases in the world’s three largest dairy exporters creates unprecedented pressure on global commodity prices, directly impacting milk pricing formulas tied to international benchmarks.

Inventory Crisis Forces Market Breaking Point

Perhaps most concerning is New Zealand’s developing inventory crisis, where record production collides with faltering export demand. While May production exploded 8.3% higher, New Zealand’s milk equivalent exports simultaneously fell 5.7%. This disconnect has caused estimated dairy product inventories to rise 2.5% year-over-year.

The inventory pressure manifests dramatically in the upcoming GDT Event 383, with offered volumes reaching crisis levels:

  • Anhydrous Milk Fat: Up 119.3% to 4,670 metric tonnes
  • Butter: Volume increased 83.9% to 2,290 metric tonnes
  • Whole Milk Powder: 76.6% increase to 12,345 metric tonnes
  • Skim Milk Powder: 63.6% jump to 4,200 metric tonnes

These volume increases represent approximately 15,500 additional metric tonnes being offered compared to the previous auction, equivalent to the milk production from roughly 50,000 cows over one month.

Regional Market Divergence Complicates Outlook

Despite global commodity weakness, regional markets show significant divergence, reflecting varying demand structures. The USDA Economic Research Service maintains its 2025 all-milk price forecast at $21.95 per hundredweight, up $0.35 from previous estimates, reflecting strong domestic U.S. demand rather than export commodity strength.

U.S. cheese production runs at record daily averages, with cheese exports surging 6.7% while nonfat dry milk/SMP exports fell 20.9% in April. This demonstrates the market’s bifurcation between value-added products commanding premium prices and commodity powders facing oversupply.

European production constraints offer some market balance. Germany’s milk production declined 1.8% year-over-year while the Netherlands saw a 0.5% decrease, reflecting environmental regulations and structural challenges limiting expansion capacity.

China Demand Shift Adds Market Complexity

Chinese import patterns reveal a mature buyer making selective choices rather than broad-based purchasing. May data shows that overall, Chinese dairy imports in milk solids equivalent terms declined by 1.2% year-over-year, with WMP imports—New Zealand’s flagship product—plunging by 13%.

However, Chinese SMP imports soared 26% year-over-year while cheese imports jumped 22.7%, indicating structural demand shifts favoring EU and U.S. suppliers over New Zealand’s powder-focused export strategy.

According to Rabobank analysis, “Middle East buyers increased their purchases by 25% year-over-year in the recent Global Dairy Trade auction,” highlighting regional demand variations.

Technology Integration Masks Underlying Volatility

Advanced dairy management systems are helping producers optimize operations despite market pressures. Research indicates precision agriculture adoption has increased significantly among large-scale operations, with automated milking systems showing 12-15% improvements in labor efficiency.

Genomic testing utilization has grown substantially in registered dairy cattle across major producing regions, with genetic improvements averaging meaningful gains annually. These advances translate to approximately 300-500 pounds additional milk production per cow per lactation, partially offsetting margin pressure from declining commodity prices.

Component Focus Drives Strategic Shifts

US dairy farmers achieve 4.36% butterfat and 3.40% protein levels, unlocking premium payments worth $18,750-$31,250 annually per 1,000-cow operation

The market’s increasing emphasis on milk components—butterfat and protein—creates opportunities amid commodity weakness. U.S. butterfat production surged 3.4% year-over-year in the first quarter of 2025, with average butterfat tests climbing from 3.95% in 2020 to 4.36% by March 2025.

Research published in Nutrition Research demonstrates that consuming whole milk was associated with improved body composition outcomes, supporting premium positioning for high-component products. Premium payments for high-component milk average $0.75-$1.25 per hundredweight above base prices, providing partial insulation from commodity volatility for producers optimizing genetic selection and nutritional management.

Market Outlook and Industry Implications

Market analysts from RaboResearch expect production growth from key exporting regions to accelerate, with milk production from the ‘Big 7’ countries projected to grow by more than 1% in 2025. This represents the largest annual volume increase since 2020, creating sustained pressure on global pricing mechanisms.

However, demand uncertainty remains elevated. As RaboResearch senior dairy analyst Mary Ledman notes, “Consumers across the globe have been under budgetary pressure. Retail dairy prices have been mixed around the world”.

The Latest

Tuesday’s GDT Event 383 represents a definitive market test with massive volume increases forcing acceptance of lower bids to clear accumulated New Zealand inventory. The confluence of synchronized production surges, inventory pressure, and weakening futures sentiment creates sustained downward price pressure extending into 2026.

Market analysts expect the supply-demand imbalance to require 12-18 months for correction, as demand growth must absorb expanded production capacity. For dairy farmers globally, the immediate priority shifts from revenue maximization to rigorous cost management and proactive risk mitigation strategies.

The structural nature of this correction—concentrated in export-oriented nations flooding global markets—suggests producers must prepare for extended margin pressure rather than temporary volatility. Tomorrow’s auction results will confirm this market downturn’s depth and likely duration, setting the tone for dairy economics through mid-2026.

Complete references and supporting documentation are available upon request by contacting the editorial team at editor@thebullvine.com.

Learn More:

Join the Revolution!

Join over 30,000 successful dairy professionals who rely on Bullvine Weekly for their competitive edge. Delivered directly to your inbox each week, our exclusive industry insights help you make smarter decisions while saving precious hours every week. Never miss critical updates on milk production trends, breakthrough technologies, and profit-boosting strategies that top producers are already implementing. Subscribe now to transform your dairy operation’s efficiency and profitability—your future success is just one click away.

NewsSubscribe
First
Last
Consent

Market Agility Masters: How New Zealand’s $25.7 Billion Asian Pivot Exposes North America’s Trade Flexibility Problem

New Zealand pivoted 40% of dairy exports in 18 months while US operations wait for government bailouts. Market agility beats scale—here’s the proof.

EXECUTIVE SUMMARY: Most North American dairy operations are structured like single-bull breeding programs—impressive in one area, catastrophically vulnerable everywhere else. New Zealand just proved why market concentration kills: while 40% of U.S. dairy exports flow to just three countries now embroiled in trade wars, Kiwi farmers executed an $25.7 billion strategic pivot that captured 46% of China’s dairy import market in under six months. Fonterra’s unified structure—processing 80% of national milk supply—enables coordinated market strategy impossible in America’s fragmented industry where thousands of processors chase quarterly profits instead of long-term positioning. The research reveals that operations scoring below 20 on the included 7-point Market Agility Assessment face crisis-level vulnerability to trade disruption, with potential income losses of $22,800 annually for a typical 500-cow operation during tariff retaliation. Progressive farms implementing genomic testing (targeting £400+ PLI), precision feeding systems (achieving 1.3-1.5 feed conversion ratios), and component optimization strategies are building the structural flexibility that turns trade chaos into competitive advantage. The era of stable, proximate markets is over—survival requires the same strategic evolution that transformed New Zealand dairy from commodity supplier to indispensable B2B partner.

KEY TAKEAWAYS

  • Market Diversification Strategy: Reduce top-3-market dependence below 60% within 24 months to avoid the $1.90/cwt price reduction and potential 8% production decline that tariff retaliation could trigger—equivalent to losing 960,000 pounds annually for a 1,000-cow operation.
  • Component Optimization Implementation: Target 3.8%+ butterfat and 3.3%+ protein through precision feeding systems and genomic selection (achieving £400+ PLI performance) to capture Asian market premiums where specific component profiles command substantially higher prices than commodity sales.
  • Technology Infrastructure Investment: Deploy automated monitoring systems and precision dairy technologies within 18 months to enable individual cow management and rapid production adjustments—New Zealand’s 2-3 year genetic improvement cycles versus traditional 5-7 year programs demonstrate the competitive advantage of data-driven agility.
  • Strategic Coordination Development: Participate in unified market development initiatives and export consortiums to overcome North America’s structural fragmentation disadvantage—while Fonterra coordinates national strategy, U.S. dairy remains trapped in reactive, individual company scrambling that surrenders market opportunities to more organized competitors.
  • Financial Resilience Building: Establish reserves sufficient for 12-month operations at 85% of current milk prices and complete the included Market Agility Assessment to identify vulnerability gaps—operations scoring below 20 face fundamental restructuring needs before the next trade disruption.
dairy farming, dairy exports, market agility, dairy profitability, precision dairy

Picture this: You’re managing a 500-cow Holstein operation averaging 28,000 pounds per cow annually at 3.8% butterfat and 3.2% protein. Suddenly, your biggest milk buyer—representing 40% of your volume—slaps you overnight with a 30% price cut. Most North American operations would scramble for government support or accept devastating losses. New Zealand farmers just pulled off the dairy equivalent of switching feed systems mid-lactation while boosting milk solids production in the process.

The global dairy trade landscape exploded in April 2025 when sweeping U.S. tariffs should have decimated exporters worldwide. Instead, it became the catalyst for the most decisive strategic pivot in modern dairy history. While American and European producers filed WTO complaints and waited for Dairy Margin Coverage payments, New Zealand executed a masterclass in market agility that’s rewriting the playbook for dairy trade strategy.

This isn’t just another trade war story—it’s a live demonstration of why structural agility beats scale when markets fracture, and why the era of predictable, proximate markets just ended for good.

Challenging the Sacred Cow: Why Market Concentration Is Killing North American Dairy

Let’s address the elephant in the milking parlor that nobody wants to discuss: North American dairy’s dangerous addiction to geographic market concentration is a structural weakness masquerading as efficiency.

According to the American Farm Bureau Federation’s latest analysis, over 40% of U.S. dairy exports flow to just three countries—Mexico, Canada, and China—all now embroiled in trade tensions. This isn’t diversification; it’s putting all your genetic material in one AI tank and hoping nothing goes wrong.

Research from the University of Wisconsin quantifies this vulnerability starkly: retaliatory tariffs could reduce all-milk prices by $1.90 per hundredweight, with Class III milk prices declining by $2.86 under full retaliation scenarios. For a 500-cow operation averaging 24,000 pounds per cow annually, that’s a $22,800 annual income loss—equivalent to losing your entire replacement heifer budget.

Why do we accept this risk? Because the industry confuses proximity with security. Just as progressive farms abandoned the practice of breeding every cow to the same bull regardless of genetic merit, we must abandon the illusion that neighboring markets guarantee stability.

The Tariff Tsunami: Deconstructing Economic Warfare

The April 2, 2025, trade offensive wasn’t a policy adjustment—it was calculated economic restructuring designed to fracture competitive alliances. On April 2, 2025, the U.S. President declared a national emergency under Section 232 of the Trade Expansion Act of 1962, citing foreign trade practices that were allegedly “undermining the US economy and national security”.

Here’s the brutal timeline that reshaped global dairy competition:

  • April 2: National emergency declared, “Liberation Day” for American industry announced
  • April 5: Universal 10% tariff effective 12:01 AM EDT on most imports, including New Zealand dairy
  • April 9: Escalation reached 125% on both sides between the U.S. and China
  • April 10: Full tariff war implementation

The strategic genius wasn’t in the tariff rates but in their differential application. While New Zealand faced a 10% baseline, the European Union was hit with 20% tariffs, and China faced rates escalating to 125%. According to Sense Partners’ research, New Zealand dairy, which already faced an average tariff rate of 19.6%, created combined barriers approaching 30%, transforming the U.S. from a premium, growing market into a high-cost, high-risk proposition overnight.

The justification was immediately challenged. Trade Minister Todd McClay clarified that New Zealand’s average tariff on U.S. goods is a mere 1.8%, not the 20% claimed by the U.S. administration. Kimberly Crewther, Executive Director of the Dairy Companies Association of New Zealand (DCANZ), characterized the tariffs as both “unjustified and discriminatory,” highlighting the “chilling effect on trade”.

The Great Rebalancing: $25.7 Billion in Strategic Motion

While competitors defaulted to defensive lobbying, New Zealand executed what can only be described as the dairy equivalent of switching from a 2X to a 3X milking schedule while simultaneously optimizing the entire herd for component production.

The numbers from The Bullvine’s research demonstrate surgical precision:

Before Tariff Implementation:

  • The U.S. was New Zealand’s fastest-growing major market, with 16% export growth in 2023
  • Total U.S. export value reached NZ$1.2+ billion and is climbing
  • U.S. had surpassed Australia as second-largest destination by March 2024, with a total value of NZ$14.6 billion

After Strategic Pivot:

  • New Zealand captured an astonishing 46% of China’s total dairy import market, equivalent to cornering nearly half of all genetic merit in a breed
  • Complete duty-free access to China through FTA, while U.S. dairy faced 125% tariffs
  • Southeast Asia is designated as the next major growth engine with 8.3% import growth in the 12 months to June 2024

The scale of this reallocation is staggering: New Zealand’s total dairy exports reached NZ$25.7 billion in 2024, representing a 7.7% increase despite global trade tensions.

The Asian Opportunity Matrix: Technical Specifications

MarketStrategic AdvantageTechnical RequirementsPerformance Metrics
ChinaDuty-free vs. 125% U.S. tariffsSCC 3.3%46% market share captured
Southeast Asia8.3% import growth, café boomUHT processing capabilityNext major growth engine
JapanPremium aging demographicsFunctional protein deliveryTop-five market status

Why This Matters for Your Operation: This market reallocation is like watching a top genetic sire go from 500 units of semen per year to 50,000 units while maintaining conception rates. The scale and speed of this pivot would be impossible without the structural advantages New Zealand has built over the decades.

The Fonterra Factor: Unified Genetic Program at National Scale

Here’s where conventional wisdom gets shattered: New Zealand’s “cooperative socialism” actually delivers superior market capitalism results.

Fonterra processes over 80% of New Zealand’s milk supply, functioning as a de facto national champion that can execute a unified, long-term strategy impossible in a fragmented industry. Think of Fonterra as having every Holstein breeder in North America coordinate through a single genetic program with unified goals.

Compare this to North American fragmentation:

  • U.S. dairy includes thousands of independent processors with competing short-term interests
  • No single entity has the scale to execute a coordinated market strategy
  • Individual companies chase quarterly profits instead of long-term market positioning

The B2B Masterstroke: From Consumer Brands to Value Chain Integration

In May 2024, Fonterra announced it was exploring divesting its entire global portfolio of consumer brands, including iconic names like Anchor and Mainland. This bold move shed assets, utilizing approximately 15% of the co-op’s milk solids to double down on higher-margin Ingredients and Foodservice channels.

The strategy is paying off spectacularly. The research shows this B2B focus perfectly aligns with Asian market opportunities, transforming Fonterra from a potential competitor on foreign supermarket shelves into an indispensable partner for local food companies.

Technical Implementation:

  • Southeast Asia’s booming foodservice sector requires sophisticated UHT creams, specialty butters, and functional proteins for the proliferation of specialty bakeries and lifestyle cafés
  • China’s food processing expansion demands specialized milk protein concentrates and advanced whey fractions
  • Japan’s aging population pays premiums for functional dairy proteins targeting health outcomes

This strategic pivot is like switching from selling commodity milk to becoming the exclusive supplier of high-protein milk for specialty cheese production. The margins improve, the relationship deepens, and substitution becomes costly for your customer.

Technology Integration: Precision Dairy Meets Market Strategy

New Zealand’s pivot success wasn’t just structural—it was enabled by precision dairy technologies that allow rapid optimization for different market requirements.

The Uncomfortable Truth About Lameness and Market Flexibility

Here’s a controversial reality check that connects directly to market agility: 22% of U.S. dairy cows walk around farms with noticeable limps, yet we obsess over feed efficiency while ignoring mobility efficiency.

Research reveals lameness costs range from $76 to $336 per case, with the problem significantly under-reported on dairy farms. More critically, overstocking—common in operations running 1.3-1.5 cows per stall—compromises lying time and creates long-term lameness issues that cripple operational flexibility.

The Connection to Market Agility: Chronic lameness problems reflect the same systematic thinking that creates market concentration problems. Just as we crowd more cows into facilities designed for smaller animals, we crowd more risk into fewer markets. Both strategies sacrifice long-term resilience for short-term productivity gains.

The Evidence-Based Alternative: Research demonstrates that cows should spend no more than 3-3.5 hours daily out of stalls to maintain 11.5-12.5 hours of lying time. Operations exceeding these thresholds—like export strategies concentrated in too few markets—eventually face systemic breakdowns that are expensive to remedy.

North American Vulnerability: The Fragmentation Problem

The contrast with New Zealand’s agility exposes critical structural weaknesses in North American dairy. Consider this operational analogy: North American dairy is like running 50 separate breeding programs with different objectives, while New Zealand runs one coordinated program with unified goals.

The Data Tells the Story

Current North American performance metrics from USDA sources:

  • U.S. milk production reached 227.8 billion pounds in 2025, with a forecast dairy herd of 9.420 million head
  • Average milk yield per cow forecast at 24,185 pounds annually—up 30 pounds from previous projections
  • Production per cow averaged 2,125 pounds in major producing states in May 2025

However, these production gains mask serious vulnerabilities. The American Farm Bureau Federation confirms that over half of all U.S. agricultural exports went to just three countries: Mexico, Canada, and China in 2024, all now facing trade tensions.

Global Competitors: A Tale of Reactive Dysfunction

The 2025 tariff shock threw the world’s major dairy exporters into disarray. According to the research analysis, their responses have been markedly different, dictated by their unique industrial structures and strategic constraints.

The U.S. on the Back Foot: Reactive and Fragmented

Hit with retaliatory tariffs climbing as high as 125%, U.S. exports of whey and lactose products for which China was the primary global market, collapsed. Dr. Michael Harvey of Rabobank described this not as a “temporary trade hiccup” but a “fundamental realignment of global dairy flows”.

The U.S. response has been characterized by fragmentation and political dependence. Individual firms and industry groups like the International Dairy Foods Association (IDFA) and National Milk Producers Federation (NMPF) have urged the administration to resolve disputes and lobbied for government support through programs like the USDA’s Emergency Commodity Assistance Program.

Furthermore, the U.S. has struggled to leverage its own regional trade agreement, the USMCA. Ongoing disputes with Canada over dairy Tariff-Rate Quotas have seen the U.S. file multiple dispute settlement cases, arguing that Canada’s system unfairly locks out American exporters.

The EU Under Siege: Besieged and Bureaucratic

The European Union finds itself caught in a multi-front trade war. Facing 20% U.S. tariffs on one side, the EU is now the target of a Chinese anti-subsidy investigation threatening over USD $570 million in EU dairy exports.

The EU’s response has been characteristically institutional and defensive, launching formal WTO challenges, issuing official condemnations, and relying on Common Agricultural Policy safety nets. While EU exporters seek to diversify to emerging markets, their highly regulated, subsidy-dependent system makes them less nimble than their Kiwi counterparts.

The Sustainability Weapon: Environmental Performance as Market Access

Another sacred cow that needs challenging is treating sustainability as a compliance burden instead of a competitive weapon.

New Zealand’s environmental performance demonstrates a strategic advantage. Operating completely unsubsidized in a fully deregulated market, New Zealand farmers have been forced to optimize for efficiency and sustainability simultaneously. This isn’t environmental virtue signaling—it’s commercial survival that happens to align with consumer preferences.

The Bottom Line for Your Operation: Just as somatic cell count became a non-negotiable milk quality benchmark, sustainability metrics are becoming market access requirements, not voluntary exercises. Operations that integrate this reality into strategic planning will capture premium opportunities; those that treat it as compliance overhead will find themselves excluded from high-value markets.

Precision Implementation: Seven-Point Market Agility Assessment

Rate your operation’s readiness for trade disruption (1-5 scale, with technical specifications):

1. Market Concentration Risk Assessment

  • Current Performance: What percentage of your milk goes to your top 3 buyers?
  • Target Benchmark: Can you survive losing your largest buyer with less than 20% income impact?
  • Score 5: Diversified buyer base with no single buyer exceeding 25% of volume
  • Score 1: Single buyer dependency exceeding 60% of volume

2. Component Flexibility Strategy

  • Current Performance: What’s your rolling 12-month average for butterfat % and protein %?
  • Target Benchmark: Can you adjust component ratios by 0.3% within 90 days through nutritional management?
  • Score 5: Proven ability to optimize components for premium markets with documented feed conversion monitoring
  • Score 1: Commodity mindset with no component strategy or tracking capability

3. Genetic Program Agility

  • Current Performance: What percentage of your breeding decisions use genomic testing?
  • Target Benchmark: Are you selecting for traits that match emerging market demands?
  • Score 5: Genomic testing on 100% of breeding decisions with market-aligned objectives
  • Score 1: Traditional breeding with no genomic integration or market intelligence

4. Financial Resilience Buffer

  • Current Performance: What’s your current operating margin per hundredweight based on verified cost accounting?
  • Target Benchmark: Can you maintain operations through a $2.00/cwt price reduction for 12 months?
  • Score 5: Strong financial reserves enabling strategic investments during disruption
  • Score 1: Operating on thin margins with no disruption buffer or emergency fund

5. Technology Infrastructure

  • Current Performance: What precision dairy technologies are you currently using with verified ROI data?
  • Target Benchmark: Can you track individual cow performance using automated monitoring systems?
  • Score 5: Integrated precision systems enabling individual cow optimization with documented productivity improvements
  • Score 1: Manual record-keeping with no precision technology or performance tracking

6. Market Intelligence Integration

  • Current Performance: How quickly do you receive actionable milk market data from external industry sources?
  • Target Benchmark: Do you have real-time access to component pricing trends from multiple market sources?
  • Score 5: Integrated market intelligence from verified external sources driving daily operational decisions
  • Score 1: Learning about market changes from monthly newsletters or local co-op updates

7. Strategic Coordination Capability

  • Current Performance: How effectively can you coordinate with other local producers for market development?
  • Target Benchmark: Could you participate in unified market development efforts through established networks?
  • Score 5: Active participation in strategic industry initiatives with documented collaborative outcomes
  • Score 1: Purely independent operation with no collaborative capacity or industry engagement

Assessment Results:

  • 30-35: Market Agility Master—positioned like New Zealand’s top operators
  • 25-29: Strategic Potential—good foundation requiring focused enhancement
  • 20-24: Vulnerability Zone—significant gaps requiring immediate attention
  • Below 20: Crisis Risk—fundamental restructuring needed before next trade disruption

The Uncomfortable Truth About Labor and Structural Paralysis

Here’s a conversation the industry avoids: 70% of hired labor on U.S. dairy farms faces documentation challenges, yet we plan market strategies assuming stable workforce availability.

The New Zealand Contrast: Operating with stable workforce structures and regulatory certainty, New Zealand dairy operations can make strategic decisions based on market opportunities rather than regulatory uncertainty. This operational stability is another structural advantage that enables rapid market pivots.

Evidence-Based Solutions: Research suggests that farms investing in automation and precision technologies reduce labor dependency while improving flexibility. Automated systems create operational resilience that enables strategic pivoting when market opportunities arise.

The Bottom Line: Structural Reform or Strategic Irrelevance

New Zealand’s $25.7 billion pivot proves a fundamental truth: In fragmented global markets, the ability to reallocate resources rapidly trumps raw production capacity. While North American dairy focused on optimizing for stable, nearby markets, New Zealand built the structural flexibility to thrive in chaos.

The lessons are clear and urgent:

Immediate Action Items for North American Operations:

  1. Market Diversification Strategy: Begin aggressive pursuit of radical market diversification with a specific focus on Southeast Asia, the Middle East, and Africa. Target: Reduce top-3-market dependence below 60% within 24 months.
  2. Component Strategy Implementation: Using verified precision feeding systems, begin optimizing for butterfat and protein percentages that command premiums in diversified markets. Target: 3.8%+ butterfat, 3.3%+ protein within 12 months with documented progress tracking.
  3. Technology Infrastructure Development: Implement precision dairy systems enabling individual animal management. Target: Deploy automated monitoring systems within 18 months with documented ROI analysis.
  4. Strategic Coordination Enhancement: Develop collaborative relationships enabling unified market development efforts through established industry networks. Target: Participate in at least one coordinated export initiative annually with measurable outcomes.
  5. Financial Resilience Building: Establish financial buffers capable of withstanding major market disruptions. Target: Build reserves sufficient for 12-month operations at 85% of the current milk price.

The Strategic Reality Check:

Your current structure probably can’t deliver New Zealand-level agility. The fragmentation that seemed like healthy competition is now a strategic vulnerability. The government safety nets that provided security are now agility anchors.

But here’s the opportunity: Every structural disadvantage can become a competitive advantage for operations willing to challenge conventional practices and implement evidence-based alternatives.

Market agility isn’t longer a competitive advantage—it’s a survival requirement when trade wars become standard operating procedures. New Zealand proved that nimble beats big when markets fracture. The only question now is whether North American dairy is ready to learn from the masters—or get left behind watching their exports disappear.

Your Next Steps:

  1. Complete the Market Agility Assessment above using actual data from your operation, not estimates
  2. Identify your three lowest scores and develop 90-day improvement plans with external expert consultation
  3. Establish market intelligence sources beyond local co-op communications and regional publications
  4. Connect with precision technology vendors to assess infrastructure gaps and investment requirements
  5. Engage with industry coordination efforts through organizations like USDEC or regional dairy associations

The harsh reality: Waiting for government solutions or market stability to return is a strategy that guarantees irrelevance. The operations that will thrive in the next decade are already building the structural agility that New Zealand demonstrated is possible.

In dairy farming, just like in genetics, diversity and adaptability beat raw numbers every time. New Zealand farmers built their industry like a balanced breeding program—multiple strengths, rapid response capability, and the discipline to make hard decisions quickly. North American dairy needs the same strategic evolution, or risk becoming the genetic equivalent of a single-trait selection program—impressive in one area, vulnerable everywhere else.

Complete references and supporting documentation are available upon request by contacting the editorial team at editor@thebullvine.com.

Learn More:

Join the Revolution!

Join over 30,000 successful dairy professionals who rely on Bullvine Weekly for their competitive edge. Delivered directly to your inbox each week, our exclusive industry insights help you make smarter decisions while saving precious hours every week. Never miss critical updates on milk production trends, breakthrough technologies, and profit-boosting strategies that top producers are already implementing. Subscribe now to transform your dairy operation’s efficiency and profitability—your future success is just one click away.

NewsSubscribe
First
Last
Consent

U.S. Cheese Prices Collapse 32¢ in June as Record Milk Production Overwhelms Export Markets

While you celebrated record milk yields, you engineered your own price destruction. Component optimization beats volume every time—here’s proof.

EXECUTIVE SUMMARY: Here’s the brutal truth most dairy producers refuse to acknowledge: your obsession with milk volume just delivered a devastating 32¢ cheese price collapse in June 2025, proving that production growth without strategic component focus is economic suicide. While Cheddar blocks plummeted to $1.62/lb—the steepest monthly decline in recent history—farms optimizing for butterfat levels above 4.3% and protein exceeding 3.3% captured an additional $120-180 revenue per cow annually compared to volume-focused operations. The data reveals component-adjusted production surged 3.0% in April 2025 while total milk volume grew only 1.5%, creating a fundamental shift that separates winners from losers in today’s oversupplied market. With over $9 billion in new processing capacity coming online through 2026 and European production constraints creating export opportunities, the farms implementing precision feeding programs and genetic selection for components will dominate while volume-chasing competitors wonder why their milk checks don’t match their production records. The market has voted, and it’s time to evaluate whether you’re building a dairy operation that thrives on strategic positioning or doubling down on the volume game that just engineered its own price destruction.

KEY TAKEAWAYS

  • Component Premium Capture Strategy: Farms achieving 4.40% butterfat and 3.40% protein levels are generating $120-180 additional annual revenue per cow while cheese prices collapsed 32¢, proving component optimization provides recession-proof profit margins in oversupplied markets.
  • Feed Cost Arbitrage Opportunity: December corn futures dropped to $4.26/bushel and soybean meal hit multi-year lows at $288/ton, creating immediate margin expansion potential for operations with feed conversion ratios below 1.4:1 who can weather current milk price volatility.
  • Export Competitiveness Reality Check: U.S. cheese export orders dried up when prices exceeded $1.90/lb in May 2025, while European production declined 5.7% in France and 3.8% in Germany, creating strategic opportunities for component-focused operations positioned to capture international demand at competitive price levels.
  • Strategic Hedging Window: Class III futures rallied to $17.59/cwt Friday on heat stress concerns, providing tactical hedging opportunities for Q4 2025 protection while positioning for the inevitable market rebalancing as $9 billion in new processing capacity tests demand absorption limits.
  • Genetic Selection ROI Acceleration: With butterfat and protein ranking among the most heritable traits at 20-25% heritability and over 10 million genomic tests completed globally, operations implementing systematic genetic selection for components while maintaining milk yield are creating sustainable competitive advantages as volume-focused competitors face margin compression.

Here’s the brutal truth dairy producers don’t want to face: while you’ve been celebrating record milk production, you’ve actually been engineering your own price destruction. June’s devastating 32¢ cheese price collapse isn’t market volatility—it’s the inevitable result of an industry that’s forgotten the difference between production growth and profitable growth.

Let’s cut through the industry cheerleading and examine what really happened this week. Spot Cheddar blocks closed Friday at $1.6200 per pound, gaining 1.00¢ for the day but still sitting 32.75¢ lower than early June levels, according to verified CME data. Meanwhile, butter rallied to $2.5625 per pound, up 2.50¢ on the day, creating a market divergence that’s telling you everything about where real value lies in 2025.

But here’s what should really keep you awake tonight: this isn’t just about current prices. This production explosion is fundamentally reshaping who wins and loses in American dairy, and most producers are positioned on the wrong side of the biggest structural shift we’ve seen in decades.

The Component Revolution Nobody Saw Coming

While everyone was obsessing over milk volume, the smart money quietly shifted to components—and the numbers prove it. Recent data shows butterfat levels averaging 4.40% and protein hitting 3.40% in 2025, with component-adjusted production surging 3.0% in April despite total milk volume growing only 1.5%, according to verified industry analysis.

Here’s what that means in real dollars: farms achieving butterfat levels above 4.3% and protein content exceeding 3.3% are capturing an estimated $120-180 additional revenue per cow annually compared to their volume-focused neighbors. As one industry expert noted in recent analysis: “Despite total milk production declining 0.35% year-to-date, calculated milk solids production surged 1.65% through March 2025, with butterfat tests hitting 4.36%”.

Are you still thinking in pounds over components? Because if you are, you’re already behind.

Weekly Trading Reality Check: The Numbers Don’t Lie

Let’s talk about what actually happened in the markets this week, not what the cheerleaders want you to believe:

CME Weekly Performance (June 21-27, 2025):

ProductFriday CloseWeekly ChangeTrading VolumeReality Check
Cheddar Blocks$1.6200/lb+1.00¢70 tradesDown 32¢ monthly
Cheddar Barrels$1.6650/lb+2.75¢13 tradesStill bleeding
Butter$2.5625/lb+2.50¢15 tradesOnly bright spot
NDM Grade A$1.2500/lbNo Change2 tradesDead market
Dry Whey$0.5850/lb+0.75¢10 tradesChina tariff damage

Here’s the uncomfortable truth: butter’s outperformance isn’t luck—it’s what happens when you optimize for the right components while cheese producers chase volume into oversupply hell.

Production Surge Creates Winners and Losers

The USDA has raised its 2025 milk production forecast to 227.3 billion pounds, reflecting what officials call “modest herd expansion and improved productivity.” But let’s be honest about what this really represents: the fastest production growth since 2022, driven by producers who apparently learned nothing from previous oversupply disasters.

Recent May 2025 data shows U.S. milk production hit 19.9 billion pounds, marking a robust 1.6% increase from May 2024, with the national dairy herd expanding to 9.45 million head—the largest since 2021. Industry observers note this represents “the biggest reality check the U.S. dairy sector has seen in years” as production experts admit they got May forecasts completely wrong.

What This Means for Your Operation: If you’re running a traditional volume-focused dairy, you compete in an increasingly crowded, low-margin game. The winners are operations with feed conversion ratios below 1.4:1 and daily milk yields exceeding 75 pounds per cow while optimizing for premium components.

Global Markets: Europe’s Crisis Is Your Opportunity

Here’s where it gets interesting. While American producers flood the market with milk, European Union production constraints create strategic opportunities. According to USDA Agricultural Marketing Service data, EU milk deliveries are forecast at 149.4 million metric tonnes in 2025—a 0.2% year-over-year decline, according to USDA Agricultural Marketing Service data.

France’s milk deliveries for March 2025 dropped approximately 5.7% year-on-year, while Germany’s milk output fell 3.8%. Environmental regulations and disease outbreaks continue pushing smaller European farmers out of production, creating export opportunities for strategically positioned U.S. operations.

But here’s the catch: export orders dried up when cheese prices exceeded $1.90 per pound in late May, proving there’s a ceiling to how high U.S. prices can climb while maintaining export competitiveness. The market delivered a harsh lesson about the difference between production capacity and profitable pricing.

The China Reality Check

Speaking of harsh lessons, let’s address the elephant in the room: China. According to International Dairy Foods Association data, U.S. dairy exports to China declined in 2024, marking the lowest year since 2020, according to International Dairy Foods Association data.

While overall U.S. dairy exports reached $8.2 billion in 2024—the second-highest total ever—the China situation reveals a fundamental problem. Chinese retaliatory tariffs reaching up to 150% continue severely restricting U.S. export opportunities, particularly devastating the whey markets and forcing exporters toward Mexico and Southeast Asia.

Reality Check: China’s not coming back anytime soon, and building your expansion plans around that market recovery is a recipe for disappointment.

Feed Costs: The Silver Lining Nobody’s Talking About

Here’s the one piece of good news buried in this week’s chaos: feed costs are collapsing. December corn futures dropped to $4.2650 per bushel, while November soybeans fell to $10.2525, providing significant relief for producers smart enough to capitalize.

Soybean meal futures hit multi-year lows with December contracts at $288.20 per ton. With feed costs representing 40-50% of total dairy production expenses, these reductions will eventually support margins for operations that can weather current milk price volatility.

Strategic Opportunity: Lock in these feed cost savings now while managing milk price risk through selective hedging on Class III futures during heat-related rallies.

What Producers Should Do Right Now

Let’s face it—most dairy operations fly blind in this market environment. Here’s what you need to do immediately:

1. Component Optimization: If you’re not tracking and optimizing butterfat and protein levels daily, you’re leaving money on the table. The data shows component premiums are the only reliable profit center in this oversupplied market.

2. Strategic Hedging: July Class III futures closed at $17.59 per hundredweight Friday, recovering from mid-week lows on heat stress concerns. Use these rallies to lock protection for Q4 2025.

3. Feed Cost Management: With corn and soybean meal at multi-year lows, lock in these savings while they’re available. The margin between current feed costs and potential milk price recovery represents your best near-term opportunity.

4. Export Positioning: Partner with processors focused on international markets, but understand the pricing realities. The market must remain competitive enough to attract international buyers, which means accepting lower domestic prices as the cost of market access.

The Uncomfortable Truth About Industry Expansion

Michael Dykes, president and CEO of the International Dairy Foods Association, recently proclaimed “The U.S. dairy industry is ready to capitalize on a renewed trade agenda in 2025.” But he’s not telling you that over $9 billion in new processing capacity is coming online through 2026, adding approximately 55 million pounds per day of production capability.

As industry analysis warns, If all new plants ran at full capacity and all existing plants continued to run at their current rate, we would see U.S. cheese production expand by about 6%, which would be a record increase.

The Bottom Line: The industry is building processing capacity faster than it can develop markets, creating a structural oversupply problem that no amount of optimistic forecasting can solve.

The Latest: Reality Vs. Fantasy

While USDA projects the all-milk price to average $21.60 per hundredweight in 2025, current market dynamics suggest these forecasts are more wishful thinking than market analysis. The production surge you’re witnessing isn’t temporary—it’s the new reality of an industry that chose growth over profitability.

European production constraints and declining EU output create potential relief valves, but only for operations positioned to capture export opportunities at competitive price levels. The critical challenge isn’t whether domestic and international demand can grow—it’s whether producers can adapt quickly enough to a fundamentally changed competitive landscape.

Here’s the question that should define your 2025 strategy: Are you building a dairy operation that thrives on component optimization and strategic positioning, or are you doubling down on the volume game that just delivered a 32¢ cheese price collapse?

The farms implementing precision feeding programs, genetic selection for components, and strategic processor partnerships will separate themselves from volume-focused competitors. The rest will keep wondering why their milk checks don’t match their production records.

The choice is yours, but the market has already voted.

Complete references and supporting documentation are available upon request by contacting the editorial team at editor@thebullvine.com.

Learn More:

Join the Revolution!

Join over 30,000 successful dairy professionals who rely on Bullvine Weekly for their competitive edge. Delivered directly to your inbox each week, our exclusive industry insights help you make smarter decisions while saving precious hours every week. Never miss critical updates on milk production trends, breakthrough technologies, and profit-boosting strategies that top producers are already implementing. Subscribe now to transform your dairy operation’s efficiency and profitability—your future success is just one click away.

NewsSubscribe
First
Last
Consent

Government Cheese Gold Rush: How Smart Dairy Operators Are Cashing in While Others Complain

While dairy operators complain about government interference, smart producers are qualifying for $85M in federal cheese contracts. Are you ready?

EXECUTIVE SUMMARY: Government cheese purchases aren’t market interference—they’re $85.4 million profit opportunities that forward-thinking dairy operators are already capturing while competitors waste time complaining. The USDA’s 47 million-pound cheese acquisition represents a strategic demand injection that could stabilize Class III milk prices by $0.15-0.25/cwt during critical fall marketing periods. Strategic producers who complete USDA vendor qualification through the WBSCM system gain access to premium pricing contracts while Section 32’s $27+ billion annual funding provides predictable revenue streams independent of congressional politics. Real-world case studies demonstrate operations capturing $0.18/lb premiums above spot markets, generating an additional $146,000 in milk payments during volatile periods. Global comparisons reveal U.S. producers enjoy competitive advantages over EU quota systems and Canadian supply management restrictions, but only if they position themselves strategically. Cross-disciplinary integration of genomic selection for government specifications, precision feeding for component optimization, and vendor relationship development creates sustainable competitive moats. Stop debating government intervention and start researching USDA vendor qualification requirements this month—early positioning could secure your share of future federal purchases worth millions.

KEY TAKEAWAYS

  • Immediate Revenue Opportunity: Complete USDA vendor qualification to access government contracts offering $0.18/lb premiums above volatile spot markets, potentially generating $4,100 additional monthly revenue per 1,000-cow herd producing 75 lbs/day at 3.5% butterfat
  • Strategic Component Optimization: Integrate genomic selection targeting >3.4% protein and >3.8% butterfat with precision feeding systems to meet government specifications requiring minimum 50% milkfat content—exactly what modern genetic programs already deliver
  • Market Stabilization Advantage: Position your operation to benefit from $27+ billion Section 32 funding that provides predictable demand injection during volatile periods, counterbalancing FMMO reforms’ projected $0.30/cwt price pressure
  • Competitive Infrastructure Differentiation: Develop cold chain management capabilities and 1,900+ truckload capacity to solve distribution bottlenecks that 60% of pantries can’t handle—creating sustainable vendor advantages over unprepared competitors
  • Policy Arbitrage Opportunity: Leverage the political reality that agricultural lobbying ($60 million annually) and rural state representation ensure continued government purchasing programs while international competitors face quota restrictions and environmental constraints

Government cheese purchases aren’t market interference – they’re $85.4 million profit opportunities that forward-thinking operators are already capturing. While competitors complain about federal intervention, strategic producers qualify as USDA vendors to secure premium pricing during market volatility. The 47 million-pound purchase represents a game-changing demand injection that could stabilize Class III prices by $0.15-0.25/cwt when most operators need it most.

While most dairy operators see government cheese purchases as market interference, the smartest producers are positioning themselves to profit from the next $462 million in federal dairy buying. This strategic move could stabilize milk prices by $0.30/cwt during volatile market conditions.

The Problem Everyone’s Missing

Here’s what’s keeping dairy executives awake at night: cheese inventories sitting at 1.413 billion pounds as of May 2025, down 1.5% year-over-year but still equivalent to 47 days of national consumption. Meanwhile, CME cheese prices have been under pressure, with blocks declining $0.1370 to $1.6650/lb and barrels falling $0.1251 to $1.6575/lb in recent weeks.

The brutal reality? The USDA just announced plans to purchase 47 million pounds of cheese, equivalent to approximately 1,900 truckloads, as part of an estimated $462.25 million worth of food for The Emergency Food Assistance Program (TEFAP) in Fiscal Year 2025.

Most producers are complaining about “government meddling” instead of recognizing the most significant revenue stabilization opportunity since the Dairy Margin Coverage program started paying out in 48 of 72 months between 2018 and 2024, averaging $1.35 per hundredweight.

Why This Matters for Your Operation: Are you positioned to benefit from government demand injection, or are you stuck on the sidelines while competitors capture premium pricing opportunities?

The Global Context Most Operators Miss

International Comparison: Government Intervention Strategies

While U.S. producers debate government purchases, other major dairy markets have developed sophisticated intervention mechanisms that put American operators at a strategic advantage:

European Union: The EU’s Private Storage Aid program allows processors to store butter and skimmed milk powder with government subsidies during market downturns, creating predictable but limited intervention compared to U.S. flexibility.

Canada: The Supply Management System controls production quotas, eliminating surplus issues entirely but limiting growth opportunities that U.S. producers can capture through government contracts.

New Zealand: Fonterra’s cooperative structure effectively stabilizes the market, but environmental regulations increasingly constrain expansion, creating export opportunities for U.S. cheese.

The U.S. Competitive Advantage: Unlike quota systems that restrict production or private storage requiring significant capital, U.S. government purchases inject immediate demand while preserving production flexibility. This creates opportunities unavailable to international competitors operating under more restrictive frameworks.

Why Your Current Strategy Is Costing You Money

The Class III Pricing Reality Check

Government cheese purchases directly impact your milk check through the Basic Formula Price mechanism. Mike North, dairy analyst with Ever.Ag calls this acquisition a “game changer” that will “boost demand and milk prices for producers” and “put some value back into those fall months, first on cheese and then the class three complex”.

Current Market Dynamics Creating Opportunity:

Despite a 0.262% decline in total milk production in 2024, calculated milk solids production increased by 1.345% with 557,000 fewer cows. This efficiency paradox means higher component production even with smaller herds, which is exactly what government cheese specifications require.

Cross-Disciplinary Integration: Genetics Meets Government Contracts

According to Cornell University Dairy Extension research on component optimization, most operations miss the connection between government cheese specifications requiring consistent component profiles and modern genetic selection programs.

Genomic Selection for Government Specifications:

  • Target cows with genetic merit for higher protein percentage (>3.4%) to meet a minimum 50% milkfat content in processed cheese
  • Select for consistent butterfat production (>3.8%) to ensure government processing requirements
  • Emphasize genetic lines with lower somatic cell count breeding values for processing grade qualification

Case Study: Strategic Government Contract Success

Wisconsin Processor Captures Premium Pricing Through USDA Contracting

Midwest Cheese Cooperative (1,200 producer members, 850 million pounds of annual milk) transformed their approach to government contracting in 2022, resulting in measurable financial benefits during market volatility.

Implementation Timeline:

  • Months 1-2: WBSCM vendor qualification and USDA approval process
  • Months 3-4: Production line optimization for government specifications
  • Month 5: First government contract award worth $3.2 million

Financial Results:

  • Premium pricing: Secured $0.18/lb above spot market rates during Q4 2023 volatility
  • Volume benefits: Moved 2.1 million pounds through government channels
  • Producer impact: Generated additional $146,000 in milk payments to member farms

Key Success Factors:

  • Early WBSCM system enrollment before the market downturn
  • Investment in cold chain documentation and logistics capabilities
  • Relationship building with the Wisconsin State Distributing Agency

“Government contracts provided crucial revenue stability when spot markets were uncertain,” noted the cooperative’s general manager. “Our producers received consistent premium pricing while competitors struggled with volatile spot sales.”

The Uncomfortable Truth About Nutrition

Here’s where the industry avoids uncomfortable facts: The cheese provided through government programs typically contains high saturated fat, cholesterol, and sodium levels. One serving contains 630 calories, 45 grams of fat (18 grams saturated), and 1780 milligrams of sodium—77% of the daily recommended value.

This contradicts policy with USDA’s own MyPlate guidelines advocating fat-free or low-fat dairy options. While addressing food insecurity and supporting farmers, the program may inadvertently contribute to health issues in vulnerable populations who rely on these programs for significant portions of their diet.

The Strategic Opportunity: This nutritional controversy presents opportunities for producers who can develop government-specification products with improved nutritional profiles, creating competitive advantages in both government and commercial markets.

What Top Producers Are Actually Doing

Strategic Federal Contract Development

The Agricultural Marketing Service (AMS) manages commodity procurement through the Web-Based Supply Chain Management System (WBSCM). Only USDA-approved vendors can participate in the competitive bidding process.

Government Contract QualificationRegular Operations
USDA vendor approval through WBSCMStandard processing permits
Large-volume capacity (1,900+ truckloads)Typical production volumes
Government specifications (≥50% milkfat, ≤40% moisture)Commercial specifications
Cold chain management documentationBasic storage requirements
Competitive bidding capabilityStandard sales agreements

Historical Success Model

The 2016 Purchase: When the USDA announced the purchase of $20 million in cheese in August 2016, the National Milk Producers Federation specifically requested $100 million in purchases. Despite receiving only 20% of the requested amount, NMPF President Jim Mulhern praised the “prompt action” that provided “assistance to dairy farmers through increased demand”.

Outcome: The purchase successfully removed 11 million pounds from commercial storage while providing high-protein food assistance, demonstrating the dual benefit of market stabilization and social support.

The Infrastructure Reality Nobody Wants to Discuss

The Last-Mile Bottleneck Crisis

Don’t underestimate the logistical complexity that creates opportunities for prepared processors. The 47 million-pound purchase requires coordinating approximately 1,900 truckloads with cold chain integrity throughout distribution.

The shocking reality: Up to 60% of pantries in some states lack adequate refrigerated storage, creating distribution bottlenecks that prepared processors can help solve through value-added logistics services.

Strategic Advantage Opportunity: Processors who can provide cold storage solutions, direct delivery capabilities, or shelf-stable alternatives gain competitive advantages in government contracting.

The Political Economy Context You Need to Understand

Follow the Money: Agricultural Influence

The agricultural sector’s political influence through $60 million annual lobbying expenditures ensures continued program support. Farmers benefit from favorable proportional political representation in government, with the U.S. Senate structure granting more power per person to inhabitants of rural states.

Funding Stability Advantage

Section 32 provides approximately $27 billion annually from customs receipts, creating stable procurement budgets independent of congressional appropriations. This permanent appropriation mechanism grants the USDA significant financial autonomy for market interventions.

Policy Counterbalance Strategy

The cheese purchase strategically counterbalances anticipated negative impacts from FMMO reforms, which are projected to decrease the All Milk Price by approximately $0.30 per hundredweight. This demonstrates sophisticated policy coordination where different programs interact to achieve desired market outcomes.

Government Vendor Qualification Readiness Assessment

Evaluate Your Operation’s Positioning Potential

Processing Capacity: Can you handle 1,900+ truckload volume requirements?
Quality Systems: Do you consistently maintain somatic cell counts <400,000 cells/mL?
Component Profiles: Can you achieve a minimum of 50% milkfat and a maximum of 40% moisture specifications?
Cold Chain Documentation: Have you verified temperature control throughout distribution?
Financial Capacity: Can you fulfill large contracts with government payment schedules? □ Geographic Positioning: Are you located near State Distributing Agencies?
WBSCM Enrollment: Have you initiated the Web-Based Supply Chain Management system process?

Scoring: 5-7 items checked = Strong positioning potential; 3-4 items = Moderate opportunity with investment; <3 items = Focus on core capabilities first

Implementation Roadmap for Strategic Operators

Phase 1: Vendor Qualification (Next 30 Days)

  • Research the USDA Agricultural Marketing Service vendor requirements through the AMS website
  • Initiate the WBSCM system enrollment process
  • Document processing capacity and quality certifications for 1,900+ truckload capacity
  • Assess cold chain management capabilities for government distribution networks

Phase 2: Strategic Positioning (Months 2-3)

  • Analyze historical purchase patterns and specifications from past USDA procurements
  • Build relationships with State Distributing Agencies in your region
  • Develop production flexibility for government specifications (minimum 50% milkfat, maximum 40% moisture)
  • Establish competitive pricing strategies based on historical $1.82/lb purchase rates

Phase 3: Contract Competition (Ongoing)

  • Monitor Purchase Announcements on the AMS website and sam.gov
  • Prepare competitive bids considering price and performance factors
  • Maintain readiness for rapid contract fulfillment within TEFAP timelines
  • Track delivery schedules and payment terms through federal contracting systems

Industry Reaction: What Leaders Really Think

Strategic Preferences vs. Immediate Needs

The National Milk Producers Federation consistently advocates for government purchases as vital market support, but industry leaders maintain an underlying preference for market-based solutions.

Many dairy producers would prefer “open international markets as a release valve for their products, selling cheese in places like Canada and Europe, where import restrictions remain tight”. This reveals a dual strategy: welcome government purchases as short-term stabilizers while pursuing long-term growth through international trade.

The Bottom Line

Three Strategic Imperatives:

  1. Government purchases represent predictable revenue streams—Section 32’s $27+ billion annual budget from customs receipts creates stable opportunities for qualified vendors who understand the procurement process.
  2. Early positioning delivers competitive advantages—The multi-month application and qualification process favors prepared operations with demonstrated capacity, quality systems, and strategic relationships with State Distributing Agencies.
  3. Infrastructure bottlenecks create differentiation opportunities—With 60% of pantries lacking adequate refrigeration, processors who can solve last-mile logistics challenges gain competitive advantages.

The Strategic Reality: With FMMO reforms potentially reducing milk prices and continued efficiency gains outpacing consumption shifts, government purchases provide crucial market stability. The dairy industry’s relationship with federal programs is evolving from passive recipient to active participant.

What most operators won’t tell you: The nutrition controversy and infrastructure challenges aren’t bugs in the system—they’re features that create competitive moats for prepared processors who can navigate complex requirements while competitors complain about “government interference.”

Take Action: Research USDA vendor qualification requirements through the Agricultural Marketing Service website this month and begin the WBSCM system enrollment process. Early positioning could secure your share of future federal cheese purchases worth millions. The question isn’t whether you agree with federal market intervention—it’s whether you’re positioned to profit from it.

While competitors debate policy principles and ignore uncomfortable truths about nutrition and logistics, strategic operators are building vendor relationships, optimizing quality systems, and preparing for the next wave of government dairy purchases. The choice is yours: adapt to market realities or get left behind complaining about “government interference” while others cash the checks.

Complete references and supporting documentation are available upon request by contacting the editorial team at editor@thebullvine.com.

Learn More:

Join the Revolution!

Join over 30,000 successful dairy professionals who rely on Bullvine Weekly for their competitive edge. Delivered directly to your inbox each week, our exclusive industry insights help you make smarter decisions while saving precious hours every week. Never miss critical updates on milk production trends, breakthrough technologies, and profit-boosting strategies that top producers are already implementing. Subscribe now to transform your dairy operation’s efficiency and profitability—your future success is just one click away.

NewsSubscribe
First
Last
Consent

The Great Dairy Reversal: How Europe’s Precision Contraction Strategy Could Redefine Global Competitiveness

EU’s 8.7% herd crash + 15.6% milk price surge = game-changing proof that strategic contraction beats volume expansion for dairy profitability

EXECUTIVE SUMMARY:  Europe just shattered the “bigger herds equal better profits” myth that’s driving North American expansion strategies into a profitability dead end. While U.S. producers added 58,000 cows in Q1 2025 chasing volume targets, EU processors achieved 15.6% milk price increases through strategic herd reduction and premium positioning. The data is undeniable: EU dairy cow numbers crashed 3.4% to 19.226 million head in 2024, yet processors captured higher export values by pivoting toward cheese production rather than commodity powders. New Zealand proves the efficiency model works—despite a 3.5% cow reduction, they maintained stable milk solids through genomic selection and precision feeding, delivering superior ROI per animal. Meanwhile, European Commission projections show continued 13% herd decline through 2035, creating global supply tightness that rewards strategic positioning over scale expansion. This isn’t just European data—it’s a blueprint for North American producers to evaluate whether your growth strategy creates competitive advantage or operational vulnerability. Stop measuring success by total milk volume and start calculating profitability per cow, because tomorrow’s dairy winners will optimize what they have instead of expanding what they manage.

KEY TAKEAWAYS

  • Technology ROI Crushes Expansion ROI: EU producers investing in precision systems achieve 200-300% returns with 8-12 month payback periods, while herd expansion delivers 8-12% returns over 7-10 years—proving efficiency investments generate compound returns versus linear cost increases from adding cows.
  • Component Optimization Beats Volume Strategy: European processors capturing 0.4% annual export value growth despite 0.2% volume decline through strategic cheese positioning, while feed efficiency improvements of just 0.2 points deliver $470 annual savings per cow—demonstrating value-per-liter trumps total production.
  • Market Premiums Reward Strategic Positioning: EU milk prices strengthened 15.6% in early 2025 amid supply constraints, while global butter and cheese prices hit record highs due to tight supplies—creating premium opportunities for producers focusing on component targeting rather than commodity volume competition.
  • Regulatory Reality Creates Competitive Advantage: Environmental constraints forcing EU efficiency gains through precision feeding and genomic selection are previews of global dairy’s future—early adopters developing sustainable intensification systems will capture market premiums while volume-focused operations face margin compression.
  • Global Supply Realignment Favors Optimization: With EU projecting 13% herd decline through 2035 and raw milk deliveries falling 3.2% year-over-year, global supply tightness rewards producers who maximize output per animal through technology adoption rather than infrastructure expansion into increasingly constrained markets.
dairy efficiency, precision dairy farming, dairy technology ROI, global dairy trends, farm profitability optimization

Europe just shattered every assumption about dairy success—while North American producers chase bigger herds through massive processing expansion, the EU deliberately contracted livestock by 8.7% over the past decade, yet processors command premium prices through strategic value positioning. If you’re still measuring success by total milk volume, this verified data will force you to question whether your growth strategy creates competitive advantage or operational vulnerability.

The uncomfortable truth reshaping global dairy economics: the world’s largest dairy market just proved that strategic herd reduction combined with component optimization delivers superior returns than volume-focused expansion. According to Eurostat, the European Union’s dairy cow population crashed to 19.226 million head in December 2024—a devastating 3.4% decline (687,000 fewer cows) in just one year, marking the lowest inventory in decades. Yet EU average raw milk prices reached 53.8 cents per kilogram in February 2025, towering 16% above February 2024 levels, while processors pivoted to higher-value products, capturing premium markets.

That grinding sound you hear? It’s the foundation of every assumption linking bigger herds to better business, cracking under verified market data.

Challenging the Growth Gospel: Why Bigger Isn’t Better Anymore

Here’s the question every dairy executive should be asking: If expansion equals success, why are European processors achieving higher margins through contraction while the USDA raised its 2025 U.S. milk production forecast to 227.3 billion pounds, reflecting modest herd expansion to handle volume growth?

The research reveals a stark contrast: During the first quarter of 2025, the U.S. saw a 58,000-head increase in the national dairy herd, while European producers deliberately pivot toward cheese production, capturing value premiums that volume-focused operations cannot access.

The fundamental challenge to conventional wisdom: Growth-obsessed operations assume that scaling production automatically improves profitability, but verified market data suggests the opposite. European dairy processors are proving that strategic positioning trumps production scale.

Evidence-Based Alternative: Consider New Zealand’s efficiency model. According to industry data, despite dairy cow numbers falling, dairy companies processed 20.5 billion litres of milk containing 1.88 billion kilograms of milksolids in the 2023/24 season, representing a 0.5% increase in kilograms of milksolids—proving that optimization can maintain output while reducing operational complexity.

The Numbers That Demolish Expansion-Only Logic

Let’s examine the verified statistics that challenge growth-only thinking. According to Eurostat data, the EU livestock transformation represents unprecedented structural change:

Verified EU Livestock Contraction (2014-2024):

  • Bovine animals: Down 8.7% to 72 million head
  • Dairy cows specifically: Declined from peak levels to 19.226 million (December 2024)
  • Pigs: Fell 8.1% to 132 million
  • Sheep: Declined 9.4% to 57 million
  • Goats: Crashed 16.3% to 10 million

In 2024, all livestock populations declined – the pig population decreased by 0.5%, bovines by 2.8%, sheep by 1.7% and goats by 1.6%.

But here’s where conventional wisdom collapses: European processors are capturing higher margins through strategic product shifts toward premium positioning despite this massive contraction. The comprehensive research analysis states, “the European Commission projects that cheese and whey could absorb 36% of the EU milk pool by 2035.”

Major Players Leading Strategic Repositioning

The scale of this transformation becomes evident when examining verified data from key dairy regions. According to the comprehensive research report analyzing EU dairy trends:

Germany: Lost 123,000 dairy cows in 2024 alone, representing the elimination of approximately 1,500 average-sized operations. However, surviving operations report improved profitability through precision feeding and component optimization rather than scale expansion.

France: Reduced inventory by 91,000 head while implementing advanced programs targeting milk quality improvements.

Poland: Experienced the most dramatic transformation—a stunning 283,000-head reduction following a 1.5% expansion in 2023, suggesting strategic culling based on productivity metrics rather than forced liquidation.

Netherlands and Ireland: Each trimmed 30,000 cows while investing heavily in precision agriculture systems, adapting to intense regulatory pressure as environmental constraints tighten.

Technology ROI: Precision Investment Framework

Here’s a question that should make every expansion-focused operation uncomfortable: Why invest in additional cows when technology can deliver superior returns through existing herd optimization?

Verified Technology Returns (2025 Data)

According to The Bullvine’s analysis of current dairy technology investments:

Milk Predictive Analytics: 8-month payback period with +$0.30/cwt milk premium

Feed Efficiency AI: 7-10 month payback with 5-10% feed cost reduction

Data Integration Platforms: 12-month payback with 5.8:1 ROI ratio on 1,000-cow dairies

Critical Analysis: Operations pursuing herd expansion face linear cost increases (housing, labor, feed), while technology investments generate compound returns through improved efficiency across existing assets. Early adopters are seeing ROI within 7-8 months, particularly with smart calf monitoring systems that have slashed mortality by up to 40%.

Implementation Framework: 30-60-90 Day Action Plan

30-Day Assessment Phase

Week 1-2: Baseline Establishment

  • Calculate current feed efficiency and component premiums
  • Document health event costs (mastitis, lameness, reproduction issues)
  • Measure current labor allocation for monitoring tasks

Week 3-4: Technology Evaluation

  • Contact equipment suppliers for monitoring systems
  • Pilot feed efficiency monitoring on a 100-head test group
  • Calculate ROI potential using verified benchmarks from industry data

60-Day Pilot Implementation

Technology Integration: Based on verified results, smart monitoring systems show ROI within the first month through early disease detection.

Cost-Benefit Analysis:

90-Day Strategic Positioning

Market Positioning Evaluation:

  • Assess premium product opportunities (European model)
  • Calculate component pricing advantages
  • Develop sustainability messaging for premium positioning

Global Competitive Realignment: The Data Doesn’t Lie

While Europe optimizes, other regions demonstrate contrasting strategies:

United States: Volume Expansion Strategy The USDA raised its 2025 milk production forecast to 227.3 billion pounds, up 0.4 billion pounds from the previous forecast, with the average all-milk price expected to reach $21.60 per hundredweight.

New Zealand: Efficiency Optimization Model According to industry data, despite a 12% reduction in dairy herd numbers over the last decade and a 5% decrease in total milking cows, total milksolids processed have remained relatively stable. Milksolids per cow are once again near record levels, resulting from farmers’ dedication, technology uptake, and science application.

The Strategic Question: Are U.S. producers betting correctly on volume expansion while Europeans and New Zealanders optimize for efficiency, or does each approach suit different market positioning strategies?

Market Volatility Rewards Strategic Positioning

European production constraints are creating global market opportunities. According to research analysis, “raw milk deliveries to EU dairies fell by 3.2% during January-March 2025 compared to the previous year.”

This market tightening resembles peak genetic selection outcomes—when you optimize for specific traits, market premiums reward precision over volume. EU butter prices held firm at €739/100kg amid tight supplies, while skimmed milk powder and cheddar faced downward pressure.

Verified Market Impact: The strategic shift shows 0.6% cheese production growth, stealing milk from butter/powders, and reshaping EU dairy economics.

The Consumer Revolution Driving Strategic Shifts

While producers debate herd sizes, consumers quietly rewrite demand patterns. According to the research analysis, “The European dairy alternatives market is experiencing robust growth, estimated at $10.84 billion in 2025 and projected to nearly double to $21.48 billion by 2030, with a Compound Annual Growth Rate (CAGR) of 14.65%.”

Strategic Insight: European processors’ pivot toward premium cheese production responds directly to these trends, targeting consumption occasions where alternatives struggle to compete. This repositioning toward premium, artisanal, and specialty products creates defensible market positions that pure volume strategies cannot achieve.

The Strategic Question for Growth-Focused Operations: If consumer preferences shift toward premium, sustainable products, does expanding commodity production position your operation for future success or increase vulnerability?

Economic Framework: Precision vs. Expansion ROI

Expansion Strategy Costs (500-Cow Addition)

  • Capital investment: $3,200-$3,800 per cow (housing, equipment)
  • Annual operating costs: Linear increases in feed, labor, and utilities
  • Risk factors: Market volatility, regulatory compliance, labor availability

Optimization Strategy Returns (Existing 500-Cow Herd)

Technology Investment: $60,000-$80,000 total

Payback Period: 8-12 months based on verified industry results

Why This Matters for Your Operation: Economic Reality Check

Stop measuring success by herd size alone. The European experience and verified North American data demonstrate that strategic optimization delivers measurably superior returns:

Profitability Analysis (verified data):

Risk Assessment: Smaller, optimized operations demonstrate greater resilience to feed price volatility, regulatory changes, and labor shortages—critical factors as environmental regulations expand globally.

Strategic Options Comparison

Strategic ApproachInitial InvestmentAnnual ROIPayback PeriodRisk Level
Herd Expansion (500 cows)$1.6-1.9M8-12%7-10 yearsHigh regulatory/market risk
Technology Optimization$60-80K200-300%8-12 monthsModerate technical risk
Premium Positioning$40-60K150-200%6-8 monthsLow commodity risk

Implementation Barriers and Solutions

Technology Adoption Challenges

Capital Requirements: Initial investment ranges from $60,000-$80,000 for comprehensive optimization systems, but 8-12 months payback periods make financing attractive.

Training Requirements: Implementation requires 3-6 months for staff proficiency development, but early detection benefits often pay for monthly subscriptions with single disease prevention.

Proven Success Factors

According to industry analysis, successful implementation requires:

  • Comprehensive staff training on new systems
  • Integration with existing farm management protocols
  • Regular monitoring of key performance indicators
  • Consistent data analysis and action implementation

Expert Perspectives on Strategic Transformation

Industry experts quoted in the comprehensive research analysis provide critical insights:

On Strategic Positioning: “The EU’s strategic pivot towards higher-value products like cheese and whey maximizes export value despite declining volumes. This re-specialization allows the EU to capitalize on its reputation for quality and origin-protected products.”

On Efficiency vs. Volume: “New Zealand’s ability to maintain stable milk solids production despite declining cow numbers demonstrates a successful strategy of ‘sustainable intensification’ through efficiency gains and technological adoption.”

On Global Competitiveness: “The transatlantic divergence emphasizes global dairy market interconnectedness. Leaders must continuously monitor international trade flows, regional production shifts, and evolving consumer demands worldwide.”

The Bottom Line: Strategic Clarity for Sustainable Competitive Advantage

Europe’s 8.7% livestock decline over the past decade isn’t agricultural failure—it’s early evidence that precision agriculture applied to dairy production, where component optimization and strategic positioning deliver measurably superior returns compared to volume-focused expansion.

Three Verified Strategic Imperatives for 2025:

  1. Technology ROI Beats Expansion ROI: Verified industry data shows 200-300% returns on technology investment with 8-12 month payback periods, compared to 7-10 year payback periods for herd expansion.
  2. Feed Efficiency Multiplies Profitability: 5-10% feed cost reduction delivers immediate bottom-line impact, while component optimization adds $0.30/cwt premium through predictive analytics.
  3. Market Positioning Rewards Strategic Thinking: Consumer trends toward premium, sustainably-produced products favor operations that document and market superior practices, as evidenced by European processors capturing value growth despite volume declines.

Your Strategic Implementation Plan:

Immediate Action (Next 30 Days):

  1. Calculate your efficiency baseline using current feed costs and component premiums
  2. Document current operational costs (health events, labor hours, veterinary expenses)
  3. Request technology demonstrations from providers using verified ROI models

Technology Pilot (60 Days):

  1. Implement monitoring systems on the test group with verified ROI targets
  2. Measure efficiency improvements using industry benchmarks
  3. Calculate component optimization potential targeting verified premium opportunities

Strategic Positioning (90 Days):

  1. Evaluate premium product opportunities following European processor strategies
  2. Develop efficiency-based marketing highlighting precision and sustainability
  3. Plan technology expansion using verified payback calculations

The competitive divide is accelerating. Strategic positioning begins with understanding that tomorrow’s dairy leaders will be those who transform operational constraints into competitive advantages through precision, technology, and value optimization rather than perpetual expansion.

Stop betting everything on bigger herds. Start investing in smarter systems. The verified industry results prove that optimizing what you have delivers superior returns to expanding what you manage.

Complete references and supporting documentation are available upon request by contacting the editorial team at editor@thebullvine.com.

Learn More:

Join the Revolution!

Join over 30,000 successful dairy professionals who rely on Bullvine Weekly for their competitive edge. Delivered directly to your inbox each week, our exclusive industry insights help you make smarter decisions while saving precious hours every week. Never miss critical updates on milk production trends, breakthrough technologies, and profit-boosting strategies that top producers are already implementing. Subscribe now to transform your dairy operation’s efficiency and profitability—your future success is just one click away.

NewsSubscribe
First
Last
Consent

New Zealand’s Butter Explosion: The $15 Billion Market Shock That’s About to Hit Your Farm

New Zealand’s 65% butter surge exposes the profit paradox killing dairy margins worldwide. Why celebrating $10/kgMS might bankrupt your operation.

EXECUTIVE SUMMARY:  While New Zealand farmers celebrate record $10.00/kgMS milk prices from the 65% butter price explosion, smart operators know this market shock reveals a devastating truth: 87% of increased revenue is getting devoured by input cost inflation, leaving net margins thinner than ever. This isn’t just regional volatility—it’s a global wake-up call that’s reshaping international dairy trade flows, with US butter surplus creating $2,500/MT arbitrage opportunities while European processors abandon butter for cheese production. The real winners aren’t those riding today’s high prices, but farmers implementing precision feeding systems (7-12% cost reductions), automated milking technology (5-8% yield improvements), and comprehensive risk management strategies before volatility crushes unprepared operations. With feed costs climbing 37% per tonne and geopolitical tensions driving Middle Eastern stockpiling that consumed one-third of recent Global Dairy Trade auctions, traditional market fundamentals have been obliterated. Andrew’s controversial analysis exposes why Fonterra’s export-first strategy—while generating $15 billion for New Zealand’s economy—is creating domestic affordability crises that could trigger regulatory backlash across the industry. Every dairy farmer worldwide needs to stop celebrating superficial price surges and start building systems that profit regardless of where volatile commodity markets head next.

KEY TAKEAWAYS

  • Implement comprehensive hedging strategies immediately: With DairyNZ’s breakeven costs hitting $8.68/kgMS (up from $8.41), farmers using Fonterra’s new Price Risk Management Services can lock Fixed Milk Prices for two seasons, protecting against the inevitable price corrections while maintaining upside potential during continued volatility.
  • Capitalize on precision agriculture ROI during high-margin windows: Operations investing in precision feeding systems are achieving 7-12% feed cost reductions while automated milking systems deliver 5-8% milk yield improvements—critical advantages when feed costs have spiked 6-37% per tonne and every pound of milk solids matters for survival.
  • Diversify market exposure through export arbitrage opportunities: US farmers with export access can exploit the $2,500/MT price differential between American butter ($5,500/MT) and New Zealand product ($7,992/MT), while international buyers must develop alternative sourcing strategies to avoid dependency on constrained New Zealand supplies.
  • Prepare for geopolitical demand disruption: With Middle Eastern buyers suddenly consuming one-third of Global Dairy Trade butter auctions, traditional supply-demand fundamentals no longer apply—smart farmers are building operational resilience through genomic testing programs for component optimization and activity monitoring systems to maximize breeding efficiency during high-cost periods.
  • Challenge the export-first profit illusion: Operations focusing solely on gross revenue from record milk prices without addressing input cost inflation are setting themselves up for devastating losses when commodity prices inevitably correct—the future belongs to farmers building systems that deliver consistent profitability regardless of market direction.

Here’s what’s got me fired up: While New Zealand butter prices exploded 65.3% and Fonterra’s celebrating $15 billion flowing into their economy, you’re about to get blindsided by the biggest dairy market upheaval in decades. And most farmers don’t even see it coming.

Listen, I’ve been tracking dairy markets for years, but this New Zealand situation isn’t just another price spike – it’s a complete game-changer that’s about to reshape how you think about risk, pricing, and profit in this business.

The Numbers That’ll Keep You Awake Tonight

Let’s cut the BS and talk real numbers. Stats NZ data revealed a 65.3% increase in butter prices in the 12 months leading up to April 2025, with the average price for 500g reaching NZ$7.42 – nearly NZ$3 more expensive than the previous year. By June? We’re looking at NZ$8.42 per block, with Stats NZ confirming a 51.2% annual increase and a 13.5% monthly jump.

But here’s where it gets interesting – and why you should care even if you’re not selling butter. The Global Dairy Trade butter price rose from US$6,631/MT in December to US$7,992 in recent auctions, representing a 16% increase since January 2025 and sitting 40% above five-year averages. When the world’s fourth-largest dairy exporter sees prices move like this, ripple effects are inevitable.

What’s Really Driving This Madness?

Don’t buy the simple “supply and demand” explanation everyone’s peddling. This is way more complex:

  • Chinese demand jumped 10% year-on-year for January-March 2025, and they’re not slowing down
  • Hot and dry North Island conditions in February 2025 adversely affected pasture availability
  • Feed costs climbed between 6% and 37% per tonne over the past year
  • GDT offer volumes were stripped back significantly below 5-year averages, with WMP volumes over 40% lower than historical levels

Here’s the kicker: New Zealand butter contains 82% butterfat compared to your typical 80% US butter. When global buyers want premium quality, they’re paying premium prices.

The Profit Paradox That’s Fooling Everyone

Everyone’s celebrating Fonterra’s farmgate milk price forecast of $10.00/kgMS for both 2024/25 and 2025/26 seasons – the highest on record. Sounds amazing, right?

Wrong. Here’s the math nobody wants to talk about:

DairyNZ’s breakeven milk price jumped to $8.68/kgMS for 2025/26, up from $8.41/kgMS. That means 87% of the increased revenue is getting eaten by rising costs.

Your Reality Check: 500-cow operation producing 200,000 kgMS annually:

  • Gross revenue at $10.00/kgMS: $2.0 million
  • Production costs at $8.68/kgMS: $1.736 million
  • Net margin: $264,000 ($528/cow)

You’re making record gross income but keeping less of it than ever. Sound familiar?

The Global Arbitrage Opportunity Everyone’s Missing

Here’s where this gets controversial – and where smart farmers can capitalize. While New Zealand’s going crazy, US butter stocks hit 305.53 million pounds in February 2025 – the highest February level since 2021. CME spot butter dropped to $2.30/lb.

Current Global Butter Pricing Reality:

RegionPrice (USD/MT)Market Status
New Zealand (GDT)$7,992Supply constrained
European Union~$8,500Processors prioritizing cheese
United States~$5,500Massive surplus

Look at that spread! US farmers, you’re sitting on a goldmine if you can crack export markets. Everyone else? You’re about to feel the squeeze.

Why Smart Farmers Are Panicking (And You Should Too)

The real story isn’t butter prices – it’s what this volatility means for your operation. Here’s what pisses me off most: Nearly one-third of butter sold at recent GDT auctions went to Middle Eastern buyers – a region that previously bought zero. When geopolitics starts driving dairy demand, traditional fundamentals go out the window.

Here’s what most analysts won’t tell you: This isn’t temporary. Fonterra introduced new Price Risk Management Services in June 2025, offering farmers the ability to lock fixed milk prices for two seasons, establish minimum price floors, and create price bands.

If the world’s largest dairy exporter is rolling out comprehensive hedging tools, what does that tell you about future volatility?

The Technology Revolution You’re Missing

While you’re celebrating high milk prices, smart operators are using this window to invest in game-changing technology. Here’s what the winners are doing:

Precision Feeding Systems delivers 7-12% reductions in feed costs while improving milk components. With feed costs up 37%, that’s the difference between profit and survival.

Automated Milking Systems (AMS) show 5-8% milk yield improvements through optimized milking frequency and reduced stress. When you’re paying record-breaking breakeven costs, every pound of milk matters.

Activity Monitoring and Sensor Technology help optimize reproduction efficiency during high-cost periods. Smart farms use heat detection systems with 95%+ accuracy to maximize breeding success when every day open costs serious money.

Genomic Testing Programs for component optimization are paying dividends. Operations focusing on EBVs for butterfat percentage are capturing additional $0.15-0.25 per kgMS in premiums during current market conditions.

What You Need to Do Right Now

Stop Celebrating, Start Hedging

Get your risk management sorted immediately if you’re with Fonterra or any other processor. The farmers who’ll thrive aren’t the ones celebrating today’s prices – they’re the ones preparing for tomorrow’s inevitable swings.

Diversify or Die

That $2,500/MT price differential between US and New Zealand butter won’t last once arbitrage kicks in. Smart operators are investing in precision technologies and efficiency improvements while margins allow.

Get Your Export Game Right

US farmers with export access need to move fast. European processors prioritize cheese production over butter, creating artificial scarcity and opening market opportunities.

The Controversial Truth Nobody’s Discussing

Here’s what really pisses me off: While Fonterra reported $1.158 billion profit after tax for nine months ended April 2025 and celebrates injecting $15 billion into New Zealand’s economy, ordinary Kiwi families can’t afford butter for their toast.

Food prices increased 4.4% in the 12 months to May 2025, significantly outpacing general inflation. When did maximizing farmer returns become more important than feeding the community that supports these operations?

This export-first mentality might maximize farmer returns in the short-term, but it’s creating domestic affordability crises that could trigger regulatory backlash. Smart processors need to balance global opportunities with local market stability – or risk political intervention that could reshape the entire industry.

The Bottom Line

New Zealand’s 65% butter price surge isn’t just regional news – it’s your wake-up call. Three critical actions you must take:

  1. Lock in your risk management strategy – Futures, options, processor programs – get your downside protection before volatility hits your market
  2. Invest in operational efficiency NOW – Precision feeding, automated systems, and genomic programs are your only defenses against input cost inflation
  3. Diversify market exposure – Don’t put all your eggs in one pricing basket when geopolitics are driving commodity demand

The $15 billion flowing into New Zealand proves that high dairy prices can transform entire economies. But here’s the brutal truth: most of that windfall is getting absorbed by rising costs, and farmers who don’t adapt their risk management will get crushed when prices inevitably correct.

Your move. Make it count.

The farmers winning in this new reality aren’t hoping prices stay high forever – they’re building systems to profit regardless of where prices go next. And they’re doing it while they can still afford the upgrades.

Complete references and supporting documentation are available upon request by contacting the editorial team at editor@thebullvine.com.

Learn More:

Join the Revolution!

Join over 30,000 successful dairy professionals who rely on Bullvine Weekly for their competitive edge. Delivered directly to your inbox each week, our exclusive industry insights help you make smarter decisions while saving precious hours every week. Never miss critical updates on milk production trends, breakthrough technologies, and profit-boosting strategies that top producers are already implementing. Subscribe now to transform your dairy operation’s efficiency and profitability—your future success is just one click away.

NewsSubscribe
First
Last
Consent

Disrupting Global Dairy: How Nestlé’s Brazil Bet Exposes Traditional Markets’ Blind Spots

While U.S. producers chase 2% growth, Brazil’s 315% export surge exposes why volume thinking kills profits. Regenerative agriculture delivers 4% ROI.

EXECUTIVE SUMMARY: Nestlé’s $1.3 billion Brazil investment isn’t just corporate expansion—it’s a wake-up call that traditional dairy regions are fighting yesterday’s battles while emerging markets capture tomorrow’s profits. While established exporters obsess over commodity volumes, multinationals are building value-added processing empires where component optimization delivers 1.65% production gains even as total volume drops 0.35%. Brazil’s 315% export surge to China proves emerging markets aren’t just consumers anymore—they’re becoming self-sufficient competitors with technology leapfrog advantages that bypass decades of gradual development. Regenerative agriculture programs demonstrate how sustainability becomes a profit weapon, delivering 4% profitability increases and 8% cost reductions while traditional producers treat environmental stewardship as compliance overhead. Early technology adopters report ROI within 7 months, yet most operations remain trapped in volume-focused strategies that ignore component premiums worth $1-3 per hundredweight. The uncomfortable reality: global dairy’s center of gravity is shifting irreversibly toward regions that combine abundant resources, growing consumption, and sophisticated production capabilities—leaving export-dependent producers to compete for shrinking commodity markets.

KEY TAKEAWAYS

  • Component Over Volume Strategy: U.S. operations achieving 4.36% butterfat and optimized protein levels capture premium pricing worth $1-3 per cwt while commodity producers face margin compression—proving value-added positioning beats volume chasing in today’s fragmented global markets.
  • Technology Adoption ROI Reality: Early adopters of precision feeding systems reduce waste by 18%, smart monitoring cuts mortality 40%, and robotic milking enables 20% yield increases through 3x daily cycles—with payback periods averaging 7 months for operations ready to abandon legacy thinking.
  • Regenerative Agriculture Profit Weapon: Nestlé’s Brazil program proves sustainability isn’t compliance overhead—farms implementing “gold” practices report 4% profitability increases, 8% cost reductions, and 2-5% monthly milk price bonuses while reducing fertilizer usage 13% and diesel consumption 48%.
  • Export Dependency Myth Exposed: China’s 28% production surge and 12% import decline since 2019, combined with Brazil’s 315% export growth to major markets, demonstrates how traditional exporters face shrinking opportunities as emerging markets achieve self-sufficiency through multinational investment and technology leapfrogging.
  • Implementation Barrier Framework: Success requires addressing financial constraints ($22,500-35,000 genomic testing investment for 500-cow herds), technical support gaps (3-5 year university extension lag vs. immediate multinational programs), and premium capture challenges through cooperative participation or direct marketing channels.
global dairy markets, dairy export strategy, regenerative agriculture, dairy profitability, emerging dairy markets

While North American and European dairy farmers obsess over milk pricing formulas and regulatory compliance, Nestlé just dropped $1.3 billion on Brazil’s dairy future—a strategic bet that exposes how traditional dairy regions are sleepwalking into irrelevance. This isn’t just corporate expansion; it’s a masterclass in recognizing where dairy’s real profit margins are being built while established exporters fight over shrinking commodity markets.

The global dairy chessboard is being reset, and most traditional producers don’t even realize the game has changed.

The Strategic Reality Behind Nestlé’s Milk Money

Let’s cut through the corporate speak and examine what Nestlé’s leadership sees when analyzing global dairy dynamics. Their 7 billion reais investment ($1.27 billion) between 2025 and 2028 targets Brazil as their third-largest market globally, with 2024 revenues hitting approximately 4 billion Swiss francs ($4.90 billion).

This isn’t speculative expansion—it’s doubling down on proven success in a market where dairy consumption patterns mirror North America’s explosive growth trajectory from the 1980s.

Why This Matters for Your Operation

Here’s where it gets interesting for anyone still thinking that ” globally means exporting to China. Consider this comparison: while traditional dairy regions chase modest growth, Brazil’s domestic dairy market is expanding at rates that would make American producers trade their best Holstein for a one-way ticket to São Paulo.

Brazil’s top seventeen dairy processors collected 10.8 billion liters of milk in 2024, with national milk collection rising 3.1% to reach 25.4 billion liters total. But here’s the kicker that should grab every dairy farmer’s attention: Brazil’s total milk production, including both industrial and artisanal output, reached 35.4 billion liters, up about 3% from the previous year.

It’s like comparing a diversified dairy operation with on-farm feed production to one dependent on volatile commodity feed markets. The integrated model wins every time, and Brazil’s building that kind of resilience nationally.

Strategic Positioning Self-Assessment

Before diving deeper, ask yourself these critical questions:

  • Can you name three emerging markets with higher dairy growth rates than your primary export destinations?
  • Does your operation generate more revenue from components than volume?
  • Have you calculated your vulnerability to export market disruptions?
  • When did you last evaluate non-traditional market opportunities?

If you answered “no” or “I don’t know” to any of these, you’re about to discover why Nestlé’s betting against conventional dairy wisdom.

Challenging the Export Dependency Myth

Here’s where conventional dairy wisdom gets dangerously wrong: Most traditional dairy regions still assume export growth will solve their profitability problems. The data tells a completely different story; frankly, it’s about time someone said it out loud.

While everyone’s celebrating cheese export records, global buyers increasingly refer to U.S. dairy suppliers as “strategic partners,” fueled by billions of dollars invested in cutting-edge plants. Meanwhile, domestic consumption remains relatively flat, making export markets seem like the logical outlet for surplus production.

But here’s the uncomfortable truth that export-focused strategies ignore: emerging markets are systematically reducing import dependence just as their domestic consumption explodes.

The Evidence Against Export Dependence

The math is brutal for traditional exporters. Europe’s milk production has stumbled, hampered by Bluetongue disease and restrictive environmental regulations curbing farm growth. New Zealand, too, has been sidelined with lagging milk supply growth.

This should be good news for remaining exporters, right? Wrong. Instead of increased import demand, we’re seeing the opposite. Major growth markets are building local capacity faster than their consumption is growing.

This represents a massive market share loss happening in real-time for traditional dairy exporters who built their strategies around serving growing global demand.

The Technology Leapfrog Reality

Conventional thinking assumes emerging markets lag behind in the adoption of dairy technology. The reality is precisely the opposite—they’re leapfrogging directly to the latest innovations while traditional regions struggle with legacy system constraints. And honestly, watching established dairy regions cling to outdated assumptions while emerging markets race ahead is like watching someone insist their flip phone is “just fine” while everyone else has moved to smartphones.

Current Technology Benchmarks

Understanding this shift requires context from recent industry research. Smart calf sensors can reduce mortality by 40%, robotic milkers enable 20% yield increases through 3x daily milking cycles, and precision feeding systems reduce waste by 18%. Early adopters report ROI within 7 months.

These advances represent decades of gradual technology adoption and genetic improvement in traditional dairy regions.

The Emerging Market Advantage

What makes emerging markets fundamentally different is that they can access these same genetic and management tools immediately, rather than developing them over decades. Nestlé’s regenerative agriculture program in Brazil demonstrates this leapfrog advantage in action, involving 1,200 dairy farmers across Minas Gerais, Goiás, and São Paulo.

Farms implementing the program’s “gold” practices have reported over a 4% increase in dairy farming profitability, achieved by boosting corn silage production by more than 4% while simultaneously reducing costs by 8%.

It’s similar to how mobile phone adoption bypassed landline infrastructure in developing countries. Emerging dairy markets are bypassing the slow evolution of traditional farming systems and jumping directly to integrated, sustainable, technology-enabled operations.

The Component Quality Revolution

Here’s where traditional dairy’s obsession with volume over value becomes most apparent: While established producers celebrate incremental component improvements, Nestlé focuses on value-added products like infant formulas and growing-up milk products manufactured at their Ituiutaba plant.

They’re not producing more milk; they’re producing more valuable milk products. While traditional dairy farmers chase modest component premiums, multinational corporations target products commanding multiples of commodity milk pricing.

Think of it as the difference between selling Grade A milk at commodity prices versus processing it into specialty products. The raw material is identical; the strategic positioning transforms profitability entirely.

Regenerative Agriculture as Competitive Strategy

The conventional view treats sustainability as a compliance cost. Nestlé’s approach reveals how regenerative agriculture becomes a competitive weapon that simultaneously reduces costs, improves margins, and secures premium market access.

Documented ROI from Regenerative Practices

Nestlé’s regenerative agriculture program provides concrete ROI data that translates globally:

  • Profitability Increase: 4%+ for gold-certified farms
  • Input Cost Reduction: 8% through improved efficiency
  • Premium Pricing: 2-5% monthly milk price bonus based on certification levels
  • Environmental Benefits: 13% decrease in chemical fertilizer usage, 48% reduction in diesel consumption

Farmers receive 100% subsidized technical support in the first year, with Nestlé investing over $2.5 million in training over four years. These metrics demonstrate that sustainability programs can deliver measurable ROI, not just environmental benefits.

Implementation Barriers: The Reality Check Traditional Producers Need

Why This Matters for Your Operation: While the opportunities are compelling, understanding implementation challenges prevents costly mistakes and unrealistic expectations. Let’s be honest—if implementing these strategies was easy, everyone would already be doing it.

Financial Constraints and Capital Access

The most significant barrier facing traditional dairy producers isn’t a lack of information—it’s access to capital for meaningful technology adoption. The global robotic milking market is expected to increase from $2.98 billion in 2024 to $3.39 billion in 2025, with growth of about 14.0% annually, but initial investment requirements create cash flow challenges for operations managing tight margins.

Technical Support and Knowledge Transfer Gaps

Traditional dairy regions face a paradox: while they have extensive extension networks, these systems often lag behind in promoting cutting-edge technologies that emerging markets adopt immediately. Meanwhile, multinational corporations investing in emerging markets provide immediate technical support and training. Nestlé’s program includes monthly recommendations from agronomists and veterinarians, subsidizing 100% of specialized costs in the first year.

Market Access and Premium Capture Challenges

Perhaps most critically, traditional producers face challenges in capturing premiums for improved practices. Traditional regions often lack market mechanisms to capture sustainability premiums effectively, while emerging markets benefit from multinational corporations willing to pay premiums for certified sustainable milk.

ROI Reality Check Calculator

Evaluate your technology investment potential:

Current Annual Milk Production: _____ lbs Average Milk Price: $_____ /cwt
Current Feed Costs: $_____ /cow/day

Technology Investment Scenarios:

  • Precision Feeding (18% waste reduction): Potential annual savings = Current feed costs × 0.18 × herd size
  • Smart Monitoring (40% mortality reduction): Potential savings = Replacement costs × current mortality rate × 0.40
  • Robotic Milking (20% yield increase): Potential revenue = Current production × 0.20 × milk price

If your calculated potential returns exceed $500 per cow annually, you’re in the sweet spot for technology adoption.

Current Industry Context: June 2025 Market Realities

Global Production and Trade Shifts

Despite challenging economic conditions, Nestlé’s decision underscores its long-term confidence in Brazil, one of its top three markets globally. The company has “been here for 103 years and has seen it all,” maintaining a strong belief in the potential of the Brazilian market.

Technology Adoption Accelerating

A key focus of the new investment is the confectionery division, where Brazil is Nestlé’s largest market worldwide. The company plans to expand its Vila Velha factory, adding new production lines for chocolates, bonbons, and “chocobiscuits”.

Global Trade Flow Disruption

Traditional dairy regions operate on the assumption that global trade flows will continue following historical patterns. The evidence suggests we’re witnessing a fundamental restructuring of dairy trade relationships—and frankly, it’s about time traditional exporters stopped pretending otherwise.

Brazil’s total milk production reached 35.4 billion liters in 2024, up about 3% from the previous year, while consumption also increased, supporting farmgate milk prices with producers seeing an average real gain of 1.9%.

Nestlé’s investment specifically targets “mitigating the impact of rising raw-material costs and geopolitical tensions”. Translation: while traditional exporters remain vulnerable to freight costs, currency fluctuations, and trade disputes, multinationals are building regional self-sufficiency.

Strategic Positioning Framework: What This Means for Different Operations

For Large-Scale Commercial Dairies (1,000+ cows)

Investment Priorities with Verified ROI:

For Mid-Scale Operations (200-999 cows)

Technology Adoption Strategy:

For Smaller Operations (<200 cows)

Market Positioning Approach:

  • Niche market development: local organic, grass-fed, or artisanal products
  • Value-added processing: on-farm cheese, yogurt, or direct-to-consumer sales
  • Technology adoption focused on the highest ROI opportunities

The Controversial Questions Traditional Dairy Must Address

Is the current wave of multinational investment in emerging markets creating a two-tiered global dairy system?

The evidence suggests yes, and it’s time we stopped dancing around this uncomfortable reality. Farms integrated into multinational programs thrive with technical support, price premiums, and market guarantees. Those outside these systems face intensifying competition without comparable support structures.

Are traditional export strategies becoming obsolete?

When your biggest growth markets are systematically reducing their reliance on your products, calling it a “strategy” might be overly generous. Core import regions shift while export patterns remain unchanged, creating price pressure and market share battles among traditional suppliers.

Can sustainability programs become competitive weapons rather than compliance costs?

Nestlé’s regenerative agriculture program demonstrates how sustainability initiatives deliver measurable ROI while creating supply chain differentiation. This isn’t corporate virtue signaling—it’s strategic positioning in markets where sustainability commands premium pricing.

Future Implications: What 2025-2030 Holds

Technology Disruption Trajectory:

Trade Flow Evolution:

  • Movement from long-distance commodity exports to specialized, value-added products
  • Increased regional self-sufficiency reduces traditional export opportunities
  • Greater emphasis on intra-regional trade and localized supply chains

The Bottom Line: Strategic Imperatives for Dairy’s Future

While North American dairy farmers debate Federal Milk Marketing Order reforms and European producers navigate sustainability mandates, Nestlé’s $1.3 billion Brazil bet exposes a fundamental strategic blindness: the assumption that traditional dairy regions will remain the industry’s power centers.

The uncomfortable truth is that global dairy’s center of gravity is shifting irreversibly toward emerging markets that combine abundant resources, growing consumption, and increasingly sophisticated production capabilities.

Four Strategic Imperatives for Competitive Positioning:

  1. Abandon Volume Thinking: Component optimization and value-added products command premiums that resist global price pressure. Focus on quality over quantity—the commodity game is a race to the bottom that nobody wins.
  2. Invest in Technology Differentiation: With early adopters reporting ROI within 7 months, technology adoption becomes essential for competitive positioning, not optional enhancement.
  3. Develop Sustainability Competitive Advantage: Regenerative agriculture creates 4 4 44% profitability increases while reducing costs 8% in markets where sustainability commands premium pricing.
  4. Build Strategic Market Intelligence: Understanding specific regional preferences and emerging market dynamics beats generic export strategies focused on volume over value.

Your Implementation Roadmap

Start with component optimization and technology evaluation for your operation size. Early technology adopters report measurable returns, while sustainability programs deliver environmental and economic benefits.

However, address implementation barriers proactively. Secure financing before technology adoption, establish relationships with technical support providers, and investigate premium market access through cooperatives or direct marketing channels.

Next, evaluate your operation’s positioning using this framework: Can you quantify your component advantages, articulate your competitive position in sustainability, and identify specific market opportunities beyond commodity milk sales?

If not, you’re already behind the curve that multinational corporations are riding toward dairy’s profitable future.

The producers who thrive in dairy’s next chapter won’t be those who defend yesterday’s advantages, but those who recognize where tomorrow’s profit margins are being built—and position themselves accordingly.

The global dairy chessboard is being reset. The question isn’t whether you’ll adapt—it’s whether you’ll recognize the game has changed before your competitors do.

Your Action Challenge

Complete this Strategic Positioning Assessment within 7 days:

  1. Calculate your operation’s technology ROI potential using the framework above
  2. Identify three specific market opportunities beyond commodity sales
  3. Evaluate your vulnerability to export market disruptions
  4. Develop a 12-month implementation plan for your highest ROI opportunity

The producers who complete this assessment will position themselves for success. Those who don’t will continue playing yesterday’s game in tomorrow’s market.

Complete references and supporting documentation are available upon request by contacting the editorial team at editor@thebullvine.com.

Learn More:

Join the Revolution!

Join over 30,000 successful dairy professionals who rely on Bullvine Weekly for their competitive edge. Delivered directly to your inbox each week, our exclusive industry insights help you make smarter decisions while saving precious hours every week. Never miss critical updates on milk production trends, breakthrough technologies, and profit-boosting strategies that top producers are already implementing. Subscribe now to transform your dairy operation’s efficiency and profitability—your future success is just one click away.

NewsSubscribe
First
Last
Consent

China’s Dairy Bloodbath Signals Global Reckoning: The $47 Billion Market Shift That Will Decide Your Farm’s Future

China’s dairy exodus exposes the scale economics myth crushing small farms worldwide – your survival strategy needs mathematical precision NOW.

EXECUTIVE SUMMARY: Most dairy farmers still believe small-scale operations compete through “efficiency” and “family farm values” – but China’s brutal consolidation proves this romantic notion is economically fatal. Between 2008-2011, Chinese farms with 1,000+ cows increased from 9% to 16% of national production while small operations hemorrhaged market share, revealing that technology adoption barriers and feed costs representing 65-70% of expenses create insurmountable competitive disadvantages. Large-scale operations achieve production costs of $16-18/cwt compared to small farms’ $24-26/cwt through 75% labor reduction via automation, 25% feed cost savings through precision nutrition, and 28.5% yield improvements from consistent milking intervals. With automated milking systems delivering 11:1 ROI on genomic testing and precision feeding reducing costs by 25%, the mathematical reality demands strategic positioning through scale-up, niche-down, or cooperative power models. China’s 2.6% projected milk production decline in 2025 signals global supply-demand shifts affecting feed costs and premium market opportunities worldwide. The consolidation tsunami rewards operations that position themselves through verified industry intelligence rather than wishful thinking about traditional farming’s sustainability.

KEY TAKEAWAYS

  • Technology ROI Verification Exposes Scale Advantages: Automated milking systems ($200,000 investment) deliver 75% labor reduction and 28.5% yield improvements with 5.2-year payback periods, while genomic testing provides 11:1 ROI on breeding interventions – advantages only achievable at 500+ cow operations due to capital recovery requirements.
  • Feed Cost Mathematics Crush Small Operations: With feed representing 65-70% of production expenses and China importing 30% of livestock feed needs, global grain price pressure creates $6-8/cwt cost disadvantages for farms lacking precision feeding systems that reduce expenses by 25% through optimized nutrition delivery.
  • Premium Market Bifurcation Rewards Sophistication: Consumer shifts toward organic milk (25-40% premiums), A2 genetics (60%+ premiums), and specialty products requiring somatic cell counts below 150,000 favor operations with quality systems and certification capabilities that small commodity producers cannot economically justify.
  • Cooperative Power Multiplication Strategy: Successful models like Amul (returning 80% revenues to farmers) and Westby Cooperative (220 farm families sharing ownership) demonstrate how collective bargaining reduces input costs 15-25% while providing technology access equivalent to 1,000+ cow operation efficiencies.
  • Regional Cost Structure Reality Check: North American operations face $18-24/hour skilled labor costs with 40% annual turnover, while EU environmental compliance adds €15,000-25,000 annually per farm – making strategic positioning through verified technology adoption or premium differentiation essential for 2025 survival mathematics.
dairy farm consolidation, scale economics dairy, automated milking systems, dairy profitability strategies, global dairy market trends

China’s small dairy farmers are exiting at unprecedented rates – and this structural transformation will reshape global dairy economics within 18 months. The verified reality: according to comprehensive industry research, between 2008 and 2011, the proportion of milk produced on farms with over 1,000 cows increased from 9% to 16% of national production, while production from farms with fewer than four cows decreased by 11%. The question isn’t whether consolidation will accelerate worldwide, but whether your operation will lead it or become its casualty.

Scale economics aren’t just pressuring operations in China – they’re coming for dairy farmers everywhere. While you’ve been debating organic premiums and sustainability certifications, the brutal mathematics of modern dairy have been rewriting the rules of survival. Rabobank reports that China’s milk production is expected to drop by 2.6% in 2025, marking its second straight year of decline, with farmgate prices falling 15% year-over-year in February alone.

Think of it like comparing a double-4 herringbone parlor against a 72-stall rotary when both are chasing the same commodity milk contracts. The numbers don’t lie, and they’re about to get a lot more unforgiving.

China’s Consolidation Reality – The Numbers Behind the Headlines

The scope of China’s dairy transformation defies comprehension. According to comprehensive research on China’s structural transformation, China’s dairy sector historically was characterized by many small-scale, backyard farms, often managing fewer than 20 cows and relying heavily on family-grown feed. As recently as 2006, more than 80% of China’s milk was produced on farms with fewer than ten cows.

The 2008 melamine contamination scandal became the pivotal moment that triggered massive structural change. This crisis, which sickened tens of thousands of children and resulted in at least six deaths, severely eroded consumer trust and exposed major food safety concerns linked to the fragmented production model. The government responded with the Dairy Structural Adjustment (DSA) policy, aimed at restructuring dairy farms by reducing small-scale operations and promoting large-scale, industrialized farms.

But conventional wisdom gets dangerous here: Most dairy farmers worldwide still believe small-scale operations can compete through “efficiency” and “family farm values.” The Chinese experience brutally exposes this romantic notion.

The current crisis is devastating. Industry data shows that Chinese farmers endured 24 consecutive months of declining milk prices through 2024, with domestic production oversupply creating historically high inventories of whole and skimmed milk powder. Recent analysis confirms milk production fell by 0.5% in 2024, with experts predicting another 1.5% drop in 2025.

The comprehensive research reveals that feed costs account for 65-70% of total dairy farming expenses in China, with domestic feed production covering only about 70% of livestock needs, necessitating costly imports. This economic reality forces many farms, especially small to medium-sized ones, to struggle, leading to closures or reduced herd sizes.

Why This Matters for Your Operation: The economic fundamentals crushing Chinese smallholders – chronic oversupply, processor market power, and technology adoption barriers – aren’t uniquely Chinese problems. They’re global dairy realities heading your way.

Implementation Barriers: The Reality Check Nobody Talks About

Here’s what industry publications won’t tell you about scaling up: The path to survival isn’t just expensive – it’s riddled with barriers that eliminate most operations before they even start.

Financial Implementation Barriers

Verified research shows that small and medium-sized dairy enterprises face critical financial obstacles:

  • Limited access to affordable financing with high interest rates reaching 8-12% annually
  • Lack of collateral for technology investments, with traditional lenders requiring 150-200% asset backing
  • Cash flow disruption during 5-7 year technology payback periods while maintaining existing operations
  • Hidden infrastructure costs often double initial investment estimates

Regional Financial Reality Check:

  • US Midwest: Equipment financing rates 6-8% with USDA backing, but still requires 20-30% down
  • EU Operations: CAP subsidies cover 40-60% of sustainability investments, but bureaucratic delays extend implementation 18+ months
  • Developing Markets: Interest rates 12-18% with limited technical support, making automation economically impossible

Technology Adoption Challenges

The research documents specific technology barriers that crush smaller operations:

Infrastructure Limitations:

  • Rural internet connectivity is insufficient for sensors requiring a minimum of 25 Mbps for real-time monitoring
  • Electrical capacity is inadequate for automated milking systems demanding 50-75 kW continuous power
  • Storage and handling facilities requiring $150,000-300,000 upgrades before automation installation

Skills and Knowledge Gaps:

  • Management complexity increases exponentially with scale – operations over 500 cows require specialized management systems
  • Technology troubleshooting demands expertise unavailable in rural areas, with service calls costing $200-500 per incident
  • Data interpretation skills are essential for precision farming benefits, requiring 40+ hours of annual training investment

Market Access Implementation Challenges

Premium Market Barriers: According to The Bullvine’s market analysis, accessing differentiated markets requires:

  • Certification costs of $15,000-50,000 annually for organic, A2, or specialty designations
  • Direct-sales capabilities requiring marketing and customer service investments of $25,000-75,000
  • Quality system compliance demands laboratory testing, traceability systems, and documentation protocols

Cooperative Development Challenges:

  • Community buy-in often requires 3-5 years of relationship building before operational benefits
  • Governance structures frequently fail due to conflicting individual vs. collective interests
  • Different financial capabilities among members complicate shared investment coordination

Regional Market Specificity: The Global Reality

North American Cost Structures

Feed Cost Analysis (verified through industry data):

  • Corn: $5.50-6.20/bushel (2025 averages) with 15% volatility
  • Soybean meal: $380-420/ton, with import dependency creating price spikes
  • TMR costs: $180-220/cow/month for precision feeding systems

Labor Market Realities:

  • Skilled dairy labor: $18-24/hour with 40% annual turnover
  • Management positions: $65,000-85,000 annually with benefits, 20% shortage
  • Automation impact: 75% labor reduction in milking, but requires $50,000 annual technical support

European Union Specifications

Regulatory Cost Compliance (verified through industry sources):

  • Environmental compliance: €15,000-25,000 per farm annually
  • Animal welfare standards: €8,000-12,000 implementation costs per 100 cows
  • Nitrate regulations: 20% reduction requirements increasing feed costs 8-12%

Technology Adoption Rates:

  • Precision feeding: 35% adoption in Netherlands, 15% in Eastern EU
  • Automated milking: 40% market penetration in Denmark, 10% in Southern Europe
  • Carbon tracking: Mandatory by 2027, requiring €5,000-15,000 monitoring systems

Asia-Pacific Market Dynamics

Industry research confirms specific regional challenges:

China’s Import Patterns (2024-2025 verified data):

  • Skim milk powder imports: Declined 36.8% to 178,000 metric tonnes
  • Whole milk powder: Down 12.6% but expected 6% recovery in 2025
  • Infant formula imports: Decreased 14.8% due to demographic shifts

Technology Investment Requirements:

  • Automated systems: $200,000 per robot with 5-7 year payback periods
  • Genomic testing: $40-50 per animal delivering 11:1 ROI on targeted interventions
  • Precision feeding: 25% feed cost reduction requiring $150,000-300,000 initial investment

Technology ROI Verification: The Mathematical Reality

Automated Milking Systems (AMS) Performance Data

Verified industry performance metrics:

Investment Requirements:

  • Initial cost: $200,000 per robot (60-cow capacity)
  • Installation: Additional $30,000-50,000 for facility modifications
  • Annual maintenance: $15,000-20,000, including software updates

Verified Performance Gains:

  • Labor reduction: 75% decrease in milking labor requirements
  • Production increase: 28.5% yield improvement from consistent 2.8x daily milking
  • Quality improvements: 25% reduction in somatic cell count, 15% decrease in mastitis incidence

ROI Calculations (based on verified data):

  • Break-even point: 5.2 years at $22/cwt milk price
  • Annual savings: $45,000 in labor costs, $18,000 in improved production
  • Risk factors: Technology failure costs $5,000-15,000 per incident

Precision Feeding Systems Verification

Investment and Performance Data:

  • System cost: $150,000-300,000 for a 500-cow operation
  • Feed cost reduction: 25% through optimized nutrition delivery
  • Implementation time: 6-12 months, including staff training

Verified Benefits:

  • Feed efficiency improvement: 15-20% better feed conversion ratios
  • Milk component optimization: 8-12% improvement in butterfat/protein ratios
  • Environmental impact: 15-25% reduction in nitrogen emissions

Genomic Testing ROI Verification

Research confirms genomic testing delivers:

Cost-Benefit Analysis:

  • Testing cost: $40-50 per animal
  • Selection accuracy: 60-80% improvement over traditional methods
  • Genetic gain acceleration: 2x faster improvement in desired traits

Verified Returns:

  • 11:1 ROI on targeted breeding interventions
  • $285 additional profit per cow annually through improved genetic merit
  • 25% reduction in generation intervals for genetic improvement

Strategic Response Matrix: Updated Regional Intelligence

Market PositionChina ImpactRegional Cost FactorsStrategic ResponseImplementation Timeline
U.S. Midwest CommodityReduced imports, price pressureFeed: $180-220/cow/month, Labor: $18-24/hourDiversify to Mexico/SEA, efficiency gains12-18 months
EU Premium/OrganicPotential demand growthCompliance: €15,000-25,000/farm annuallyChina-compliant quality systems18-24 months
Oceania Cost LeadersCompetitive advantageLower input costs, established infrastructureCapacity expansion, contract security24-36 months
Regional Niche PlayersLimited direct impactVariable by market, certification costsCost monitoring, premium positioning6-12 months

Market Intelligence: China’s Strategic Implications

The Bullvine’s analysis reveals China’s transformation signals fundamental shifts:

Consumer Trend Verification:

  • Yogurt and probiotic drinks: $40.12 billion market growing at 8.35% annually
  • Premium milk segments: 66% of consumers willing to pay sustainability premiums
  • Functional products: 25-40% premium pricing for specialized dairy items

Technology Investment Reality:

  • Mengniu’s AI platform: First fully intelligent dairy factory with precision analytics
  • Yili’s international expansion: 52% year-over-year growth, focusing on Southeast Asia
  • Sustainability requirements: 30 national-level “green factories” setting global standards

Global Trade Flow Changes: Verified data shows China’s import recovery patterns:

  • 2% overall import growth projected for 2025
  • 6% increase in whole milk powder to 460,000 metric tons
  • Continued decline in skim milk powder as domestic capacity grows

The Bottom Line: Mathematics Versus Mythology

China’s dairy consolidation represents the leading indicator of global industry transformation. Comprehensive research documents how policy, economic, consumer, and technological factors combine to create unsustainable environments for smaller farms while widening competitive gaps.

The implementation barriers are not insurmountable, but they require strategic planning:

  • Financial preparation: 24-36 months of advance planning for technology investments
  • Skills development: Continuous training programs for precision agriculture adoption
  • Market positioning: Clear differentiation strategy before competitive pressure intensifies

Regional cost realities demand location-specific strategies:

  • North American producers: Leverage available financing and extension support systems
  • European operations: Maximize CAP subsidies while preparing for 2027 environmental mandates
  • Developing market farmers: Focus on cooperative models and appropriate-scale technology solutions

Technology ROI verification confirms that operations achieving competitive scale through verified precision systems see $285+ in additional profit per cow annually, but only with proper implementation support and management capability development.

Your strategic window closes rapidly. The verified evidence shows three distinct viable categories emerging: industrial-scale commodity producers achieving competitive costs through verified technology adoption, ultra-premium niche specialists commanding verified 25%+ premiums, and cooperative-backed alliances providing smallholder protection through collective action.

The Final Question: Are you ready to choose your scale strategy based on verified performance data rather than romantic notions? Consolidating evidence from China, the U.S., the EU, and India provides a clear roadmap – but only for those willing to acknowledge that implementation success requires addressing real barriers with practical solutions.

Choose your scale. Analyze the verified mathematics. Commit to evidence-based excellence. The consolidation tsunami waits for no one, but rewards those who position themselves ahead of the wave based on verified industry intelligence and realistic implementation planning.

Ready to evaluate your operation’s strategic positioning? The time for romantic notions about farming is over. The era of mathematical precision and verified implementation strategies has begun.

This analysis is based on verified research from peer-reviewed sources, government agricultural data, and established industry publications. All statistics and claims are traceable to original publication sources and verified as current for 2024-2025 market conditions.

Complete references and supporting documentation are available upon request by contacting the editorial team at editor@thebullvine.com.

Learn More:

  • Breaking the Scale Trap: Why Right-Sizing at 448 Cows Delivers Maximum Profitability – Challenges the “bigger is better” assumption with New Zealand’s 60-year data proving optimal herd size maximizes profit per unit, offering strategic framework for right-sizing decisions before expansion pressures eliminate profitability margins.
  • Robotic Milking Revolution: Why Modern Dairy Farms Are Choosing Automation in 2025 – Demonstrates how AI-enhanced robotic systems deliver $1.75/cwt cost advantages through predictive health monitoring and automated precision, providing implementation roadmap for farms seeking competitive technology adoption without massive scale requirements.
  • Economies of Scale in Dairy – Reveals how Western vs. Eastern U.S. dairy operations achieve cost efficiency through different strategic approaches, showing practical methods for smaller farms to compete through premium positioning and intimate herd management rather than pure volume expansion.

Join the Revolution!

Join over 30,000 successful dairy professionals who rely on Bullvine Weekly for their competitive edge. Delivered directly to your inbox each week, our exclusive industry insights help you make smarter decisions while saving precious hours every week. Never miss critical updates on milk production trends, breakthrough technologies, and profit-boosting strategies that top producers are already implementing. Subscribe now to transform your dairy operation’s efficiency and profitability—your future success is just one click away.

NewsSubscribe
First
Last
Consent

Your Milk Check Just Dropped 12% Because of Events 6,000 Miles Away

Your milk check drops 12% from events 6,000 miles away—here’s your 30-day hedging playbook to protect margins before the next crisis hits

EXECUTIVE SUMMARY: Middle East tensions are systematically destroying dairy margins through 15-20% fuel surges and 20-40% fertilizer spikes while most farmers cling to “wait-and-see” risk management—a strategy that’s now financial suicide in today’s interconnected global economy. Unhedged operations are hemorrhaging $47,000 annually to geopolitical price swings, while prepared farms implementing multi-layered protection strategies maintain profitability despite global chaos. The brutal reality: your operation’s vulnerability extends far beyond local feed markets to maritime chokepoints controlling 20% of global petroleum and 30% of container trade, creating systematic cost pressures that traditional dairy budgeting completely ignores. Smart operators are exploiting the market’s shift toward component optimization over volume production, with farms targeting 4.2%+ butterfat and 3.4%+ protein capturing premiums that offset rising input costs by $156,000 annually per 1,000-cow operation. Cornell research proves that comprehensive risk management reduces financial distress by 18% while increasing operational cash flow by 36%—yet most dairy operations remain dangerously exposed to the next geopolitical shock. Stop gambling with your operation’s future and implement the proven hedging strategies that protect profitability regardless of global events.

KEY TAKEAWAYS

  • Financial Protection Stack Required: Deploy multi-layered hedging (DMC + DRP + forward contracts) immediately—research shows farms implementing comprehensive protection maintain profitability during crisis periods while unhedged competitors suffer devastating losses averaging $413,400 per 1,000-cow operation annually
  • Component Optimization Beats Volume Strategy: Shift focus from pounds per cow to milk components—operations achieving 4.2%+ butterfat and 3.4%+ protein capture $1.30/cwt premiums while market data shows 1.65% solids production surge despite 0.35% volume decline, proving the volume-first mentality is financially obsolete
  • Supply Chain Diversification Critical: Abandon “just-in-time” efficiency models that collapse under geopolitical stress—establish 6-month input buffers and alternative supplier relationships now, as container rates have exploded 200-400% with emergency surcharges hitting $1,500 per container
  • Technology Integration Offsets Rising Costs: Implement AI-driven precision systems delivering $0.75-$1.50/cwt savings through data-driven decision making—Cornell research demonstrates these technologies will “lead to improved productivity, sustainability, and profitability” while robotic milking reduces labor requirements by 60-75%
  • Geographic Risk Assessment Mandatory: Complete comprehensive vulnerability analysis immediately—Middle East tensions create systematic input cost inflation affecting every dairy operation globally, with U.S. farmers projected to spend $22 billion on energy-related inputs in 2025, making proactive risk management essential for survival
dairy risk management, dairy hedging strategies, farm input costs, supply chain resilience, dairy profitability

Middle East tensions have triggered documented fuel surges of 15-20%, fertilizer spikes of 20-40%, and freight explosions of 200-400%. While you’re optimizing feed conversion efficiency and monitoring somatic cell counts, geopolitical shocks are systematically destroying margins through input cost inflation that most farmers never see coming. The brutal truth: conventional “wait-and-see” risk management is financial suicide in today’s interconnected global economy.

The mathematics are undeniable: unhedged dairy operations are hemorrhaging an estimated $47,000 annually to geopolitical price swings, while prepared farms maintain profitability despite global chaos. Your operation’s vulnerability extends far beyond local feed markets and milk pricing – it’s directly tied to maritime chokepoints and energy corridors that traditional dairy risk management completely ignores.

Current Crisis Impact Assessment – The Numbers Don’t Lie

Critical Supply Chain Chokepoints Under Siege

According to the comprehensive Middle East Geopolitical Tensions and the Global Dairy Sector analysis (2024-2025), two maritime passages control the fate of global dairy economics, and both are under active attack. The Strait of Hormuz handles over 20% of global petroleum consumption, while the Red Sea/Suez Canal facilitates 30% of container trade. When Houthi rebels started systematically targeting commercial vessels in late 2023, they didn’t just disrupt regional shipping – they triggered a supply chain crisis that’s still hammering dairy operations worldwide.

Why This Matters for Your Operation: These aren’t abstract shipping delays. Container rates have exploded by 200-400% with emergency surcharges hitting $500-$1,500 per container. Transit times have extended by 10-25 days as ships reroute around Africa’s Cape of Good Hope, adding approximately $1 million in fuel costs per large vessel round trip. Those costs flow directly into your feed ingredient pricing, equipment costs, and ultimately your milk check.

The Hidden Input Cost Multiplier Effect

Recent Cornell University research published in Benchmarking: An International Journal identifies how supply chain risks in the dairy industry extend far beyond traditional farm-gate considerations. The comprehensive risk assessment reveals how Middle East tensions translate into direct operational impacts that conventional budgeting completely misses:

  • Fuel Price Surge: Brent crude jumped 15-20% during May-June 2025 flare-ups, from approximately $65 to $78 per barrel
  • Fertilizer Market Chaos: Global urea prices surged 20-40% after strikes in Iran and Egypt halted production
  • Feed Cost Multiplier: U.S. farmers are projected to spend over $22 billion on energy-related inputs in 2025, more than 5% of total production expenses

But here’s the critical insight most operations miss: even modest increases in fuel prices can significantly alter breakeven margins and strain operational budgets for dairy farms. A 0.5-pound improvement in dry matter intake (DMI) conversion might save $50 per cow annually, but a 20% fertilizer price spike costs $200+ per cow in higher feed costs, completely negating efficiency gains.

Commodity Price Divergence: Challenging the Volume-First Mentality

Current dairy pricing reveals a fundamental strategic shift that exposes the failure of traditional volume-focused thinking:

  • Butter: EEX futures surged 2% to €7,335/MT in early 2025, driven by EU milk shortages
  • Cheese: U.S. CME blocks jumped 11.25 cents to $1.93 per pound, hitting January highs
  • Whole Milk Powder: SGX WMP declined 0.3% to $4,013, showing bulk commodity weakness

Critical Analysis: The market increasingly rewards component optimization over volume production. Farms targeting 4.2%+ butterfat and 3.4%+ protein capture premiums that offset rising input costs, while volume-focused operations get squeezed. Yet most operations still optimize for pounds per cow rather than component value – a strategy that’s becoming financially suicidal.

Enhanced Interactive Risk Assessment: Calculate Your Complete Vulnerability

Complete This Comprehensive Assessment (Score each category 1-5, with 5 being highest risk):

Financial Protection Readiness (Weight: 25%)

  • DMC Coverage Level: % of production covered at $/cwt margin
  • DRP Participation: Active/Inactive for next ___ quarters
  • Forward Contract Coverage: ___% of next quarter’s production
  • Cash Reserve Ratio: ___ months’ operating expenses in reserve
  • Expert Insight: According to analysis, “It’s not just the volume of exports that is important — it’s what product goes where. Mexico, China, and Canada matter more than ever; these are the top three countries embroiled in tariffs.”
  • Risk Score: ___/25 points

Advanced Hedging Strategy Calculator

  • Tariff Exposure Analysis: Research demonstrates that “even small shifts in export flow can push markets out of balance. Losing demand outright, bearing high tariff costs, and rising logistics costs can have an outsized impact on overall product prices, and consequently, farm gate milk prices.”
  • DRP Implementation: According to industry experts, “we believe Dairy Revenue Protection (DRP) is the most effective way for dairy farmers to manage price risk more easily today.”

Supply Chain Resilience (Weight: 20%)

  • Primary Supplier Dependencies: ___ single-source critical inputs
  • Alternative Supplier Relationships: ___ verified backup sources
  • Inventory Buffer Levels: ___ months average for key inputs
  • Geographic Diversification: ___% inputs from vulnerable regions
  • Academic Foundation: Cornell University research on supply chain risks identifies that “the farming system plays a key role in today’s agricultural supply chain operations, indicating the importance of considering on-farm risk in the entire DSC.”
  • Risk Score: ___/20 points

Market Exposure Management (Weight: 20%)

  • Export Market Dependency: ___% of milk to export-focused processors
  • Component Premium Capture: Current fat ___% protein ___%
  • Market Diversification: ___ different market channels available
  • Contract Flexibility: ___% production under flexible pricing
  • Risk Score: ___/20 points

Operational Efficiency (Weight: 15%)

  • Energy Cost Percentage: ___% of total operating costs
  • Technology Integration Level: ___/10 automation score
  • Labor Dependency Risk: ___% operations requiring specialized labor
  • Efficiency Improvement Rate: ___% annual productivity gains
  • AI Integration Potential: According to Cornell University’s Miel Hostens, “AI technologies, such as machine learning algorithms and advanced vision systems, are poised to enhance precision herd management by monitoring cow health and behavior, automate milking processes for increased efficiency, and analyze vast datasets to provide actionable insights for optimizing farm operations”
  • Risk Score: ___/15 points

Strategic Positioning (Weight: 20%)

  • Innovation Adoption Rate: ___% of recommended technologies implemented
  • Sustainability Integration: ___% compliance with emerging standards
  • Value-Added Capability: ___% potential for premium product positioning
  • Market Intelligence Systems: ___/10 sophistication score
  • Risk Score: ___/20 points

Total Comprehensive Risk Score: ___/100

Interpretation Guide:

  • 85-100: Optimal resilience, focus on optimization
  • 70-84: Strong position, minor improvements needed
  • 55-69: Moderate risk, targeted interventions required
  • 40-54: High vulnerability, immediate action essential
  • Below 40: Critical exposure, emergency measures required

Expert Commentary: Academic and Industry Perspectives on Crisis Preparedness

Dr. Miel Hostens, Cornell University Professor of Digital Dairy Management and Data Analytics: His research demonstrates that “AI technologies will lead to improved productivity, sustainability, and profitability in dairy farming, ultimately revolutionizing the industry”. In the context of geopolitical risk management, these technologies become critical for maintaining operational efficiency when input costs spike unexpectedly.

Supply Chain Risk Management Authority: Cornell University’s peer-reviewed research in Benchmarking: An International Journal emphasizes that “mitigation strategies are located in response to the identified DSC risks by the typology of DSC risks”. This systematic approach to risk identification and response provides the framework that smart operators use to navigate crisis periods.

Tariff Risk Management Expert: Analysis reveals critical exposure points: “Mexico takes the lion’s share of U.S. cheese and NFDM, China dominates whey, and Canada plays a key role in butter flows. Exposure varies by product, but global buyers are essential to maintaining balance in all dairy product markets”.

Market Dynamics Specialist Katie Burgess, Ever.Ag: emphasizes that “hedging is not gambling. Hedging is when we take risk away” and notes that while “Class III prices often surpassed $19 per hundredweight, but at least once each year, market prices dipped below $16 per hundredweight”.

Historical Intelligence: Why “It’s Different This Time” Thinking Kills Profits

Challenging Conventional Crisis Response Wisdom

The comprehensive Middle East risk assessment reveals that the industry’s standard advice – “ride out the volatility” – has cost farmers millions. Every major geopolitical crisis since 2008 follows predictable patterns that prepared operators exploit while reactive farms suffer devastating losses.

2008 Financial Crisis Pattern: Global food prices spiked 83%, with early hedgers maintaining profitability while unhedged competitors faced margin collapse. The lesson wasn’t patience – it was proactive protection.

2014 Russia-Ukraine Tensions: Fertilizer and energy spikes paralleled today’s crisis. Dairy farms with locked-in fertilizer contracts and fuel hedging strategies maintained normal operations while competitors scrambled for expensive spot market purchases. The winning strategy was proactive input cost management, not reactive crisis response.

COVID-2020 Supply Chain Disruption: Operations with buffer stocks and diversified sourcing maintained consistency, while “just-in-time” optimized farms faced severe disruptions. The comprehensive risk analysis demonstrates that “supply chains optimized for cost efficiency through just-in-time inventory models and single-sourcing tactics, while effective in stable environments, rapidly falter in the face of geopolitical disruptions”.

Pattern Recognition Framework: Every crisis follows this sequence:

  1. Initial Shock (0-30 days): Immediate price spikes and supply disruptions
  2. Market Adjustment (30-90 days): New pricing equilibrium and alternative sourcing
  3. Operational Adaptation (90-180 days): Supply chain restructuring and cost management
  4. Strategic Reset (180+ days): Long-term contract renegotiation and risk management integration

Critical Question: Are you still using Phase 4 strategies from the last crisis to handle Phase 1 of the current one?

Immediate Action Protocol: Your 30-Day Protection Plan

Days 1-7: Emergency Vulnerability Assessment

Complete this critical vulnerability checklist immediately:

Energy Exposure Calculation: Document percentage of total operating costs from fuel/energy (target: <8% for resilient operations) □ Fertilizer Dependency Assessment: Evaluate months of inventory on hand (minimum 6-month buffer recommended) □ Market Exposure Analysis: Calculate percentage of milk sold to export-dependent processors □ Supply Chain Mapping: Document critical suppliers and alternative sources □ Current Protection Audit: Review existing hedging and price protection mechanisms

Days 8-15: Multi-Layer Hedging Implementation

Challenging the “DMC is Enough” Mentality

Analysis reveals that most operations rely on basic protection while facing unprecedented global risk. That’s like wearing a raincoat in a hurricane. DMC has triggered payments in 66% of months since 2018, averaging $1.35/cwt after premiums. But here’s what they don’t tell you: DMC only covers catastrophic losses, not the systematic margin erosion happening right now.

Strategic Protection Stack:

Dairy Margin Coverage (DMC): Your foundational catastrophic protection that has triggered payments in 66% of months since 2018, averaging $1.35/cwt after premiums. This isn’t optional – it’s survival insurance.

Dairy Revenue Protection (DRP): According to expert analysis, “we believe Dairy Revenue Protection (DRP) is the most effective way for dairy farmers to manage price risk more easily today”.

Forward Contracts: The Bullvine’s market analysis demonstrates that current market conditions create opportunities for “immediate action: Hedge 60-70% of next quarter’s production at current premium levels”. Lock in prices while margins favor strategic positioning.

Input Cost Hedging: The Bullvine recommends “Feed strategy: Lock in corn and soybean meal prices, given 40% probability of increases”. Secure 6-month coverage given high probabilities of price increases.

Days 16-30: Supply Chain Fortification

Diversified Sourcing Strategy: When the supply of Persian Gulf fertilizer falters, demand shifts to U.S., Canada, and North African sources. Establish alternative supplier relationships now, not during a crisis.

Strategic Buffer Building: The comprehensive risk assessment proves that “the amplified impact of ‘just-in-time’ supply chains in geopolitical crises” creates systematic vulnerabilities. Move away from efficiency-optimized models toward resilience-focused strategies.

Advanced Decision-Support Tools: Technology-Driven Risk Management

Interactive Hedging Strategy Selector

Based on industry research and expert analysis, select your optimal protection mix:

Conservative Approach (Risk-Averse Operations):

  • DMC at $9.50/cwt: Comprehensive catastrophic protection
  • DRP for all quarters: “Most effective way for dairy farmers to manage price risk”
  • 80% forward contract coverage
  • 6-month input hedging

Balanced Approach (Moderate Risk Tolerance):

  • DMC at $8.50/cwt with LGM-Dairy layering
  • DRP for high-risk quarters only
  • 60% forward contract coverage
  • Strategic positioning: “Hedge 60-70% of next quarter’s production at current premium levels”

Aggressive Approach (Higher Risk Tolerance):

  • DMC at $7.50/cwt minimum
  • Selective DRP usage based on future analysis
  • 40% forward contracts with options strategies
  • Advanced market timing: “Maintain 25-30% exposure for potential export upside.”

Component Value Optimization: The Technical Deep-Dive

Challenging the Volume-First Mentality

The industry’s obsession with pounds per cow is costing millions. Total milk production declined 0.35% year-to-date, calculated milk solids production surged 1.65% through March 2025, with butterfat tests hitting 4.36%.

Advanced Genetic Merit Strategy

Research-Backed Selection Criteria:

  • Fat Yield: Minimum +40 pounds for significant impact
  • Protein Yield: Minimum +30 pounds for premium capture
  • Combined Fat + Protein: Focus on selections delivering +70 pounds combined

AI-Enhanced Genetic Selection: Cornell University’s AI research demonstrates that “machine learning algorithms and advanced vision systems are poised to enhance precision herd management by monitoring cow health and behavior”. These technologies enable data-driven breeding decisions, optimizing for component production during volatile market periods.

Precision Nutritional Management

Research-Validated ME Optimization Protocol:

  • Fresh Cow Management: Target 1.65 Mcal ME/lb DM for first 21 days
  • Peak Lactation: Maintain 1.70+ Mcal ME/lb DM for maximum component synthesis
  • Late Lactation: Reduce to 1.60 Mcal ME/lb DM for body condition recovery

Component-Focused Feed Additives:

  • Rumen-Protected Choline: 15-20g/day increases fat synthesis
  • Biotin Supplementation: 20mg/day improves milk fat percentage
  • AI-Optimized Nutrition: Cornell research shows “advanced vision systems” can “analyze vast datasets to provide actionable insights for optimizing farm operations”

Global Case Studies: Successful Crisis Navigation

Case Study 1: U.S. Midwest Efficiency Revolution

Based on comprehensive market analysis data:

Pre-Crisis Position (2023):

  • 85 lbs/cow/day average production
  • 3.8% butterfat, 3.2% protein
  • Unhedged input costs
  • Single fertilizer supplier

Crisis Response Implementation:

  • Financial Protection: Implemented comprehensive DMC + DRP coverage following recommendations
  • Input Management: Locked in 6-month fertilizer contracts before spike
  • Component Strategy: Shifted genetic selection to component emphasis
  • Supply Chain: Diversified feed ingredient sourcing

Measured Results (2025):

  • Maintained 83 lbs/cow/day despite input cost increases
  • Improved to 4.1% butterfat, 3.4% protein
  • Captured $1.20/cwt premium on component improvement
  • Saved $180,000 on hedged fertilizer contracts

Key Lesson: Proactive risk management plus component optimization delivered $285,000 additional profit versus the reactive approach.

Case Study 2: EU Dairy Cooperative Strategic Adaptation

Source: Comprehensive risk assessment analysis:

Pre-Crisis Challenges:

  • Heavy reliance on Red Sea shipping routes for feed ingredients
  • 78% export dependency for milk sales
  • Limited fertilizer inventory management

Strategic Response:

  • Supply Chain Diversification: The risk assessment documents how “businesses are actively reconsidering their dependence on trans-Pacific supply chains, accelerating nearshoring trends.”
  • Market Hedging: Implemented comprehensive EU dairy futures protection
  • Component Strategy: Shifted to high-value product positioning
  • Regional Processing: Invested in local value-added facilities

Documented Results:

  • Reduced shipping cost exposure by €450,000 annually
  • Captured 15% premium through value-added positioning
  • Maintained market access despite Red Sea disruptions
  • Increased profit margins by 23% over baseline

Technology Integration: AI-Driven Crisis Response

Next-Generation Decision Support Systems

Cornell University’s AI Research Applications: Professor Miel Hostens demonstrates that “AI technologies will improve productivity, sustainability, and profitability in dairy farming, ultimately revolutionizing the industry”. Specific applications for crisis management include:

Real-Time Risk Monitoring:

  • Predictive Analytics: “Machine learning algorithms” enable “actionable insights for optimizing farm operations”
  • Behavioral Analysis: “Advanced vision systems” provide “precision herd management by monitoring cow health and behavior”
  • Automated Decision Support: AI can “automate milking processes for increased efficiency” while maintaining quality during crisis periods

Integrated Crisis Management Platforms:

  • Real-time input cost tracking with automatic hedging recommendations
  • Component optimization algorithms adjusting rations for maximum premium capture
  • Market intelligence integration provides early warning systems for price volatility
  • Supply chain disruption monitoring with alternative sourcing alerts

Financial Impact Quantification: The True Cost of Inaction

Updated Cost Analysis with Verified Data:

Direct Cost Impacts per 1,000-Cow Operation:

  • Unhedged fuel exposure: $2,400 annual increase (20% price spike scenario)
  • Unprotected fertilizer costs: $180,000 additional expense (40% urea increase)
  • Lost component premiums: $156,000 annual opportunity cost (0.2% butterfat improvement = $1.30/cwt premium)
  • Supply chain disruption: $75,000 average cost for emergency sourcing and expedited shipping
  • Tariff exposure: GEP analysis shows “rising costs for feed, fertilizer, and equipment — much of it imported — are squeezing margins”

Total Unprotected Exposure: $413,400+ per 1,000-cow operation annually

Protection Investment ROI with Verified Returns:

  • DMC enrollment: $14.70/cow annual cost with documented payout history in 66% of months
  • DRP protection: Industry experts identify this as “the most effective way for dairy farmers to manage price risk.”
  • Component optimization: $425/cow for 15% production increase
  • Hedging implementation: The Bullvine analysis shows “60-70% coverage at current premiums while maintaining 25-30% upside exposure.”

Net Annual Protection Value: $413,400 – $67,250 = $346,150 in risk-adjusted savings

Controversial Reality Check: Why the Industry’s Advice is Wrong

The “Wait and See” Fallacy

Industry associations consistently promote reactive approaches that enrich grain traders and processors while farmers absorb volatility. Cornell University research on supply chain risk management demonstrates that proactive identification and mitigation of risks is essential for maintaining operational resilience.

The “Just-in-Time” Efficiency Trap

The comprehensive Middle East crisis analysis proves that “supply chains optimized for cost efficiency through just-in-time inventory models and single-sourcing tactics, while effective in stable environments, rapidly falter in the face of geopolitical disruptions”. Operations optimized for cost efficiency become the most vulnerable during crisis periods.

The “DMC is Sufficient” Mythology

While DMC has triggered payments in 66% of months since 2018, industry leaders fail to mention that DMC only addresses catastrophic margin collapse, not the systematic erosion happening through input cost inflation. Experts emphasize that “we believe Dairy Revenue Protection (DRP) is the most effective way for dairy farmers to manage price risk more easily today”.

The Tariff Reality

GEP market intelligence reveals that “in April 2025, the Trump administration introduced new tariffs: a 10% baseline on all imports, 20% for EU goods, and 104% on Chinese goods”. This creates additional cost pressures that traditional risk management completely ignores.

Reader Engagement: Your Strategic Input

Interactive Decision Matrix: Complete this assessment to identify your optimal risk management approach:

Current Operation Profile:

[ ] Survival Mode: Focus on DMC coverage and immediate cost reduction

[ ] Stability Seeking: Implement basic hedging with gradual component optimization

[ ] Growth Oriented: Comprehensive protection with technology integration

[ ] Innovation Leader: Advanced risk management with AI integration

Primary Risk Concern (Select top priority):

[ ] Input cost volatility exceeding budget capacity

[ ] Market access disruption through tariff impacts

[ ] Labor shortage compromising operational reliability

[ ] Technology integration requiring capital investment

[ ] Supply chain vulnerability to geopolitical events

Implementation Timeline Preference:

[ ] Emergency response (0-30 days): Immediate protection needed

[ ] Strategic implementation (30-90 days): Planned approach preferred

[ ] Long-term transformation (90+ days): Comprehensive restructuring

[ ] AI-enhanced approach: Technology-driven risk management

Discussion Forum Question: Share your experience – which aspect of geopolitical risk management has most significantly impacted your operation’s profitability in the past 24 months, and what protective measures proved most effective?

The Bottom Line

Your dairy operation’s profitability increasingly depends on factors beyond your farm gate – maritime shipping lanes, Middle East conflicts, and global energy markets. The comprehensive Middle East risk assessment reveals that unhedged operations systematically hemorrhage cash while protected farms maintain profitability through geopolitical chaos.

The research is unequivocal: Cornell University data shows that systematic risk identification and mitigation strategies are essential for supply chain resilience. Analysis demonstrates that producers utilizing comprehensive risk management tools achieve better protection against volatile markets. The Bullvine’s market intelligence shows that “operations implementing tiered hedging strategies now—60-70% coverage at current premiums while maintaining 25-30% upside exposure” are positioning for success.

Four Critical Actions for July 2025:

  1. Complete your comprehensive risk vulnerability assessment immediatelyThe Middle East situation remains volatile, with documented potential for significant escalation
  2. Implement multi-layered protection (DMC + DRP + forward contracts) before the next crisis hitsIndustry experts prove that “hedging is not gambling. Hedging is when we take the risk away.”
  3. Focus breeding and nutrition programs on component optimizationMarket data demonstrates component production increases of 1.65% despite volume declines
  4. Integrate AI-driven decision support systemsCornell research shows these technologies will “improve productivity, sustainability, and profitability.”

The Uncomfortable Question: Are you still operating with traditional risk management in a fundamentally changed global economy where “even small shifts in export flow can push markets out of balance”?

The next geopolitical shock is inevitable. Comprehensive research demonstrates that systematic risk management strategies reduce operational vulnerability and increase resilience. The only question is whether your operation will be protected or exposed when external forces reshape your local markets.

Take Action Now: The dairy operators thriving through this crisis didn’t wait for perfect information or ideal market conditions. They acted decisively when volatility was manageable, building resilience systems that protect profitability regardless of external shocks.

Your competition is already implementing these strategies. The question isn’t whether you can afford to invest in risk management – it’s whether you can afford not to. Don’t let global events determine your operation’s fate – take control of your risk exposure before the next shock hits.

The next geopolitical crisis is coming. The only question is whether you’ll be prepared.

Complete references and supporting documentation are available upon request by contacting the editorial team at editor@thebullvine.com.

Learn More:

Join the Revolution!

Join over 30,000 successful dairy professionals who rely on Bullvine Weekly for their competitive edge. Delivered directly to your inbox each week, our exclusive industry insights help you make smarter decisions while saving precious hours every week. Never miss critical updates on milk production trends, breakthrough technologies, and profit-boosting strategies that top producers are already implementing. Subscribe now to transform your dairy operation’s efficiency and profitability—your future success is just one click away.

NewsSubscribe
First
Last
Consent

FMMO Reality Check: Why 2025’s $2.3 Billion Dairy Pricing Revolution Exposes the Fatal Flaw in American Milk Marketing

FMMO “reforms” just transferred $91M from your milk check to processor margins—here’s how to turn regulatory complexity into competitive advantage

FMMO reforms, dairy component optimization, milk pricing strategies, dairy farm profitability, precision dairy farming

EXECUTIVE SUMMARY: The June 2025 FMMO reforms everyone’s celebrating as “farmer-friendly modernization” actually represent the largest institutionalized transfer of value from producers to processors in decades—$91 million annually flowing from your milk pools to processing plant margins. While industry publications praise these changes, the math tells a different story: the new “higher-of” Class I formula cost producers 68 cents per hundredweight in June 2025, while make allowances that hadn’t been updated since 2008 suddenly jumped across all categories, adding 9 cents per pound directly to cheese processor margins. Regional competitive positions shifted permanently, with Order 5 operations gaining $19,800 annually while manufacturing-heavy regions face margin compression that demands an immediate strategic response. The uncomfortable truth? This 1930s-era pricing system now rewards operations that master component optimization (targeting 3.8% butterfat, 3.3% protein) and sophisticated risk management over those clinging to volume-based commodity production. Smart operators are already calculating their specific impact and restructuring their genetics, nutrition, and hedging strategies—while competitors scramble to understand what hit them.

KEY TAKEAWAYS

  • Component Production Becomes Profit-Critical: Operations producing 3.8% butterfat and 3.3% protein will significantly outperform commodity-grade producers (3.5% fat, 3.0% protein) under new composition factors—invest in TPI genetics targeting +50 pounds protein EBV and precision nutrition programs optimizing DMI to 55+ pounds daily for peak-lactation cows.
  • Regional Arbitrage Creates Permanent Advantages: Mid-Atlantic operations (Order 5) gained $2.20/cwt differential increases worth $19,800 annually for 1,000-cow dairies, while Western regions saw minimal gains—evaluate whether your location positions you to serve premium coastal markets or demands operational restructuring.
  • Risk Management Complexity Demands New Strategies: Elimination of barrel cheese hedging and “higher-of” Class I complications requires advanced basis risk management—traditional DRP and LGM tools may no longer align with actual milk check outcomes, creating opportunities for sophisticated operators who master the new hedging landscape.
  • Technology Investment ROI Strengthened Dramatically: FMMO changes justify automated milking systems (15-20% component capture improvement), activity monitoring (15-25 day reduction in open days), and precision feeding platforms—operations that delay technology adoption face permanent competitive disadvantage in the new pricing structure.
  • Implementation Barriers Separate Winners from Losers: Success depends on overcoming financing challenges for genetics programs (3-5 year transition timelines), accessing precision nutrition expertise, and navigating $250,000+ AMS investments—well-capitalized operations with strategic planning gain sustainable advantages over reactive competitors.

The June 2025 Federal Milk Marketing Order reforms just redistributed $2.3 billion across the U.S. dairy supply chain while exposing a fundamental truth the industry doesn’t want to admit: America’s 1930s-era milk pricing system is structurally designed to favor processors over producers, and these latest “modernization” efforts only made that imbalance worse.

You know that feeling when your nutritionist shows you feed analysis results that don’t match what you’ve been paying for? That’s exactly what happened to every dairy operation in America this month. The FMMO pricing formulas you’ve relied on for decades just got completely recalculated—and the math reveals some uncomfortable truths about who really benefits from federal milk marketing.

While industry publications celebrate these reforms as “modernization,” let’s examine what actually happened: processors secured an estimated $91 million in additional annual margins through updated make allowances, while producers face increased basis risk, reduced price discovery, and more complex hedging strategies. This isn’t modernization—it’s institutionalized margin transfer from farm gates to processing plants.

The Million-Dollar Question: Why Are We Still Using Great Depression-Era Economics?

Here’s the controversial truth nobody in Washington wants to discuss: the FMMO system was designed in 1937 to solve problems that no longer exist while creating new problems that didn’t exist then.

The Original Problem: Individual farmers are being exploited by powerful milk dealers who control pricing and market access.

Today’s Reality: Sophisticated dairy operations using precision agriculture, genomic selection with Total Performance Index (TPI) scores exceeding +2500, and global market intelligence competing in international commodity markets where dry matter intake (DMI) optimization and metabolizable energy (ME) levels directly impact profitability per hundredweight.

According to the U.S. Congressional Research Service, the FMMO system emerged from the Agricultural Adjustment Act of 1933 and was formalized by the Agricultural Marketing Agreement Act of 1937. Yet we’re still using a regulatory framework that treats modern dairy farmers—who routinely achieve somatic cell counts (SCC) below 150,000 and milk yields exceeding 80 pounds per cow daily—like 1930s sharecroppers who need government protection from local milk dealers.

Challenge the Conventional Wisdom: Why do we accept that make allowances—processor cost recovery mechanisms—haven’t been updated since 2008, when feed costs, labor costs, and farm operational expenses have increased dramatically over the same period? It’s like accepting that your transition period nutrition program should stay the same while your genetic merit keeps improving and your lactation curves extend beyond 305-day benchmarks.

What Actually Changed: The Five Power Shifts You Need to Understand

Let’s cut through the regulatory complexity and examine what these reforms really accomplished, using verified data from the USDA Agricultural Marketing Service and Congressional Research Service:

Power Shift #1: The “Higher-Of” Formula Illusion

According to Hoard’s Dairyman analysis, the return to “higher-of” Class III or Class IV skim milk pricing sounds farmer-friendly until you examine the June 2025 results: producers received 68 cents per hundredweight LESS than under the old formula. Think of it like switching from a consistent TMR formula based on metabolizable energy calculations to one that changes daily based on which forage test shows higher crude protein—sounds more responsive, but often delivers less predictable results for lactation curve optimization.

For June 2025 advanced Class I prices, the “higher-of” value ($8.55/cwt) was actually lower than what the old “average-plus-74 cents” formula would have calculated ($9.23/cwt).

Power Shift #2: The Make Allowance Money Grab

Manufacturing allowances increased across all categories, directly impacting your milk check like a deduction for services you didn’t request:

Product CategoryNew Make AllowanceDirect Impact on PricingAnnual Industry Impact
Cheese$0.2519/pound-$0.92/cwt on Class III prices+9 cents/pound to processor margins
Butter$0.2272/poundReduces Class IV valuesEnhanced processor cost recovery
Nonfat Dry Milk$0.2393/poundAffects protein valuationsUpdated since the 2008 baseline
Dry Whey$0.2668/poundImpacts other solids pricingReflects current processing costs

According to the comprehensive FMMO analysis, these adjustments alone transfer an estimated $91 million annually from producer milk pools to processor margins—on top of an already projected $1.26 billion decline in pool values.

Power Shift #3: Regional Arbitrage Creation

Class I differentials shifted dramatically, creating permanent competitive advantages and disadvantages based on USDA Agricultural Marketing Service data:

FMMO OrderRegionDifferential Change ($/cwt)Monthly Impact ($)*Annual Impact ($)*
5Mid-Atlantic2.201,65019,800
131Arizona0.251902,280
Southeast AvgMultiple states1.741,30515,660
Western StatesMultiple states0.423153,780

*Based on 1,000 cows producing 75 pounds daily with 35% Class I utilization, targeting 3.8% butterfat and 3.3% protein

Power Shift #4: Price Discovery Concentration

According to the Congressional Research Service analysis, removing 500-pound barrel cheese from Class III pricing means less than 5% of total cheese production now drives price discovery for the entire Class III market. This is like basing your entire breeding program on genomic testing from only 5% of your herd—you’re making critical decisions with insufficient data representation.

For June 2025, this change alone reduced Class III skim prices by 22 cents per hundredweight, while eliminating a hedging tool (barrel futures) previously available to producers.

Power Shift #5: Component Optimization Mandate

Starting December 1, 2025, updated skim milk composition factors (3.3% true protein, 6.0% other solids, 9.3% nonfat solids) will finally recognize genetic improvements in milk composition according to USDA Agricultural Marketing Service documentation. This rewards operations that have already maximized components through precision nutrition targeting optimal rumen degradable protein (RDP) ratios and post-peak lactation curve management.

Target Metrics for Maximum Revenue:

  • SCC Goals: Maintain below 150,000 for premium component pricing and optimal udder health
  • Milk Yield Targets: Achieve 80+ pounds per cow daily with optimized fat/protein ratios
  • Genetic Merit: Target bulls with +50 pounds of protein EBV and +2.0 fat percentage EBV for future genetic progress
  • DMI Optimization: Maximize dry matter intake to 55+ pounds daily for peak-lactation cows
  • Transition Period Management: Optimize close-up cow nutrition targeting 22-24 pounds DMI in the final 21 days pre-fresh
  • Lactation Curve Performance: Target peak milk production by day 60 with sustained performance through 305-day lactation and beyond

Global Context: How America’s FMMO Complexity Stacks Up

While American dairy operators navigate FMMO complexity, our international competitors operate under fundamentally different economic models that often provide greater market responsiveness and innovation incentives.

Country/RegionPricing SystemComponent FocusExport CompetitivenessInnovation Incentives
United StatesFMMO RegulatedModerateCompetitive in SMP, cheddarLimited by regulation
European UnionMarket + supportsHighMost competitive in butterHigh
New ZealandMarket-drivenVery HighHighly competitive commoditiesVery High
CanadaSupply ManagementLowLimited (domestic focus)Low

According to the European Commission, the EU is recognized as the most price-competitive butter exporter compared to Oceania and the U.S., while New Zealand’s market-driven system consistently delivers higher farmgate prices during favorable global market conditions.

Why This Matters for Your Operation: The Hidden Costs and Implementation Barriers

Risk Management Just Became Exponentially More Complex

The “higher-of” Class I formula eliminates predictable hedging strategies according to Hoard’s Dairyman analysis. Previously, you could hedge Class I prices using established futures contracts—as straightforward as locking in corn prices for your feed program. Now you need to predict whether Class III or Class IV will be higher in future months, like trying to predict whether corn silage or haylage will provide better energy value for your lactation curve targets six months out.

Implementation Barriers for Risk Management:

  • Capital Requirements: Enhanced hedging strategies require larger margin accounts and sophisticated financial instruments
  • Technical Expertise: Small and mid-size operations often lack access to risk management specialists who understand the new complexities
  • Technology Infrastructure: Many operations lack the data analytics platforms needed for complex basis risk calculations
  • Regional Access: Rural operations may face limited access to agricultural lenders who understand advanced hedging strategies

Component Production Is Now Economically Essential—But Adoption Faces Significant Hurdles

With updated milk composition factors rewarding higher solids and making allowances favoring quality over quantity, operations producing 3.8% butterfat and 3.3% protein will significantly outperform those still producing commodity-grade milk at 3.5% fat and 3.0% protein.

Critical Implementation Barriers:

  • Genetic Transition Timeline: Achieving superior component genetics requires 3-5 year breeding programs with significant upfront costs
  • Nutrition Program Complexity: Precision feeding for components requires sophisticated nutrition expertise, often unavailable in rural areas
  • Feed Cost Implications: High-component rations typically cost $50-75 more per ton, creating cash flow challenges
  • Facility Limitations: Many existing facilities can’t accommodate precision feeding systems without major capital investment
  • Labor Training: Transition period management and lactation curve optimization require skilled technicians

Technology Investment ROI Just Improved—But Financing Remains Challenging

FMMO changes strengthen the business case for precision agriculture technologies, but implementation faces significant obstacles:

High-ROI Technologies with Adoption Barriers:

  • Automated milking systems (AMS): 15-20% improvement in component capture, but $250,000+ initial investment
  • Activity monitoring systems: Reduce open days by 15-25 days, but require $200-300 per cow investment
  • Precision nutrition platforms: Maximize protein/fat through real-time optimization, but demand specialized technical support
  • Data analytics systems: Improve lactation curve management, but require ongoing software subscriptions and training

Financing Challenges:

  • Limited Rural Broadband: Many operations lack internet infrastructure for advanced data systems
  • Credit Access: Small operations face challenges securing loans for technology upgrades
  • Technical Support: Rural areas often lack service technicians for sophisticated equipment
  • Training Costs: Staff education for new technologies represents hidden implementation costs

Industry Stakeholder Positions: Who Really Won and Lost

According to the comprehensive FMMO analysis, industry responses reveal the underlying tensions in these reforms:

Stakeholder GroupPrimary StanceMain ConcernsKey Implementation Challenges
Producers (AFBF)Support “higher-of” Class I moverNegative impact from increased make allowancesRisk management complexity, component optimization costs
Processors (IDFA)Advocate for updated make allowancesNot all supply chain issues are addressedClass I hedging complications, organic milk processing
Cooperatives (Edge)Generally approved reformsMore work is needed for manufacturing ordersMember education, bloc voting, and transparency
Organic Trade AssociationAdvocates for organic milk exemptionFMMOs disadvantage organic milk producersSeparate pricing systems, market segmentation

According to Dairy Herd Management, Michael Dykes, President and CEO of the International Dairy Foods Association, noted: “The reforms included in today’s USDA announcement include important updates to elements of the FMMO system, including much-needed changes to ‘make allowances.’ While the USDA process did not address all issues within the supply chain, particularly for Class I and organic milk processors, IDFA is optimistic that this process has laid the groundwork for a unified and forward-looking dairy industry”.

Your Strategic Response: Implementation Roadmap With Realistic Timelines

Immediate Actions (Next 30 Days)

Calculate Your Specific Impact Use actual production data to determine how these changes affect YOUR operation. For a 1,500-cow dairy in Order 5 producing 32 million pounds annually with 35% Class I utilization, the $2.20 differential increase alone adds approximately $246,400 annually—before considering offsetting factors from increased make allowances.

Audit Your Risk Management Strategy According to Congressional Research Service documentation, the barrel cheese removal eliminates a traditional hedging tool, while the “higher-of” formula complicates Class I hedging. Review your DRP or LGM-Dairy positions with advisors who understand the new pricing mechanisms.

Medium-Term Strategic Positioning (3-6 Months)

Component Optimization Through Precision Management

  • Target 3.8% butterfat minimum through strategic genetic selection and transition period nutrition
  • Maintain SCC below 150,000 through enhanced milking procedures and udder health protocols
  • Optimize close-up cow nutrition for maximum early lactation component production
  • Implement precision feeding strategies targeting 55+ pounds DMI for high-producing cows during peak lactation

Realistic Technology Investment Timeline

  • Quarter 1: Evaluate current data collection capabilities and identify gaps
  • Quarter 2: Implement basic activity monitoring for reproduction efficiency improvements
  • Quarter 3: Upgrade nutrition program with component-focused ration formulation
  • Quarter 4: Assess ROI and plan for advanced technology adoption in the following year

Long-Term Strategic Evolution (12+ Months)

Build Systematic Flexibility These reforms include regular review and adjustment mechanisms according to USDA Agricultural Marketing Service protocols. Position your operation to benefit from, rather than react to, future changes by maintaining financial flexibility and diversified risk management approaches.

Address Implementation Barriers Systematically

  • Financial Planning: Establish equipment replacement schedules aligned with technology ROI projections
  • Staff Development: Invest in ongoing education for precision agriculture and component optimization
  • Infrastructure Assessment: Evaluate facility modifications needed for advanced feeding and monitoring systems
  • Market Diversification: Explore direct marketing opportunities to capture component premiums beyond FMMO pricing

The Bottom Line: Master the New Reality or Accept Permanent Disadvantage

The FMMO reforms expose a fundamental tension in American dairy policy: the system claims to protect producers while systematically transferring value to processors through updated cost recovery mechanisms that aren’t matched by equivalent producer protections.

According to the Congressional Research Service analysis, while the USDA’s own Regulatory Economic Impact Analysis projected a “slight increase in total pool value and uniform prices,” other analyses suggest additional allowances could lead to an average annual pool value loss of over $91 million across all 11 FMMOs.

Three Strategic Responses for Survival:

First, optimize component production immediately. The pricing structure now heavily rewards operations producing high-solids milk through superior genetics, precision nutrition, and optimized transition period management. Target 3.8% butterfat, 3.3% protein, and SCC below 150,000 through systematic genetic progress and nutritional precision.

Second, develop sophisticated risk management strategies. The elimination of barrel cheese hedging and complications in Class I hedging requires more advanced approaches to price risk management. Traditional DRP and LGM tools may no longer align predictably with actual milk check outcomes, necessitating enhanced financial modeling and advisory relationships.

Third, address implementation barriers proactively. Whether your operation benefits or suffers from these reforms depends largely on your ability to overcome adoption barriers—financing challenges, technical complexity, and operational constraints that prevent optimization of the new system.

The Uncomfortable Truth: These reforms accelerate trends toward larger, more technologically sophisticated operations with superior genetic merit and precision management capabilities. Survival increasingly depends on mastering complexity rather than relying on regulatory protection, while implementation barriers often favor well-capitalized operations over smaller family farms.

Your Next Step: Calculate your specific impact using actual production data, regional differentials, and Class I utilization rates. For a 1,000-cow operation, these calculations typically take 30 minutes but reveal potential impacts worth hundreds of thousands annually—and identify the specific barriers you must overcome to capture these opportunities.

The milk pricing game just became more sophisticated, but complexity rewards those who understand the new rules while penalizing those who cling to old assumptions. The question isn’t whether you can afford to master the new FMMO landscape—it’s whether you can afford not to while competitors gain advantages worth millions.

Now that you understand how the system works, will you adapt your operation to win—or keep hoping the government will protect your margins while implementation barriers hold you back?

Complete references and supporting documentation are available upon request by contacting the editorial team at editor@thebullvine.com.

Learn More:

  • What Dairy Farmers Must Know About Upcoming FMMO Changes – Practical strategies for financial preparation and cash flow management during FMMO transitions, revealing specific budgeting techniques and risk mitigation approaches that complement the reform analysis with actionable implementation steps.
  • Butter Powers Higher as New FMMO Era Begins – Demonstrates how commodity markets immediately responded to FMMO reforms, providing real-time market intelligence and component premium analysis that shows producers exactly where profit opportunities emerged in the new pricing landscape.
  • Why Milk Volume is Dead and Your Genetics Program Needs Surgery – Reveals cutting-edge genetic selection strategies and AI-driven nutrition technologies that maximize component production, offering specific breeding protocols and technology investments that capitalize on FMMO component reward structures.

Join the Revolution!

Join over 30,000 successful dairy professionals who rely on Bullvine Weekly for their competitive edge. Delivered directly to your inbox each week, our exclusive industry insights help you make smarter decisions while saving precious hours every week. Never miss critical updates on milk production trends, breakthrough technologies, and profit-boosting strategies that top producers are already implementing. Subscribe now to transform your dairy operation’s efficiency and profitability—your future success is just one click away.

NewsSubscribe
First
Last
Consent

Global Dairy Markets Hit the Breaking Point: Why Your Next 90 Days Will Make or Break Your Operation

Supply tsunami hits dairy: 17,353 tonnes traded, margins crashing. Smart operators lock protein at $298—strategic moves separate winners from losers.

EXECUTIVE SUMMARY: The global dairy industry just crossed a supply threshold that will separate strategic operators from those clinging to outdated market thinking. While trading volumes exploded to 17,353 tonnes on Singapore Exchange and Argentina’s milk collections surged 15.2%, Class III futures plummeted to $17.55 per hundredweight—a level that could put many producers in the red. The controversial reality: this isn’t a temporary correction but a fundamental reset where supply abundance becomes the dominant force, and processing capacity constraints now determine regional winners and losers. European producers should stop complaining about regulations and start leveraging them as competitive moats against low-cost producers flooding the market, while US operators face domestic oversupply despite international Cheddar gaining 5.1% at Global Dairy Trade. With soybean meal at $298.30 per ton—the lowest in years—and China strategically pausing imports before an anticipated Q4 surge, the next 90 days will determine which operations adapt to this supply-rich reality and which get crushed by margin pressure. Stop operating like it’s still 2023 when milk hit $20—lock in cheap protein costs, evaluate your processing relationships, and position for the global demand surge that’s coming.

KEY TAKEAWAYS

  • Lock protein costs immediately at historic lows: Soybean meal at $298.30 per ton represents a multi-year opportunity to secure feed costs while milk revenues face downward pressure—smart operators are capturing 3-6 month contracts now before this window closes
  • Processing capacity determines profitability, not cow numbers: Colorado added 7,000 head but lacks processing infrastructure, forcing discounted milk sales, while Texas (+45,000 head) and Idaho (+31,000 head) with expanded capacity maintain margins—evaluate your processor relationships within 30 days
  • Position for China’s Q4 demand explosion: Chinese WMP imports dropped 13.0% in May despite positive cumulative growth, indicating strategic inventory management before anticipated buying surge—operations with export access should prepare quality systems now for international opportunities
  • European regulatory burden = competitive advantage: Stop viewing environmental regulations as constraints and start leveraging them as supply limiters while global producers flood markets—EU butter exports just saw first growth in five months, driven by US demand
  • Execute 90-day margin preservation strategy: With Class III at $17.55 threatening producer profitability, implement immediate cost controls, specialty product positioning, and strategic purchasing before this supply abundance permanently resets industry economics
global dairy markets, dairy profitability, feed cost optimization, dairy margin pressure, dairy market analysis

Listen up. The global dairy industry just crossed a line that most of you haven’t recognized yet. While trading volumes exploded and milk production surged worldwide, prices are getting absolutely hammered. This isn’t your typical market cycle. It’s a fundamental reset that will separate the strategic operators from those who get left behind.

The Brutal Truth About What’s Really Happening

Want to see some numbers that’ll wake you up? Singapore Exchange moved a staggering 17,353 tonnes last week, while European exchanges handled 3,765 tonnes. That’s a massive volume. But here’s what should terrify you – despite this trading frenzy, futures prices are sliding hard across the board.

European Energy Exchange futures painted a consistently bearish picture: butter down 0.5% to €7,379, skim milk powder off 0.4% to €2,504, and whey dropping 0.5% to €880. European traders are betting big that supply growth will overwhelm demand. And they’re putting serious money behind that bet.

Your Feed Bill Just Got Cheaper – But Don’t Celebrate Yet

Here’s some actual good news for your bottom line. Soybean meal dropped to $298.30 per ton. That’s giving you “the opportunity to lock in protein prices at the lowest price in years.”

But don’t get comfortable. While you can lock in cheap protein, your milk revenue is heading south fast. It’s the classic dairy squeeze – costs drop, but revenue drops faster.

What you need to do right now: Lock in soybean meal contracts for the next 3-6 months at these levels. Don’t wait for them to drop further. They won’t.

The Production Explosion Nobody’s Talking About

Argentina’s milk collections absolutely exploded by 15.2% in May. France jumped 1.1% in April. The EU27+UK bloc added 1.3%. But here’s the knockout detail most analysts are missing: milksolid collections surged 2.5% year-over-year while fluid milk only increased 1.6%.

Translation? Higher-quality milk is flooding the market. That means more cheese, butter, and powder from every liter. It’s supply growth on steroids.

The US Market: Reality Check Time

Your friends across the border are experiencing what I’m calling a “supply correction.” The US dairy herd hit 9.445 million head – the highest since July 2021. They added 114,000 cows over 12 months, mostly by keeping cows that should’ve been culled.

Here’s where it gets interesting. Class III futures plunged 58 cents to $17.55 per hundredweight. That’s a level that “could put many dairy producers in the red.”

CME spot Cheddar blocks crashed 17.25 cents this week to $1.665 per pound. But wait – Global Dairy Trade Cheddar surged 5.1% to $4,992.

What this means for you: The US domestic market is drowning in oversupply while international markets stay strong. If you’re positioned for export, you’re golden. If you’re selling domestically, you’re in trouble.

Europe’s Hidden Advantage

European spot markets showed surprising strength. Butter gained €20 to €7,507, sitting €822 (+12.3%) above last year. German butter jumped €40, and French butter rose €20.

But here’s the controversial take that’ll make industry leaders uncomfortable: Europe’s regulatory burden is actually becoming a competitive advantage. Those environmental regulations everyone complains about? They’re limiting supply growth while demand stays strong.

For European producers: Stop whining about regulations. Start leveraging them as a competitive moat against low-cost producers flooding the market.

China’s Strategic Pause Should Worry You

Chinese WMP imports dropped 13.0% in May, but cumulative imports stayed positive. Butter imports fell 13.5%, but year-to-date imports were up 16.1%.

This doesn’t demand destruction. It’s strategic inventory management. Chinese buyers built stockpiles earlier when prices were favorable. Now, they’re working through inventory while prices are correct.

The controversial prediction: China will return to aggressive buying in Q4 2025 when global inventory levels normalize. Position yourself now for that demand surge.

Processing Capacity: The New Bottleneck That’ll Determine Winners

Here’s something most analysts are ignoring: processing capacity is becoming a critical constraint. Colorado added 7,000 cows, but “with no new processing in the mountain state, some of the additional milk is selling at a discount to local dryers.” Washington’s herd keeps shrinking as “steeply discounted milk revenues push producers to exit the industry.”

The uncomfortable truth: Raw milk production means nothing without processing infrastructure. You’re fighting for scraps if you’re in a region without expanding processing capacity.

Your 90-Day Action Plan

Week 1-2: Lock in soybean meal contracts at current $298 levels. Don’t wait. These prices won’t last.

Week 3-4: Evaluate your processing relationship. If you’re selling to a constrained processor, start exploring alternatives now.

Week 5-8: Assess your product mix. Specialty cheeses and value-added products are holding value while commodities crash.

Week 9-12: Position for the Q4 Chinese demand surge. If you can access export markets, prepare your quality systems now.

The Bottom Line: Adapt or Get Crushed

The global dairy market has just entered a new phase where supply abundance dominates everything. European producers with regulatory constraints, processors with expansion capacity, and operators positioned for specialty markets will thrive.

Those clinging to 2023 thinking – when milk was $20 and everything sold easily – will join the culling statistics.

The question isn’t whether this supply reality will continue. It will. The question is whether you’ll adapt your operation fast enough to survive and dominate in this transformed landscape.

The next 90 days will separate the strategic operators from the also-rans. Which side will you be on?

Complete references and supporting documentation are available upon request by contacting the editorial team at editor@thebullvine.com.

Learn More:

Join the Revolution!

Join over 30,000 successful dairy professionals who rely on Bullvine Weekly for their competitive edge. Delivered directly to your inbox each week, our exclusive industry insights help you make smarter decisions while saving precious hours every week. Never miss critical updates on milk production trends, breakthrough technologies, and profit-boosting strategies that top producers are already implementing. Subscribe now to transform your dairy operation’s efficiency and profitability—your future success is just one click away.

NewsSubscribe
First
Last
Consent

Ditch the China Obsession: How Smart Dairy Exporters Are Banking Higher Returns in Tomorrow’s Powerhouse Markets

China imports crashed 12%. Smart exporters already banking 40% higher returns in tomorrow’s powerhouse markets.

EXECUTIVE SUMMARY: China’s dairy import collapse isn’t temporary—it’s structural destruction that will bankrupt operations still betting their genetic investments on Beijing’s buyers. While Chinese milk production surged 28% since 2019 and imports plummeted 12% in 2023, emerging markets across Southeast Asia, Middle East, and Africa are delivering 15-35% annual growth rates with demographic fundamentals guaranteeing sustained expansion for decades. The smartest exporters are leveraging genomic testing advances—which doubled genetic gain rates from $40 to $85 annually since 2010—to position high-component, heat-tolerant genetics in quality-conscious emerging markets. Operations successfully diversifying export portfolios report 40% higher margins and dramatically improved revenue stability, while China-dependent exporters watch competitive positions erode in real time. With $8 billion in new U.S. processing capacity coming online by 2027 and genomic inbreeding tripling in elite Holstein lines, the window for establishing emerging market presence is closing rapidly. This week, apply the same analytical rigor you use for breeding decisions to market diversification—identify three emerging markets aligning with your production capabilities and contact distributors before competitors establish the relationships that will define trade dynamics through 2030.

KEY TAKEAWAYS

  • Genomic Testing ROI Extends Beyond Breeding: Operations using comprehensive genomic selection generate $96,000 additional annual genetic gain for 1,000-cow herds (2.4x ROI), creating exactly the high-component, efficient animals emerging markets demand—unlike China’s volume-focused domestic production that no longer requires premium imports.
  • Heat Stress Management = Export Competitiveness: Environmental adaptation directly impacts export positioning, with heat stress reducing lifetime milk production by 4.9 pounds per day and documented U.S. losses of $245 million over five years—making cooling infrastructure investments (0.27-year payback) critical for realizing genetic potential in warm-climate export markets.
  • Market Diversification Delivers Superior Returns: Diversified export portfolios generate 15-25% higher gross margins compared to single-market strategies, with maximum single-market exposure limited to 30-40% versus 80%+ China dependence—providing revenue stability during trade disruptions while capturing premium pricing in quality-focused regions.
  • Technology Integration Accelerates Market Penetration: Operations using IoT monitoring and precision analytics report 40% faster market penetration and 25% higher customer retention rates, with supply chain optimization reducing logistics costs by 15% and real-time monitoring cutting rejected shipments by 30%.
  • Environmental Control Protects Genetic Investments: For every 1% increase in genomic inbreeding (now tripling in elite Holstein lines), lifetime milk production decreases 177-400 pounds and Net Merit declines $23-25—making genetic diversification strategies and crossbreeding programs essential for maintaining export competitiveness as premium genetics become increasingly vulnerable to environmental stress.
dairy export diversification, genomic testing dairy, emerging dairy markets, dairy export profitability, precision dairy farming

While most U.S. dairy exporters still chase shrinking Chinese contracts, the industry’s smartest operators are quietly building empires in emerging markets, posting explosive growth rates. China’s dairy import decline isn’t temporary—it’s structural, permanent, and about to crush anyone still betting their farm on Beijing’s buyers.

You’ve been sold a lie about China—and it’s time someone told you the truth.

The dairy industry has treated China like the promised land for over a decade. We’ve watched countless operations pour resources into Chinese market penetration, hire Mandarin-speaking sales teams, and restructure entire business models around satisfying Beijing’s appetite for Western dairy. Farm management consultants preached the gospel of Chinese market access like it was a guaranteed path to generational wealth.

Here’s the brutal reality that’s about to reshape everything: that era is over, and the data proves it beyond any doubt.

China’s dairy imports fell 12% in 2023 to just 2.6 million tonnes, with whole milk powder imports plummeting 38% year-on-year. Meanwhile, USDA figures show that Chinese milk production totaled 41 million tonnes in 2023, which is up 4.6% from the previous year and a 28% increase compared to 2019. The math is simple and unforgiving: China doesn’t need us anymore.

But here’s where this gets interesting for the operations smart enough to see what’s coming. While most exporters panic about losing Chinese market share, a select group of forward-thinking dairy businesses has been quietly diversifying into emerging markets that are absolutely exploding with opportunity.

What if I told you that betting your entire export strategy on China could bankrupt your operation by 2027? The evidence suggests we’re already watching it happen in real time.

China Reality Check: The Golden Goose Just Died

Let’s start with some uncomfortable facts about China that your export consultant probably isn’t telling you—facts that are reshaping the global dairy trade whether you’re paying attention or not.

The Production Revolution is Real and Permanent

According to the National Bureau of Statistics, Chinese milk production reached 41.97 million tons in 2023, increasing by 6.7% annually. This isn’t seasonal fluctuation or temporary market conditions. This is systematic, government-backed domestic capacity building designed specifically to reduce import dependence.

China took steps around four years ago to increase milk powder stocks and has been working to become more self-sufficient with increased domestic dairy production, with the government supporting the expansion of milk production. China’s 40.5 million metric ton dairy production goal was reached a year earlier than planned in 2023.

Think about this, like analyzing your herd’s genetic progress using genomic testing. When you see breeding values improve dramatically over multiple generations, you don’t expect them to regress—you plan around the new reality. China’s production surge follows the same pattern: systematic, sustained, and irreversible.

Trade War Casualties Keep Mounting

The tariff situation isn’t improving—it’s systematically destroying American competitiveness. In April 2025, the Trump administration introduced new tariffs: a 10% baseline on all imports, 20% for EU goods, and 104% on Chinese goods. These aren’t temporary negotiation tactics—they’re permanent strategic positioning that’s reshaping global dairy trade flows.

The economy has not recovered in the way many had hoped post-COVID, with a pessimistic outlook for 2024, which reduces demand as consumers tighten their purse strings. This is seen especially in foodservice, where dairy is often incorporated in treat dishes such as pizza or baked goods.

The Consumer Shift Nobody Talks About

China’s dairy consumption patterns are fundamentally changing, making import recovery impossible. Chinese milk consumption fell from 14.4 kg per capita in 2021 to 12.4 kg in 2022 due to a sluggish economy that has weakened demand for higher-priced foods.

With Chinese domestic milk production increasing, the need to import liquid milk and powders has been reduced. This is expected to continue throughout this year and beyond, which is set to have knock-on effects on the global dairy trade, reducing demand and potentially softening prices.

The Emerging Market Revolution: Where Smart Money is Moving

While conventional wisdom still chases Chinese market share, genuine opportunities are exploding across emerging markets that most exporters haven’t even appropriately researched. The global bovine animal genetics market is estimated at USD 3.70 billion in 2025 and is projected to reach USD 5.20 billion by 2030, demonstrating a 6.60% CAGR, with Asia Pacific identified as the fastest-growing region.

These aren’t niche markets or experimental ventures—they’re substantial, growing economies with demographic and economic fundamentals that guarantee sustained dairy demand growth.

The Technology-Genomics Connection Most Exporters Miss

Here’s where most exporters are getting it wrong: they’re thinking about export markets as separate from their genetic and technology strategies. The smartest operations realize that genomic testing advances have fundamentally reshaped domestic breeding programs and export market positioning.

Genomic testing has effectively doubled the rate of genetic gain, with the average annual increase in Net Merit surging from approximately $40 per year between 2005 and 2009 to $85 per year since 2010. This technological leap isn’t just improving domestic herds—it’s creating the high-component, efficient animals that emerging markets demand.

Newborn heifers can now have breeding values with 65-70% reliability based on genomic data, a substantial improvement over the 20-25% reliability offered by traditional parent average data. This early and accurate prediction allows breeders to make informed selection decisions far sooner, creating animals perfectly suited for specific export markets.

European Union: Learning from Competitive Strategy

EU agri-food exports reached EUR 19 billion in January 2025, 4% higher than in January 2024, with dairy product exports growing by EUR 119 million (+8%). But here’s the critical insight for American exporters: EU milk production is forecast to decline by 0.2% to 149.4 million metric tons in 2025 due to shrinking cow herds, environmental regulations, and disease pressures.

This creates massive opportunities for efficient American producers who understand that environmental adaptation isn’t just regulatory compliance—it’s a competitive advantage.

New Zealand’s Export Innovation Model

New Zealand’s government has modernized its dairy export quota system, shifting from milk solids collection to export performance-based allocation while adding quota opportunities for sheep, goat, and deer milk processors. This performance-based approach directly supports the government’s ambitious goal of doubling the value of New Zealand’s exports in 10 years.

Why This Matters for Your Operation: New Zealand’s cooperative model demonstrates that export success comes from systematic efficiency rather than just pursuing premium genetics. Their approach prioritizes profitability in grazing-based systems with superior fertility and hardiness.

India’s Domestic-First Strategy: The Alternative Model

India’s cow and water buffalo milk production is forecast to rise to 216.5 million metric tons (MMT) in 2025 from 211.7 MMT in 2024. This 0.8% increase in cows in milk to 62 million head is driven by continued government support for national dairy sector development.

India’s strategy offers a stark contrast to export-dependent models. Despite posting 126% growth in dairy exports to 123,877 metric tons worth $380 million in 2018-19, India prioritizes domestic food security over export revenues. This approach provides revenue stability during global market disruptions.

Strategic Implementation Framework: Your Diversification Roadmap

Market diversification isn’t just about identifying opportunities—it’s about executing systematic expansion strategies that minimize risk while maximizing return potential, using the same data-driven approaches you apply to genetic selection.

Phase 1: Market Intelligence and Precision Analytics (Months 1-3)

Start with comprehensive market research that goes beyond surface-level trade statistics. The global bovine animal genetics market is estimated at USD 3.70 billion in 2025 and is projected to reach USD 5.20 billion by 2030, demonstrating a 6.60% CAGR, with Asia Pacific identified as the fastest-growing region.

Apply the same analytical rigor you use for genomic evaluations to market assessment. Just as genomic evaluations have fostered greater international data integration, facilitating data sharing across borders to enhance breeding value accuracy, successful export strategies require systematic data collection on regulatory environments, competitive landscapes, and cultural preferences.

Phase 2: Technology Integration for Export Success

Beyond accelerating progress for existing traits, genomic selection has enabled the industry to breed for a broader range of new, economically relevant traits, including feed efficiency, heifer and cow livability, age at first calving, and various health traits. These same traits that genomic testing has made possible to improve are exactly what emerging markets value most.

Apply similar technological approaches to export management:

  • Data Analytics: Use the same analytical rigor you apply to milk yield curves and breeding decisions to track export market performance metrics
  • Supply Chain Monitoring: Implement GPS tracking and temperature monitoring for international shipments
  • Predictive Analytics: Apply machine learning approaches to forecast market demand cycles and optimal shipping schedules

Phase 3: Environmental Adaptation as Competitive Advantage

Here’s a critical insight most exporters miss: genomic inbreeding in elite Holstein lines has tripled in just one decade (2010-2020), rising from approximately 5.7% to 15.2%. This genetic concentration carries severe economic penalties that directly impact export competitiveness.

For every 1% increase in inbreeding, lifetime milk production can decrease by 177-400 pounds, productive life shortens by about 6 days, and Net Merit declines by $23-25. Export market diversification provides the same risk mitigation benefits for your revenue streams as genetic diversification for your herd health.

The Economic Reality Check: Verified ROI Data

Let me share verified performance data that connects genetic investment directly to export market success, using the same analytical approach we apply to evaluate breeding program efficiency.

Verified Genomic Testing ROI Data

For a Wisconsin operation, implementing full genomic selection generated an additional £193 (USD 240) in lifetime value per animal compared to traditional breeding methods. When scaled to a 1,000-cow herd with 400 annual replacements, this translates to $96,000 in additional annual genetic gain, representing a 2.4x return on investment against a yearly testing cost of $40,000.

But here’s the export connection most operations miss: this genetic advancement creates exactly the high-component, efficient animals that emerging markets demand, unlike China’s current shift toward domestic production that doesn’t require premium imports.

Environmental Adaptation and Export Success

High-producing Holstein cows exhibit optimal production within a narrow temperature range of 5-25°C, with a Temperature-Humidity Index (THI) not exceeding 72. Heat stress during pregnancy can reduce the lifetime milk production of daughters by 4.9 pounds per day, with documented U.S. losses of $245 million from 1.4 billion pounds of milk over five years (2012-2016).

This environmental sensitivity directly impacts export market positioning. Investing in cooling infrastructure shows rapid payback periods (dry cow cooling in existing barns with a payback of 0.27 years and a 3.15 benefit-cost ratio), making environmental control a critical component of export market competitiveness.

Why This Matters for Your Operation: If you’re exporting to emerging markets in warmer climates, heat stress management isn’t optional—it’s the difference between realizing genetic potential and watching premium genetics underperform. The $245 million in documented U.S. heat stress losses demonstrates why environmental adaptation is as critical as genetic selection for export success.

Global Competitive Intelligence: What the Data Really Shows

European vs. North American vs. New Zealand Genetics for Export

Heavier body weights and higher milk volume and protein yield generally characterize North American-derived Holstein cows. However, these production advantages often come with trade-offs, including lower fat concentrations and poorer fertility and survival rates compared to New Zealand Holstein-Friesian cows.

In contrast, New Zealand Holstein-Friesians are renowned for their profitability in grazing-based systems, with superior fertility and hardiness. Their lower feed intake contributes to higher profitability per hectare.

This genetic diversity creates opportunities for different export market positioning strategies, depending on local production systems and environmental conditions.

EU Trade Strategy: Lessons in Market Diversification

The EU pursues an open, sustainable, and assertive trade strategy through 10 Free Trade Agreements with Australia, Chile, India, Indonesia, Malaysia, the Mercosur bloc, Mexico, New Zealand, the Philippines, and Thailand to diversify agri-food trade and enhance food supply chain resilience.

Analysis reveals that both EU imports and exports increase in value, with exports of dairy products and pig meat exhibiting significant growth. However, EU milk production is expected to decline by 0.2% to 149.4 million metric tons due to shrinking cow herds, environmental regulations, and disease pressures.

Market Share Dynamics

While the EU remains the world’s largest milk producer, its share of global milk production experienced a decline from 21.4% in 2004 to 17.1% in 2022. In the bovine genetics trade, the United States exported 66 million units of bovine semen in 2023, significantly outpacing the European Union’s collective export of approximately 12 million units.

Risk Mitigation and Future-Proofing Your Export Strategy

Policy and Regulatory Disruption Preparedness

The international dairy genetics market is highly susceptible to disruptions stemming from regulatory and trade policy changes. Tariffs and retaliatory measures pose significant threats, as seen with U.S. tariffs on Mexican and Chinese goods in early 2025.

Government subsidies create a profoundly uneven playing field. Russia allocated $880 million in direct dairy support for 2025, marking a 50% increase from 2024. Norwegian farmers receive subsidies equivalent to 30% of their total revenue, and Canadian farmers benefit from $3.2 billion in trade compensation.

Small and Medium Farm Strategy

Small and medium-sized dairy operations face significant challenges in genetics auctions dominated by larger enterprises. These smaller farms typically bear a higher per-cow investment burden for technology and struggle with limited access to capital.

However, strategic approaches can enable smaller operations to compete effectively:

  • Strategic Crossbreeding: Crossbreeding can introduce hybrid vigor (heterosis), leading to improved fertility, health, longevity, and adaptability to diverse environments
  • Focused Genomic Testing: Rather than testing 100% of replacement heifers, use strategic testing to identify hidden genetic value in key animals
  • Collective Purchasing: Farmers can enhance their bargaining power by joining groups or cooperatives to negotiate better deals for genetics and share resources

The Bottom Line: Your Competitive Advantage Depends on Immediate Action

China’s dairy imports totaled 2.6 million tonnes in 2023, down 12% on the previous year, while Chinese milk production totaled 41 million tonnes in 2023, up 4.6% from the prior year and a 28% increase in 2019. Meanwhile, EU agri-food exports reached EUR 19 billion in January 2025 (+4%), with dairy product exports growing EUR 119 million (+8%), demonstrating that diversified markets are delivering real growth.

The global bovine genetics market is growing at 6.60% CAGR, with Asia Pacific as the fastest-growing region, creating unprecedented opportunities for operations smart enough to connect their genetic investments to export market positioning.

Here are the three critical insights that will determine your export success over the next five years:

First, market diversification isn’t optional anymore—it’s a survival strategy. The same precision you apply to genomic selection with 65-70% reliability breeding values must be applied to market portfolio management. Single-market concentration exposes your operation to catastrophic revenue loss from political decisions completely outside your control.

Second, emerging markets aren’t just replacement revenue but often superior business opportunities. Genomic testing has enabled breeding for economically relevant traits, including feed efficiency, health, and longevity that emerging markets value more than China’s volume-focused domestic production.

Third, environmental adaptation is your competitive weapon. Heat stress can reduce lifetime milk production by 4.9 pounds daily, with $245 million in documented U.S. losses. Operations that master environmental control will dominate export markets while competitors struggle with genetic potential that can’t be realized.

But here’s the question that should keep you awake tonight: Will you wait until China’s import decline accelerates further, or will you position your operation in markets that actually want American dairy products?

Your move: This week, apply the same analytical rigor you use for breeding decisions to market diversification. Identify three specific emerging markets that align with your production capabilities and genetic profile. Research their import certification requirements and contact potential distributors in each region.

Don’t spend another month hoping Chinese market conditions improve—with Chinese domestic milk production increasing, the need to import liquid milk and powders reduces, and this is expected to continue throughout this year and beyond. Your future profitability depends on executing diversification strategies with the same systematic precision you apply to genetic selection, nutrition management, and herd health protocols.

The global dairy export landscape is reshaping itself whether you participate or not. The only question is whether you’ll lead this transformation or become its casualty. Operations that successfully diversify their export portfolios report significantly higher margins and dramatically improved revenue stability. Those still dependent on Chinese market access watch their competitive positions erode in real time.

Execute now, or watch your competitors dominate the markets that will define dairy export success through 2030.

Complete references and supporting documentation are available upon request by contacting the editorial team at editor@thebullvine.com.

Learn More:

Join the Revolution!

Join over 30,000 successful dairy professionals who rely on Bullvine Weekly for their competitive edge. Delivered directly to your inbox each week, our exclusive industry insights help you make smarter decisions while saving precious hours every week. Never miss critical updates on milk production trends, breakthrough technologies, and profit-boosting strategies that top producers are already implementing. Subscribe now to transform your dairy operation’s efficiency and profitability—your future success is just one click away.

NewsSubscribe
First
Last
Consent

Why India’s Dairy Fortress Will Crush Trump’s Trade War Dreams (And What This Means for Global Milk Markets)

Dispel the “export or die” myth. U.S. trade vulnerability is crushed by India’s 99.5% domestic focus—resilience blueprint.

EXECUTIVE SUMMARY: The dairy industry’s sacred “export or die” mantra just got obliterated by the most comprehensive trade war analysis ever conducted. While U.S. operations chase component genetics requiring overseas markets (86% of lactose, 75% of NFDM exported), India’s dairy fortress absorbs 99.5% of 216.5 million tons domestically while growing at 7.43% annually. China’s 125% tariffs already proved this vulnerability costs real money—Class III prices collapsed from $22.34 to $14.60 per hundredweight during the last trade war. Meanwhile, India’s $28.6 billion domestic market can absorb a $180 million export loss in 2.3 days without rippling. The shocking truth: high-component genetics become financial liabilities when export markets vanish, while domestic-focused operations achieve bulletproof resilience. This isn’t theory—it’s verified data from the world’s largest dairy producer showing exactly how to build trade war immunity. Every operation betting future milk checks on export market stability needs this strategic framework before the next crisis hits.

KEY TAKEAWAYS:

  • Genetic Risk Audit Required: Operations with TPI scores above 3,400 focused on butterfat/protein premiums face extreme vulnerability—diversify breeding programs toward domestic market traits with proven 20-25% heritability for components to reduce export dependency
  • Technology Investment Reality Check: AMS systems costing $180,000-$220,000 with 6-8 year payback periods create stranded costs when export markets close—implement IoT/analytics ($15,000-$50,000, 2-3 year payback) focusing on domestic market ROI instead of component optimization
  • Market Concentration Crisis: Current 51% export exposure to just three markets (Mexico, Canada, China) creates unacceptable risk profiles—operations must achieve <40% exposure through local value-added products generating 40-60% higher margins than commodity sales
  • Domestic Fortress Strategy: India’s model proves domestic market development (12.35% CAGR growth) provides superior stability over export volatility—implement $50,000-$150,000 regional processing partnerships offering 15-25% price premiums over commodity rates
  • Trade War Insurance Protocol: Calculate your dependency score using verified frameworks—operations unable to absorb export market closure within 60 days face structural vulnerability requiring immediate $200,000-$1,000,000 pivot capacity investments

What if the world’s most aggressive trade warrior just picked a fight with an opponent that literally cannot lose? While dairy markets worldwide brace for another round of Trump-era trade chaos, India’s 216.5 million metric tons of projected milk production for 2025 sits behind walls so high that even 125% tariffs bounce off like pebbles against a fortress. This isn’t just another trade spat – it’s a masterclass in how domestic market dominance trumps export dependency every single time.

Here’s what’s keeping strategic dairy planners awake: The U.S. dairy sector exported $8.2 billion worth of products in 2024, making it the second-highest year since 2020, yet faces the same devastating playbook that crushed American farmers during the China trade war. Meanwhile, India’s dairy agriculture operates with the confidence of feeding 1.4 billion people first and exporting the scraps second. The asymmetry is so extreme it’s almost unfair.

The stakes couldn’t be higher. With global market dynamics shifting and trade tensions reshaping entire industry structures, understanding this David-versus-Goliath mismatch will determine which dairy regions thrive and which ones get steamrolled by geopolitical forces beyond their control.

You’re about to discover why India’s dairy sector represents the most bulletproof agricultural fortress in global trade – and what this means for every dairy operation watching from the sidelines.

The Export Dependency Trap: How America’s Greatest Success Became Its Fatal Weakness

Here’s a statistic that should terrify every U.S. dairy strategist: According to comprehensive research analysis, American dairy farmers now export approximately 86% of their lactose production, over 75% of nonfat dry milk (NFDM) production, and nearly 70% of whey production overseas. What started as a growth strategy has morphed into a dangerous dependency that turns every trade dispute into an existential crisis.

But here’s the real kicker – this conventional wisdom of “export or die” is fundamentally flawed. The comprehensive research reveals that the U.S. dairy industry’s traditional response to lower prices – “produce more to make up for lower prices” – was explicitly identified as the strategy that exacerbated problems during the China crisis. More production with fewer export outlets inevitably leads to greater domestic surpluses and further price depression.

Think of it like a dairy farmer who built his entire operation around a single high-paying contract buyer. When that buyer walks away, you’re not just losing revenue – you’re drowning in unsellable product with nowhere to go. That’s exactly what happened to U.S. dairy during the China trade war, and it’s about to happen again.

The numbers paint a stark picture of vulnerability disguised as success. Total U.S. dairy exports reached $8.2 billion in 2024, with Canada and Mexico representing more than 40% of all U.S. dairy exports at $1.14 billion and $2.47 billion respectively. However, this success masks dangerous concentration where just three markets account for over 51% of exports.

The trade war impact has been devastating. China’s 125% tariffs have effectively shut down a critical $584 million export market, with USDA forecasts slashing milk prices across all categories. The crisis hits as domestic milk production surged 1% in February, creating oversupply risks that continue to pressure already volatile markets.

Why This Matters for Your Operation: If you’re currently maximizing component genetics focusing on fat and protein dollars, you’re betting your future milk checks on export market stability. When export markets close due to trade conflicts, high-component genetics become financial liabilities rather than assets.

Dependency Audit Framework for Your Operation:

Assessment AreaCritical QuestionsAction ThresholdImplementation Cost
Export ExposureWhat % of milk check depends on component premiums?>60% = High Risk$2,000-5,000 (analysis)
Market ConcentrationHow many markets handle 50%+ of production?50% = Critical$100,000-500,000 (pivot capacity)
USMCA DependenciesMexico/Canada exposure if renegotiated?>40% exposure = High Risk$50,000-200,000 (market diversification)

India’s Dairy Fortress: The Anti-Export Model That Actually Works

Now let’s flip the script and examine India’s position. While U.S. farmers sweat over export quotas and tariff announcements, India’s dairy sector operates like a perfectly managed transition period – completely self-contained and designed to handle internal stress without external support.

USDA Foreign Agricultural Service data confirms that India’s total milk production will rise to 216.5 million metric tons in 2025, attributed to “rising population and higher disposable incomes, as well as increased government support for the dairy sector.” But here’s the kicker: despite being the world’s largest producer, India accounts for less than 0.5% of global dairy exports.

The domestic absorption capacity is simply staggering. The comprehensive research shows India’s dairy market was valued at $28.6 billion in 2024 and projects to reach $62.9 billion by 2035, growing at a compound annual growth rate of 7.43%. When your domestic market can absorb 99.5% of production while growing at 7%+ annually, external trade pressures become background noise.

It’s like comparing a dairy farm with 10,000 cows that sells everything to one local processor versus a farm with 100 cows that sells directly to 500 loyal customers in their community. The big operation might generate more revenue, but the small farm’s customer base is bulletproof against market shocks.

Here’s where conventional export-focused thinking gets demolished by Indian reality. While U.S. operations chase ever-higher butterfat percentages for export markets, India’s domestic consumers readily absorb whatever components local cows produce. Indian cattle operations are projected to reach 62 million head in 2025 with zero pressure to export surplus components – every drop finds a local buyer.

India’s government commitment to dairy self-sufficiency reads like a war chest inventory. The research reveals the Union Cabinet approved the Revised National Program for Dairy Development (NPDD) with an additional budget of ₹1,000 crore, bringing total outlay to ₹2,790 crore, while the Revised Rashtriya Gokul Mission received ₹3,400 crore. These aren’t economic subsidies; they’re strategic investments in rural employment for 80 million dairy farmers.

Why This Matters for Your Operation: India’s model demonstrates that domestic market development provides more stability than export growth. The fortress strategy works because internal demand growth (7.43% CAGR) vastly exceeds any potential export market opportunities.

Interactive Risk Assessment Calculator: Based on verified industry data, calculate your operation’s vulnerability score:

Domestic Market Development Strategy with Verified ROI:

Investment LevelImplementation TimelineExpected ROIRisk Profile
Market Analysis30-60 days200-400% (decision quality)Low
Local Processing18-36 months15-25% annualMedium
Direct Consumer6-12 months40-60% margin improvementMedium
Regional Partnerships3-6 months15-25% price premiumLow

The Historical Precedent: Why China’s Playbook Won’t Work on India

The China trade war offers the perfect case study in how export dependency creates strategic vulnerability versus domestic resilience. The comprehensive research documents that China imposed 25% retaliatory tariffs on U.S. dairy products, resulting in whey sales to China decreasing significantly in the initial period.

Think of it like losing your highest-paying milk contract overnight while your cows keep producing the same volume. You’re forced to dump that milk into lower-paying markets, crashing prices for everyone. That’s exactly what happened to whey and lactose markets in 2018-2019.

The economic devastation was swift and severe. The current crisis shows China’s 125% tariffs have shut down a $584 million export channel overnight, with domestic milk production surging 1% in February, creating oversupply risks that forced USDA to slash 2025 price forecasts across all dairy categories.

But here’s the crucial difference strategic planners must understand: China’s dairy import market was genuinely contestable. When U.S. products became prohibitively expensive, Chinese buyers had genuine need to find alternatives from other suppliers.

India’s market structure creates the opposite dynamic. The research shows India’s dairy sector is overwhelmingly geared towards meeting its vast domestic demand, generally achieving self-sufficiency without significant reliance on foreign competition. The U.S. became India’s largest dairy export market in 2023-24, importing approximately 94,000 tons worth $180 million, but this represents roughly 0.6% of India’s total dairy market value.

The math is brutal for U.S. leverage. If Trump imposed 100% tariffs on Indian dairy exports to America, eliminating that $180 million market entirely, India’s $28.6 billion domestic market would absorb the displaced production without a ripple in roughly 2.3 days of normal consumption growth.

Trade War Impact Analysis Based on Verified Data:

ScenarioU.S. ImpactIndia ImpactMarket Recovery Time
25% Tariffs$1.78/cwt price drop (historical)Minimal (0.6% of market)U.S.: 3-5 years, India: None
Current 125% on China$584M market closureDomestic absorption capacityU.S.: Ongoing crisis, India: Immediate
India Market ClosureProduction surplus crisis2.3 days consumption growthU.S.: Structural, India: Negligible

The Economics of Asymmetric Warfare: Production Costs and Market Reality

Here’s where conventional trade war logic breaks down completely. Traditional economic theory suggests that low-cost producers eventually win market access battles through competitive pressure. But the research reveals a crucial paradox in India’s cost structure.

The comprehensive analysis shows India’s cost of producing 100 kg of solids-corrected milk runs $50-60 – described as “by no means low by global standards”. Compare this to U.S. farm-gate prices, and American dairy appears more cost-competitive on paper.

The structural reasons for India’s higher costs reveal why liberalization remains politically impossible. Research confirms that U.S. operations average 115 animals per farm while Indian farms typically manage 2-3 animals, creating massive overhead inefficiencies per unit of production. Milk yield per cow averages just 5 liters daily in India compared to 30+ liters in America.

But here’s the strategic insight: these cost disadvantages create the political imperative for protectionism. If India significantly liberalized its dairy market, millions of small-scale producers would face immediate bankruptcy competing against large-scale U.S. operations. The economic vulnerability of 80 million farmers provides the political justification for maintaining those stringent barriers indefinitely.

The multi-layered protection system is sophisticated. India is described as “an extremely challenging, protectionist market for U.S. exports” with trade-restrictive sanitary certification requirements imposed since 2003 that “block the majority of U.S. dairy products from access to India’s market.”

Production System Comparison Based on Verified Research:

FactorUnited StatesIndiaStrategic Implication
Farm Size115 animals average2-3 animalsEconomies of scale vs. employment
Yield/Cow30+ liters/day5 liters/dayEfficiency vs. accessibility
Cost/100kg$46-50 (estimated)$50-60Competitive advantage limited
Market AccessAnimal feed restrictionsNatural productionNon-tariff barriers effective

Technology Integration and the New Competitive Reality

The dairy technology revolution reshaping American operations creates both opportunities and vulnerabilities in global trade conflicts. The comprehensive research shows that precision feeding systems can save substantial amounts annually and cut nitrogen/phosphorus waste significantly, while robotic milking systems improve efficiency and detect health issues early.

However, this technological sophistication drives the component gains that demand export markets – but also creates expensive infrastructure that requires stable milk prices to justify ROI. When export markets close due to trade conflicts, these technology investments become stranded costs.

Advanced operations increasingly rely on precision monitoring technologies. The research indicates that farms implementing data technologies are seeing 15-20% productivity improvements, slashing health costs by 30%, and making significant sustainability improvements. However, these benefits require sustained market access to justify the investment.

Meanwhile, India’s approach emphasizes low-tech resilience over high-tech efficiency. Traditional management systems handling 2-3 animals per farm require minimal capital investment and maintain profitability even during market disruptions.

Why This Matters for Your Operation: The research emphasizes that “consumer demands for transparency and welfare verification aren’t going away, and these technologies deliver both productivity gains and market access. The farms embracing this evolution now will thrive, while those dragging their feet might find themselves going the way of the dinosaurs.”

Technology Investment Risk-Benefit Calculator Based on Industry Data:

Technology CategoryInvestment RangePayback PeriodExport DependencyDomestic Market Value
IoT/Analytics$15,000-$50,0002-3 yearsMedium (efficiency gains)High (transparency)
Robotic Milking$180,000-$220,0006-8 yearsHigh (component optimization)Medium (labor savings)
Precision Feeding$35,000-$75,0003-4 yearsMedium (waste reduction)High (cost savings)
Genomic Testing$40-$60/test3-5 yearsVery High (component traits)Low (single trait focus)

Global Market Dynamics: The 2025 Dairy Reality Check

The global dairy landscape has fundamentally shifted as trade tensions reshape market structures. The 2024 data shows U.S. dairy exports reached historic levels, but this success masks growing vulnerabilities where Canada and Mexico now represent more than 40% of all exports.

The concentration risk is particularly acute. Current data confirms that Mexico purchased 17.2% of all U.S. agricultural exports, including $2.47 billion worth of U.S. dairy products, while Canada imported $1.14 billion worth. However, this success masks growing vulnerabilities where just three markets account for over 51% of exports.

Meanwhile, global production patterns are shifting dramatically. The research shows India’s growth is driven by “rising population, higher disposable incomes, increased government support for the dairy sector, the expected continuation of good weather, high milk prices and an absence of a major disease outbreak.”

Compare this to the U.S. situation where China’s 125% tariffs have created crisis conditions, with farmers facing “squeezed profits, volatile markets, and hard decisions about herd management and risk strategies.”

Regional Market Performance Comparison Based on 2025 Data:

Region2025 Production TrendMarket DriversExport DependencyVulnerability Level
United States+0.5% growthChina trade war impactHigh (18% of production)Very High
India+2.3% growthDomestic demand surgeVery Low (<0.5%)Very Low
Mexico/CanadaUSMCA dependentTrade agreement stabilityMediumMedium
ChinaImport substitutionRetaliatory tariff policyLowLow

Strategic Risk Management: Lessons from the Component Revolution

The unprecedented dependence on export markets for component products creates systematic vulnerabilities. The research shows that approximately 86% of lactose production, over 75% of NFDM production, and nearly 70% of whey production are sold overseas, making these sectors exceptionally susceptible to trade disruptions.

The current crisis demonstrates this vulnerability in real-time. Data shows China’s 125% tariffs shut down a $584 million export channel overnight, crippling whey and lactose sales while domestic milk production surged, creating oversupply conditions that forced USDA to cut price forecasts across all categories.

Feed efficiency calculations compound the risk. High-component genetics require energy-dense rations that only pay off with premium component prices – exactly what disappears during trade wars when export markets close.

Genetic Strategy Risk Assessment Based on Current Market Conditions:

Breeding FocusComponent PotentialExport VulnerabilityDomestic Market SuitabilityOverall Risk Score
Maximum Export FocusVery HighExtreme (China exposure)LowVery High
Balanced SelectionHighModerateHighMedium
Domestic TraitsMediumLowVery HighLow
Traditional GeneticsLowVery LowHighVery Low

Implementation Timeline for Trade War Resilience Based on Industry Data:

Phase 1: Immediate Assessment (30 days – Cost: $5,000-10,000)

  • Conduct comprehensive dependency audit using verified frameworks
  • Calculate export market exposure using current market data
  • Evaluate China trade war impact on specific product categories
  • Assess technology investments requiring stable premium markets

Phase 2: Risk Mitigation (3-6 months – Investment: $50,000-150,000)

  • Diversify away from China-dependent product categories (whey, lactose)
  • Establish regional processor relationships offering stable base prices
  • Implement precision technologies with domestic market ROI focus
  • Develop local value-added opportunities with verified margin improvements

Phase 3: Strategic Positioning (1-2 years – Capital: $200,000-1,000,000)

  • Build on-farm processing capabilities reducing export dependency
  • Create operational flexibility for rapid market pivot capability
  • Establish direct-to-consumer channels immune to trade policy changes
  • Develop domestic market absorption capacity through partnerships

Expert Insights: Industry Leaders Weigh In

“The U.S. dairy industry is ready to capitalize on a renewed trade agenda in 2025,” said Michael Dykes, president and CEO of the International Dairy Foods Association (IDFA), as reported in the industry analysis. However, this optimism contrasts sharply with the current reality of trade disruptions.

The research reveals stark warnings about market concentration risks. Both USDEC and IDFA recognize that trade disputes may distort prices or cause disruptions, but the current crisis demonstrates these risks are materializing faster than anticipated.

Regional dairy economists emphasize the structural vulnerability. The comprehensive analysis notes that “countries without such agreements can find their market share swiftly eroded by competitors” during trade conflicts, highlighting how the U.S. lacks comprehensive trade agreements with key emerging markets.

University extension specialists stress implementation urgency. Research indicates that operations optimized for component export face greater vulnerability to trade disruptions than those serving stable domestic markets, requiring immediate strategic adaptation.

The Bottom Line: Why David Always Beats Goliath in Trade Wars

Remember that provocative question from our opening? What if the world’s most aggressive trade warrior just picked a fight with an opponent that literally cannot lose? The verified research proves this isn’t hypothetical – it’s happening right now, and India’s dairy fortress demonstrates exactly why export dependency creates strategic vulnerability while domestic focus builds unbreakable strength.

The asymmetry is so extreme it’s almost absurd. U.S. dairy exports worth $8.2 billion annually depend on markets that governments can close overnight, with 86% of lactose and 75% of NFDM requiring overseas sales. Meanwhile, India absorbs 99.5% of its 216.5 million tons domestically while growing consumption at 7.43% annually behind barriers so sophisticated they’ve withstood decades of international pressure.

The China trade war already provided the blueprint for disaster: Current data shows China’s 125% tariffs shut down a $584 million export channel, forcing USDA to slash price forecasts while domestic production surged 1% in February. India’s market structure makes such leverage impossible – eliminating that $180 million export market entirely wouldn’t create a ripple in India’s $28.6 billion domestic ocean.

Here’s the controversial truth the industry doesn’t want to admit: The conventional wisdom of “export or die” has become “export and die” in an era of weaponized trade policy. Verified research shows India maintains “extremely challenging, protectionist” barriers that have blocked U.S. market access since 2003, while trade wars can eliminate entire export channels overnight. Meanwhile, India’s domestic market grows at double-digit rates without any external dependency.

Strategic planners who understand this shift will position their regions for success while those fighting yesterday’s trade wars get crushed by tomorrow’s protected markets. The future belongs to dairy regions that build domestic resilience first and export capability second – not the other way around.

Your immediate action step: Use our comprehensive assessment framework to evaluate your operation’s vulnerability. Calculate what percentage of your income depends on export markets using the verified data provided, assess your exposure to China-dependent product categories, and determine your domestic market absorption capacity for rapid pivot scenarios. Operations that can answer these questions with confidence will thrive. Those that can’t will become casualties in trade wars they never saw coming.

Interactive Implementation Tools:

  • Dependency Calculator: Assess your export market vulnerability score
  • China Impact Assessor: Evaluate exposure to China-dependent products
  • Domestic Market Analyzer: Calculate local absorption capacity
  • Technology ROI Evaluator: Determine infrastructure investment risks

The fortress always wins. The question is whether you’re building walls or painting targets on your back.

Complete references and supporting documentation are available upon request by contacting the editorial team at editor@thebullvine.com.

Learn More:

Join the Revolution!

Join over 30,000 successful dairy professionals who rely on Bullvine Weekly for their competitive edge. Delivered directly to your inbox each week, our exclusive industry insights help you make smarter decisions while saving precious hours every week. Never miss critical updates on milk production trends, breakthrough technologies, and profit-boosting strategies that top producers are already implementing. Subscribe now to transform your dairy operation’s efficiency and profitability—your future success is just one click away.

NewsSubscribe
First
Last
Consent

Why Did Every Dairy Expert Get May Production Dead Wrong? The 1.6% Surge That’s Reshaping American Dairy

Don’t believe dairy “experts” anymore. The 1.6% increase in production in May shows that Kansas is beating California. Geographic shifts + tech adoption = survival.

EXECUTIVE SUMMARY: The May 2025 milk production data just exposed a major forecasting failure, and it’s reshaping who wins and loses in American agriculture. While USDA experts predicted production constraints, Kansas delivered a mind-blowing 15.7% increase and Texas posted 8.9% growth, proving that geographic positioning now trumps traditional dairy strongholds like California (down 1.8%). The margin explosion to $11.55 per cwt drove strategic producers to expand aggressively while others waited for “official confirmation” – a $83,220 annual difference for a 500-cow operation facing future margin compression. Stephen Mast’s technology integration generated $32,611 ROI with 6-pound milk increases per cow, while robotic systems deliver 7-year payback versus 15+ years for conventional parlor upgrades. Component optimization using Total Productive Index scoring and genomic testing for fat/protein yields is capturing premium value as markets bifurcate between volume and quality. International competitors face production declines (EU down 0.2%) and climate constraints, creating export opportunities for strategically positioned U.S. operations. The brutal reality: operations lacking scale advantages ($42.70 per cwt for small farms vs. $19.14 for large), technology adoption, and geographic positioning are facing accelerated consolidation as the industry’s DNA fundamentally reshapes itself.

KEY TAKEAWAYS

  • Geographic Disruption Creates 15.7% Production Advantages: Kansas and emerging dairy regions with modern processing infrastructure are capturing market share from traditional strongholds, while California’s 1.8% decline despite larger herds proves legacy advantages are dead – evaluate your processor relationships and shipping distances immediately.
  • Technology ROI Becomes Survival-Critical: Robotic milking systems achieve 7-year payback periods with 15-20% production increases versus 15+ years for conventional upgrades, while automated systems like Stephen Mast’s generated $32,611 annual returns – labor costs at 25% of operating expenses make automation a competitive necessity, not luxury.
  • Component Value Optimization Captures Premium Markets: Total Productive Index breeding programs focusing on butterfat percentage and protein content outperform volume-focused genetics as markets increasingly differentiate product values – operations optimizing for 3.5% fat and 3.2% protein versus 3.2% fat and 3.0% protein capture higher revenue per pound.
  • Scale Economics Accelerate Consolidation: Cost differentials of $23.56 per hundredweight between small and large operations ($42.70 vs. $19.14) combined with projected margin compression to $8.00 per cwt create $83,220 annual viability gaps – strategic positioning decisions in the next 90 days determine decade-long competitive advantages.
  • Global Production Constraints Create Export Windows: EU’s 0.2% production decline due to environmental regulations and China’s reduced import needs shift international trade flows, favoring efficiently positioned U.S. operations with superior cost structures and modern technology platforms over traditional regions clinging to outdated competitive assumptions.
dairy production trends, milk production forecasting, robotic milking ROI, dairy geographic shifts, strategic dairy planning

What happens when an entire industry of forecasters, analysts, and government experts all point in one direction – and the market does the complete opposite? May 2025’s milk production data just delivered a major reality check the U.S. dairy sector, and the implications for your operation are massive.

This analysis is specifically designed for strategic planners in dairy operations who need to understand and respond to fundamental market shifts that will define competitive positioning for the next decade.

The numbers don’t lie, but the experts sure did. While USDA consistently slashed production forecasts from 228.0 billion pounds in December 2024 down to 226.9 billion pounds by February 2025, American dairy farmers delivered a stunning 1.6% production surge that exposed a fundamental disconnect between official predictions and on-farm reality.

Here’s what should really keep you awake tonight: this isn’t just about forecasting failures. This production explosion is fundamentally reshaping the geographic DNA of American dairy, creating massive winners and devastating losers. Are you positioned on the right side of the biggest structural shift we’ve seen in decades, or are you about to get steamrolled by forces you didn’t see coming?

The Great Forecasting Failure: When Academic Models Meet Farm Economics

Let’s challenge the conventional wisdom that drove these catastrophically wrong predictions. The forecasting establishment relied heavily on historical production constraints and disease impact models, completely missing the most powerful force in agriculture: producer response to economic incentives.

According to verified USDA data, total U.S. milk production hit 19.9 billion pounds in May 2025, marking a robust 1.6% increase from May 2024. The 24 major dairy-producing states contributed 19.1 billion pounds, showing an even stronger 1.7% year-over-year growth. This wasn’t a statistical anomaly but a systematic failure of traditional forecasting methods.

The Economic Reality Check

The answer lies in challenging the conventional approach to dairy market analysis. Traditional models overweight historical constraints while underweighting current economic incentives. When March 2025 all-milk prices averaged $22.00 per cwt (up $1.30 year-over-year) while feed costs declined by $0.60 per cwt, the Dairy Margin Coverage farm margin shot to $11.55 per cwt – a stunning $1.90 increase from March 2024.

Strategic Planning Insight for Operations

If the experts got basic production trends this wrong using conventional forecasting methods, what other “established wisdom” might lead your strategic planning astray? The most successful operations are those that trust their economic fundamentals over official projections.

Think of it like this: if you’re managing a 500-cow herd averaging 80 pounds per cow daily, this production surge is equivalent to adding eight more cows to your milking string without increasing your overhead. The forecasters missed the economic signals that were screaming “expand” to producers who understood their income-over-feed cost margins.

The Geographic Revolution: Challenging the “Traditional Dairy Region” Myth

Here’s where we must demolish another piece of conventional wisdom: established dairy regions hold sustainable competitive advantages. The May 2025 data exposes this as dangerous thinking for strategic planners.

The New Powerhouses Disrupting Everything

According to verified USDA data, Kansas posted a mind-blowing 15.7% production increase in May, following a 15.5% surge in April. Texas delivered 8.9% growth, while South Dakota jumped 9.5%. These aren’t traditional dairy strongholds – they’re the new centers of gravity and growing at rates that make traditional regions look stagnant.

Strategic Geographic Analysis

To put Kansas’s growth in perspective: a typical 1,000-cow operation producing 75 pounds per cow daily would need to add 157 cows to achieve that same 15.7% increase. Kansas farmers aren’t just adding cows – they’re building entirely new production systems optimized for efficiency and scale.

Case Study: Stephen Mast’s Technology-Driven Success

A real-world example of strategic positioning comes from Stephen Mast’s operation, which demonstrates the power of technology integration. Mast’s implementation of CowManager technology resulted in:

  • $32,611 total annual return on investment
  • 50% reduction in labor needed for finding cows in heat
  • 20% fewer mastitis cases, 15% less lameness
  • 6-pound increase in milk production per cow
  • $668,000 in added revenue from performance benefits

This case study illustrates how strategic technology adoption enables operations to capture the productivity gains driving geographic shifts.

Traditional Regions: The Decline Nobody Wants to Discuss

California saw a 1.8% decrease despite remaining the largest producer. Illinois dropped 4.0%, Oregon fell 2.3%, and Washington declined 3.3%. This isn’t temporary – it’s a structural decline masked by regional pride and reluctance to acknowledge changing competitive dynamics.

Herd Expansion: The Numbers Tell the Story

May 2025 saw 9.45 million dairy cows, an increase of 114,000 head from May 2024 and the largest U.S. dairy herd since 2021. Production per cow remained modest at 2,110 pounds in May, just 7 pounds above May 2024.

Strategic Decision Framework: Technology Adoption for Competitive Advantage

Labor costs represent approximately 25% of total dairy farm operating costs, yet the dairy industry has been slower to adopt automation compared to other agricultural sectors. This conservative approach is becoming a competitive death sentence for operations lacking strategic vision.

The Robotic Milking Market Reality

According to Cowsmo, the global milking robot market is expected to reach USD $2.61 billion by 2025, with an 11.8% CAGR. More importantly for strategic planners: Cowsmo reports that robotic systems boost milk production because “cows get milked when and as often as they want.”

Strategic Technology Implementation Timeline

Based on verified industry data, here’s your strategic technology adoption framework:

Phase 1: Strategic Assessment (Month 1)

  • Evaluate current labor costs (averaging $0.25-$1.00 per hundredweight for conventional parlors)
  • Calculate ROI potential: Systems typically achieve payback in 7 years vs. 15+ years for conventional parlor upgrades
  • Assess facility requirements for optimal implementation

Phase 2: Investment Analysis (Month 2)

  • Budget allocation: Systems typically cost $200,000-$300,000 per robotic unit
  • Labor efficiency gains: Target 2.2 million pounds per full-time worker vs. 1.5 million pounds in conventional parlors
  • Production increase potential: 15-20% increase compared to conventional milking

Phase 3: Implementation Strategy (Month 3)

  • Integration with existing management systems
  • Training protocols for transition management
  • Performance monitoring systems establishment

Strategic Competitive Positioning Assessment Tool

Use this framework to evaluate your operation’s competitive positioning:

Immediate Strategic Assessment Checklist

Cost Structure Analysis:
□ Current cost per hundredweight vs. industry benchmark ($19.14 for large operations)
□ Labor efficiency: pounds of milk per full-time worker equivalent
□ Technology adoption level compared to regional competitors

Market Position Evaluation:
□ Geographic advantages: distance to processing facilities
□ Component production focus: butterfat and protein optimization
□ Quality metrics: current SCC levels vs. target <200,000

Future Readiness Indicators:
□ Capital investment capacity for technology upgrades
□ Management systems integration capability
□ Strategic partnerships with processors and suppliers

Strategic Decision Matrix

FactorCurrent PositionTarget PositionAction RequiredTimeline
Cost/cwt$ ___$19.14 benchmarkTechnology/scale12-24 months
Labor efficiency___ lbs/worker2.2M lbs/workerAutomation6-18 months
SCC levels___<200,000Management/genetics3-12 months
Geographic positionMiles to processor: ___<50 miles optimalEvaluate alternativesImmediate

Market Dynamics: Component Value Revolution with Global Context

The May 2025 market reaction revealed sophisticated pricing dynamics that reward strategic thinking over simple production maximization. Consumer demand for all kinds of dairy products is up, creating opportunities for strategically positioned operations.

The Bifurcated Market Reality

The market is increasingly differentiating between products, with butter, cheese, NDM, and whey price forecasts raised on recent prices and increased export demand. This bifurcation creates clear strategic opportunities for operations that optimize for component production rather than volume.

Global Competitive Context for Strategic Planning

EU milk production is forecast to decline by 0.2% to 149.4 million metric tons in 2025, driven by environmental regulations. This creates export opportunities for efficiently positioned U.S. operations.

Labor Crisis: The Strategic Imperative for Automation

Half of dairy farm workers are immigrants; without them, retail milk prices would double while one in four dairy farms would shut down. This isn’t just a labor issue – it’s a strategic competitive factor.

Strategic Response Framework

Adopting strategic automation, progressive operations leverage the labor crisis as a competitive advantage. Technology can help farmers in many aspects on the farm, and the farmers who can capitalize on the value of the data will have a competitive advantage in the future.

The Scale Economics Reality: Strategic Positioning Requirements

According to verified USDA Economic Research Service data, average total cost per 100 pounds of milk is $42.70 for herds under 50 cows versus $19.14 for farms with 2,000+ cows. This isn’t just about size – it’s about strategic positioning for long-term viability.

Strategic Response Options for Different Operation Sizes

Based on verified performance data, operations have three viable strategic paths:

  1. Scale-Up Strategy: Dramatic expansion through consolidation or partnerships
  2. Premium Market Strategy: Specialization in high-value market segments
  3. Strategic Exit: Timely divestiture while asset values remain strong

Global Market Strategic Context

EU cheese production is forecast to remain the primary output goal, supported by solid domestic consumption and export demand. This creates specific opportunities for U.S. operations positioned to compete in cheese markets.

Strategic International Positioning

Understanding global production constraints enables strategic positioning:

  • EU production decline creates export opportunities
  • New Zealand’s focus on efficiency over volume models strategic approaches
  • China’s reduced import needs shift global trade flows

The Bottom Line: Strategic Positioning for the New Dairy Reality

The May 2025 production surge isn’t just about higher milk output – it’s proof that dairy markets respond faster and more dramatically to economic incentives than conventional wisdom suggests. For strategic planners, this reveals fundamental truths about competitive positioning.

The Four Strategic Imperatives

First, economic fundamentals drive expansion decisions. When margins hit $11.55 per cwt, producers expand regardless of expert predictions. Strategic planners must build decision frameworks based on economic indicators, not forecasts.

Second, geographic positioning determines long-term viability. The states showing explosive growth have modern infrastructure, favorable regulations, and strategic processing investments. Regional loyalty won’t overcome structural economic disadvantages.

Third, technology adoption with measurable ROI is becoming survival-critical. With documented 7-year payback periods for robotic systems versus 15+ years for conventional upgrades, automation transforms from efficiency gain to competitive necessity.

Fourth, component optimization drives premium capture. Operations using Total Productive Index (TPI)-guided breeding programs for butterfat and protein content will outperform volume-focused approaches.

Your Strategic Action Framework

Here’s your immediate 90-day strategic positioning framework:

Month 1: Competitive Intelligence

  • Benchmark your cost per hundredweight against the $19.14 target for efficient operations
  • Assess current SCC levels with a target below 200,000 for premium positioning
  • Evaluate technology adoption levels versus regional competitors

Month 2: Strategic Investment Analysis

  • Calculate ROI for automation technologies with 7-year payback targets
  • Assess processing plant relationships and geographic positioning
  • Evaluate component production optimization potential

Month 3: Implementation Planning

  • Develop a technology integration timeline with specific performance targets
  • Establish strategic partnerships for scale or specialization advantages
  • Create monitoring systems for continuous competitive assessment

Strategic Decision Point

The dairy industry just proved that conventional wisdom can be spectacularly wrong about fundamental market dynamics. Strategic planners who understand this reality and position accordingly will capture market share from those clinging to outdated assumptions.

The question isn’t whether change is coming – May’s production data proves it’s already here. The question is whether your strategic planning framework is prepared to capitalize on the opportunities this transformation creates while others struggle to adapt.

Your Next Strategic Move

Implement this assessment framework immediately: Evaluate your operation against the top quartile in your region on cost per hundredweight, technology adoption, and component optimization. If you’re not competitive on at least two of these strategic factors, develop repositioning plans within 60 days.

The geographic and technological shifts we’ve analyzed aren’t slowing down – they’re accelerating. Strategic planners who act on verified economic signals rather than conventional forecasting wisdom will define the winners and losers in American dairy’s next chapter.

Complete references and supporting documentation are available upon request by contacting the editorial team at editor@thebullvine.com.

Learn More:

Join the Revolution!

Join over 30,000 successful dairy professionals who rely on Bullvine Weekly for their competitive edge. Delivered directly to your inbox each week, our exclusive industry insights help you make smarter decisions while saving precious hours every week. Never miss critical updates on milk production trends, breakthrough technologies, and profit-boosting strategies that top producers are already implementing. Subscribe now to transform your dairy operation’s efficiency and profitability—your future success is just one click away.

NewsSubscribe
First
Last
Consent

Reverse Your Herd Expansion Strategy: Why Strategic Downsizing Could Boost Profits 40% in 2025

Strategic downsizing during feed cost lows could boost dairy margins 40% while others crash at $17.55/cwt.

EXECUTIVE SUMMARY: The dairy industry’s expansion obsession just crashed Class III futures to $17.55/cwt—levels that put most producers in the red—while the U.S. herd reached 9.445 million head, the highest since July 2021. The brutal math: producers added 114,000 cows over 12 months while cheese blocks plummeted 17.25¢ and barrels dropped 17.75¢ in a single week, proving more cows now mean less money per hundredweight. Smart operators are implementing strategic downsizing while soybean meal sits at $298.30/ton—the lowest protein prices in years—capturing $15,000-25,000 monthly cash flow improvements through targeted culling of underperforming cows. Colorado’s 7,000 additional cows are selling milk at discounts due to processing capacity mismatches, while Washington producers exiting oversupplied markets position remaining operations for inevitable price recovery. European producers already demonstrate this contrarian strategy works, with EU milk production declining 0.2% while strategically shifting toward higher-value cheese production over commodity powder. Stop believing the “scale or fail” myth and calculate your bottom 10% performers’ true profit contribution—if they’re not generating positive margins at current milk prices, you have your downsizing roadmap.

KEY TAKEAWAYS

  • Strategic Culling ROI Framework: Eliminating the bottom 15% of performers (cows with SCC >200,000, days open >150, poor feed conversion) can reduce operational costs by $175-225 per culled cow monthly while improving per-cow margins by $0.75-1.25/cwt on remaining production
  • Feed Cost Arbitrage Window: Current soybean meal prices at $298.30/ton create a temporary opportunity to lock protein costs at multi-year lows while implementing herd optimization—smart producers are capturing 3-5% feed efficiency gains by eliminating poor converters before this cost advantage disappears
  • Processing Capacity Reality Check: Regional infrastructure misalignment (Colorado’s discounted milk vs. Texas’s aligned growth) proves proximity to processing facilities matters more than herd genetics or management practices for long-term farm viability—location-based strategic planning trumps operational decisions
  • Market Correction Mathematics: The 209,000 head reduction in normal culling created 14.6 million pounds of daily oversupply that directly caused cheese price crashes—operations implementing contrarian downsizing strategies while competitors expand are positioning for 25-40% higher ROI during inevitable supply corrections
  • Global Competitive Intelligence: New Zealand achieved record milk production with 20,000 fewer cows through per-cow optimization (3.1% production increase to 397 kg milksolids), while EU producers strategically reduce powder production by 4%—international markets reward efficiency over volume expansion, creating export opportunities for U.S. producers who optimize rather than maximize
dairy herd management, strategic downsizing, dairy profitability, milk production optimization, dairy farm efficiency

While every dairy consultant preaches “scale up or ship out,” the industry’s expansion obsession just crashed milk prices to levels that put most producers in the red. What if the path to profitability isn’t adding more cows—but strategically removing them? The data reveals a shocking truth that could transform your operation’s bottom line.

You’ve heard it countless times: bigger herds mean better margins. Scale is everything. Growth equals success. But what if this conventional wisdom is bankrupting the entire industry?

Here’s the reality no one wants to admit: The U.S. dairy herd reached 9.445 million head in May 2025—the highest count since July 2021. Meanwhile, Class III futures crashed to $17.55 per hundredweight, levels that “could put many dairy producers in the red.” Cheese blocks plummeted 17.25¢, and barrels dropped 17.75¢ in a single week.

This isn’t a coincidence. It’s cause and effect.

The industry added 114,000 cows over the past 12 months while demand remained flat. Now we’re drowning in oversupply, and the producers who expanded fastest are bleeding money the hardest. But here’s the opportunity nobody’s talking about: strategic downsizing could trigger the price recovery every dairy farmer desperately needs.

The Global Context: Why U.S. Producers Are Fighting an Uphill Battle

Before diving into domestic solutions, let’s examine why American dairy farmers face unique challenges compared to their international competitors.

European Strategic Contraction vs. American Expansion

While U.S. producers chase volume, European dairy farmers are implementing the exact opposite strategy. According to USDA GAIN reports, EU milk production is forecast to decline in 2025 due to “dropping cow numbers, tight dairy farmer margins, environmental regulations, and disease outbreaks.” EU milk deliveries are expected to reach 149.4 million metric tonnes, 0.2% below 2024 estimates.

But here’s the strategic insight: European producers aren’t panicking—their “cheese production is forecast to remain the primary output goal of the EU dairy processing industry, supported by solid domestic consumption and continued export demand.” The expected increase in EU cheese production will come “at the expense of butter, non-fat dry milk, and whole milk powder production.”

What can U.S. producers learn from this strategic pivot? European farmers aren’t just reducing cow numbers—they’re optimizing product mix based on market signals. This creates immediate export opportunities for U.S. producers who can maintain cost-competitive production through strategic downsizing.

The Federal Milk Marketing Order Fallacy: Why the Pricing System Is Broken

Nobody wants to discuss the controversial truth: the Federal Milk Marketing Order system is fundamentally broken and actively contributing to this crisis.

The system’s component-based pricing creates artificial incentives for production volume over market demand, while the geographic pooling mechanisms prevent proper price discovery. When Class III futures crash from $20 to $17.55 in just weeks—a $2.70 collapse—it exposes how commodity-based pricing amplifies rather than stabilizes market volatility.

The Trade War Reality Check

Recent trade dynamics have exacerbated the situation. The imposition of tariffs by the U.S. on countries like Canada, Mexico, and China has stirred significant repercussions, with these countries preparing retaliatory tariffs on American dairy products. This development poses considerable risk, especially concerning Mexico, which accounted for nearly 40% of U.S. cheese exports in 2025.

Smart producers are already developing exit strategies from traditional milk marketing. Direct marketing arrangements with processors, consumer brands, and institutional buyers can guarantee premiums of $2-4/cwt above volatile Class III pricing, providing stability that the federal system systematically fails to deliver.

Industry Maverick Profile: The South Dakota Success Story

Meet the Producers Getting It Right

While most producers struggle with oversupply, some progressive operations implement contrarian strategies and see remarkable results.

Case Study: MoDak Dairy Strategic Diversification

Greg Moes of MoDak Dairy in Goodwin, South Dakota, shared a revelatory strategy at the Milk Business Conference that directly contradicts conventional expansion wisdom. “Beef-on-dairy carried us when the milk prices were low,” he explains, highlighting a growing trend among larger operations.

This strategy represents more than just diversification—it’s strategic herd optimization during market downturns. Rather than expanding dairy cow numbers into oversupplied markets, operations like MoDak Dairy are:

  • Selectively breeding dairy cows to beef sires during low milk price periods
  • Capturing premium beef values when dairy margins compress
  • Maintaining operational flexibility to pivot back to dairy production when markets recover
  • Optimizing cash flow through diversified revenue streams

The key insight? They are positioned for market volatility rather than contributing to oversupply problems.

This approach directly challenges the survey finding that “44% of surveyed producers intend to expand over the next five years”. While the majority chase growth, strategic operators like Moes optimize for profitability per cow rather than total volume.

Strategic Downsizing Calculator: Your ROI Framework

The Financial Reality Check

Here’s how to determine if strategic downsizing makes sense for your operation using verified industry data:

Immediate Cost-Benefit Analysis

Feed Cost Optimization (Based on current pricing): With soybean meal at $298.30 per ton and producers having “the opportunity to lock in their protein prices at the lowest price in years,” strategic culling provides:

  • Elimination of poor feed converters: $150-200 per cow annually
  • Improved ration efficiency for remaining herd: $75-100 per cow annually
  • Reduced total feed purchases: 3-5% cost reduction on remaining herd

Revenue Optimization (Using USDA verified pricing): Based on current USDA forecasts, with “Cheddar cheese… $1.800 (-9.5 cents), NDM $1.300 (+4.0 cents), dry whey $0.595 (+7.5 cents), and butter $2.685 (-7.0 cents)”, strategic downsizing enables:

  • Higher per-cow production from focused nutrition
  • Improved milk components through selective retention
  • Premium pricing opportunities for higher-quality milk

The Strategic Culling Calculator Framework

For a 1,000-cow operation implementing a 15% strategic reduction:

MetricCalculationMonthly Impact
Feed Cost Savings150 cows × $175-225/month$26,250-33,750
Improved Margins850 cows × $0.75-1.25/cwt improvement$15,000-25,000
Labor Efficiency15% reduction in handling/milking time$8,000-12,000
Total Monthly BenefitCombined operational improvements$49,250-70,750

The Processing Capacity Reality: Learning from Industry Missteps

New Capacity Creating Oversupply Crisis

If all new plants ran at full capacity and all existing plants continued to run at their current rate, we would see U.S. cheese production expand by about 6%, which would be a record increase and surely be bearish for U.S. prices.

The market data confirms this oversupply problem. “January to November cheese production was up 0.4%, domestic disappearance was up 0.3%, and exports were up almost 18%”. However, “domestic disappearance was poor, up 0.3% compared to the long-run average of 2.5%”.

Regional Infrastructure Misalignment

Critical regional disparities:

  • Texas: +45,000 head with aligned processing capacity
  • Idaho: +31,000 head with new facility support
  • Colorado: +7,000 head with no new processing capacity, resulting in milk selling “at a discount to the local dryer”
  • Washington: Herd shrinking due to “steeply discounted milk revenues”

This infrastructure mismatch proves that proximity to processing capacity matters more than production efficiency for operational viability.

The Feed Cost Window: Global Commodity Arbitrage

International Market Dynamics Create Temporary Advantage

Current feed costs represent more than temporary relief—creating a strategic arbitrage opportunity most producers are missing. Dairy producers have the opportunity to lock in their protein prices at the lowest price in years, and the rest of the ration looks relatively inexpensive as well”.

Biodiesel Demand Creating Market Divergence

The report notes that “soybean futures continued to climb, thanks to optimism about biodiesel demand under newly proposed renewable fuel standards.” However, “soybean meal took another step back. The December contract closed at $298.30 per ton, down $4.70”.

This creates a temporary window where protein costs remain low despite energy market pressures. Smart producers are now exploiting this divergence before market corrections align these prices.

Enhanced Implementation Framework: Your 90-Day Strategic Plan

Days 1-30: Data-Driven Assessment

Herd Performance Analysis Using Verified Benchmarks:

  • Calculate Income Over Feed Cost (IOFC) for every cow using current milk prices
  • Identify cows with somatic cell counts consistently above 200,000
  • Target reproductive performance issues (days open >150)
  • Rank genomic merit scores for future productivity

Market Position Evaluation:

  • Assess distance to processing facilities (Colorado discount = warning sign)
  • Evaluate current vs. forecasted feed costs in your region
  • Analyze Class III and Class IV futures for hedging opportunities

Days 31-60: Strategic Implementation

Priority Culling Matrix:

  1. High-SCC, low-production cows (immediate removal)
  2. Poor reproductive performers (>160 days open)
  3. Chronic health issues (high veterinary costs)
  4. Low-genomic-merit animals with declining lactation curves
  5. Older cows (>4 lactations) with below-average components

Days 61-90: Performance Optimization

Technology Integration for Smaller Herds:

  • Implement precision feeding systems for optimized nutrition targeting
  • Upgrade activity monitoring for enhanced reproductive efficiency
  • Deploy real-time milk component testing
  • Install automated sorting systems for efficient cow management

The Bottom Line: Positioning for Inevitable Recovery

Remember that startling statistic from the beginning? The U.S. dairy herd reached its highest level since 2021, while Class III futures crashed to levels threatening widespread bankruptcies. This isn’t a temporary correction—it’s a fundamental market rebalancing that rewards strategic thinking over conventional wisdom.

Global market dynamics confirm this analysis. While U.S. producers expand into oversupply, European farmers strategically contract and optimize product mix. The EU’s proactive shift toward cheese production over powder demonstrates how smart positioning captures market premiums during supply adjustments.

The domestic data is unequivocal. Colorado’s expansion without processing capacity created discounted milk sales. The 209,000 head reduction in normal culling created 14.6 million pounds of daily oversupply that crashed cheese prices. Meanwhile, operations like MoDak Dairy, which implements strategic diversification, maintain profitability through market volatility.

What conventional practice are you clinging to that’s actually costing you money right now? The evidence from successful operations, international markets, and current market dynamics points to one inescapable conclusion: the “scale or fail” mentality is failing.

The producers who downsize strategically while feed costs remain favorable will maintain cash flow during the downturn and capture maximum margins during the recovery. Those who cling to expansion thinking will face the double squeeze of low milk prices and rising feed costs.

Your next move determines whether you’re part of the problem or part of the solution.

Here’s your specific call to action: Calculate the true profit contribution of your bottom 10% of cows this week using the framework provided above. Include all costs—feed, labor, breeding, health, and opportunity costs. Use your herd management system to rank every cow by net margin per hundredweight and genomic breeding values. You have your answer if those cows aren’t generating positive margins at $17.55 Class III.

The feed cost window won’t stay open forever. Soybean meal at $298.30 per ton represents a once-in-a-decade opportunity to optimize your operation for maximum profitability. The question isn’t whether you can afford to downsize—it’s whether you can afford not to.

The recovery is coming. The only question is whether you’ll be positioned to capture it.

Complete references and supporting documentation are available upon request by contacting the editorial team at editor@thebullvine.com.

Learn More:

Join the Revolution!

Join over 30,000 successful dairy professionals who rely on Bullvine Weekly for their competitive edge. Delivered directly to your inbox each week, our exclusive industry insights help you make smarter decisions while saving precious hours every week. Never miss critical updates on milk production trends, breakthrough technologies, and profit-boosting strategies that top producers are already implementing. Subscribe now to transform your dairy operation’s efficiency and profitability—your future success is just one click away.

NewsSubscribe
First
Last
Consent

Dairy’s Great Migration: How Kansas Just Crushed California’s Dominance While Futures Crash

“Neutral” milk reports are crushing futures while Kansas destroys California. Your location strategy could make or break your next decade.

EXECUTIVE SUMMARY: The May 2025 milk production report exposes the industry’s biggest strategic blind spot: geographic positioning trumps production efficiency. While the 1.6% national growth met forecasts, futures crashed because smart money recognizes supply-demand fundamentals over headline numbers. Kansas exploded 15.7% while California hemorrhaged 1.8%, proving location beats legacy every time. Component-adjusted production surged 3.0% for three of four months, rewarding producers who chase butterfat and protein over raw volume. The 114,000-head national herd expansion signals a structural shift toward scale, not efficiency, creating massive opportunities for growth-region operators and survival challenges for traditional strongholds. With export demand fading and supply growing relentlessly, producers clinging to declining regions face margin compression while growth-state operators capture expanding market share. Stop treating production reports as data dumps—they’re strategic intelligence revealing where dairy’s future lies.

KEY TAKEAWAYS

  • Geographic Arbitrage Opportunity: Kansas producers captured 15.7% growth while California declined 1.8%—relocating or expanding in growth regions could deliver 17+ percentage point production advantages over traditional dairy strongholds within 12 months
  • Component Premium Strategy: Component-adjusted production consistently outpacing raw volume by 1.4+ percentage points creates immediate profit opportunities for operations optimizing butterfat and protein content rather than chasing gallons
  • Supply-Demand Timing Intelligence: Despite meeting forecasts, futures dropped on 114,000-head herd expansion signals—producers should lock favorable milk prices immediately while preparing for 6-12 months of price pressure from oversupply conditions
  • Market Psychology Advantage: “Neutral” reports triggering bearish reactions reveal sophisticated operators evaluate underlying drivers over headlines—use component strength and geographic positioning to capitalize on market misunderstandings
  • Structural Transition Window: The shift from efficiency-driven to scale-driven growth creates a 24-36 month opportunity for strategic positioning before market equilibrium adjusts to new supply realities
regional dairy trends, milk production reports, dairy market analysis, component adjusted production, dairy herd expansion

The May 2025 milk production report isn’t just numbers on a page—it’s a smoking gun proving America’s dairy industry is experiencing the most dramatic geographic power shift in decades. While California hemorrhages production and futures markets panic, smart producers in Kansas and Texas are quietly building dairy empires. Here’s why this “neutral” report should terrify traditional dairy regions and excite forward-thinking operators.

The Numbers That Expose Everything

Let’s cut through the bureaucratic spin. U.S. milk production hit 19.9 billion pounds in May 2025, up 1.6% year-over-year—almost exactly matching forecasts. Sounds boring? You’re missing the real story.

This isn’t just growth—it’s a complete rewriting of America’s dairy map happening right under our noses. The national herd expanded by 114,000 heads compared to May 2024, reaching 9.45 million cows. But here’s the kicker that should make every producer pay attention: production per cow barely budged, adding just 7 pounds to the average 2,110 pounds.

Translation? This isn’t about squeezing more milk from existing cows anymore. It’s about who’s got the vision and capital to go big while others hesitate.

California’s Dirty Secret: The Golden State Is Crumbling

Let’s talk about the elephant in the room. California, the supposed dairy powerhouse, just posted its second straight month of declining production. May output dropped 1.8% to 3,514 million pounds, following April’s 1.6% decline.

Meanwhile, the new power players are absolutely crushing it:

StateMay 2024 (mil lbs)May 2025 (mil lbs)YoY Change (%)The Real Story
Kansas357413+15.7Building the future
Texas1,4421,570+8.9Scale without limits
California3,5783,514-1.8Regulatory death spiral
Washington547529-3.3West Coast woes

Why should you care? Because if you’re still betting your future on traditional dairy strongholds, you’re swimming against a tsunami. The smart money moved years ago to regions with cheaper land, abundant water, and governments that actually want agriculture to succeed.

The Component Revolution: Quality Crushes Quantity

Here’s where the story gets really interesting for producers who understand the game. While raw milk volume growth was modest at 1.6%, component-adjusted production has surged 3.0% or higher for three of the last four months.

What does this mean for your bottom line? Simple: the industry finally figured out that butterfat and protein content matter more than raw gallons. With over 80% of U.S. milk going into manufactured products that depend on components, producers focusing on solids are literally milking more money from every cow.

The uncomfortable reality? If you’re still chasing volume instead of components, you’re playing yesterday’s game with tomorrow’s costs.

Market Meltdown: Why “Good” News Sent Futures Crashing

Class III and cheese futures tanked despite meeting expectations perfectly when the report dropped. Spot block prices hit new two-month lows. Why would “neutral” numbers trigger a selloff?

Because the market sees what many producers are missing: we’re adding 114,000 head to the national herd while export demand evaporates. When supply consistently outpaces demand, prices fall—fast.

The harsh truth? Even meeting forecasts can be bearish when the fundamentals scream oversupply.

The Geographic Gamble: Are You on the Right Side?

Kansas’s explosive 15.7% production growth isn’t luck—it’s a strategy. While California battles water wars and regulatory nightmares, Kansas offers:

  • Land costs 70% below California levels
  • Water abundance without bureaucratic interference
  • Business-friendly regulations
  • Proximity to feed sources

The question every producer should ask is: Are you positioned in a growth region, or are you clinging to a legacy location that’s becoming a liability?

What This Means for Your Operation Right Now

If you’re in a declining region: Don’t panic, but don’t ignore reality either. California’s struggles aren’t temporary weather patterns—they’re structural earthquakes. Start planning your exit strategy or prepare for shrinking margins.

If you’re in a growth region: The opportunity is massive, but so is everyone else’s recognition of it. Your competitive edge will come from execution speed, not just location.

If you’re planning expansion: Herd-driven growth is dominating, but it’s creating a supply bubble. Make sure your business model can survive potentially lower milk prices through 2026.

The Global Context: Learning from International Shifts

Similar geographic redistributions are reshaping dairy worldwide. New Zealand’s Canterbury region experienced comparable growth patterns in the 2010s, while Europe’s production has shifted eastward toward lower-cost regions. The common thread? Producers who moved early captured the most value.

The lesson? Geographic shifts in agriculture are predictable and profitable—for those who act before the crowd.

The Bottom Line

The May 2025 milk production report reveals an industry in the middle of its most dramatic transformation in generations. Geographic power is shifting from traditional strongholds to regions with structural advantages. Component quality is becoming more valuable than raw volume. And markets are pricing in oversupply concerns that could hammer prices for months.

Your immediate action items:

  1. Assess your geographic risk – Are you in a growth or decline region?
  2. Audit your component focus – Are you maximizing butterfat and protein?
  3. Stress-test your expansion plans – Can you survive lower milk prices?
  4. Monitor your local competition – Who’s expanding aggressively near you?

The bottom line? This isn’t just another monthly report—it’s a roadmap showing where dairy’s future lies. The producers who read these signals correctly and act decisively will build the next generation of dairy empires. Those who don’t will spend the next decade wondering what happened.

Which side of this transformation will you choose?

Complete references and supporting documentation are available upon request by contacting the editorial team at editor@thebullvine.com.

Learn More:

Join the Revolution!

Join over 30,000 successful dairy professionals who rely on Bullvine Weekly for their competitive edge. Delivered directly to your inbox each week, our exclusive industry insights help you make smarter decisions while saving precious hours every week. Never miss critical updates on milk production trends, breakthrough technologies, and profit-boosting strategies that top producers are already implementing. Subscribe now to transform your dairy operation’s efficiency and profitability—your future success is just one click away.

NewsSubscribe
First
Last
Consent

China’s $4.8 Billion Dairy Pivot: Why ANZ Producers Have 90 Days to Lock in the Deal of a Decade

Waiting for “perfect market conditions” while competitors capture China’s $4.8B dairy bonanza? 90-day window = $1.5M revenue opportunity.

EXECUTIVE SUMMARY: The dairy industry’s methodical “wait and see” approach to international markets is costing producers millions while China’s $4.8 billion import surge creates the biggest trade realignment since EU quota elimination. March 2025 data reveals a staggering 23.5% year-over-year import explosion, with whey imports jumping 41.7% to 67,812 metric tons as Chinese buyers actively replace US suppliers with ANZ alternatives. New Zealand producers are already capitalizing with a documented $300 per tonne premium over competitors, while Australian cheese exports surged 30% by adapting to Chinese buyer timelines that demand sourcing decisions in weeks, not months. This comprehensive analysis exposes how traditional committee-driven decision making is becoming a liability in fast-moving global markets, where supply chain transparency and rapid response protocols now command premium pricing. Mid-sized operations processing 50 million pounds annually could capture $500,000-$1,500,000 in additional revenue through strategic 90-day market entry frameworks that challenge conventional risk-averse business culture. The evidence is clear: while most producers debate whether to act, forward-thinking operators are already building relationships that will define the next decade of global dairy trade. Stop letting perfectionism kill profitability – Chinese buyers are making sourcing decisions right now, and August trade policy deadlines won’t wait for your committee approvals.

KEY TAKEAWAYS

  • Premium Pricing Breakthrough: NZ-origin skim milk powder commands $300 per tonne premium ($0.27/cwt equivalent) through supply reliability positioning, proving that perceived stability now outweighs traditional cost competition in global markets worth $4.8 billion annually.
  • Speed-to-Market Revenue Multiplier: Chinese manufacturers sourcing 15,000+ tonnes whipping cream annually (equivalent to 25,000 high-producing cows) are requesting 5,000 additional tonnes with 3-week turnaround requirements, creating immediate opportunities for producers willing to abandon traditional procurement timelines.
  • Trade Flow Realignment Impact: With US skim milk powder exports to China hitting zero in February 2025 for first time since 2019, the 69% historical export drop pattern from previous trade wars is redistributing $584 million in annual US dairy exports to agile ANZ competitors who adapt business processes to Chinese buyer speed requirements.
  • Technology-Driven Competitive Advantage: Supply chain transparency systems providing real-time inventory visibility and product traceability are becoming non-negotiable requirements for Chinese buyers willing to pay premiums, transforming traditional “information hiding” approaches into obsolete competitive disadvantages.
  • ROI-Justified Implementation Framework: The verified 90-day market entry timeline ($75,000-$150,000 total investment) targeting high-value categories like cheese and cream offers documented potential returns of $500,000-$1,500,000 additional annual revenue for mid-sized operations willing to challenge conventional committee-driven decision making that’s proving too slow for global market realities.

The world’s largest dairy import market just reshuffled its supplier deck, and Australian and New Zealand producers have a narrow window to capture massive market share before the opportunity evaporates. Here’s how smart operators are already making their move.

Think of China’s dairy market like a 2,000-head rotary parlor that suddenly switched from a three-times-a-day milking schedule to twice daily. The throughput capacity is still there, but everything about timing, flow, and supplier relationships just changed overnight.

China’s $4.8 billion annual dairy import market is systematically severing ties with US suppliers. The ripple effects create the biggest trade flow realignment the global dairy industry has seen since the EU milk quota system ended in 2015.

But here’s what challenges conventional wisdom: this isn’t just another trade spat that’ll blow over in six months. This represents a fundamental realignment of global dairy flows happening faster than a fresh cow’s production curve spikes in early lactation.

Are you still waiting for “perfect market conditions” while your competitors lock in premium contracts worth millions?

Challenging the “Wait and See” Mentality: Why Speed Beats Perfection

Here’s where we need to challenge a deeply ingrained dairy industry practice. The methodical, risk-averse approach to market entry has served domestic markets well but is proving disastrous in China’s fast-moving environment.

Traditional dairy business culture prioritizes thorough analysis, committee approvals, and gradual market entry. That’s exactly the opposite of what Chinese buyers demand right now.

The Evidence Against Conventional Wisdom

Peter Verry from Peloris Global Services reports receiving urgent requests to source 300+ metric tons per annum of parmesan and cheddar cheese with just three weeks’ notice. Compare this to traditional dairy procurement cycles that often span months.

“The problem is that Australian businesses typically move a lot slower than that,” Verry explains. “They have a lot more red tape and departmental ticks to go through.”

This disconnect is killing opportunities while Chinese buyers make sourcing decisions in real-time. When did we become so risk-averse that we’re afraid to move at market speed?

What’s Really Happening in China’s Dairy Market?

Let’s cut through the noise with verified data. China’s dairy imports exploded by 23.5% year-over-year in March 2025 alone. Total dairy imports for the first four months of 2025 increased by 12% year-over-year, marking five consecutive months of growth.

But the real story isn’t just growth – it’s the dramatic shift in supplier preferences.

The Numbers That Matter to Your Operation

New Zealand has solidified its position as China’s dominant dairy supplier, with a 46% market share in early 2025. Their complete duty-free access through the Free Trade Agreement provides a crushing competitive advantage.

Product CategoryMarch 2025 PerformanceStrategic Impact
Whey+41.7% to 67,812 metric tonsEnough protein for 135,000 high-producing cows
Whole Milk Powder+30.7%Critical for food manufacturing expansion
CheeseRising demand continuing16% compound annual growth rate 2012-2022
ButterRecord highs achievedDriven by foodservice and baking expansion

Why This Matters for Your Operation: The Economic Reality

Are you still relying on domestic market stability while global opportunities multiply around you?

China’s domestic milk production plummeted, with farmgate prices falling to $19.40 per hundredweight – a decade low. This unsustainable pricing has forced smaller operations out of business, creating structural supply gaps.

Rabobank estimates a 5% reduction in China’s milk production for the second half of 2024 and projects a further 1.5% decline in 2025.

Chinese buyers are paying premiums for supply security that can transform operational profitability. NZ-origin skim milk powder now trades at a $300 per tonne premium over competitors.

That’s like getting an extra $0.27 per hundredweight just for being perceived as a reliable supplier.

The Technology Integration Advantage: Beyond Basic Traceability

The most successful ANZ producers in China aren’t just selling commodities. They’re providing transparency that Chinese buyers desperately want.

Challenging Traditional Supply Chain Thinking

Traditional approaches hide information from buyers to maintain negotiating leverage. Chinese buyers now demand the opposite: complete transparency and real-time visibility.

“We are receiving feedback from Chinese retail buyers that US products are being replaced on shelves with European and ANZ products,” Verry reports.

This level of visibility addresses a fundamental frustration in traditional Chinese distribution models. It’s like upgrading from visual cow observation to activity monitoring collars – the data-driven approach provides insights impossible to achieve manually.

Why are we still treating international trade like it’s 1995?

Implementation Timeline: Your 90-Day Window

Think of entering China’s market as a herd transitioning to robotic milking. Success depends on getting the timing, technology integration, and monitoring systems exactly right from day one.

PhaseDurationInvestment RequiredKey Objectives
Assessment & PreparationDays 1-30$15,000-$25,000Capability assessment, team establishment
Market Entry & RelationshipsDays 31-60$25,000-$40,000Intermediary engagement, specification development
Deal ExecutionDays 61-90$50,000-$100,000+Contract securing, system implementation

Days 1-30: Assessment and Preparation

Conduct rapid capability assessment for high-value products. Establish a dedicated response team with the authority to approve deals quickly.

Audit current supply chain transparency systems. Think about implementing comprehensive herd management software – you need complete visibility before optimizing.

Days 31-60: Market Entry and Relationship Building

Engage with established intermediaries who understand Chinese market dynamics. Develop product specifications aligned with buyer requirements.

Create rapid-response protocols for sourcing requests. Chinese companies move at emergency protocol efficiency – you need matching speed.

Days 61-90: Deal Execution

Focus on locking in supply agreements before potential tariff changes. Implement ongoing transparency and communication systems.

Build relationships with multiple Chinese buyers to diversify risk. Establish protocols for rapid scaling based on initial success metrics.

The Tariff Time Bomb: Racing Against August Deadlines

The window of opportunity comes with a ticking clock. China initially implemented a 10% tariff on US dairy products on March 10, 2025, skyrocketing to 125% by early April.

A temporary 90-day tariff reduction agreement lowered China’s retaliatory tariffs from 125% to 10%. However, this truce could collapse in August, potentially snapping tariffs back to punishing levels.

What Previous Trade Wars Teach Us

Historical analysis shows that when China imposed retaliatory tariffs on US dry whey in previous disputes, exports to China dropped 69% from peak to bottom. The difference now: Chinese buyers are actively seeking supply chain diversification.

This creates permanent structural advantages for ANZ producers regardless of tariff outcomes.

Global Market Context: The New Reality

The current China opportunity mirrors what happened during precision agriculture adoption in the 2010s. Early adopters of precision farming technologies achieved lasting competitive advantages that persist today.

European Competition Reality Check

EU producers face documented challenges, including biosecurity threats such as foot-and-mouth disease and bluetongue virus. These add “infection-risk premiums” to their products.

This creates quantifiable opportunities for ANZ producers to capture market share through reliability and safety positioning.

RegionKey AdvantagesMarket PositionCritical Challenges
New ZealandDuty-free access, $300/tonne premium46% market shareSupply constraints during peak demand
AustraliaProgressive tariff eliminationGrowing cheese market shareScaling production capacity
United StatesTraditional relationshipsMarket access is severely limited125% tariffs, relationship damage
European UnionProduct diversityMaintaining presenceBiosecurity risks, longer transport

Premium Opportunities: Where the Real Money Lives

While volume opportunities are impressive, challenging conventional commodity thinking reveals where the real money lies. China’s cheese imports reached their third-highest record in 2024.

Rabobank forecasts import demand could reach 270,000-320,000 tonnes by 2030.

Cream and Ingredients: The Hidden Goldmine

One Chinese manufacturer used 15,000 tonnes of whipping cream last year and recently requested an additional 5,000 tonnes. To put that in perspective, that’s equivalent to the annual cream production from roughly 25,000 high-producing dairy cows.

“We received an urgent request to source 300+ mtpa parmesan and cheddar cheese for a major product launch scheduled for August this year to replace the existing US sourced products,” Verry reports.

The Economic Impact: ROI That Justifies Bold Action

Let’s talk about numbers that matter to your bottom line. The premium pricing Chinese buyers pay for supply security justifies significant investment in market entry capabilities.

Investment vs. Returns:

  • Initial market entry: $75,000-$150,000 over 90 days
  • Technology systems: $25,000-$50,000 annually
  • Potential returns: $300 per tonne premium documented for NZ products
  • Volume opportunities: Individual contracts ranging from 300-5,000+ tonnes annually

For a mid-sized operation processing 50 million pounds of milk annually, capturing even a small share of China’s premium market could represent $500,000-$1,500,000 in additional annual revenue.

When was the last time you saw an investment opportunity with this kind of verified upside?

Risk Management: What Smart Operators Know

Every opportunity this significant comes with documented risks. Even with temporary tariff reductions, American dairy products continue to face substantial disadvantages in the Chinese market and are increasingly viewed as a “last resort supplier.”

Quality Control Scaling

Rapid scaling requires maintaining quality standards that took years to establish. This mirrors managing nutrition during rapid herd expansion – success depends on maintaining feed quality and monitoring systems.

Currency and Economic Volatility

The premium pricing Chinese buyers currently pay could erode if economic conditions change or domestic production recovers faster than expected.

Technology Implementation: Systems That Actually Work

The successful producers in China’s evolving market are those leveraging technology to provide transparency and speed up Chinese buyers demand.

Real-Time Systems That Work

Peloris Global Services has demonstrated success by providing producers with complete dashboards showing what’s being sold, where it’s being sold, and at what price points.

Chinese buyers are willing to pay premiums for this level of transparency. Think comprehensive herd management software for international trade.

Challenging Industry Orthodoxy: The Speed vs. Quality False Dichotomy

Here’s where we need to fundamentally challenge a core dairy industry belief: that speed and quality are mutually exclusive.

Research shows that automated systems actually improve quality while increasing speed when proper systems are in place.

The Evidence Against Traditional Thinking

Consider this: the US dairy industry achieved significant productivity gains while maintaining quality standards through rapid technology adoption. Speed of implementation was crucial to these gains.

Why should international market entry be different? The producers succeeding in China treat it like implementing a comprehensive precision dairy program.

When did “thorough” become code for “too slow to compete”?

Strategic Future Implications

Are you preparing for a fundamentally different global dairy market, or are you still planning based on pre-2020 assumptions?

China’s diversification creates permanent structural advantages for countries with stable trade relationships.

The Demographics Reality

China’s infant formula imports plummeted 35% due to declining birth rates. However, this demographic challenge drives growth in higher-value categories like cheese and butter that command better margins.

Think about it: Would you rather compete in a declining infant formula market or capture a share in premium cheese applications where China’s domestic processing capacity remains limited?

The Bottom Line: Evidence-Based Action Beats Perfect Planning

Remember that urgent question we started with about what $4.8 billion in suddenly available dairy imports looks like? You’re looking at the biggest market reshuffling since the EU milk quota system ended.

Chinese buyers are actively replacing US suppliers with ANZ alternatives. The window for capturing your share of this massive opportunity is measured in weeks, not months.

The producers who will dominate China’s dairy market five years from now are making their moves today. They’re adapting their business processes to match Chinese speed requirements. They’re investing in transparency systems that Chinese buyers demand.

But here’s what separates winners from watchers: Winners understand that success in China requires challenging fundamental assumptions about how dairy business should be conducted.

It’s like the difference between adding a few activity collars versus implementing a comprehensive precision dairy program that transforms every major decision.

The Evidence Is Clear

Multiple verified sources confirm that trade tensions are reshaping global dairy flows permanently. Historical analysis shows that delays cost more than imperfect action.

With Chinese domestic production struggling and farmgate prices at decade lows, every revenue opportunity matters. China’s massive import market is being redistributed, and early adopters maintain lasting competitive advantages.

Here’s the uncomfortable truth most producers won’t admit: While you’re debating whether to act, your competitors are already building the relationships that will define the next decade of global dairy trade.

They’re not waiting for perfect market conditions or committee approvals – they’re moving at Chinese speed because that’s what the market demands.

And here’s the question that should keep you awake tonight: If you’re not willing to adapt your business practices to capture premium opportunities, what makes you think you’ll survive when the next market disruption hits?**

The stakes are clear. Miss this window, and you’ll spend years watching competitors build the relationships and market position that could have been yours.

Act now, and you’ll be positioned to benefit from the most significant realignment of global dairy trade flows since trade liberalization began.

Your immediate next step: Contact established Chinese market intermediaries this week to assess your current capabilities and identify immediate opportunities. Don’t wait for perfect conditions – Chinese buyers are making sourcing decisions right now, and trade policy uncertainty isn’t negotiable.

The question isn’t whether you can afford to enter this market; it’s whether you can afford not to when competitors are already capturing premium pricing and building relationships that will define the next decade of the global dairy trade.

China’s dairy diversification isn’t coming – it’s here. The only question left is whether you’ll be part of it.

Complete references and supporting documentation are available upon request by contacting the editorial team at editor@thebullvine.com.

Learn More:

Join the Revolution!

Join over 30,000 successful dairy professionals who rely on Bullvine Weekly for their competitive edge. Delivered directly to your inbox each week, our exclusive industry insights help you make smarter decisions while saving precious hours every week. Never miss critical updates on milk production trends, breakthrough technologies, and profit-boosting strategies that top producers are already implementing. Subscribe now to transform your dairy operation’s efficiency and profitability—your future success is just one click away.

NewsSubscribe
First
Last
Consent

TRADE BREAKTHROUGH: How Brazil’s $83M Whey Protein Reversal Exposes the Dairy Industry’s Quality Control Delusion

Stop trusting reactive quality control. Brazil’s $83M whey reversal exposes why predictive monitoring prevents export disasters.

EXECUTIVE SUMMARY: The dairy industry’s addiction to “batch and pray” quality control just cost Agropur an $83 million market—but their 18-day recovery reveals the blueprint for export survival in 2025’s unforgiving global marketplace. While most exporters still rely on periodic sampling that leaves 21-day detection gaps, Brazil’s whey protein incident proves that reactive quality systems are becoming commercially suicidal when single specification failures can shut down major markets overnight. The crisis wasn’t solved by politics or price cuts—it was rescued through technical diplomacy, real-time verification systems, and predictive monitoring that detects problems before customers do. Brazil’s growing $2.56 billion whey protein market opportunity by 2033, coupled with rising import prices from $1.11-$7.50 USD/kg to $1.90-$11.85 USD/kg, rewards exporters who invest in advanced quality control over those stuck with Stone Age methods. Smart exporters are already implementing NIR spectroscopy, automated documentation systems, and government relationship protocols that turn potential crises into competitive advantages. Stop waiting for quality scares to test your export systems—audit your current quality control against international standards before your next shipment becomes tomorrow’s trade disruption headline.

KEY TAKEAWAYS

  • Invest in Predictive Quality Systems Now: Advanced testing technologies like NIR spectroscopy and automated monitoring prevent specification failures before they reach international customers, with ROI timelines of 12-24 months for market access improvements and premium positioning worth $25,000-$250,000 in system upgrades.
  • Build Technical Diplomacy Infrastructure: The 18-day resolution framework—immediate technical remediation, government-level engagement, and collaborative problem-solving—requires $10,000-$25,000 annual investment in trade promotion relationships that can save $83 million markets when quality issues arise.
  • Target Brazil’s Premium Specifications Market: While Argentina dominates commodity whey volumes at $42.1M, the US captures $83M in high-value concentrate powder where technical compliance and consistent quality command rising premiums as import prices increased 58% from 2023 to 2024.
  • Implement Real-Time Export Monitoring: Companies using continuous quality monitoring detect deviations 347% faster than traditional batch testing, with 73% fewer specification failures reaching export markets—critical when Brazil meets only 15% of its whey protein demand domestically and relies on imports for 85%.
  • Prepare for 2029 Competition Gap: Current government investment shifts toward traditional platforms with FDA approval targeted for 2029 create immediate opportunities for exporters who master current technical standards while competitors wait for slower-developing alternatives.
dairy export quality control, whey protein exports, international dairy trade, dairy testing technology, export market access

Here’s the inconvenient truth the dairy industry doesn’t want to admit: Brazil’s lightning-fast reversal on US whey protein imports didn’t just restore an $83 million market – it exposed how most dairy exporters are still operating with Stone Age quality control while pretending they’re ready for global trade. This 18-day crisis should terrify every exporter who thinks “good enough” quality systems will survive in tomorrow’s marketplace.

Stop celebrating Brazil’s quick resolution and ask the uncomfortable question: Why did this crisis happen? When Agropur’s protein levels dropped below Brazil’s 80% threshold without the company knowing, it revealed a fundamental industry delusion. We’re still using reactive quality control methods designed for local milk routes, not global supply chains where one failed specification can cost $83 million overnight.

You’re about to discover why this incident represents the most important wake-up call for dairy exporters in 2025 – and why the companies that learned the wrong lessons from Brazil’s whey protein reversal are setting themselves up for catastrophic failures in tomorrow’s unforgiving global marketplace.

The Quality Control Delusion That’s Killing Dairy Exports

Let’s destroy a sacred cow that’s been grazing in our industry too long: the myth that traditional batch testing and periodic sampling can protect your export business in today’s hyperconnected global marketplace. Brazil’s whey protein incident didn’t happen because Agropur lacked quality control – it happened because they were using quality control methods designed for 1995, not 2025.

The Uncomfortable Reality: According to the comprehensive Brazil-US trade analysis, laboratory results showed protein levels below the required 80% threshold, yet Agropur likely remained unaware until Brazilian authorities detected the issue during import testing. This isn’t a company failure – it’s a systematic industry failure that reveals how we’ve been fooling ourselves about quality assurance.

Think about this like managing a high-producing Holstein herd. You wouldn’t wait for clinical mastitis to appear before checking somatic cell counts, yet that’s exactly how most dairy exporters approach quality control. They test samples periodically, hope specifications hold, and react when problems surface – essentially practicing “test and pray” methodology in an industry where single specification failures can shut down $83 million markets overnight.

The Technology That Exists But We Ignore: Near-infrared (NIR) spectroscopy can provide instant composition analysis without laboratory delays. Advanced testing technologies, including PCR, ELISA, and biosensor-based assays, overcome the limitations of slower conventional approaches. Yet most exporters treat these as luxury investments rather than survival necessities.

Here’s the question that should haunt every dairy CEO: If your quality control system can’t detect specification failures before your customers do, do you really have quality control at all?

Why Brazil’s Quick Reversal Should Terrify, Not Reassure You

Everyone’s celebrating Brazil’s 18-day resolution as a success story. That’s completely missing the point. The real story isn’t how quickly the problem was solved – it’s how completely preventable this crisis was in the first place.

When Brazil’s Ministry of Agriculture and Livestock (MAPA) suspended Agropur on May 22, 2025, and lifted the ban on June 9, industry observers praised the rapid diplomatic response. But here’s what they’re not talking about: this crisis happened because protein levels dropped below specification without real-time detection. That’s like celebrating how quickly you treated a cow for ketosis while ignoring why your transition cow management failed to prevent it.

The Real Numbers Behind the Crisis: Brazil imported over $83 million worth of US whey protein concentrate powder in 2024, making it one of the top three global buyers. The suspension targeted a specific product category where the US holds strategic advantages – high-value, specialized products requiring precise technical specifications.

But here’s the terrifying reality: Agropur’s rapid resolution involved presenting “additional technical data and demonstrable quality control adjustments.” Translation: they had to scramble to prove their systems worked after they failed. The US Foreign Agricultural Service (FAS) and Agricultural Marketing Service (AMS) immediately addressed irregularities, meaning that government agencies had to intervene to save a private company’s export relationship.

This should keep you awake at night: If it takes government intervention and diplomatic crisis management to resolve quality control failures, your company isn’t ready for international trade.

Brazil’s Growing Import Dependence: Opportunity or Warning?

Here’s where most industry analysis gets Brazil completely wrong. Everyone sees Brazil’s growing import dependence as a massive opportunity. They’re missing the bigger picture: Brazil’s structural challenges reveal exactly what happens when domestic dairy production fails to evolve with global quality standards.

The Structural Reality: Brazil meets only 15% of its internal demand for whey protein, with 85% covered by imports. This isn’t market expansion – it’s domestic production failure. Brazil’s overall imports of whey, milk albumin, and casein products increased from $89 million in 2017 to $149 million in 2021, driven by declining domestic milk production and rising industrial costs.

Think of Brazil like a dairy farm that’s losing genetic ground every generation. Domestic production has stagnated over the past decade due to economic pressures, labor scarcity, and competition from more profitable operations. When import prices to Brazil increased from $1.11-USD 7.50 per kg in 2023 to $1.90-USD 11.85 per kg in 2024, it created a market where quality commands premium pricing.

The Competitive Landscape Reveals Everything:

CountryStrategic Position2024 Market PerformanceReality Check
ArgentinaMercosur advantage$42.1M total wheyVolume leader, price advantage
United StatesPremium products$83M concentrate powderQuality leader, specification critical
UruguayRegional supplier$1.59MLimited scale, niche player
FranceSpecialized positioning$998kPremium focus, small volume

Here’s the insight everyone’s missing: Argentina dominates overall whey volumes through preferential trade access, but the US excels in high-value products where technical specifications matter most. This isn’t a sustainable competitive advantage – it’s a warning about what happens when you compete on quality in markets where quality standards keep rising.

The Technical Diplomacy Framework That Saved $83 Million

The Agropur resolution wasn’t just crisis management – it revealed a sophisticated framework for managing technical trade barriers that most dairy exporters don’t understand and can’t replicate.

The Three-Pillar Response That Actually Worked:

1. Immediate Technical Remediation: Agropur presented additional technical data and implemented demonstrable quality control adjustments. This wasn’t paperwork shuffling – it was verifiable evidence of systematic improvements that addressed root causes, not symptoms.

2. Government-Level Engagement: The Foreign Agricultural Service (FAS) and Agricultural Marketing Service (AMS) immediately addressed irregularities. This shows how private-sector quality failures become public-sector trade priorities when handled correctly.

3. Collaborative Problem-Solving: Both countries treated this as a technical issue requiring technical solutions, not political or protectionist measures. This collaborative approach enabled rapid resolution because everyone focused on data and measurable outcomes.

The Critical Success Factor: This framework worked because the issue was genuinely technical – quantifiable, objectively verifiable, and amenable to technical solutions rather than rooted in political or protectionist motives.

But here’s what most companies are missing: This framework requires preparation that happens before crises occur. You can’t build government relationships, technical capabilities, and crisis response protocols during emergencies. Companies that wait for quality scares to develop these capabilities have already lost.

Quality Control: Your Export Survival Depends on Understanding Brazil’s Standards

Brazil’s regulatory framework isn’t just bureaucracy – it’s a preview of where global quality standards are heading. Understanding these requirements isn’t optional; it’s like understanding basic nutrition before formulating dairy rations.

Brazil’s Multi-Layered Regulatory Reality:

  • MAPA (Ministry of Agriculture, Livestock and Food Supply): Responsible for all animal origin products, including dairy exports
  • ANVISA (National Agency of Sanitary Surveillance): Enforces processed food regulations focusing on public health standards
  • Vigiagro (International Agricultural Surveillance System): Inspects international animal product traffic at ports and airports

The Real Import Requirements: Before any dairy product enters Brazil, importers must register with Siscomex (Brazil’s Foreign Trade Integrated System). Exporting companies must register both products and labels with MAPA – registration valid for 10 years. Dairy products require special Import Licenses that can take up to 60 days for approval.

The Technology Integration Reality: Advanced testing technologies such as PCR, ELISA, and biosensor-based assays are rapidly becoming standard requirements. Companies investing in AI, IoT, blockchain, and automated testing systems gain competitive advantages through enhanced precision, speed, and traceability – not luxury features but survival necessities.

Here’s the question separating survivors from casualties: Are your quality systems designed to meet today’s or tomorrow’s standards?

Market Intelligence: The $2.56 Billion Brazilian Opportunity

Smart exporters understand that Brazil’s whey protein market represents broader global trends that will determine who succeeds in the international dairy trade over the next decade.

The Growth Trajectory: Brazil’s whey protein market is expected to reach $2.56 billion by 2033, exhibiting a CAGR of 5.70% from 2025-2033. This growth is driven by increasing health consciousness, expanding fitness trends, rising disposable income, and growing demand for sports nutrition.

But here’s the strategic insight that is most missing: This isn’t just market expansion – it’s market evolution toward higher specifications and technical compliance requirements. The US’s $83 million concentrate powder market in Brazil represents quality-focused demand where technical specifications create defensible market positions.

The Pricing Reality: Import price increases from $1.11-$7.50 USD per kg in 2023 to $1.90-$11.85 USD per kg in 2024, demonstrating a market where reliability and consistent quality command significant premiums. This pricing trajectory rewards technical excellence over commodity production.

Investment Signal: Companies like Piracanjuba Group are securing €94 million in financing for new production facilities processing 1.2 million liters of milk daily, including whey protein and powdered lactose production. This represents sophisticated manufacturing capabilities entering the market – raising competitive standards for everyone.

US Dairy Export Context: Beyond the $8.2 Billion Headlines

The US dairy industry’s export performance creates the foundation for understanding why the Brazil whey protein incident matters for every American dairy operation.

The Scale of Impact: The US dairy industry supports over 3.05 million American jobs and contributes substantial economic impact. Exports account for approximately 18% of all US milk production – triple the level from the early 2000s. US dairy exports reached $8.2 billion in 2024, with Mexico and Canada as top partners.

Strategic Investment in Capacity: The industry has committed over $8 billion to new processing capacity that will come online in the next few years. States like Wisconsin, South Dakota, and Texas are adding significant cheese-making capabilities, with facilities expected to contribute an additional 360 million pounds of cheese annually by the end of 2025.

The Technology Integration Imperative: Just as automated milking systems have reached 35,000 units globally, providing unprecedented individual cow performance data, export operations need similar precision monitoring for quality assurance. The same data-driven management transforming on-farm operations must extend to export quality control.

Here’s the uncomfortable truth: The US dairy industry is investing billions in new capacity while many operations still use quality control methods designed for domestic markets. This creates a fundamental mismatch between production capability and export readiness.

Your Action Plan: The Brazil Framework Implementation Guide

Every dairy exporter can apply lessons from Brazil’s whey protein reversal, but only if they understand that preparation, not reaction, determines success.

Phase 1: Reality Assessment (0-30 days)

  • Audit current quality control systems against international standards, not domestic requirements
  • Evaluate whether your systems can detect specification failures before customers do
  • Establish relationships with trade promotion agencies before you need them
  • Document quality assurance processes with real-time verification capabilities

Phase 2: Technology Integration (30-90 days)

  • Implement advanced testing technologies appropriate for your scale and products
  • Establish comprehensive traceability systems using RFID tags and GPS-enabled transport
  • Invest in automated documentation systems providing real-time quality data
  • Develop digital dashboards monitoring compliance across all export markets

Phase 3: Market Intelligence Development (60-120 days)

  • Research regulatory requirements for target export markets, focusing on technical specifications
  • Monitor import price trends and market growth projections for strategic positioning
  • Identify competitive advantages based on quality, technology, or service capabilities
  • Build relationships with importers who value technical compliance over price competition

Phase 4: Crisis Prevention Infrastructure (Ongoing)

  • Engage with government trade promotion agencies to understand available support mechanisms
  • Develop crisis communication plans emphasizing technical solutions over political remedies
  • Create documentation systems enabling immediate response to regulatory inquiries
  • Build networks with industry associations and trade organizations in target markets

Investment Reality Check: Basic quality control system upgrades require a $25,000-50,000 investment. Advanced testing and automation systems cost $100,000-250,000. Government relationship development and trade mission participation cost $10,000-25,000 annually. Expected ROI timeline: 12-24 months for market access improvements, 3-5 years for premium pricing recognition.

The Bottom Line: Quality Control as Your Export Foundation

Remember that Brazil lost almost $83 million in the market? Politics, price concessions, or relationship appeals didn’t save it. It was rescued by technical competence, rapid response, and collaborative problem-solving – the same principles that separate successful dairy operations from those struggling with consistency.

The Harsh Reality: International trade requirements are becoming more stringent, quality expectations are rising, and technical compliance is increasingly non-negotiable. Operations that master these realities don’t just survive – they capture premium markets while competitors struggle with commodity pricing.

The Brazil whey protein breakthrough proves a fundamental truth: when quality issues arise – and they will – your response determines whether you lose market access or strengthen your competitive position. The exporters who understand this will capture opportunities that structural shifts in global dairy demand are creating.

The Strategic Insight: Brazil’s growing dependence on imported dairy ingredients represents a $2.56 billion market opportunity by 2033, but only for exporters who can meet rising technical standards. Similar shifts are occurring worldwide as domestic production struggles to meet the demand for specialized dairy products requiring precise specifications.

Your Critical Decision Point: Will you continue relying on reactive quality control that leaves you vulnerable to specification failures, or will you invest in predictive technologies and diplomatic relationships that turn potential crises into competitive advantages?

The $83 million Brazil market wasn’t just restored and reinforced through technical excellence and systematic quality management. That’s the difference between companies that merely export dairy products and those that build sustainable international partnerships based on measurable performance standards.

The choice facing every dairy exporter is clear: Adapt your quality control systems for tomorrow’s marketplace or watch competitors capture the premium markets you thought were secure. Brazil just showed you exactly what tomorrow’s standards look like. The question is whether you’ll meet them before or after your next crisis.

Complete references and supporting documentation are available upon request by contacting the editorial team at editor@thebullvine.com.

Learn More:

Join the Revolution!

Join over 30,000 successful dairy professionals who rely on Bullvine Weekly for their competitive edge. Delivered directly to your inbox each week, our exclusive industry insights help you make smarter decisions while saving precious hours every week. Never miss critical updates on milk production trends, breakthrough technologies, and profit-boosting strategies that top producers are already implementing. Subscribe now to transform your dairy operation’s efficiency and profitability—your future success is just one click away.

NewsSubscribe
First
Last
Consent

Master Global Dairy Markets While Protecting Your Home Base: New Zealand’s $25.5 Billion Export Lesson

Stop believing the export-first myth. New Zealand’s $27B model proves genomic selection delivers NZD 72.96/cow ROI while export obsession destroys social license.

EXECUTIVE SUMMARY: The dairy industry’s biggest lie? That maximizing export revenue automatically equals optimal business success—New Zealand’s $27 billion export bonanza just proved this conventional wisdom dangerously wrong.  While Kiwi farmers celebrate record farmgate prices of $10.00 per kg milk solids, their own families pay 65.3% more for butter and 15.1% more for milk, with 9,000 more children entering material hardship since 2018.  Peer-reviewed research reveals that environmental externalities exceeded New Zealand’s entire $11.6 billion dairy export revenue in 2012, yet the industry continues prioritizing short-term export gains over long-term sustainability.  Meanwhile, genomic selection delivers proven returns of NZD 17.53-72.96 per animal annually, demonstrating that technology can serve balanced stakeholder interests rather than pure export optimization.  Ireland’s model proves the alternative works—exporting 90% of production while ensuring 90 cents of every export euro circulates domestically, creating broader stakeholder buy-in without sacrificing competitiveness.  Your operation’s future depends on learning from New Zealand’s $27 billion lesson: the most successful export strategies are worthless if they destroy your foundation at home.

KEY TAKEAWAYS

  • Genomic Selection ROI Acceleration: Deploy female genomic selection combined with sex-selected semen to achieve NZD 17.53 per animal immediate gains, rising to NZD 72.96 annually by 2026—equivalent to eight years of traditional breeding progress compressed into three years
  • Export Concentration Risk Management: New Zealand’s 95% export model created domestic price explosions (65.3% butter increases) and political backlash that threatens regulatory intervention—diversified market strategies following Ireland’s 90% export/90% domestic circulation model provide superior risk mitigation
  • Environmental Cost Reality Check: Peer-reviewed research demonstrates that intensive export-focused models generate environmental externalities exceeding $11.6 billion annually—the hidden costs that ultimately destroy industry sustainability and social license to operate
  • Technology for Stakeholder Balance: While US genomic selection delivers $50 per cow annually across 9 million animals ($450 million sector-wide), New Zealand’s case proves technology must serve multiple stakeholder interests, not just export revenue maximization
  • Value-Added Export Evolution: Focus development on specialized ingredients and premium products commanding higher per-unit returns rather than commodity volume competition—China’s declining birth rates (1.09 in 2022) signal infant formula market vulnerabilities requiring strategic diversification
dairy export strategies, genomic selection ROI, global dairy markets, sustainable dairy farming, dairy profitability

What happens when your export success becomes your domestic nightmare? New Zealand’s dairy industry just delivered a $25.5 billion wake-up call that every dairy strategist needs to understand.

Here’s a statistic that should make every dairy operator pause: New Zealand exports 95% of its dairy production to over 130 countries, leaving just 5% for its own 5 million citizens. The result? Kiwi families are now paying record prices for butter their own cows produced, with prices surging 65.3% annually while milk climbed 15.1% and cheese jumped 24% in 2025.

But here’s the uncomfortable truth that’s shaking the global dairy community: peer-reviewed research shows that New Zealand’s environmental externalities—including water pollution, greenhouse gas emissions, and soil degradation—exceeded the nation’s $11.6 billion dairy export revenue in 2012. While current export revenues have reached a projected $25.5 billion in 2025, the environmental burden remains substantial and continues to be mounting.

The stakes couldn’t be higher. While New Zealand dairy exports are forecast to reach $25.5 billion in 2025—driven by higher global dairy prices—domestic affordability and social license are under serious threat. Over 157,000 children now live in material hardship, representing 9,000 more children than in 2018 when the nation committed to tackling child poverty.

This analysis will challenge conventional wisdom, provide actionable insights backed by peer-reviewed research, and help you future-proof your operation against the risks of export dependence.

Challenging the Export-First Gospel: Why Conventional Wisdom Is Wrong

Let’s challenge modern dairy strategy’s biggest myth: maximizing export revenue automatically equals optimal business success. The evidence from New Zealand proves this conventional wisdom is dangerously flawed.

Peer-reviewed research from Environmental Management demonstrates that New Zealand’s environmental externalities—including nitrate contamination of drinking water, nutrient pollution to lakes, soil compaction, and greenhouse gas emissions—exceeded the nation’s $11.6 billion dairy export revenue in 2012. The study notes that “at the higher end, the estimated cost of some environmental externalities surpasses the 2012 dairy export revenue of NZ$11.6 billion”.

While export revenues have since more than doubled to a projected $25.5 billion in 2025, the environmental burden continues accumulating. Society, not just the dairy sector, ultimately bears this hidden cost.

Here’s where the conventional export model breaks down: Fonterra CEO Miles Hurrell’s public stance reflects the fundamental flaw in current thinking. This approach treats domestic consumers as afterthoughts in their own market while Fonterra reports record profits, with operating profit up 34% to $1,017 million in 2025.

But what if the export-first model isn’t just morally questionable—what if it’s strategically risky?

The Production Reality: Numbers Don’t Lie

Key Performance Indicators (2025):

  • Milk Production: New Zealand’s fluid milk production is forecast at 21.3 million metric tons (MMT) in 2025, a decrease from the previous 5-year average of 21.5 MMT
  • Export Revenue: Dairy export revenue is projected to reach $25.5 billion in 2025, with whole milk powder exports expected to bring in $8.4 billion
  • Farmgate Prices: The farmgate milk price forecast ranges from $8.00-$11.00 per kg milk solids, with Rabobank projecting $9.50/kgMS for 2025/26
  • Average Herd Size: 448 animals in 2024, representing continued consolidation
  • Market Concentration: Fonterra processes 82% of all milk solids and controls over 80% of the nation’s milk supply

Imagine running a 1,000-cow operation where you sell 950 cows’ worth of milk to export buyers paying premium prices, then try to supply your local community with just 50 cows’ worth of production. That’s exactly the supply-demand imbalance New Zealand has created.

The Technology Trap: Automation Without Social Consideration

Another sacred cow that needs challenging is the assumption that technology adoption automatically improves sustainability and social outcomes. New Zealand’s technology trajectory reveals efficiency gains that exacerbate social problems.

The DairyNZ Greenfield Project, established in 2001 with the goal of turning milking into a background activity, proved that automated milking can be successful within a New Zealand pastoral system, but significant restraints remain in capital and operating costs. Despite technological advances, the project was ultimately closed, highlighting the complexity of technology adoption.

Current Technology Reality:

  • Genomic Selection Impact: A peer-reviewed study of a New Zealand Holstein-Friesian herd demonstrated annual genetic improvement with BPI increasing from 136 to 184 between 2021 and 2023, corresponding to a financial gain of NZD 17.53 per animal per year
  • Predicted Future Gains: The predicted BPI gain from 2023 to 2026 is expected to rise from 184 to 384, resulting in a financial gain of NZD 72.96 per animal per year
  • US Genomic Success: Genomic selection has doubled the rate of genetic gain in US dairy cattle, with fitness traits seeing even greater improvements

But here’s the critical question: Are we optimizing for the right metrics?

These efficiency gains have enabled market concentration rather than competitive diversity. With Woolworths and Foodstuffs chains dominating New Zealand’s supermarket sector, technology adoption has reinforced structural problems rather than solving them.

Market Reality Check: The Numbers That Matter in June 2025

Let’s examine current market conditions with verified data that challenges industry assumptions about “inevitable” global price transmission.

Current New Zealand Market Performance

MetricValue (2025)
Milk production21.3 million metric tons
Export revenue projection$25.5 billion
Farmgate milk price forecast$9.50/kgMS (Rabobank)
Average herd size448 animals
Child material hardship157,048 children (13.4%)

Domestic Price Impact (Verified Stats NZ Data):

  • Food price inflation: 4.4% annually by May 2025, with dairy products leading the charge
  • Child poverty crisis: 9,000 more children in material hardship compared to 2018, when New Zealand committed to tackle child poverty
  • Economic disparity: Despite record export revenues, domestic affordability continues deteriorating

Export Value Breakdown:

  • Whole milk powder exports: Expected to bring in $8.4 billion
  • Butter, AMF, and cream exports: Predicted to reach $5 billion in 2025
  • China dominance: China imports nearly $17 billion worth of New Zealand’s primary products

Global Context: Evidence-Based Comparisons

United States Comparison

The US genomic selection program has doubled the rate of genetic gain since 2010, demonstrating that technology can serve broader stakeholder interests. Research shows that genomics have doubled genetic gains in milk production and helped gains in fitness traits triple.

Key differences in approach:

  • Domestic market focus: The US maintains substantial domestic consumption, providing stability
  • Genetic progress: 60% of the rapid climb in milk production per cow since 1957 is due to genetic selection
  • Balanced optimization: Technology serves both productivity and domestic market stability

Ireland’s Integration Model

Ireland’s dairy sector generated €17.6 billion in economic value in 2022, with over 90% of Irish dairy exported. The critical difference? Ireland ensures broader domestic economic integration.

Key Success Factors:

  • Economic circulation: Export success creates widespread domestic benefits
  • Industry investment: Processors plan to invest circa €875 million in capital projects over the next five years
  • Sustainability focus: Future progress will be driven by enhanced efficiencies, reaffirming the industry’s dedication to sustainability

Environmental Reality: The Hidden Costs of Export Obsession

Peer-reviewed research published in Environmental Management provides the most comprehensive assessment of New Zealand’s environmental externalities. The study found that significant costs arise from nitrate contamination of drinking water, nutrient pollution to lakes, soil compaction, and greenhouse gas emissions.

Critical Environmental Findings:

  • Cost magnitude: At the higher end, the estimated cost of some environmental externalities surpasses the 2012 dairy export revenue of NZ$11.6 billion
  • Public burden: These externalities are left for the wider New Zealand populace to deal with, both economically and environmentally
  • Production intensification: Major increases in production have required externally sourced inputs, particularly fertilizer, feed supplements, and irrigation

The 2024 State of Environment report confirms ongoing concerns, with environmental advocates stating that dairy has contributed to the degradation of almost every environmental metric in New Zealand.

Climate Context:

  • Agricultural emissions: Rising 12% since 1990
  • Land use impact: Almost half of the country is now pasture – more than any other land cover
  • Comparative advantage: Despite challenges, New Zealand farmers have the world’s lowest carbon footprint at 0.74 kg CO2e per kg FPCM, 46% less than the average of 18 countries studied

Future-Proofing Strategy: Three Evidence-Based Approaches

1. Precision Genomic Selection for Stakeholder Balance

Implementation Framework:

  • Genomic testing ROI: Deploy proven genetic selection, delivering NZD 17.53 per animal per year in immediate gains, rising to NZD 72.96 by 2026
  • Technology integration: Use sex-selected semen on the top 50% of BPI-rated heifers to accelerate genetic gain
  • Balanced optimization: Target traits supporting both production efficiency and environmental sustainability

Actionable Steps:

  1. Year 1: Implement a genomic testing program targeting BPI improvements from current baseline
  2. Year 2: Deploy sex-selected semen strategy on top-performing animals
  3. Year 3: Measure financial gains per animal and environmental impact reductions

2. Value-Added Export Evolution

Market Reality Check:

  • Infant formula struggles: Despite the overall export success, the infant formula market struggles with declining export returns
  • China market challenges: Birth rates in China reached record low of 1.09 in 2022, affecting long-term demand
  • Diversification opportunity: Focus on specialized ingredients and premium branded products commanding higher per-unit returns

Implementation Timeline:

  • Years 1-2: Genetic program shift toward components and specialty traits
  • Years 3-5: Processing infrastructure development for higher-value products
  • Years 5-7: Market development reducing dependence on commodity pricing volatility

3. Domestic Market Insurance Strategy

Evidence-Based Approach: Following Ireland’s model, where export success generates €17.6 billion while maintaining domestic economic integration.

Practical Implementation:

  • Stakeholder engagement: Develop relationships with local retailers, community leaders, and consumer groups as industry advocates
  • Government collaboration: Work with government efforts to address the supermarket duopoly through structural reforms
  • Risk mitigation: Build domestic market options for political protection against regulatory interference

Success Metrics:

  • Domestic economic multiplier effect measurement
  • Community relationship strength indicators
  • Political risk assessment and mitigation strategies

The Technology Integration Advantage

Current genomic selection research demonstrates unprecedented opportunities for balanced optimization. Studies show that genomic selection has allowed unprecedented advances in commercial breeding, including doubling dairy cattle improvement per generation compared to traditional selection.

Key Implementation Insights:

  • Cost efficiency: Any dairy breeding program using conventional progeny testing can implement genomic selection without increasing the level of investment
  • Accuracy improvements: Genomic selection increases accuracy for young non-phenotyped male and female candidates
  • Sustainability benefits: Breeding programs should optimize investment into phenotyping and genotyping to maximize return on investment

Mini Case Study: New Zealand Success The peer-reviewed study of genomic selection implementation in a 1,800-cow New Zealand herd provides concrete evidence of success :

  • Genetic progress: BPI increased from 136 to 184 between 2021 and 2023
  • Financial returns: NZD 17.53 per animal per year in immediate gains
  • Future projections: Expected gains rising to NZD 72.96 per animal per year by 2026
  • Accelerated improvement: Female genomic selection combined with sex-selected semen significantly accelerates genetic gain

The Bottom Line: Your Export Success Needs Domestic Foundation

The verified research tells us that export excellence without domestic sustainability is like optimizing milk production while ignoring somatic cell counts, fertility, and longevity. You might achieve impressive short-term numbers—New Zealand’s projected $25.5 billion export revenue—but you’re creating systemic problems that destroy long-term viability.

The data is unambiguous: While Fonterra reports record profits with 34% increases in operating profit, 9,000 more children have entered material hardship since 2018. When your industry’s crown achievement becomes a social crisis, you have a sustainability problem that no export revenue can solve.

The strategic imperative backed by peer-reviewed research: Future dairy success requires balancing export optimization with domestic market relationships, supported by genomic technologies delivering proven NZD 17.53-72.96 annual gains per animal while serving multiple stakeholder interests.

Why action matters now: Political and social pressures mount globally as child poverty rates climb and environmental costs accumulate. The New Zealand government is actively pursuing structural changes to address the supermarket duopoly, creating regulatory uncertainty for export-focused operators.

Your Next Step: Evidence-Based Stakeholder Audit

Immediate Actions (Next 30 Days):

  1. Benchmark your genomic selection program against the proven NZD 17.53-72.96 annual gains per animal demonstrated in peer-reviewed research
  2. Calculate your local economic multiplier effect using Ireland’s model, where 90 cents of every export euro circulates domestically
  3. Identify three non-farmer stakeholders who could become advocates rather than critics of your operation

Implementation Framework (90 Days):

  • Technology assessment: Evaluate genomic testing and sex-selected semen programs for immediate ROI
  • Market diversification: Develop domestic supply agreements providing pricing stability insurance
  • Stakeholder engagement: Schedule structured conversations with community leaders, retailers, and consumer groups

Strategic Positioning (1 Year):

  • Genetic program optimization: Target BPI improvements delivering verified financial gains
  • Market balance: Maintain export competitiveness while building domestic market resilience
  • Risk mitigation: Create political protection through broader stakeholder value creation

Because in an interconnected world where social media can turn local grievances into international news overnight, your export success story is only as strong as your reputation at home.

The Bullvine’s Challenge: Break the Export-First Mold

The evidence is overwhelming: While financially impressive, New Zealand’s $25.5 billion export model has created a social and environmental crisis that threatens the industry’s long-term sustainability. Peer-reviewed research demonstrates that environmental costs exceeded export revenue as early as 2012, yet the industry continues prioritizing short-term export gains over long-term viability.

Here’s your strategic choice: Will you learn from New Zealand’s evidence-based lesson and build truly sustainable operations using proven genomic technologies, delivering NZD 17.53-72.96 annual gains per animal, or will you repeat their mistakes until the hidden costs exceed your profits?

The data doesn’t lie. The choice is yours.

Your operation’s future depends on choosing correctly—because the most successful export strategies are worthless if they destroy your foundation at home.

Learn More:

Join the Revolution!

Join over 30,000 successful dairy professionals who rely on Bullvine Weekly for their competitive edge. Delivered directly to your inbox each week, our exclusive industry insights help you make smarter decisions while saving precious hours every week. Never miss critical updates on milk production trends, breakthrough technologies, and profit-boosting strategies that top producers are already implementing. Subscribe now to transform your dairy operation’s efficiency and profitability—your future success is just one click away.

NewsSubscribe
First
Last
Consent

Australia’s Cheese Strategy Exposes the Fatal Flaw in Your Volume-First Thinking

Stop believing the volume-first myth. Australia’s value-maximization strategy boosts exports 16.6% while imports surge—proving bigger isn’t better.

EXECUTIVE SUMMARY: Australia’s dairy processors just shattered the industry’s most sacred belief—that more milk automatically means more profit—by simultaneously boosting cheese exports 4.8% to 175,000 MT while importing a record 110,000 MT in 2025. This isn’t market failure; it’s strategic brilliance born from necessity, as constrained milk supplies forced a radical pivot from commodity cheddar to premium specialty cheeses commanding 44.5-fold price premiums in Asian export markets. While U.S. and EU producers still chase volume growth, Australian processors channeled their limited milk pool into 35% cheese production (49% of manufacturing milk), generating maximum revenue per liter through strategic market segmentation and trade agreement leverage. The China-Australia Free Trade Agreement eliminated 10-15% tariffs, providing unlimited preferential access that even beats New Zealand’s restricted quotas, while Southeast Asian markets like Vietnam (+35%) and Thailand (+44%) offer explosive diversification opportunities. This value-over-volume model proves that when you can’t produce more, you can still profit more—but only if you’re strategic about resource allocation, market positioning, and import-export integration. Every dairy operation facing land constraints, labor shortages, or input cost pressures needs to audit their product mix immediately: Are you maximizing value from your highest-quality milk, or still playing the losing volume game?

KEY TAKEAWAYS

  • Revenue Optimization Under Constraint: Australian processors increased cheese exports 16.6% above forecasts while milk production hits 30-year lows, proving strategic product allocation to premium markets can drive 2.7% production growth even with declining supply base—a critical lesson for operations facing land, labor, or regulatory constraints.
  • Market Segmentation ROI: By dedicating premium domestic milk to specialty cheese exports commanding higher international prices and strategically importing commodity cheese ($199.23M from New Zealand, $114.74M from U.S.), Australian operations freed up capacity for maximum-value production while maintaining domestic market supply—a model delivering measurable profit per liter improvements.
  • Trade Agreement Leverage: China-Australia Free Trade Agreement’s tariff elimination (10-15% advantage) plus unlimited preferential access (vs. New Zealand’s restricted quotas) directly drove China to become fastest-growing export destination, demonstrating how strategic trade positioning multiplies operational advantages beyond pure efficiency gains.
  • Diversification Strategy: Southeast Asian market growth (Vietnam +35%, Thailand +44%, Philippines +14% over five years) reduces export concentration risk while tapping middle-class dairy demand, providing blueprint for operations seeking to reduce dependence on single-market exposure and volatile pricing.
  • Supply Chain Integration: The dual-flow model—premium exports plus strategic imports—represents sophisticated supply chain management that maximizes resource utilization while meeting diverse market demands, offering immediate implementation opportunity for processors balancing premium production capabilities with commodity market obligations.
calf health, milk replacer, dairy farm profitability, calf diarrhea prevention, individual calf feeding

Australia’s pulling off what looks impossible—boosting cheese exports while importing record volumes in 2025. This isn’t market confusion. It’s the smartest strategic pivot in modern dairy history, and it’s about to teach every volume-obsessed producer on the planet what drives profitability when supply gets tight.

Here’s what’s happening Down Under that should make every dairy producer worldwide sit up and pay attention. While most of the industry still thinks bigger herds and more milk automatically equal better profits, Australia’s processors have cracked the code on something far more valuable: maximizing revenue per liter when you can’t maximize liters.

The Supply Reality Check That Changed Everything

Let’s start with the brutal truth that forced this transformation. FAS/Canberra forecasts reveal Australia’s milk production situation remains structurally constrained, with competing projections showing either minimal growth to 8.8 million metric tons or continued decline to 8.2-8.3 billion liters for 2025. What’s certain is that current production levels represent a 30-year low, sitting 24% below the peak production that supported the 2002 cheese production record of 413,000 MT.

But here’s where it gets interesting. Instead of panicking about shrinking supply, Australian processors did something radical: they pivoted from volume to value. FAS/Canberra forecasts cheese production to lift to 375,000 MT in 2025, a 2.7% increase that would mark the third-highest level on record. Cheese production now accounts for 35% of Australia’s total fluid milk production and 49% of all manufacturing milk.

Why This Matters for Your Operation

“Over the last decade, there has been a trend of milk processors channeling more and more milk towards cheese production at the expense of other processed dairy products,” according to the USDA Global Agricultural Information Network report. This isn’t an accident—that’s a strategy for responding to constraints.

Before you think this only applies to Australia, consider this: every dairy region faces some form of supply constraint, whether it’s land prices, labor shortages, environmental regulations, or input costs. The Australian model proves that you can still grow more profitable when you can’t grow bigger.

The Export Powerhouse Strategy

Australia’s cheese exports are forecast to reach varying levels in 2025, with different sources projecting between 150,000-175,000 MT. The comprehensive industry analysis reveals that first-quarter 2025 volumes jumped 13.1% year-over-year, with shipments rising to nearly all of Australia’s top ten export destinations.

Japan is Australia’s cornerstone export market; historically, it is the largest cheese destination in terms of value and volume. Australian Dairy Farmers data shows Japan imports over 80,000 tonnes of Australian dairy annually, of which over 80,000 tonnes are cheese, making Australia “the largest supplier of cheese” to Japan.

China has emerged as the fastest-growing market, driven by the China-Australia Free Trade Agreement (ChAFTA), eliminating 10-15% tariffs and providing unlimited preferential access—a critical advantage over New Zealand’s more restrictive agreement.

Here’s the strategic brilliance: Australian processors are shifting production away from commodity cheddar toward specialized, semi-hard, and premium cheeses that command higher prices internationally. They’re not just selling cheese—they’re selling Australian quality, safety, and “clean and green” provenance at premium prices.

The Import Imperative: Why Smart Strategy Creates Apparent Contradictions

Now, here’s where conventional thinking falls apart. Those same processors driving export growth are simultaneously increasing cheese imports, with FAS/Canberra projecting 110,000 MT in 2025—up 10% and the second-highest on record.

Critics might call this a failure. Wrong. It’s sophisticated supply chain management.

The USDA analysis explains: “New Zealand and the United States have historically supplied approximately three-quarters of all cheese imports to Australia. New Zealand remains the largest source, accounting for nearly half of all imports, while the United States typically supplies over a quarter”.

The strategic logic is clear: “The cheese imports from New Zealand and the United States are typically lower-value cheddar varieties, used primarily in the food processing sector. Meanwhile, Australian processors have increasingly focused on producing higher-value, specialized cheeses for export”.

What This Means for Your Operation

Think about your own product mix. Are you treating all milk the same? Australian processors proved that strategic product allocation—premium milk to premium markets, imports to fill commodity gaps—can drive higher overall profitability than trying to be everything to everyone.

The Trade Agreement Advantage (And How It’s Changing)

Australia’s success isn’t just about quality but smart trade positioning. ChAFTA gave them a decisive edge over the EU and US in China while providing better access than New Zealand’s more restrictive agreement.

But here’s the warning from Australian Dairy Farmers: advantages erode. Once provided exclusive benefits, the Japan-Australia Economic Partnership Agreement (JAEPA) is losing power as Japan signs deals with everyone else. “Over the last 5 years Australia has supplied (on average) over 100,000 tonnes of dairy per year into Japan,” but the competitive landscape is shifting as “Japan has completed and entered into force the Comprehensive and Progressive Trans Pacific Partnership (CPTPP) agreement… as well as the EU Japan Economic Partnership Agreement and more recently the USA Japan Trade Agreement”.

The lesson? Trade advantages are temporary. Brand reputation and operational excellence are permanent.

Financial Pressures Driving Innovation

The farmgate squeeze driving this strategic evolution is real and documented. The comprehensive industry analysis reveals that Australian farmers faced 10-15% milk price cuts during 2024/25, with some analyses showing earnings as low as $2.46 per hour. Feed costs have surged 40% since 2022.

Industry confidence has plummeted: “Only half of farmers express positive outlook, down from two-thirds the previous year. Less than two-thirds expect operating profits”. This isn’t sustainable under the old volume model.

Strategic Implications for Global Dairy

Australia’s cheese paradox reveals three critical insights for dairy producers worldwide:

Resource Optimization Beats Resource Maximization When supply is constrained, maximizing value per unit trumps maximizing units. The industry analysis confirms: “Unable to compete on sheer volume, Australian processors are increasingly channeling their limited milk resources into producing higher-value, specialty cheeses destined for lucrative export markets.”

Market Segmentation Is Everything. Don’t try to serve every market with the same product. The USDA data shows how Australian processors dedicate premium production to export while strategically importing commodity products for domestic food service.

Trade Positioning Multiplies Advantages Understanding and leveraging trade agreements create competitive advantages that pure efficiency can’t match, though these advantages require constant attention as competitive landscapes shift.

The SWOT Reality Check

The comprehensive industry analysis provides a formal SWOT assessment:

Strengths: Strong international reputation for quality, established export channels in Asian markets, ChAFTA advantage, growing expertise in specialty cheese production.

Weaknesses: Structurally constrained milk pool, high farm operating costs, export concentration risk in Japan and China, eroding JAEPA advantage.

Opportunities: Growing Southeast Asian demand, further value-added product development, and potential market openings from trade disruptions.

Threats: Intense global competition, continued farm viability pressure, potential economic slowdown, climate change impacts.

Actionable Implementation Framework

Based on the Australian model, here’s your step-by-step roadmap:

For Processors & Exporters:

  1. Conduct Value-Over-Volume Audit: Analyze your current product mix allocation. Are you channeling your best milk to your highest-margin opportunities?
  2. Implement Market Diversification Timeline: Establish 18-month targets for reducing concentration risk in any single export market
  3. Develop Integrated Import Strategy: Evaluate strategic sourcing opportunities that complement rather than compete with premium production

For Producers:

  1. Assess Premium Market Positioning: Calculate the price differential between commodity and premium milk contracts in your region
  2. Evaluate Efficiency Investments: The Australian data shows successful operations focus on “efficiency gains, diversification, and targeted technology investments.”
  3. Strengthen Supply Chain Relationships: Long-term processor partnerships become critical when supply is constrained

The Bottom Line

Australia’s cheese strategy isn’t just working—it’s revolutionizing how we think about dairy competitiveness under constraint. They’ve proven that limited supply doesn’t mean limited profits if you’re strategic about resource allocation.

The comprehensive industry analysis concludes: “Success in this environment is no longer a function of production scale alone; it is a measure of strategic agility, marketing prowess, supply chain sophistication, and the ability to navigate intense global competition.”

The Australian model offers a proven blueprint for dairy producers worldwide facing their own constraints: optimize for value, not volume. Segment your markets strategically. Leverage every competitive advantage you can find. And don’t be afraid to import what you can’t efficiently produce while focusing your best resources on what you do best.

The volume game is over. The value game is just beginning. Australia’s showing the way—the question is whether you’re ready to follow.

Action Items for Your Operation:

  • Complete product mix value analysis within 30 days
  • Benchmark your premium market access against regional competitors
  • Assess strategic sourcing opportunities that could free up capacity for higher-value production
  • Review trade agreement advantages in your key export markets

The Australians figured out that you make better when you can’t make more. Time to ask yourself: What’s your value maximization strategy?

Learn More:

Join the Revolution!

Join over 30,000 successful dairy professionals who rely on Bullvine Weekly for their competitive edge. Delivered directly to your inbox each week, our exclusive industry insights help you make smarter decisions while saving precious hours every week. Never miss critical updates on milk production trends, breakthrough technologies, and profit-boosting strategies that top producers are already implementing. Subscribe now to transform your dairy operation’s efficiency and profitability—your future success is just one click away.

NewsSubscribe
First
Last
Consent

The Great Dairy Market Split: Why Europe’s Playing Chess While America’s Playing Checkers

Stop believing the “more milk = lower prices” myth. USDA data reveals how strategic processing pivots create $1,700/tonne profit gaps.

EXECUTIVE SUMMARY: The dairy industry’s biggest lie just got exposed: European processors are deliberately engineering butterfat scarcity while American producers gear up for a production explosion—and the $1,700 per tonne arbitrage opportunity is reshaping global trade flows. This comprehensive market analysis reveals how Europe’s strategic “pivot to cheese” has created artificial fat shortages (butter at €7,500/tonne vs US $6,000/tonne) while flooding protein markets with co-products. The USDA’s June WASDE report shattered conventional wisdom by forecasting both higher US milk production AND higher prices simultaneously—a paradox that only explosive demand growth can explain. German milk production dropped 2.9% year-over-year while UK production surged 6.5%, creating a bifurcated European market where location determines profitability more than efficiency. European cheese indices exploded with Cheddar Curd up 30.9%, Mild Cheddar +29.6%, and Mozzarella +38.2% year-over-year, proving that processors who pivot to high-value products are printing money while commodity-focused operations struggle. The upcoming GDT Trading Event 382 will test whether Fonterra’s volume-focused strategy can withstand buyer resistance, potentially triggering corrections across the global powder complex. Every dairy farmer and processor must evaluate their component optimization strategy immediately—the market’s fundamental transformation from volume-based to value-based pricing is accelerating, and those who adapt fastest will capture the greatest rewards.

KEY TAKEAWAYS

  • Component Optimization Trumps Volume Strategy: European processors prioritizing cheese production over commodity powders are capturing €4,845/tonne for Cheddar Curd versus €2,443/tonne for SMP—a 98% premium that rewards strategic product mix decisions over raw milk volume.
  • Geographic Arbitrage Creates Massive Profit Opportunities: The $1,700 per tonne butter price differential between Europe (€7,500/tonne) and America ($6,000/tonne) represents the largest arbitrage opportunity in modern dairy markets—smart operators with export capabilities are already exploiting this gap.
  • Fat Genetics Become Profit Multipliers: With European butterfat commanding historic premiums while protein markets struggle, dairy operations optimizing for higher fat percentage through breeding and nutrition programs can capture significantly higher margins per litre in today’s bifurcated market.
  • Processing Flexibility Equals Competitive Advantage: Operations capable of pivoting between butter/powder and cheese production based on real-time component values will outperform traditional single-product facilities as market premiums continue diverging by 30-40% between product categories.
  • Supply Constraint Strategy Beats Volume Growth: Germany’s deliberate 2.9% production decline while maintaining premium pricing proves that strategic supply management can generate higher returns than volume expansion—a lesson for consolidating dairy regions worldwide.
global dairy market, component optimization, dairy processing strategy, dairy profitability, dairy market analysis

The global dairy market just served up another week of jaw-dropping contradictions that’ll separate the winners from the losers. Europe’s deliberate fat shortage strategy is printing money while America gears up for a production explosion—and if you’re not positioned for this collision, you’re about to get steamrolled.

Europe’s Billion-Dollar Chess Move

Here’s what the suits in Brussels won’t tell you: European processors just pulled off the most brilliant supply manipulation in modern dairy history. They’re deliberately starving the butter market to feed their cheese obsession, and it’s working like gangbusters.

Check these numbers—European butter futures closed the week at €7,500 per tonne while US butter trades around $6,000. That’s a staggering $1,700 arbitrage opportunity that smart operators are already exploiting. But here’s the kicker: this isn’t some temporary market hiccup. This is strategic genius.

Every litre of milk these European processors divert to cheese vats does two things simultaneously—it sucks valuable butterfat away from butter production while cranking out SMP as a co-product. EEX SMP futures are stuck at €2,443 per tonne, proving that Europe’s cheese strategy is creating artificial fat scarcity while flooding protein markets.

Why does this matter for your operation? Because component values are diverging like never before. If you’re still optimizing for total volume instead of fat percentage, you’re missing the biggest profit opportunity in decades.

The UK’s Record Flush: Blessing or Curse?

While continental Europe tightens the screws, the UK’s drowning in milk. April production exploded 6.5% year-over-year to 1,396 million litres—the kind of flush that would make any farmer jealous. But here’s the plot twist: this abundance is creating its own nightmare.

UK farm-gate prices dropped 1.2 pence per litre to 43.69 ppl while the rest of Europe enjoys historically high returns. Sometimes too much of a good thing really isn’t good. The UK’s glut is putting downward pressure on regional markets while continental processors maintain their premium pricing strategies.

What smart UK farmers are doing right now: They’re aggressively pursuing cheese-making contracts and premium markets instead of dumping milk into commodity channels. Location matters more than ever in this bifurcated market.

Germany’s Structural Decline Accelerates

Here’s the uncomfortable truth nobody wants to discuss: Germany’s dairy sector is deliberately contracting. Raw milk deliveries for January-April fell 2.9% year-over-year to 10.65 million tonnes, and this isn’t weather-related. This is policy-driven destruction of production capacity.

Environmental regulations, disease pressure, and economic constraints are systematically forcing German farmers out of business. Belgium’s situation is even worse, with collections down 4.5% year-over-year. These aren’t temporary dips—they’re the managed decline of European milk production.

The opportunity here? Every tonne of lost European production creates space for efficient global suppliers. The question is whether you’re positioned to fill that gap.

America’s Production Juggernaut Nobody’s Talking About

The June WASDE report just dropped a bombshell that most people completely misread. USDA raised both milk production forecasts AND price projections for 2025. Wait, what? More milk AND higher prices?

This apparent contradiction reveals something massive about underlying demand. The USDA’s betting that domestic consumption and export demand will be so robust it’ll absorb increased production while pulling prices higher. That’s an incredibly bullish signal for US dairy.

But here’s the strategic play: USDA raised fat-based export forecasts while cutting skim-solids projections. Translation? America’s coming hard for Europe’s butter business while Europe becomes the price-competitive powder supplier.

Tomorrow’s $50 Million Poker Game

All eyes focus on Tuesday’s GDT Trading Event 382, where Fonterra’s making a calculated gamble that could reshape global powder markets. Instead of cutting volumes after recent price weakness, they’re holding steady with 6,991 tonnes of WMP offered.

Recent auctions showed SMP dropping 4.4% and WMP falling 3.7%. Back-to-back weakness usually triggers supply cuts, not volume maintenance. Fonterra’s essentially betting everything on underlying demand strength.

If buyers step up tomorrow, it validates their volume strategy. If they don’t, we could see a powder correction that rewrites the entire complex.

The H5N1 Wild Card That Changes Everything

Here’s the controversy nobody wants to discuss: with over 1,072 dairy herds affected across 17 states and 41 human cases linked to dairy cattle exposure, the US government just cancelled $766 million in funding for Moderna’s H5N1 bird flu vaccine.

This decision abandons rapid-response vaccine technology for slower traditional platforms with 2029 approval timelines. If you’re betting on business as usual while H5N1 continues circulating in dairy herds, you might want to reconsider your risk management strategy.

What Winners Are Doing Right Now

The processors dominating this game share three characteristics:

Flexibility: They can pivot between butter/powder and cheese production based on real-time component values, not traditional patterns.

Global perspective: They’re sourcing fat from America for European markets, capturing that $1,700 arbitrage opportunity.

Component optimization: They’re prioritizing butterfat genetics and nutrition programs because higher fat content equals higher margins when fat commands premium pricing.

The Cheese Market’s Money-Printing Machine

European cheese indices continue validating the industry’s strategic pivot. Recent data showed Cheddar Curd climbing €116 (+2.5%) to €4,845, with year-over-year gains of 30.9%. These aren’t just prices—they’re proof of where the industry’s most valuable milk solids are flowing.

When processors can earn €4,845 per tonne for cheese versus €2,443 for SMP, the strategic choice becomes obvious. European milk is flowing to its highest-value destination, creating scarcity in fat markets and abundance in protein markets.

The Bottom Line

The global dairy market isn’t just changing—it’s being deliberately reshaped by strategic processing decisions that create massive winners and losers. Europe’s cheese pivot has engineered fat scarcity while America’s production growth threatens to flood global markets.

Your action plan starts now:

  • Evaluate your fat genetics immediately. Higher butterfat content equals higher margins in today’s market.
  • Assess your processing flexibility. Can you pivot between product categories based on component values?
  • Watch Tuesday’s GDT results like a hawk. The outcome signals whether underlying demand can support current price levels.
  • Consider forward contracting on powders while European processors flood the market with cheese co-products.

The dairy industry’s new normal isn’t about milk volume—it’s about where that milk goes and how you extract maximum value from every component. Europe’s strategic gamble is printing money for those who understand it. America’s production explosion creates both opportunity and risk.

The great divergence isn’t ending—it’s accelerating toward a fundamental reshaping of global dairy trade flows. Make sure you’re positioned on the winning side when the dust settles.

Learn More:

Join the Revolution!

Join over 30,000 successful dairy professionals who rely on Bullvine Weekly for their competitive edge. Delivered directly to your inbox each week, our exclusive industry insights help you make smarter decisions while saving precious hours every week. Never miss critical updates on milk production trends, breakthrough technologies, and profit-boosting strategies that top producers are already implementing. Subscribe now to transform your dairy operation’s efficiency and profitability—your future success is just one click away.

NewsSubscribe
First
Last
Consent

Export Surge Shields Dairy Markets from $7/Cwt Spot Milk Collapse as Global Buyers Drive Record Butter Trading

Stop chasing volume premiums while spot milk crashes $7/cwt. Smart producers capture export-driven component premiums worth $2-4/cwt extra.

EXECUTIVE SUMMARY: Most dairy producers are still breeding and feeding for yesterday’s domestic fluid milk market while 80% of U.S. milk actually goes into manufactured products optimized for export. Here’s the reality Wall Street missed: spot milk crashed $1-7 under class pricing this week, yet international buyers snapped up 135 butter loads at record trading volumes, driving CME butter to a five-month high at $2.57/lb. From 2011-2024, while U.S. milk production increased just 15.9%, protein climbed 23.6% and butterfat surged 30.2%—proving that component optimization, not volume, drives export competitiveness. With $8 billion in new processing capacity coming online by 2027, all designed around component-rich milk, and multiple component pricing programs placing nearly 90% of milk check value on butterfat and protein, the genetic selection revolution is creating $2-4/cwt premiums for operations that understand global arbitrage opportunities. While your neighbors chase cheap spot milk, you should be questioning whether your genetics program is optimized for export market requirements or stuck in domestic commodity thinking.

KEY TAKEAWAYS

  • Component Genetics Deliver Export Premium Capture: Operations achieving premium butterfat/protein levels are capturing $2-4/cwt above class pricing through processor partnerships, while traditional volume-focused producers miss export arbitrage opportunities worth millions annually.
  • Export-Driven Price Discovery Trumps Domestic Volatility: Despite $7/cwt spot milk crashes, record butter trading volumes (135 loads) and five-month price highs prove that global buyers view U.S. dairy as undervalued, creating sustainable pricing floors that domestic commodity metrics completely miss.
  • Genetic Selection Revolution Reshapes Profit Equations: With 90% of milk check value tied to components and $8 billion in new processing capacity designed for component-rich milk, breeding decisions made today determine whether operations thrive or struggle in the export-dominated dairy economy of 2027.
  • Feed Cost Arbitrage Amplifies Component Premium Returns: Current feed costs down 10.1% combined with component premiums create income-over-feed ratios that reward genetic optimization strategies, while traditional milk-to-feed cost calculations undervalue component-focused operations by 15-25%.
  • Global Competitive Positioning Demands Strategic Genetic Pivot: U.S. cheese and butter remain world’s cheapest despite recent rallies, but only operations with export-optimized genetics can capture the sustainable competitive advantages that international markets reward with premium pricing.
dairy export markets, component optimization, CME dairy prices, butterfat protein premiums, dairy genetics profitability

Here’s what Wall Street analysts missed this week: While spot milk prices crashed $1-7 under class pricing across the Central region, international buyers snapped up 135 butter loads—one of the highest weekly trading volumes on record—pushing CME spot butter to a five-month high at $2.57/lb. This isn’t just market noise; it’s proof that America’s dairy sector has fundamentally repositioned itself as the world’s low-cost provider, creating an export-driven floor that’s reshaping profitability equations for every operation from 50-cow herds to 5,000-cow complexes.

The Reality Check Nobody’s Talking About

Let’s face it—when spot milk is trading $7 under class, and your butter buyers are still lining up like it’s Black Friday, something fundamental has shifted in global dairy economics. The June 13th CME session delivered a masterclass in a market bifurcation that most producers are completely missing.

Here’s the disconnect: While Cheddar blocks retreated 2¢ to $1.8375/lb and barrels fell 2.5¢ to $1.835/lb, butter markets witnessed institutional accumulation at levels that would make commodity traders jealous. That 7:1 bid-to-offer ratio during peak trading sessions? That’s not speculation—that’s global supply chain managers securing inventory at prices they consider bargains.

Why should you care? This dynamic creates profit opportunities that traditional milk-to-feed cost ratios completely miss. As dairy farmers leverage their genetics programs to select animals for traits associated with milk component levels, there is untapped potential for how high butterfat and protein percentages can go. And there’s a clear financial incentive—multiple component pricing programs place nearly 90% of the milk check value on butterfat and protein.

When “Cheap” American Dairy Becomes the World’s Premium Play

The conventional wisdom that low prices hurt profitability just got demolished by global market realities. Despite recent rallies, U.S. cheese and butter remain the cheapest in the world—a positioning that’s attracting international buyers who view American dairy as undervalued relative to European and Oceanic alternatives.

Consider New Zealand’s situation: They’re commanding record milk prices of 10 NZ$ per kg of fat and protein, exceeding their previous 2021-2022 record. Meanwhile, European Union production is declining by 0.2% as regulatory pressures and shrinking herd sizes create structural supply constraints.

Here’s the genetic revolution most producers are ignoring: From 2011 to 2024, while U.S. milk production increased just 15.9%, protein climbed 23.6%, and butterfat increased 30.2%. This isn’t accidental—the result of targeted genetic selection optimizing American dairy for export competitiveness.

What does this mean for your operation? You’re competing in a global arbitrage opportunity where efficiency gains translate directly into competitive advantages that international buyers are willing to pay premiums to access. But here’s the kicker—most producers are still breeding for yesterday’s domestic fluid milk market when over 80% of the U.S. milk supply goes into manufactured dairy products.

The Component Optimization Revolution That’s Leaving Traditional Dairies Behind

Here’s where seasonal dynamics get interesting and where genetic strategy becomes your competitive weapon. Warm weather tightens cream supplies precisely when ice cream production ramps up, pushing cream multiples higher from spring lows—though they remain well below historic averages.

The tactical reality: Butter churns aren’t running as hard as they were two months ago, yet demand remains robust enough to support record trading volumes. This suggests that component optimization strategies focusing on butterfat percentages could deliver outsized returns during this supply-demand imbalance.

But here’s what the USDA projections aren’t telling you: $8 billion of new dairy processing capacity is slated to come online through 2027, all designed around component-rich milk. Are you positioning your genetics program to capture this massive infrastructure investment, or are you still optimizing for volume?

Smart producers are already adjusting both rations and breeding decisions to maximize component production during this seasonal window. Are you?

School’s Out, Cheese Vats Full: The Export Arbitrage Most Producers Miss

With school milk programs on hiatus and bottlers reducing milk purchases, cheese manufacturers find themselves with abundant, heavily discounted raw material. USDA’s Dairy Market News confirms that milk volumes and components aren’t fading as quickly as expected—a direct result of low feed prices and high milk prices encouraging producers to maintain aggressive feeding programs.

This creates an interesting dynamic: Spot milk availability in the $1-7 under class range in the Central region, combined with “formidable international prices,” preventing steep selloffs in finished products.

Here’s the genetic angle that changes everything: While your neighbors chase volume premiums on cheap spot milk, forward-thinking operations leverage component genetics to capture export premiums. “US supply expansion is expected in 2025, but it’s likely to be modest at sub-1%,” notes Michael Harvey, RaboResearch senior dairy analyst. This limited volume growth and component-rich genetics create a perfect storm for premium capture.

The opportunity: Operations with direct-to-processor relationships AND component-optimized genetics can capitalize on this arbitrage between cheap input costs and stabilized output pricing.

Feed Cost Revolution: The Hidden Profit Driver

While everyone’s focused on milk prices, the real story is unfolding in feed markets. USDA projects feed costs down 10.1% in 2025, with corn futures settling at $4.44/bushel despite strong export demand and reduced ending stocks.

The critical insight the USDA missed in their latest revision: They’ve cut the 2025 all-milk price forecast to $21.10 per cwt, down $0.50 from last month’s forecast. But they’re not accounting for the genetic component revolution that’s reshaping the profit equation.

July corn trading higher than December contracts signals immediate supply tightness, but current levels remain manageable compared to recent years. This backwardation in grain markets suggests temporary price support rather than sustained uptrends—exactly the environment where aggressive component-focused feeding programs maximize returns.

Global Trade Dynamics: Reading the Export Tea Leaves

The whey powder decline to 55.25¢ tells a story that goes beyond simple supply-demand mechanics. Chinese demand—traditionally our largest foreign market—remains “hit or miss” as the maintained 10% tariff influences trade flows. Meanwhile, Southeast Asian buyers maintain consistent interest, creating geographic diversification opportunities.

But here’s what’s happening: Chinese dairy imports in 2025 are projected to be higher than in 2024, though the country no longer has the same dominant influence over the global dairy market. This shift is creating opportunities for operations that understand component export dynamics.

Strategic implications: Operations focusing on products with strong Southeast Asian demand profiles may capture better margins than those dependent on Chinese market fluctuations. But the real winners will be those who’ve optimized their genetics for the specific component profiles these export markets demand.

The bigger picture? U.S. dairy’s global competitive positioning has fundamentally improved. Even after significant spring and early-summer rallies, American products maintain price advantages that create sustainable export floors.

Class III Reality Check: Genetics Trump Price Forecasting

July Class III futures falling 75¢ to $18.15/cwt might seem concerning until you consider the USDA’s broader disconnect from reality. Their latest forecast shows Class III at $17.60 and Class IV at $18.20 per hundredweight—projections that completely ignore the component premium revolution reshaping dairy economics.

Here’s what USDA’s Washington analysts are missing: While they’re forecasting modest price increases, the real money is in component optimization. Operations achieving premium component levels are already capturing $2-4/cwt premiums over class pricing through processor partnerships focused on export-quality milk.

The producer reality: Current milk prices, combined with declining feed costs and component premiums, generate income-over-feed ratios supporting continued herd expansion. Dairy producers have added significant cow numbers in the first half of 2025, and plan continued growth.

But here’s the strategic question most operations aren’t asking: Are you expanding with genetics optimized for 2025’s export-driven component premiums, or are you still breeding for yesterday’s domestic commodity market?

What This Means for Your Operation

Stop managing your dairy like it’s a domestic commodity business. The market dynamics described above represent a fundamental shift toward export-driven price discovery that rewards efficiency and component optimization over simple volume production.

Immediate action items:

  1. Genetic Strategy Overhaul: Prioritize sires with proven component genetics—specifically those with high fat/protein percentages that match export processor specifications
  2. Component Optimization: Focus feeding programs on butterfat percentage during the seasonal cream supply squeeze while maintaining protein levels
  3. Risk Management: Use the current backward dated grain markets to forward-contract feed costs at favorable levels
  4. Market Positioning: Evaluate direct-to-processor relationships that capture both spot milk discounts AND component premiums

The strategic reality: Operations that adapt to export-driven price discovery while optimizing genetics for component production will capture margin opportunities that volume-focused competitors miss.

The Bottom Line: Darwin’s Dairy Market

This week’s market action reveals a dairy industry in a fundamental transition from domestic commodity pricing to global arbitrage opportunities driven by genetic optimization. While spot milk crashes locally, international buyers demonstrate sustained confidence in American dairy’s competitive positioning through record trading volumes and premium valuations.

As IDFA CEO Michael Dykes declares, “This isn’t about surviving 2025—it’s about dominating 2030”. With global dairy demand growing 2.3% annually and $8 billion in new processing capacity coming online by 2027, the operations that thrive won’t be those chasing yesterday’s volume metrics.

The winners in this new paradigm won’t be the operations chasing yesterday’s milk-to-feed ratios—they’ll be the producers who recognize that genetic selection for component optimization now translates directly into global competitive advantages that international markets reward with premium pricing.

Your next strategic decision: Are you positioning your genetics program to capture these export-driven component opportunities, or are you still breeding like it’s a domestic commodity business? Because let’s be honest—the global dairy market just told you exactly where the smart money is placing its bets, and it’s not on volume production.

The evolution has begun. Will your operation adapt, or will you become extinct in the new dairy economy?

Learn More:

Brace for Impact: Why 2025’s Dairy Price Surge Masks a $780 Billion Industry’s Perfect Storm

Stop chasing herd expansion. Smart farmers optimize components over volume—boosting profits 15% while competitors face the 2025 recalibration.

EXECUTIVE SUMMARY: The dairy industry’s current price euphoria is masking a dangerous supply-demand collision that will blindside unprepared operators by Q4 2025. While Oceania WMP hits $4,300/MT and producers celebrate record milk checks, RaboResearch warns that accelerating supply growth (326.7 million metric tons from Big 7 regions) is about to crash into crumbling consumer confidence (52.2 sentiment index, down 24.5% YoY). The most damaging myth? That bigger operations automatically mean better profits. Smart farmers are already pivoting from volume obsession to component optimization, with butterfat levels hitting a 76-year record of 4.23% nationally and milk solids production jumping 1.65% in March 2025. While 80% of dairy leaders expect volume growth above 3%, the math is brutal: a farm producing 75,000 pounds daily at 4.3% butterfat generates higher returns than one producing 80,000 pounds at 3.8% butterfat. This “recalibration” will separate the strategic operators who prepare now from those still betting on the bull run. Your move: stress-test your operation for milk prices 15-20% below current levels—because that’s exactly where the fundamentals are heading.

KEY TAKEAWAYS

  • Component Revolution Beats Volume Obsession: Farms optimizing butterfat and protein content achieve 12-15% higher income over feed costs compared to expansion-focused operations, with genetic improvements delivering 22.9% protein growth and 28.9% butterfat increases since 2011—making the “more cows, more money” mentality obsolete.
  • Technology Reality Check Saves $250K: Before adding 100 cows at $2,500 each, invest that $250K in genetic improvements and precision feeding to boost butterfat from 3.8% to 4.3%—generating higher returns with zero additional labor, feed costs, or environmental compliance while robotic milking success stories show $1.00-$1.50/cwt profitability gains only under optimal conditions.
  • Trade War Timing Creates Export Vulnerability: Strong Q1 2025 dairy exports occurred before China’s 125% retaliatory tariffs and Canada’s 25% tariffs hit full force—smart operators are diversifying market exposure now while building cash reserves during the current price strength to weather the H2 2025 recalibration.
  • Consumer Confidence Collapse Demands Strategy Shift: With 38% of consumers saying high prices have eroded their finances and affordability concerns surpassing job security worries, dairy companies face the brutal reality that passing higher costs to post-COVID inflation-weary consumers will trigger volume losses—requiring immediate focus on value propositions over premium pricing.
  • Financial Stress-Testing Reveals Survival Strategy: Operations modeling scenarios with milk prices 15-20% below current levels by Q4 2025 can identify critical weaknesses now—high-performing dairies already achieve $3.50/cwt advantage in income over feed costs through systematic resource optimization rather than scale expansion, positioning them for the coming market adjustment.
dairy market outlook, milk price forecast, component optimization, dairy profitability strategies, global dairy trends

The global dairy market’s current strength is a dangerous mirage. While commodity prices hit multi-year highs, accelerating supply growth is about to collide with crumbling consumer confidence and escalating trade wars. Smart operators who recognize this paradox and pivot their strategies now will survive the “recalibration” that’s coming – those who don’t risk getting crushed when fundamentals reassert themselves in H2 2025.

You’re probably feeling pretty good about dairy right now. Oceania whole milk powder just smashed through $4,300 per metric ton for the first time since April 2022. Fonterra’s announcing record forecast prices of NZD 10/kgMS for 2025/26. The U.S. dairy industry just flexed its economic muscle with a staggering $780 billion impact supporting over 3 million jobs.

But here’s the uncomfortable truth that’s about to blindside unprepared operators: this party’s built on quicksand.

Why Are Smart Money Managers Already Hedging Their Bets?

Here’s a question that should keep you awake tonight: If prices are so strong, why is RaboResearch warning about “downside risks emerging in the second half of the year”?

The numbers tell a story that most operators aren’t hearing over the sound of strong milk checks. RaboResearch’s latest Global Dairy Quarterly reveals a fundamental paradox that should keep every strategic planner awake at night.

Milk production across the “Big 7” exporting regions grew a modest 0.5% in Q1 2025. Sounds manageable, right? Dead wrong.

That growth is about to explode. Production will accelerate to 1.1% in Q2 and 1.4% in Q3 – the strongest quarterly increase since early 2021. We’re looking at 326.7 million metric tons of milk production from the Big 7 in 2025, representing the highest annual volume gain since 2020.

Meanwhile, consumer sentiment is cratering. The University of Michigan’s Consumer Sentiment Index hit just 52.2 in May 2025 – a brutal 24.5% decrease year-over-year from 69.1 in May 2024. About 64% of consumers expect business conditions to worsen in the year ahead, with 38% saying high prices have eroded their personal finances.

The math is simple but devastating: Accelerating supply + fragile demand = unsustainable prices.

Challenging the Expansion Obsession: Why Bigger Isn’t Always Better

In dairy thinking, let’s challenge a sacred cow: the relentless pursuit of herd expansion and volume growth. While conventional wisdom pushes farmers toward larger operations, recent data suggests this strategy is fundamentally flawed in today’s market reality.

The USDA projects U.S. cow numbers to increase by 20,000 head by year-end 2025, pushing total milk production to 226.9 billion pounds. But here’s what the expansion enthusiasts aren’t telling you: unprecedented genetic gains are making this volume-focused approach obsolete.

According to Hoard’s Dairyman analysis, butterfat levels charged to 4.23% nationally in 2024, breaking through the 4% ceiling and besting a 76-year-old record. With nearly 90% of U.S. milk valued under multiple component pricing, genetic gains in butterfat and protein are pushing milk checks higher than simple volume increases ever could.

The evidence is staggering: Milk solids production increased by 1.65% as of March 2025, demonstrating that smart farmers are already prioritizing components over raw volume. This represents a fundamental shift from the “more cows, more milk, more money” mentality that has dominated dairy thinking for decades.

Consider this scenario: Farm A adds 100 cows at $2,500 each ($250,000 investment) to increase volume by 8%. Farm B invests $250,000 in genetic improvements and precision feeding to boost butterfat from 3.8% to 4.3%. With component premiums, Farm B generates higher returns with zero additional labor, feed costs, or environmental compliance issues.

The University of Wisconsin-Madison’s Center for Dairy Profitability shows that farms focusing on component optimization rather than volume expansion achieve 12-15% higher income over feed costs compared to expansion-focused operations.

What’s Driving This Supply Explosion While Nobody’s Watching?

The United States is leading the charge with a dairy cow inventory that grew by 2,500 head to 9.349 million as of January 2025. But here’s what’s telling: this expansion is happening in the wrong places at the wrong time.

According to Hoard’s Dairyman analysis, April milk production rose 1.5% year-over-year, the largest gain since August 2022, driven by a larger herd and improved yields. This marks a turning point, as 2025 is expected to deliver the first full-year production growth since 2021, with RaboResearch expecting an output gain of 1.4% over 2024.

The European Union is taking a completely different approach. EU milk deliveries are projected to decline 0.2% to 149.4 million metric tons as farmers grapple with declining cow numbers, tight margins, and escalating regulatory costs. But, they prioritize cheese production at the expense of butter, non-fat dry milk, and whole milk powder.

Here’s the kicker: While total global milk volume increases, specific product categories like EU butter and WMP might experience tighter supply. This creates commodity-specific vulnerabilities that most operators aren’t prepared for.

Region2025 Production ForecastStrategy FocusKey Vulnerability
United States+0.5% growthHerd expansion & efficiencyTariff impacts on exports
European Union-0.2% declineCheese prioritizationRegulatory compliance costs
Australia-1.0% declineCost managementWeather & farm exits
China-1.5% declineDomestic consolidationEconomic slowdown

Why Is Consumer Demand Cracking Under Pressure?

While producers ramp up, consumers are tapping out. Mary Ledman from RaboResearch isn’t mincing words about “near-record-low consumer confidence in the US” weighing heavily on demand.

But here’s where conventional dairy marketing completely misses the mark. The University of Michigan data shows that less than half of consumers expect their own incomes to grow in the year ahead, down from nearly 60% six months ago. This represents a fundamental shift in consumer psychology that dairy companies haven’t adequately addressed.

China’s Demand Shift Changes Everything

China’s dairy consumption dropped 5.6% in 2024, with the average person consuming 41.5 kilograms of dairy. But here’s what’s really happening: China’s dairy market contracted to $49.3 billion in 2024, standing approximately at the previous year’s level after hitting a maximum of $51.7 billion in 2022.

This isn’t just a temporary blip. Chinese consumers are fundamentally reshaping their dairy preferences around snacking and fitness trends. According to IndexBox market analysis, consumption of dairy produce decreased by 3.2% to 50 million tons in 2024, marking the first decline after six years of growth.

Rabobank expects China’s net imports of dairy products to rise by a modest 2% in 2025, with most of this increase anticipated in the latter half of the year as domestic stocks weaken. New Zealand continues to dominate China’s total dairy import basket (46% in 2024), followed by the EU (31%).

The Trade War Wild Card

The elephant in the room? Escalating trade tensions that are reshaping global dairy flows in real-time.

China slapped retaliatory tariffs on U.S. agricultural products starting March 10, 2025 – beginning at 10% and rapidly escalating to 125% by April 12. Canada imposed a 25% tariff on approximately CA$30 billion worth of U.S. products, which specifically included $212 million of U.S. dairy products.

The critical timing issue is that the strong U.S. dairy exports we saw through Q1 2025 occurred before these tariffs hit full force. The real impact on export volumes and profitability will show up in Q2 and Q3 data when supply is accelerating.

According to Fortune analysis, America exported about $8.2 billion of dairy products in 2024, the second-highest on record. More than half of U.S. dairy exports are shipped to Mexico, Canada, and China, all of which have been targeted by Trump’s tariff policies.

Disrupting the “Technology Will Save Us” Narrative

Another sacred cow that needs slaughtering is the blind faith that technology automatically equals profitability. While industry publications breathlessly promote every new gadget, the reality is far more nuanced.

Consider the robotic milking revolution everyone’s talking about. Progressive Dairy research shows that robotic systems cost approximately $200,000 per machine, with experts calculating the ideal number of cows at around 500 to economically justify the switch. But the hidden costs include:

  • Staff retraining requirements that can take 6-18 months
  • Technical backup protocols when systems fail (and they will)
  • Integration challenges with existing infrastructure

However, success stories exist when properly implemented. California operations report being $1.00 to $1.50 per hundredweight more profitable with robotic milking systems when all factors are optimized. However, these cases represent carefully selected early adopters with optimal conditions – not the average dairy operation struggling with tight margins and limited technical expertise.

The key insight from Cornell University extension research is that robotic milkers make sense for small- and medium-sized farms primarily because of labor challenges and outdated infrastructure, not because the technology itself guarantees profitability.

How Are Current High Prices Setting Up the Fall?

Dairy commodity prices have surged to multi-year highs, but RaboResearch’s core message is explicit: the “current market strength [is] not sustainable.”

Mary Ledman warns that “dairy companies and downstream multinational consumer packaged goods companies will find it challenging to pass on higher dairy costs to consumers still grappling with post-COVID inflation.”

The “Recalibration” Reality Check

RaboResearch isn’t predicting a crash – they’re forecasting something potentially more dangerous: a “recalibration from recent multiyear highs – a natural correction following a period of strong performance.”

The fundamentals are clear: expanding supply is about to meet uncertain demand while trade tensions create additional volatility. High commodity prices aren’t sustainable when you’re fighting math and consumer psychology.

Supporting this thesis, the USDA has already reduced its milk production estimate for 2025 to 226.2 billion pounds, a decline of 700 million from February projections. The average all milk price is estimated at $21.60 per hundredweight, with the 2026 forecast at $21.15 per cwt.

Are you prepared for milk prices 15-20% below current levels by Q4 2025? Because that’s exactly the scenario smart operators are planning for right now.

Breaking the Commodity Mindset: The Component Revolution

Here’s where we need to fundamentally challenge how dairy farmers think about their business. The obsession with per-cow averages and total volume is a relic from an era when milk was milk. Today’s reality demands a complete strategic overhaul.

According to Hoard’s Dairyman analysis, genetic improvements fuel historic gains in key milk components needed to produce cheese, butter, and specialty dairy foods. Butterfat posted its fourth-straight annual record, charging to 4.23% nationally in 2024.

This isn’t just incremental improvement – it’s a fundamental market transformation. From 2011 to 2023, while milk production grew by just 16.2%, protein jumped by 22.9%, and butterfat catapulted by 28.9%.

The math is compelling: A farm producing 80,000 pounds of milk daily at 3.8% butterfat generates significantly less revenue than a farm producing 75,000 pounds at 4.3% butterfat. The component premiums more than offset the volume difference.

Corey Geiger with CoBank confirms this trend: “In the last three years, milk production that counts the water in it hasn’t been growing, but components have been growing two to three percent a year.”

What Should Strategic Operators Be Doing Right Now?

Smart dairy operators need to prepare for this recalibration now, not after it hits. The convergence of accelerating supply growth, fragile consumer demand, and escalating trade tensions is setting up a correction that could catch unprepared operators off guard.

Optimize for Efficiency, Not Volume

The operators who thrive will be those who focus on efficiency gains rather than volume expansion. With supply accelerating globally, the competitive advantage will go to those who can produce at the lowest cost per unit.

Research from Progressive Dairy shows that high-performing dairies achieve a $3.50 per hundredweight difference in income over feed cost compared to average operations. This gap isn’t about technology – it’s about systematic optimization of existing resources.

Focus on High-Value Milk Components

The 1.65% increase in U.S. milk solids production shows where the smart money is going. Operators should prioritize butterfat and protein content that command premiums in manufactured dairy products.

According to research by the Journal of Dairy Science, genetic improvements in butterfat and protein rank among the most heritable traits for dairy cows. The Council of Dairy Cattle Breeding reports that annual rates of genetic improvement have doubled since 2012 when genomic selection became available.

Diversify Market Exposure

The trade war data shows how quickly export markets can shift. Operators need to reduce dependence on volatile export markets and strengthen direct-to-consumer channels to capture more value.

Strengthen Financial Positioning

With a recalibration coming, operators need stronger balance sheets. This isn’t the time for aggressive expansion financing – it’s the time to build cash reserves and reduce debt exposure.

The Technology Integration Reality Check

Let’s address the elephant in the barn: Most dairy technology implementations fail not because the technology doesn’t work but because farmers approach adoption with unrealistic expectations.

Recent research on dairy management decisions shows that high-performing herds focus on optimal management practices rather than simply adopting the latest technology. A study involving 60 progressive herds nationwide from 2019 to 2024 revealed that management decisions such as voluntary waiting periods and days dry have more impact on productivity than technology alone.

Key success factors include:

  • Phased implementation starting with one system and expanding gradually
  • Staff buy-in through comprehensive training and involvement in selection
  • Data literacy development to actually use the insights technology provides
  • Backup protocols for when systems inevitably fail

The future favors farms that blend innovation with proven practices, not those that chase every technological fad.

Regional Production Strategies Create New Vulnerabilities

This regional divergence creates specific commodity vulnerabilities. EU’s focus on cheese means a tighter supply for butter, NDM, and WMP – even as total milk volume increases globally. Australia’s continued contraction is creating “dairy deserts” in some regions.

The U.S. dairy sector has demonstrated the ability to adjust and maintain competitiveness. According to Hoard’s Dairyman, U.S. cheese exports have outperformed expectations due to lower prices relative to the European Union, making U.S. products more attractive globally. But, this competitive advantage could evaporate quickly if domestic production costs continue rising or if trade barriers expand.

Here’s the critical question: Are you positioning your operation for these regional shifts, or are you still operating under outdated assumptions about global market stability?

Emerging Markets: The Overlooked Wildcard

Here’s where most analysis falls short: The focus on traditional “Big 7” regions ignores the seismic shifts happening in emerging dairy markets that could reshape global trade flows.

India’s dairy sector, while primarily domestic-focused, is experiencing rapid modernization that could impact global ingredient markets. The country’s milk production reached 231 million tons in 2024, making it the world’s largest producer. As Indian operations achieve greater efficiency, their domestic ingredient needs could reduce global demand for certain categories.

Southeast Asian markets are demonstrating explosive growth in premium dairy consumption, driven by rising middle-class incomes and changing dietary preferences. Vietnam’s dairy imports grew 23% in 2024, while Thailand and Indonesia showed similar double-digit growth patterns. These markets represent the future of dairy demand growth – but they’re increasingly sophisticated buyers who demand specific product attributes.

The implications are profound: Traditional commodity-focused strategies may miss the most profitable growth opportunities in emerging markets that prioritize quality, traceability, and specific functional properties over simple volume.

The Bottom Line

Remember that feeling of confidence when you saw Oceania WMP prices hit $4,300 per metric ton? That optimism is exactly what RaboResearch is warning against with their “Too Good to Be True?” assessment.

The current dairy market strength is built on foundations that are rapidly shifting beneath our feet. While commodity prices hit multi-year highs, the convergence of accelerating supply growth (326.7 million metric tons from Big Seven regions), fragile consumer demand (52.2 consumer sentiment index), and escalating trade tensions (125% Chinese tariffs) is setting up a “recalibration” that could catch unprepared operators off guard.

The warning signs are flashing bright red: consumer confidence is weak, supply is accelerating, and trade wars are reshaping global flows. This isn’t the time for aggressive expansion – it’s the time for strategic positioning.

The smart money isn’t betting on continued price strength – it’s preparing for the correction that’s coming. Those who recognize this paradox and adjust their strategies accordingly will emerge stronger when the dust settles.

Your immediate action plan:

  1. Run the numbers: Pull up your operation’s Q3 and Q4 2025 financial projections. Model scenarios with milk prices 15-20% below current levels. If those numbers make you uncomfortable, you know exactly what needs to change.
  2. Optimize components over volume: Shift breeding and management focus toward butterfat and protein optimization. The genetic tools exist – use them.
  3. Stress-test your cash flow: Build reserves now while prices are strong. The recalibration will reward those with financial flexibility.
  4. Diversify market exposure: Reduce dependence on volatile export markets. Strengthen local and regional relationships.
  5. Technology reality check: Evaluate tech investments based on actual ROI, not marketing promises. Focus on tools that enhance decision-making, not replace human judgment.

The dairy industry’s $780 billion economic engine will keep running – but only the operators who prepare for turbulence ahead will maintain their position when the market finds its new equilibrium.

The choice is yours: Continue riding the current wave of optimism, or position yourself for the inevitable recalibration. History shows that the farmers who survive market corrections are those who prepare while others celebrate.

Are you positioning for the recalibration, or are you still betting on the bull run?

Learn More:

Join the Revolution!

Join over 30,000 successful dairy professionals who rely on Bullvine Weekly for their competitive edge. Delivered directly to your inbox each week, our exclusive industry insights help you make smarter decisions while saving precious hours every week. Never miss critical updates on milk production trends, breakthrough technologies, and profit-boosting strategies that top producers are already implementing. Subscribe now to transform your dairy operation’s efficiency and profitability—your future success is just one click away.

NewsSubscribe
First
Last
Consent

NMPF Slashes Export Fees 50% While Doubling Down on Global Dairy Domination

NMPF just gambled your milk check on exports while abandoning supply management. 50% fee cut, 595% export surge—or dangerous vulnerability?

EXECUTIVE SUMMARY: The dairy industry just executed its most radical strategic gamble in decades, and most producers don’t realize they’re already playing a game where the rules change overnight. NMPF’s new NEXT program slashes export assessments 50% while betting everything on global markets that generated 595% cheese export growth to Central America and pushed Latin America to a record 41% share of U.S. dairy exports worth billions. But here’s the uncomfortable truth nobody’s discussing: this export-first strategy launches into the most volatile trade environment in history, where Colombia threatens $70 million in dairy exports and China maintains 135% tariffs that can eliminate markets instantly. With 17% of U.S. milk already flowing overseas—up from 13% in 2010—the industry has crossed the point of no return from domestic supply management to global market dependence. Every producer now faces a critical choice: embrace the 2-cent-per-hundredweight investment in NEXT’s targeted market strategy, or watch competitors capture the international opportunities that increasingly determine your milk price.

KEY TAKEAWAYS

  • Cut export costs by 50% while doubling market reach: NEXT’s 2-cent-per-cwt assessment (down from 4 cents) expands product eligibility to all cheese varieties, ESL milk, ice cream, and specialty proteins—positioning your operation for Latin America’s $441 million market surge under CAFTA-DR tariff elimination
  • Capture 595% export growth opportunities in targeted regions: Central America cheese exports exploded under strategic trade agreements, while Southeast Asia pilot programs for value-added skim milk powder and Indonesia’s $245 million market offer immediate diversification beyond volatile domestic pricing
  • Navigate $70 million in geopolitical export risks: Colombia’s tariff threats and China’s 135% duties expose the dangerous reality that export success depends as much on diplomatic stability as market development—requiring strategic hedging across multiple international markets
  • Leverage operational flexibility for competitive advantage: Extended delivery periods and removed volume limits under NEXT enable rapid response to international demand fluctuations, while existing stockpiled H5N1 vaccines “don’t match current strains,” highlighting the need for agile market positioning
  • Balance export acceleration against domestic market vulnerability: With milk production outpacing domestic consumption and 17% of U.S. milk already exported, the fundamental question isn’t whether to participate in global markets—it’s whether your operation can afford to ignore the 2028 timeline that positions exports as essential for long-term profitability
dairy exports, cooperative funding, export market access, dairy profitability, international dairy trade

The National Milk Producers Federation just pulled off the dairy industry’s most audacious strategic pivot in decades – cutting member assessments in half while turbocharging export ambitions through their new NEXT program. Starting July 1, this isn’t just an evolution of the old CWT model; it’s a complete reimagining of how American dairy conquers global markets.

The numbers tell a story that should make every dairy producer sit up and take notice. While you’ve been paying 4 cents per hundredweight for the Cooperatives Working Together program, NEXT drops that to just 2 cents per cwt through 2028 – but don’t mistake this cost-cutting for corner-cutting. This is surgical precision applied to global market domination.

Why NMPF Ditched the Old Playbook

Let’s face it: the dairy export game has fundamentally changed since CWT launched in 2003. Back then, supply management through herd retirement made sense when the industry was smaller and more predictable. Today? U.S. milk production keeps outpacing domestic consumption, and trying to manage that through domestic supply controls is like trying to empty Lake Superior with a garden hose.

The data backs up this strategic shift. CWT facilitated exports of 58.4 million pounds of American-type cheeses, 1.1 million pounds of butter, 46,000 pounds of anhydrous milkfat, and 39 million pounds of whole milk powder in 2023 alone. The proportion of U.S. milk shipped overseas jumped from 13% in 2010 to 17%.

Here’s the reality check: when your export markets are exploding while you’re still trying to manage domestic supply, you don’t need a supply management program – you need an export acceleration program.

NEXT’s Secret Weapon: Surgical Market Targeting

The most impressive aspect of NEXT isn’t just what it includes – it’s how precisely it targets specific products for specific regions. This isn’t the old shotgun approach of “let’s export anything to anywhere.”

The program now covers all cheese varieties, extended shelf life fluid milk, evaporated and condensed milk, ice cream, specialty proteins, and milk powders – a massive expansion from CWT’s limited product scope. But here’s where it gets interesting: NEXT specifically targets cheese and butter for Latin America while focusing on specialty proteins and milk powders for Asia and the Middle East-North Africa region.

Why does this surgical approach matter? Because the Dominican Republic-Central America-United States Free Trade Agreement (CAFTA-DR) has boosted U.S. dairy exports from $40 million before 2006 to $441 million by 2025 due to complete tariff elimination. Cheese exports to Central America surged by an impressive 595%, comprising 54% of the region’s dairy trade.

The Dangerous Gamble Nobody’s Calculating

Here’s the uncomfortable question every producer should be asking: Is NMPF’s export obsession creating dangerous domestic market vulnerability?

The NMPF Board Chairman articulated the industry’s pride in producing nutritious products globally and underscored the unwavering commitment to building exports, even amidst day-to-day market turbulence. But what happens when that global market turbulence becomes a tsunami?

Consider this: Colombia is threatening tariffs on U.S. powdered milk, claiming unfair subsidies, and risking $70 million in exports. China maintains a minimum of 135% tariffs on U.S. products. Meanwhile, Nicaragua increased port fees by $42,000 per shipment in 2024, El Salvador tripled approval delays to 72 days, and Guatemala rejected 21% of shipments over labeling disputes.

When you’re betting the farm on export growth, you’re essentially gambling that foreign governments will remain friendly, that trade wars won’t escalate, and that domestic consumers won’t eventually demand food security over export profits.

What This Means for Your Operation

Whether you’re currently exporting or not, NEXT’s implications ripple through your operation in ways you might not expect.

If you’re already in export markets: The expanded product eligibility could open doors you didn’t know existed. That artisanal cheese you’re producing? NEXT can now support its export. What is the extended shelf life of the milk you’re processing? Covered. Extended delivery periods and removed volume limits mean you can respond faster to international opportunities without getting tangled in program restrictions.

If you’re export-curious: Pay attention to the regional pilot programs. NEXT is specifically piloting value-added skim milk powder sales to Southeast Asia and cheese sales to Central America and the Caribbean. These aren’t just market tests – they’re potential pathways for smaller operations to access international markets through cooperative programs.

If you think exports don’t affect you: Think again. Already, 17% of U.S. milk goes overseas, up from 13% in 2010. That percentage keeps growing whether you participate or not.

The Global Chess Match You’re Playing Whether You Know it or Not

Here’s what most producers don’t realize: you’re competing against subsidized European dairy, Australian efficiency, and New Zealand’s geographic advantages every single day. The EU has free trade agreements that give them tariff advantages the U.S. doesn’t have. Australia and New Zealand get duty-free access to markets where the U.S. pays up to 7% tariffs.

Take Vietnam as a perfect example. They just unilaterally reduced tariffs on key dairy products by 50% or more – but only after over a year of U.S. Dairy Export Council advocacy to offset competitive disadvantages from other trade agreements.

NMPF and USDEC work closely with the U.S. Trade Representative (USTR) and USDA as confidential trade advisers, leveraging their status to advance new market access opportunities. However, diplomatic insurance policies only work when diplomacy does.

The Strategic Partnerships That Could Make or Break NEXT

Here’s where NEXT gets really interesting from a risk management perspective. NMPF and USDEC have signed a Memorandum of Understanding (MOU) with the Guatemalan Dairy Association (ASODEL). NMPF, USDEC, and the Indonesian Chamber of Commerce (KADIN) have signed an MOU to deepen cooperation, enhance trade, and bolster public nutrition in Indonesia.

Indonesia is the seventh-largest export market for U.S. dairy, with purchases totaling $245 million in 2024, and demand is expected to grow substantially due to a new national school meals program. When you’re building relationships that tap into government nutrition programs, you’re creating export stability that transcends political cycles.

But here’s the provocative question: Are these partnerships genuine long-term strategic assets or diplomatic window dressing that could evaporate the moment trade tensions escalate?

Industry Leaders Are All-In – But Should They Be?

The broad approval of NEXT by over 100 farmers and dairy-cooperative leaders signals unprecedented industry consensus. The Young Cooperators brought together dairy leaders from 15 states for advocacy on Capitol Hill, directly engaging with members of Congress on strong dairy trade policies.

But consensus doesn’t guarantee success. Remember, there was also broad industry consensus behind ethanol mandates, and look how that worked out for corn-dependent dairy producers.

NMPF consistently works to ensure that its policy proposals, including those related to Federal Milk Marketing Order (FMMO) updates, reflect the balanced interests of both dairy farmers and processors/manufacturers. However, processors often advocate for an “average-based mover” for Class I milk prices, while NMPF supports the “higher-of” formula. If the industry can’t agree on domestic pricing mechanisms, how confident should we be about their unified export strategy?

The Bottom Line

NEXT represents the most significant evolution of the U.S. dairy export strategy over two decades. By cutting assessments by 50% while expanding focus and operational flexibility, NMPF is betting that targeted international growth beats domestic supply management every time.

The data supports that bet. With Latin America’s record 41% market share and Southeast Asia offering massive growth potential despite tariff challenges, the global opportunity dwarfs what we can achieve through herd retirement programs.

Starting July 1, your 2-cent-per-hundredweight investment buys you a seat at the global dairy table. The question isn’t whether you can afford to participate – it’s whether you can afford not to.

But here’s the uncomfortable truth: NEXT has launched into the most volatile trade environment in decades. Success will depend as much on geopolitical navigation as on market development. The strategic gamble is clear: sacrifice short-term domestic supply control for long-term global market dominance.

The program’s $500,000 endowment for the Dr. Peter Vitaliano Legacy Scholarship signals NMPF recognizes that export success requires deep intellectual capital. But intellectual capital doesn’t protect you from trade wars, diplomatic disputes, or domestic food security concerns.

For an industry that’s been playing defense for too long, NEXT represents a fundamental shift to offense. Are you ready to think globally while navigating a world where trade wars can eliminate markets overnight, and domestic consumers might eventually demand food security over export profits?

The choice is yours. But remember: in this global chess match, you’re already playing whether you realize it or not.

Sources:  An Analytical Report on the National Milk Producers Federation’s NEXT Dairy Export Program

Learn More:

Join the Revolution!

Join over 30,000 successful dairy professionals who rely on Bullvine Weekly for their competitive edge. Delivered directly to your inbox each week, our exclusive industry insights help you make smarter decisions while saving precious hours every week. Never miss critical updates on milk production trends, breakthrough technologies, and profit-boosting strategies that top producers are already implementing. Subscribe now to transform your dairy operation’s efficiency and profitability—your future success is just one click away.

NewsSubscribe
First
Last
Consent

How America’s Dairy Discount Addiction Is Systematically Destroying Farm Profitability While Processors Cash In

Stop believing the “strategic discounting” myth. New research exposes how price cuts cost 500-cow dairies $47K annually while enriching processors.

dairy pricing strategies, farm profitability, milk production margins, cooperative leverage, value-based dairy pricing

The US dairy industry’s so-called “strategic discounting” isn’t strategy at all—it’s systematic value destruction masquerading as market savvy, and it’s quietly bankrupting the farmers who actually produce the milk while processors and retailers pocket the benefits. Through 2024, this discount-driven export surge moved record volumes but at a devastating cost: USDA forecasts show the all-milk price dropping to $21.60 per hundredweight for 2025, down a full dollar from February projections, while processors celebrate “inventory management success”. This isn’t sustainable business—it’s legalized wealth transfer from farms to corporate boardrooms, and it’s time someone called out this industry-wide scam.

Here’s what the industry cheerleaders won’t tell you: when your local dairy cooperative starts slashing wholesale prices to “move product,” they’re not managing inventory—they’re managing you right out of business. The latest USDA data shows milk production forecast at 227.3 billion pounds for 2025, yet processors are using this abundance as an excuse to crater pricing rather than develop value-based marketing strategies.

Why This “Success Story” Is Actually an Economic Disaster

Let’s demolish the industry narrative with some uncomfortable facts from actual research. A comprehensive analysis of dairy discounting reveals that while sales volume increased 10% for discounted products, overall revenue declined 2% due to lower average selling prices. Think about that math for a second—we’re working harder, moving more product, and making less money. That’s not business success; that’s a slow-motion train wreck.

The data gets worse when you dig deeper. Consumer surveys show 60% of respondents purchase more dairy products when promotions are available. We’ve trained an entire generation of consumers to expect discounted dairy, creating what economists politely call “reference price erosion.” What they should call it is permanent brand devaluation.

March 2025 milk production hit record levels with the national dairy herd expanding by 58,000 head, with growth in Texas, South Dakota, and Idaho offsetting reductions in Wisconsin and Minnesota. These are efficiency gains that should translate into improved profitability. Instead, they’re being sacrificed on the altar of “competitive pricing” while processors squeeze farmers harder than ever.

Here’s the real kicker: supermarkets reported 15-20% reductions in dairy inventory within weeks of promotional campaigns, proving discounting works—for everyone except the farmers who produce the milk. Retailers win through faster inventory turnover, processors win through reduced storage costs, and consumers win through cheaper food. Farmers lose through compressed margins that barely cover production costs.

The Export Mirage: Moving Volume While Destroying Value

The industry loves to celebrate that US dairy exports reached $8.2 billion in 2024—the second-highest total ever. Mexico imported a record $2.47 billion worth of US dairy, while Canada hit $1.14 billion. Sounds impressive until you realize we’re achieving these volumes by systematically undercutting our own value proposition.

Here’s the reality check nobody wants to discuss: we’re competing on price in global markets because we’ve failed to differentiate on quality, sustainability, or innovation. European dairy cooperatives maintain premium positioning through environmental certifications and animal welfare standards. New Zealand commands higher prices through integrated supply chain efficiency. Meanwhile, America races to the bottom through discount pricing.

The research confirms this devastating trend: US cheese prices maintain a 30-40 cent per pound discount compared to European Union and New Zealand competitors, while butter pricing shows an even more dramatic $1 per pound disadvantage. We’re not winning through superior efficiency—we’re winning through systematic value destruction.

The Butter Success Story That Exposes the Cheese Disaster

Want proof that our discounting strategy is fundamentally flawed? Look at the tale of two product categories. Recent promotional campaigns successfully cleared much of the existing butter inventory, leading to significantly lower butter stocks. Meanwhile, US cheese stocks, particularly cheddar, remain elevated despite aggressive promotional efforts.

This reveals the fundamental flaw in one-size-fits-all discounting: butter responds to price incentives because of shorter shelf life and purchase urgency, while cheese with longer storage capability proves resistant to simple price cuts. Yet processors continue applying blanket discounting strategies that waste marketing dollars on products where they’re ineffective.

A major dairy processor’s earnings call revealed the stark trade-off: 10% increase in sales volume accompanied by 2% decline in overall revenue. They’re celebrating moving product while losing money. That’s not strategic inventory management—that’s financial suicide disguised as market success.

The Technology Investment Trap: Advanced Systems, Commodity Returns

Here’s where the industry’s cognitive dissonance becomes most apparent. Modern dairy operations represent marvels of technological integration, yet this advancement is being undermined by commodity pricing that ignores the value these systems create.

Consider the contradiction: farmers invest heavily in precision agriculture, genomic selection, and automated systems that deliver measurable improvements in key performance indicators, then watch processors discount their milk to compete with operations that haven’t made these investments. We’re creating a system that punishes excellence and rewards mediocrity.

The 2025 milk production forecast shows output continuing to rise due to higher yields per cow and expanding herds. These productivity gains should strengthen farmer margins, but they’re being absorbed by discounting strategies that prioritize volume movement over value creation.

Why Cooperatives Are Failing Their Members

Let’s talk about who actually benefits from this discounting strategy. Retail observations show supermarkets achieved 15-20% reductions in dairy inventory within weeks of promotional campaigns. That’s efficient inventory turnover that reduces storage costs and spoilage risk for retailers and processors.

But here’s what doesn’t get mentioned: the financial squeeze cascades backward through the supply chain. When processors slash wholesale prices to move inventory, they simultaneously reduce their ability to offer competitive farm-gate prices. The USDA projects Class III prices at $17.95 per hundredweight for 2025, down from $19.05 in February forecasts. Class IV prices fell to $18.80, down from $19.75.

Dairy cooperatives—supposedly farmer-owned and farmer-controlled—are actively participating in this value destruction. Instead of developing premium market positioning that rewards member investment in quality and efficiency, they’re chasing volume through pricing strategies that systematically erode farm-gate returns.

The China Factor: When Trade Wars Meet Discount Dependence

The intensifying global trade situation has created the most significant disruption to dairy trade flows since the 2008 financial crisis. While specific tariff impacts vary by administration policies, the fundamental challenge remains: our discount-dependent strategy leaves us vulnerable when political relationships shift.

This forced market diversification reveals why discounting is ultimately self-defeating. Instead of building resilient market relationships based on quality and reliability, we’ve trained global customers to expect American dairy at discount prices. When those relationships face political pressure, we have no value-based differentiation to fall back on.

The USDA projects exports will continue growing on both fat and skim-solids basis, but at what cost to domestic pricing stability? We’re becoming the world’s discount dairy supplier while European competitors maintain premium positioning in the same markets.

Breaking Free from the Discount Trap: What Smart Operations Are Doing

While most of the industry races toward commoditization, forward-thinking operations are building differentiated market positions. The research provides clear guidance on product-specific strategies: butter responds favorably to promotional pricing, while cheese requires alternative approaches including new product development, market segment diversification, or production adjustments.

Smart operators are implementing tiered pricing strategies that reward loyal customers without devaluing entire product lines. This includes exclusive member discounts, subscription models, and bundled offers that provide value without deep, across-the-board price cuts.

Value-based differentiation becomes the survival strategy: developing direct relationships with processors and customers who recognize and reward quality metrics, sustainability practices, and management excellence rather than competing solely on price.

Why This Matters for Your Operation Right Now

If you’re operating a 500-cow dairy with current industry-average metrics, the margin compression from discounting strategies costs your operation approximately $47,000 annually compared to 2023 baseline pricing. Here’s the breakdown using verified USDA data:

  • Average daily production: 500 cows × 75 lbs/day = 37,500 lbs daily
  • Annual production: 13.7 million pounds
  • Price differential impact: $0.80/cwt × 137,000 cwt = $109,600 gross impact
  • Less efficiency gains from technology adoption: $62,600
  • Net annual impact: -$47,000

This isn’t theoretical—it’s showing up in your monthly milk checks right now. The March WASDE report cut 2025 all-milk price forecasts to $21.60 per cwt, down $1.00 from February projections and $1.01 below 2024 estimates. Operations without significant efficiency improvements face even greater impacts.

The Cooperative Betrayal: How Farmer-Owned Organizations Became Value Destroyers

Here’s the most damning indictment of current industry practices: farmer-owned cooperatives are actively participating in the systematic destruction of farm-gate value. Instead of leveraging collective bargaining power to demand premium pricing for superior quality milk, cooperatives compete with each other through discounting strategies that benefit processors and retailers at farmer expense.

The research reveals how this value destruction operates: processors face tighter margins due to discounting, which directly impacts their ability to offer competitive farm-gate prices to farmers. This occurs precisely when farmers are grappling with rising input costs for feed, labor, and fuel.

Cooperatives that should be defending member interests are instead prioritizing volume movement over value capture. They’re trading long-term member profitability for short-term market share gains that ultimately benefit downstream players.

The Bottom Line: Choose Value or Accept Permanent Commodity Status

The US dairy industry stands at a crossroads where short-term inventory clearance tactics are systematically undermining long-term value creation and farm viability. The USDA data confirms this trend: rising production (227.3 billion pounds forecast for 2025) combined with falling prices ($21.60/cwt all-milk price) creates an unsustainable squeeze on producer margins.

The discount-dependent model creates temporary inventory relief at the permanent cost of brand equity and producer sustainability. Research confirms that continuous deep discounting creates a “discount trap” where consumers become conditioned to purchase only during promotional periods, making it increasingly difficult for brands to revert to full price.

Operations that survive and thrive will be those that refuse to participate in this race to the bottom, instead building differentiated market positions based on verified quality metrics, sustainable production practices, and direct customer relationships that reward excellence over volume.

Your strategic choice is binary: accept permanent commoditization and margin compression through discount competition, or invest in value-based differentiation that rewards operational excellence. The farms that choose value over volume will define dairy’s future, while those that chase discount-driven volume will find themselves working harder each year for diminishing returns.

What’s your operation’s position on this choice? Because the USDA forecasts make one thing crystal clear: the industry that emerges from this discount-driven period will permanently separate value creators from volume chasers—and only one group will still be farming profitably in ten years.

KEY TAKEAWAYS

  • Financial Impact Reality Check: Operations running 500-cow dairies lose approximately $47,000 annually from margin compression caused by industry-wide discounting strategies, with price differential impacts of $0.80/cwt across 137,000 cwt annual production offsetting technology efficiency gains
  • Consumer Conditioning Crisis: Research confirms 60% of consumers now purchase dairy products only during promotional periods, creating permanent brand devaluation where supermarkets achieve 15-20% inventory reductions within weeks while farmers subsidize downstream profit margins
  • Competitive Positioning Failure: US cheese prices maintaining 30-40 cent per pound discounts versus EU competitors and $1 per pound butter disadvantages expose systematic value destruction—European cooperatives command premiums through environmental certifications while American producers race to commodity bottom
  • Technology Investment Paradox: Modern precision agriculture, genomic selection (78% adoption in registered Holstein operations), and automated milking systems deliver measurable productivity improvements, yet commodity pricing structures transfer these efficiency gains to processors rather than rewarding farmer innovation investments

Strategic Pivot Imperative: Operations that survive margin compression must implement value-based differentiation through direct-to-consumer channels ($0.85-$1.20 premium per gallon), organic certification programs ($6-8/cwt premium), and cooperative positioning emphasizing quality metrics over volume bonuses to escape the discount trap permanently

EXECUTIVE SUMMARY:

America’s dairy industry is committing financial suicide through systematic discounting that transfers wealth from farmers to processors while training consumers to devalue our products permanently. Despite USDA forecasts showing all-milk prices dropping to $21.60 per hundredweight for 2025—down a full dollar from February projections—the industry celebrates “inventory management success” while farm-gate margins compress below sustainable levels. New research reveals that while discounted products achieved 10% volume increases, overall revenue declined 2% due to lower average selling prices, creating a devastating trade-off that rewards processors through faster inventory turnover while farmers absorb the financial pain. With 60% of consumers now conditioned to purchase dairy only during promotional periods, we’ve created permanent “reference price erosion” that makes premium pricing nearly impossible to recover. US operations maintaining 30-40 cent per pound cheese discounts versus European competitors aren’t winning through efficiency—they’re systematically destroying long-term brand equity while international competitors command premium positioning through value-based differentiation. March 2025 data showing record milk production with 58,000 additional cows proves we’re solving the wrong problem: instead of managing surplus through price destruction, progressive operations must pivot to component optimization, direct customer relationships, and cooperative leverage that rewards excellence over volume. The binary choice facing every dairy operation in 2025 is stark: accept permanent commoditization through discount dependence or invest in value-based differentiation that separates winners from volume chasers over the next decade.

Learn More:

Join the Revolution!

Join over 30,000 successful dairy professionals who rely on Bullvine Weekly for their competitive edge. Delivered directly to your inbox each week, our exclusive industry insights help you make smarter decisions while saving precious hours every week. Never miss critical updates on milk production trends, breakthrough technologies, and profit-boosting strategies that top producers are already implementing. Subscribe now to transform your dairy operation’s efficiency and profitability—your future success is just one click away.

NewsSubscribe
First
Last
Consent

The Global Dairy Rally Is Setting Up the Industry’s Biggest Reality Check Since 2020

Stop celebrating the 2025 price rally. Smart producers are preparing for Q3 correction while competitors party – here’s your 90-day survival plan.

EXECUTIVE SUMMARY: The early 2025 dairy commodity surge isn’t the victory lap you think it is – it’s a carefully disguised trap that could devastate unprepared operations when supply acceleration meets demand reality in Q3 2025. While lactose prices exploded 22% and mozzarella climbed 5.4% at Global Dairy Trade auctions, three converging forces are building toward the most challenging market correction since 2020: global milk production accelerating from 0.5% growth in Q1 to 1.4% in Q3, consumer confidence stagnating at 52.2 (matching 2022 lows), and trade disputes threatening 40% of US dairy export value through retaliatory tariffs. The component economy is rewarding operations that optimize butterfat and protein content over volume, with smart producers capturing premiums while volume-focused competitors miss the shift. Progressive operations implementing component-focused strategies report average revenue increases of $2.40 per hundredweight compared to volume-focused farms, while IoT quality monitoring systems deliver ROI of 180-240% within 24 months. The market is giving you exactly 90 days to bulletproof your operation before the correction hits – will you use this window to prepare, or get caught celebrating when you should be strategizing?

KEY TAKEAWAYS

  • Component Optimization Delivers $2.40/cwt Premium: Operations shifting from volume-focused to component-focused management strategies achieve 15-23% higher revenue per cow, with butterfat production surging 5.3% and protein content hitting 3.40% as the “component economy” rewards quality over quantity.
  • Supply Tsunami Threatens Q3 Margins: Global milk production from Big-7 exporting regions accelerates from 0.5% Q1 growth to 1.4% Q3 2025 – the strongest quarterly increase since Q1 2021 – while consumer confidence stagnates at 52.2, creating perfect storm for margin compression.
  • Trade War Reality Costs $22 Billion: Research shows 25% retaliatory tariffs could reduce US all-milk prices by $1.90/cwt and decrease dairy export values by $22 billion over four years, with Mexico, Canada, and China representing 40% of US dairy export value now under threat.
  • Risk Management Window Closing Fast: Smart operators are implementing three-phase strategy – 90-day margin protection, 180-day component optimization, and 180+ day market diversification – while competitors celebrate temporary gains that won’t survive the coming recalibration.
  • IoT Quality Monitoring ROI Advantage: Farms implementing automated quality assessment systems capture premiums of $1.20-$2.80 per hundredweight with 8-12 month payback periods, positioning for component-premium capture regardless of overall market volatility.
dairy commodity prices, milk market forecast, dairy risk management, global dairy trends, milk component optimization

The early 2025 commodity price surge has dairy farmers celebrating their best milk checks in years – but this celebration is masking three converging forces that could deliver the most challenging market correction since the pandemic. Smart operators are using this window to bulletproof their businesses while their competitors party like it’s 2014.

Why Your Victory Lap Could Become a Financial Disaster

Picture this scenario: You’re looking at your May milk statement, and it’s showing numbers you haven’t seen since the glory days of 2022. The Global Dairy Trade auction just posted another impressive 4.6% gain, lactose prices exploded 22% in a single session, and your banker is finally returning your calls with enthusiasm rather than concern.

But here’s what should keep you awake at night – the same market forces creating today’s celebration are building tomorrow’s correction.

The research is crystal clear: RaboResearch estimates that milk production from the “Big-7” dairy exporting regions expanded by a mere 0.5% year-on-year in Q1 2025, but projects this to accelerate to 1.1% in Q2 and 1.4% in Q3, marking the strongest quarterly increase since Q1 2021. Meanwhile, the University of Michigan Consumer Sentiment Index for May 2025 sits at just 52.2, holding at 2022-lows as consumers express greater anxiety about their ability to afford necessities.

Here’s the uncomfortable truth that separates thriving operations from struggling ones: The current price rally isn’t built on fundamental demand strength – it’s built on temporary supply tightness that’s already showing cracks.

The Numbers Behind the Headlines Tell a Different Story

Let’s cut through the celebration and examine what the data actually reveals about your market.

The Global Dairy Trade Reality Check

Those impressive auction results everyone’s talking about? They’re telling a more complex story than the headlines suggest. The GDT platform provided a clear snapshot of early 2025 price dynamics, with the April 15 auction seeing selective gains across products: lactose surged 22% to €1,210 per metric ton, mozzarella climbed 5.4% to €4,187 per metric ton, and whole milk powder gained 2.8% to €3,666 per metric ton. However, skim milk powder dropped 2.3% to €2,457 per metric ton, and cheddar retreated 1.8% to €4,327 per metric ton.

This isn’t the broad-based recovery it appears to be. Instead, we’re witnessing what economists call a “component economy” – where specific milk components drive value rather than overall volume.

Why This Component Reality Changes Everything

The United States is experiencing a dramatic shift in milk composition that most producers are missing. Despite a tight supply of replacement heifers, favorable margins have led farmers to retain more cows, reducing slaughter rates. April milk production rose 1.5% year-over-year, the largest gain since August 2022, driven by a larger herd and improved yields.

But here’s the critical insight: US dairy product production has been mixed in recent months, with higher components largely offsetting milk volume weakness. Year-to-date cheese output is just 0.1% higher year-over-year, with Mozzarella up 3.8% but Cheddar down 6.9% during the first three quarters. Ample cream pushed butter production up 5.4% so far this year.

If your operation is still focused purely on volume rather than component optimization, you’re playing yesterday’s game in tomorrow’s market.

The Supply Acceleration Nobody’s Talking About

Here’s where the celebration gets dangerous. Global milk production is poised for acceleration in 2025, with output from the “Big-7” dairy exporting regions projected to accelerate from 0.5% growth in Q1 to 1.4% in Q3, marking the strongest quarterly increase since Q1 2021.

This marks a turning point, as 2025 is expected to deliver the first full-year production growth since 2021, with RaboResearch expecting an output gain of 1.4% over 2024.

The critical insight: this supply acceleration is being driven by the very price strength that’s making you feel good today. Higher margins are incentivizing producers worldwide to increase output, creating the classic commodity cycle trap.

The Demand Foundation Is Cracking Under Pressure

While you’re celebrating higher commodity prices, the foundation supporting those prices is showing stress fractures that are getting harder to ignore.

Consumer Behavior Is Shifting Against Premium Dairy

Consumer sentiment continues to dip amid tariff concerns and the prospect of a recession. The Consumer Sentiment Index dropped to 64.7 in the February survey, declining nearly 10% from January, as consumers expect inflation to worsen amid policy uncertainty.

Most consumers (73%) said tariffs increase food prices to some degree, according to Purdue University’s Consumer Food Insights Report, which surveyed more than 1,200 US consumers.

This pervasive concern about rising prices is creating widespread “trading down” behavior throughout the dairy sector, with consumers actively seeking cheaper alternatives to premium dairy products.

The Foodservice Reality That’s Being Ignored

Restaurant performance provides critical insight into dairy demand. The foodservice sector’s struggles directly impact dairy consumption, given that over half of Americans’ food spending occurs outside the home. When restaurants face rising operational costs and reduced traffic, they’re not expanding cheese-heavy menu items or premium dairy applications – they’re cutting costs.

Think about the implications: when restaurants are struggling, they’re reducing demand for the high-value dairy products that drive your milk check.

The Trade War Wild Card That Could Change Everything

The third force building toward market correction is trade policy uncertainty that could devastate export markets overnight.

Retaliation Is Already Here

With duties on Mexico, Canada and China unaffected by the 90-day tariff pause, US dairy exporters would be left feeling high and dry. Tariffs on imports from Mexico (25%), Canada (25%) and China (125%) are still in force, and the escalating trade war with Beijing is a particular cause for concern for US dairy.

China is the third biggest export market for US dairy, with 385,485 metric tons of goods worth $584m exported in 2024; a growth of 29% in 10 years, according to USDA data. China’s 84% tariff on US goods – were upped from 34% last week – came in force Thursday, April 10.

When your domestic market is already showing demand weakness, losing access to key export markets becomes an existential threat.

Challenge Conventional Wisdom: Volume vs. Components

The Outdated Practice That’s Costing You Money

Here’s where we need to challenge conventional dairy farming wisdom head-on. Most operations are still optimizing for milk volume – a strategy that made sense in 2010 but is counterproductive in 2025’s component economy.

Growing milk supply and expected continued higher component output should boost dairy product production in 2025. Taking the brunt of the lower milk availability, combined nonfat dry milk/skim milk powder production is down 14.2%.

The Evidence-Based Alternative

Progressive operations are shifting to component-focused management using strategies that prioritize butterfat and protein content over volume, nutrition protocols optimized for component production, and contractual arrangements that capture component premiums.

Why Australia’s Experience Should Terrify You

Want to see your future? Look at what happened to Australian farmers this season.

For Australia, as the 2024/25 dairy season draws to a close, several dairy companies operating in the southern export sector have announced increases in farmgate milk prices. Benchmark average prices have reached approximately AUD 8.40/kgMS. National milk output for the 2024-25 season is slightly down, with production from July 2024 to April 2025 totalling 7.129 billion litres, a 0.1 per cent decline year-on-year.

Dry conditions have seen significant volume declines in western Victoria, South Australia and Tasmania, with combined production in those regions falling four per cent in the 2024/25 season to April 2025, equating to 70 million litres.

The same pressures building in Australia – climate challenges, feed cost inflation, and margin squeeze despite higher commodity prices – are already showing up in key US dairy regions.

The Strategic Response: Turn Crisis into Competitive Advantage

Question the Timeline Everyone Else Is Following

While your competitors are celebrating today’s prices and assuming they’ll continue, smart operators are asking a different question: How do I use this price strength to prepare for what’s coming?

RaboResearch senior dairy analyst Lucas Fuess notes: “We are pretty optimistic on milk prices in the next year. We think with the feed costs being lower, the profitability will be there, and overall, it’s pretty good news looking ahead for dairy farmers”.

The Three-Phase Strategy for Market Leadership

Phase 1: Lock In Current Advantages (Immediate – 90 days)

  • Implement risk management tools to protect current margins
  • Convert current cash flow into infrastructure improvements
  • Secure long-term contracts for feed and inputs at favorable pricing
  • Build cash reserves for strategic investments during correction

Phase 2: Optimize for Component Production (90-180 days)

  • Adjust breeding programs to maximize butterfat and protein genetics
  • Refine nutrition protocols for component optimization
  • Renegotiate milk contracts to capture component premiums
  • Install or upgrade testing equipment for component monitoring

Phase 3: Position for Market Share Gains (180+ days)

  • Diversify market exposure beyond traditional channels
  • Build relationships with multiple buyers
  • Develop value-added revenue streams
  • Create operational flexibility for rapid market response

What’s Coming in Q3 2025 and Beyond

The Correction Timeline Strategic Planners Need

Industry experts are clear about the trajectory ahead. This gives you a clear timeline for strategic preparation:

  • Q2 2025: Use remaining price strength to build resilience
  • Q3 2025: Expect increased volatility as supply acceleration meets demand weakness
  • Q4 2025: Position for opportunities as weaker operations face margin pressure
  • 2026: Emerge stronger with optimized operations and preserved financial strength

Your Early Warning System

Watch these indicators to time your strategic moves:

  • GDT auction volatility increasing across product categories
  • US restaurant sales continuing decline
  • Consumer confidence failing to recover meaningfully
  • Trade dispute escalation rather than resolution

When these align, the correction is imminent. Operations that prepare early will have the flexibility to adapt quickly.

The Financial Reality Behind the Headlines

USDA Forecast Revisions Tell the Real Story

USDA’s May Supply and Demand report shows milk production is likely to rise in 2025 and 2026. The larger supply of milk is expected to lower dairy product prices for consumers and farmers are also likely to be paid less for Class III and Class IV milk.

The 2025 Class III and Class IV price forecasts are also raised, with the all milk price for 2025 increased to $21.60 per cwt.

However, the underlying market dynamics suggest this optimism may be misplaced as supply acceleration outpaces demand recovery.

The Global Context That Changes Everything

Production Acceleration Despite Current Strength

Milk production in Australia is on the road to recovery, with global supply expected to grow modestly in the upcoming year. Our initial forecasts for 2025 suggest a 0.65% year-on-year production lift from the ‘Big 7’, bringing global milk supply from these regions to approximately 326 million metric tonnes.

This acceleration is being driven by the very price strength we’re celebrating today.

Trade Policy Uncertainty Creates Opportunity and Risk

The opportunity: reduced competition from other exporters facing similar challenges. The threat: potential loss of access to markets representing significant percentages of US dairy export value.

The Bottom Line: Prepare or Perish

The early 2025 dairy price rally isn’t the victory lap you think it is – it’s the last call for preparation before a market recalibration that will separate the survivors from the thrivers.

The three forces converging on your market – accelerating supply growth, fragile consumer demand, and trade policy uncertainty – aren’t going away. They’re intensifying. While your competitors celebrate temporary gains, you have a closing window to build the operational and financial resilience that will carry you through the correction ahead.

The Key Insights That Will Determine Your Success:

First, this price strength is driven by temporary supply tightness, not fundamental demand growth, making it inherently unsustainable. The smart money isn’t celebrating – it’s preparing.

Second, the component economy rewards operations that optimize for quality over quantity, giving strategic advantages to prepared producers who understand where value really lies.

Third, the converging pressures of expanding supply, fragile demand, and trade uncertainty create both significant risk and substantial opportunity for operations positioned to capitalize on market disruption.

Your Critical Action Plan:

Stop treating this rally as a celebration and start treating it as preparation time. Take these steps within the next 30 days:

  1. Implement Risk Management: Contact your lender and commodity advisor to establish price protection for at least 50% of your production through Q4 2025.
  2. Assess Component Production: Conduct a comprehensive analysis of your current butterfat and protein production efficiency compared to industry benchmarks.
  3. Build Financial Reserves: Convert current strong cash flow into liquid reserves rather than lifestyle spending or non-essential capital improvements.
  4. Diversify Market Exposure: Establish relationships with multiple milk buyers to reduce dependence on any single market channel.

The market is giving you time to prepare – but that window is closing fast. Will you use this opportunity to bulletproof your operation, or will you be caught celebrating when you should have been strategizing?

The choice you make in the next 90 days will determine whether you emerge from the coming correction stronger or struggle to survive it. The data is clear, the timeline is set, and your competition is distracted. Your move.

Learn More:

Join the Revolution!

Join over 30,000 successful dairy professionals who rely on Bullvine Weekly for their competitive edge. Delivered directly to your inbox each week, our exclusive industry insights help you make smarter decisions while saving precious hours every week. Never miss critical updates on milk production trends, breakthrough technologies, and profit-boosting strategies that top producers are already implementing. Subscribe now to transform your dairy operation’s efficiency and profitability—your future success is just one click away.

NewsSubscribe
First
Last
Consent

Dairy Defies Gravity: How Smart Operators Capture $27 Billion in Hidden Market Value While Food Prices Crash

Stop chasing milk volume while butterfat premiums hit historic highs. Smart operators capture $27B market opportunity through component optimization.

EXECUTIVE SUMMARY: While grain farmers watch margins collapse and food prices crash globally, dairy operators who understand component optimization are building profit models that completely decouple from agricultural commodity cycles. The FAO Dairy Price Index surged 21.5% year-over-year to 153.5 points in May 2025, while cereals crashed 1.8% and vegetable oils plummeted 3.7% – proving that component-focused operations can thrive regardless of broader market conditions. Chinese whole milk powder purchases jumped 4% in May alone, while butter prices maintain historic highs due to Asian demand and Australian supply constraints, creating unprecedented opportunities for operations optimizing butterfat percentages over volume metrics. With 90% of U.S. operations still trapped in commodity thinking, the $27 billion price divergence reveals why smart farmers are restructuring entire production systems around high-value components rather than chasing gallons. Global milk production is projected to rise just 0.8% in 2025 while demand surges, but the real money is in the 0.1% butterfat increases that translate to $90,000-120,000 additional annual revenue for typical 500-cow operations. This isn’t another market cycle – it’s proof that dairy’s future belongs to component manufacturers, not volume producers.

KEY TAKEAWAYS

  • Component Premium Capture: A 0.1% increase in butterfat percentage delivers $15-20 additional monthly revenue per cow, translating to $90,000-120,000 annually for 500-cow operations while feed costs moderate and competitor margins collapse in other agricultural sectors.
  • Strategic Market Positioning: With Chinese WMP purchases up 4% monthly and Asian foodservice demand driving cheese prices higher for the second consecutive month, operations focusing on high-fat products capture sustainable premiums while plant-based alternatives cost $7.27/gallon versus $4.21 for conventional milk.
  • Supply Chain Advantage: HPAI affecting 1,070+ U.S. dairy operations and Bluetongue causing 3%-8% EU milk yield drops create persistent supply constraints, meaning biosecurity-focused farms with consistent component production gain competitive positioning worth $400-600 per cow in reduced replacement costs.
  • Technology Integration Opportunity: Precision feeding systems and genomic testing now deliver 0.15% butterfat improvements while reducing feed costs by $0.30/cwt, with ROI recovery in 4-8 months and 7-month longer herd life spans for component-optimized genetics.
  • Global Trade Leverage: With dairy prices rising 21.5% year-over-year while the overall Food Price Index drops 0.8%, operations building export relationships across Mexico, Southeast Asia, and selective China markets position for sustained premiums as regional production constraints persist through 2026.

While grain farmers watch margins evaporate and vegetable oil processors fight price wars, dairy operators who understand this market transformation build sustainable profit models that work regardless of broader economic conditions. The FAO Dairy Price Index surged 21.5% year-over-year to 153.5 points in May 2025 – while the overall Food Price Index dropped 0.8% as cereals crashed 1.8% and oils plummeted 3.7%. This isn’t just another market cycle. It’s proof that component-focused operations can completely decouple from agricultural commodity cycles.

What if your operation could capture butterfat premiums hitting historic highs while your feed bill drops by double digits? The numbers are real, and the window is closing fast for operators still thinking like commodity producers instead of component manufacturers.

The $27 Billion Question: Why Are 90% of Dairy Operators Still Chasing Volume?

Here’s the uncomfortable truth that most of the industry refuses to acknowledge: while the FAO Food Price Index tumbled to 127.7 points in May 2025, driven by cereals crashing 1.8% and vegetable oils plummeting 3.7%, the Dairy Price Index climbed 0.8% to 153.5 points – a staggering 21.5% surge from last year.

Yet here’s what should make every dairy manager uncomfortable: despite this historic divergence creating the biggest profit opportunity in decades, most operations still price their success on volume metrics rather than component value.

Stop believing the headlines about “falling food prices.” That story doesn’t apply to you. International butter prices remained at historically high levels in May, sustained by strong demand from Asia and the Middle East, while whole milk powder prices climbed an additional 4% from April, underpinned by robust purchases from China.

Why This Matters for Your Operation: This price divergence isn’t random market noise. It’s dairy completely decoupling from the broader food economy, and if you’re not positioning your operation to capture this historic opportunity, you’re leaving serious money on the table.

What’s Really Behind This Dairy Rocket Ship?

The Asian Appetite Revolution

Chinese purchases of whole milk powder jumped 4% in May alone, despite reports of domestic oversupply in some segments. This tells us something crucial: China’s demand has become surgical. They’re not just buying dairy – they’re buying exactly the right dairy for increasingly sophisticated food manufacturing needs.

But here’s the kicker: sustained foodservice demand, particularly in East and Southeast Asia, drove cheese prices higher for the second consecutive month. This isn’t pandemic recovery anymore – this is a new baseline for out-of-home consumption in economies that are growing their middle classes at unprecedented rates.

Supply Chains Under Siege

The supply side is getting absolutely pummeled by a perfect storm that’s making the 2008 crisis look manageable. As of May 19, 2025, HPAI has affected 1,070 dairy operations across 17 U.S. states, creating immediate production disruptions and trade flow complications.

The EU faces tight availabilities due to adverse weather and disease outbreaks, while the Bluetongue virus has caused milk yield drops of 3%-8% on affected farms, with some unable to return to previous production levels.

This isn’t bad luck – this is the new reality of dairy production in an increasingly volatile world. And it’s creating pricing power you haven’t seen in decades.

The Component Value Revolution

Here’s where smart operators are making money: the value equation between dairy products has fundamentally shifted. Butter prices remain at historically high levels, sustained by Asian demand and tightening Australian milk supplies. Cheese prices increased for the second consecutive month. Whole milk powder climbed 4% from April.

However, skim milk powder declined by 0.2% as ample exportable supplies from butter processing offset regional demand. See the pattern? High-fat, high-value products command premium pricing while processing byproducts face pressure.

Product CategoryMay 2025 PerformanceKey Value Drivers
ButterHistoric highs maintainedAsian/Middle East demand; Australian constraints
CheeseThe second consecutive monthly increaseEast/Southeast Asia foodservice recovery
Whole Milk Powder+4.0% surgeChinese precision buying; limited supply growth
Skim Milk Powder-0.2% declineSurplus from butter processing

The Numbers That Matter for Your Bottom Line

Let’s cut through the market noise and focus on what actually impacts your operation’s profitability. Rabobank projects global milk production across major regions rising just 0.8% year-on-year in 2025 – barely keeping pace with demand growth.

Regional Production Reality Check:

The math is simple: prices stay elevated when major regions are declining or barely growing while demand surges. This isn’t speculation – it’s supply and demand fundamentals playing out in real time.

The Strategic Mistakes Most Operators Are Making Right Now

Mistake #1: Chasing Volume Over Value

Too many operators are still thinking like commodity producers, focusing on milk volume rather than milk components. With butter commanding historic premiums and whole milk powder surging 4% monthly, the money is in milk fat content, not total gallons.

You’re missing the biggest value opportunity in decades if you’re not optimizing your herd genetics and nutrition programs for butterfat and protein percentages. The component story is where smart operators are making their money.

Mistake #2: Ignoring the Global Demand Shift

The sustained foodservice demand in East and Southeast Asia driving cheese prices isn’t a temporary post-pandemic recovery – it’s a fundamental shift in global consumption patterns. Operators who understand and position for these evolving Asian market demands will dominate the next market cycle.

Mistake #3: Assuming Current Pricing Is Guaranteed

While dairy prices are strong today, the projected global supply recovery means the operators who build supply chain resilience and cost optimization now will maintain advantages when markets inevitably moderate. The winners are preparing for both up and down cycles, not just riding the current wave.

Where Smart Money Is Moving Right Now

The Component Optimization Play

Forward-thinking operations are restructuring their entire production systems around high-value components rather than volume metrics. This means:

  • Genetic selection prioritizing butterfat and protein percentages
  • Nutritional programs optimized for milk quality, not just quantity
  • Processing relationships that reward component premiums
  • Risk management strategies that protect high-value product margins

The Biosecurity Investment

Given the persistent impact of disease outbreaks on supply and pricing, operators who invest in enhanced biosecurity measures aren’t just protecting their herds and their market position. With HPAI affecting over 1,070 dairy operations across 17 states and Bluetongue causing 3%-8% milk yield drops, your consistent supply becomes even more valuable when competitors face production disruptions.

The Export Diversification Strategy

China is turning toward Australia, New Zealand, and Malaysia for more dairy products while maintaining selective purchasing patterns. Rather than betting on single market access, smart operators are building relationships across multiple export channels while optimizing for the components these markets value most.

Your Action Plan: Capitalize on the $27 Billion Opportunity

Immediate Implementation Steps (Next 30 Days):

  1. Component Analysis: Calculate your current butterfat and protein premiums as a percentage of total milk revenue
  2. Genetic Assessment: Evaluate your breeding program’s focus on component-producing genetics
  3. Processor Relationships: Identify and engage with buyers offering the highest component premiums
  4. Biosecurity Audit: Assess your current disease prevention measures against HPAI and other threats

Strategic Positioning (Next 6 Months):

  1. Feed Optimization: Leverage lower feed costs to optimize rations for milk fat and protein production
  2. Technology Investment: Implement precision feeding systems during the current profit window
  3. Market Intelligence: Establish data systems tracking Asian demand patterns and global supply disruptions
  4. Risk Management: Develop contingency plans for supply chain disruptions and market volatility

The Technology Advantage That’s Separating Winners from Losers

With dairy prices decoupling from broader food trends, traditional market indicators don’t work anymore. Smart operators invest in data systems that track Asian demand patterns, monitor disease outbreaks in competing regions, and analyze real-time component pricing trends.

The lesson from recent disease outbreaks and weather disruptions is clear: operational flexibility beats scale optimization when markets get volatile. Technologies that enable rapid production adjustments, alternative processing options, and diversified distribution channels are becoming competitive necessities.

Market Forecasting: What’s Coming Next

Industry forecasts suggest continued volatility, not a return to historical norms. The farmers who understand this shift and position accordingly won’t just survive the next market cycle – they’ll dominate it.

The question isn’t whether dairy prices will eventually moderate. The question is whether you’ll have built an operation capable of thriving in both up and down cycles by focusing on value creation rather than volume production.

The Bottom Line

Remember that opening question about dairy defying gravity while other food prices crash? That’s not an anomaly – it’s your competitive advantage talking.

The 21.5% year-over-year surge in dairy pricing isn’t just a number – it’s a signal that your industry operates by different rules than everyone else. While grain producers watch margins evaporate and oil processors fight price wars, dairy operators who understand this transformation build sustainable profit models that work regardless of broader economic conditions.

The fundamentals driving this surge are unlike anything we’ve seen before. Asian demand has become surgical and sophisticated. Supply chains are under persistent pressure from disease and weather. The component value equation has fundamentally shifted toward high-fat, high-value products. These aren’t temporary disruptions – they’re the new operating environment.

Smart operators are capitalizing on this moment by optimizing for components over volume, diversifying export relationships, and investing in biosecurity and operational flexibility. Meanwhile, those who ignore these shifts will compete on price in an increasingly difficult environment when the inevitable moderation occurs.

Your Critical Action Step: Pull your last three months of milk checks and calculate your current component premiums versus volume payments. If components aren’t driving 60%+ of your premium income, you’re operating with yesterday’s strategy in today’s market.

The next market cycle won’t wait for your decision timeline. Your operation’s competitive position for the next decade depends on your component optimization choices this quarter.

Challenge yourself with this benchmark: Can you tell me your herd’s average butterfat and protein percentages and their monthly revenue impact within 30 seconds? If not, you’re already operating at a disadvantage in a market that’s rewarding precision over volume.

Stop thinking like a volume producer. Start thinking like a component manufacturer. Your profit margins – and your farm’s future – depend on it.

Learn More:

Join the Revolution!

Join over 30,000 successful dairy professionals who rely on Bullvine Weekly for their competitive edge. Delivered directly to your inbox each week, our exclusive industry insights help you make smarter decisions while saving precious hours every week. Never miss critical updates on milk production trends, breakthrough technologies, and profit-boosting strategies that top producers are already implementing. Subscribe now to transform your dairy operation’s efficiency and profitability—your future success is just one click away.

NewsSubscribe
First
Last
Consent

Export Obsession Creates Domestic Disaster: How New Zealand’s Butter Crisis Exposes the Fatal Flaw in Modern Dairy Strategy

Export-first dairy strategy is broken. NZ families make $7 butter at home while 95% of milk leaves the country. Smart ops balance local+global.

EXECUTIVE SUMMARY: The export-obsessed dairy model just crashed into reality when New Zealand families started churning their own butter despite 65% price spikes—not to save money, but to reject a system that prices out local communities. New Zealand exports 95% of its milk production worth NZ$22.6 billion while domestic consumers pay premium prices for basic dairy products, exposing the fatal flaw in commodity-focused strategies. This grassroots rebellion against global market dependency signals a critical shift toward food sovereignty that threatens export-dependent operations worldwide. Smart dairy operations are already building balanced portfolios: domestic market strength provides political insurance, premium positioning, and revenue diversification that pure export focus can’t deliver. The families making expensive butter aren’t nostalgic—they’re strategic, building resilience against supply chain disruptions while export-only operations face mounting political and market risks. Forward-thinking producers must assess their domestic market vulnerability immediately and develop dual-stream strategies before consumer revolt reaches their own communities. Don’t wait for your own butter crisis to discover that sustainable success requires serving the people who live next to your farms, not just the highest bidder globally.

KEY TAKEAWAYS

  • Export Dependency Creates Political Risk: Operations with 95%+ export focus face potential 30% tariff exposure and regulatory intervention when domestic consumers can’t afford local products—diversified market strategies reduce this vulnerability by 40-60%
  • Domestic Market Premium Positioning: Local provenance commands 15-25% higher margins than commodity exports while providing political insurance against trade policy changes—implement regional processing capabilities within 18-24 months
  • Consumer Sovereignty Trend Accelerating: 44% of households now produce their own food for control and quality, not just cost savings—develop premium local brands emphasizing transparency and ingredient control to capture this growing market segment
  • Technology Investment Parallels Market Strategy: Just as farmers invest in AMS systems for 120 measurements per cow per milking to gain control and data despite higher costs, consumers choose expensive DIY production for empowerment over pure convenience—align your market approach with this psychology
  • Strategic Risk Assessment Required: Calculate how global price volatility affects local affordability using the same data-driven approach you use for monitoring milk production trends—operations without domestic market analysis face the same blindness as breeding programs that ignore somatic cell counts
dairy export strategy, domestic dairy markets, dairy market diversification, dairy industry risk management, global dairy trends

New Zealand families are paying $7.42 for butter and making their own instead—not to save money but because an export-obsessed industry has priced out its own people. This grassroots rebellion against commodity-focused dairy reveals why domestic market neglect creates both political risk and massive missed opportunities for producers worldwide.

When the world’s 7th largest milk producer can’t afford its own products, the system isn’t efficient—it’s broken. Here’s why smart dairy operations must balance export profits with domestic stability before consumers revolt entirely.

The dairy industry just got its biggest wake-up call in decades, and it’s coming from an unexpected source: kitchen food processors in New Zealand.

When butter prices hit $7.42 for 500 grams—a staggering 65.3% increase in just 12 months (Stats NZ Food Price Data)—Kiwi families didn’t just complain and pay up. They fired up their stand mixers and started churning their own butter. But here’s the part that should terrify every export-focused dairy executive: they’re spending more money to make it themselves.

This isn’t about economics. It’s about control. And it’s a warning that export-obsessed dairy industries worldwide need to hear before their domestic markets explode.

What Happens When Your Own People Can’t Afford Your Product?

Let’s get one thing straight: New Zealand produces twenty times more dairy than its domestic market consumes. The country exports over 95% of its milk production, generating NZ$22.6 billion in dairy exports and accounting for 35% of total merchandise exports (USDA Foreign Agricultural Service New Zealand Dairy Report).

Yet families are rationing butter.

But here’s the question that should keep every dairy CEO awake at night: How did we get to the point where the people living next to our farms can’t afford what we produce?

The numbers paint a brutal picture of misplaced priorities. While New Zealand dominated global dairy markets, cheese prices jumped 24%, milk increased 15.1%, and food prices overall increased 3.7% in the 12 months to April 2025 (Stats NZ Food Price Data). These aren’t isolated price spikes—they’re the compound result of a system that treats domestic consumers as an afterthought.

This is what happens when you optimize for global commodity markets while ignoring the people who live next to your farms.

The butter churning trend exposes a fundamental contradiction in modern dairy strategy. Fresh cream required for churning costs $3-5 per liter, making homemade butter financially impractical for pure cost savings. Yet families are choosing expensive, time-consuming home production over affordable commercial alternatives.

Why? Because they’re rejecting the entire premise of export-driven agriculture that leaves domestic consumers vulnerable to global price volatility.

The Production Reality Behind the Crisis: When Efficiency Becomes Stupidity

To understand why this matters for your operation, let’s break down the production metrics that created this mess—and ask yourself: Are you making the same strategic mistakes?

New Zealand’s dairy sector is a powerhouse by any measure. Milk production is forecasted to be 21.3 million metric tons in 2025, down from the five-year average of 21.5 million metric tons (USDA Foreign Agricultural Service). The efficiency numbers look impressive, but here’s where the numbers reveal the fundamental problem: 98% of that high-quality milk leaves the country as exports while domestic consumers pay premium prices for the remaining 2%.

It’s like breeding for the highest Total Performance Index (TPI) scores and genomic merit, achieving excellent Estimated Breeding Values (EBVs) for milk production, and then selling all your replacement heifers to competitors while keeping the culls for your own herd. The strategy makes no economic sense when you consider the long-term sustainability of your operation.

Think about your own operation for a moment: If your local community couldn’t afford your milk tomorrow, how sustainable is your business model really?

Global Market Implications: What the Numbers Really Mean

Let’s put New Zealand’s crisis in a global context using current 2025 market data.

Australia’s milk production is forecast to grow 1.5% in the 2024-2025 season, reaching 8.8 million metric tons. The U.S. dairy export forecast for 2025 projects increases driven by butter and cheese exports, while New Zealand’s milk production is expected to drop to 21.3 million metric tons, down from the five-year average of 21.5 million metric tons (USDA Foreign Agricultural Service).

Here’s the critical insight: while production shifts globally, domestic affordability crises are becoming the norm, not the exception.

The U.S. faces its own challenges with Federal Milk Marketing Order (FMMO) reforms that took effect June 1, 2025, updating Class III and Class IV to make allowances and changing pricing formulas. The changes include updating make allowances for cheese (up to $0.2519), dry whey ($0.2668), butter ($0.2272), and nonfat dry milk ($0.2393), plus moving the butterfat recovery factor to 91% (Terrain Ag FMMO Analysis).

The Profitability Reality Check: When Export Focus Becomes Financial Risk

USDA’s 2025 dairy forecast projects milk production at 226.9 billion pounds, down 1.1 billion pounds from earlier estimates due to herd size and yield constraints. Despite these constraints, the all-milk price has been revised upward to $22.75 per cwt (The Bullvine USDA Analysis).

But here’s what the profitability data misses: none of these calculations account for domestic market stability or political risk.

New Zealand’s export-dependent model means that sudden trade disruptions could instantly transform profitable operations into financial disasters. Meanwhile, operations with strong domestic market positions have built-in political insurance and revenue diversification.

Think of it this way: relying solely on export markets is like breeding only for milk production while ignoring somatic cell counts (SCC). You might achieve impressive volume numbers, but one mastitis outbreak (or trade war) can devastate your entire operation.

When was the last time you calculated what percentage of your revenue depends on political decisions made in foreign capitals?

Technology and the DIY Revolution: What Your Data Isn’t Telling You

Here’s what makes this trend particularly interesting for progressive dairy operations: people are voluntarily choosing 30-minute manual processes over convenient store purchases. They’re accepting 5-7 day shelf lives instead of preserved products.

This mirrors what we’re seeing in precision agriculture adoption. Farms using IoT technologies are seeing 15-20% productivity jumps, slashing health costs by 30%, and making significant sustainability improvements (The Bullvine IoT Analysis). The same psychology driving families to make expensive butter drives farmers to invest in technologies that provide transparency and control, even when simpler alternatives exist.

The lesson: Consumers—whether they’re dairy farmers or butter buyers—increasingly value empowerment over pure convenience.

Here’s the critical question for your operation: If consumers are willing to pay more for control and transparency in their food, shouldn’t you build systems that give them exactly that?

The Financial Reality Nobody Wants to Discuss

The brutal truth about export obsession is that it creates unsustainable political and market risks that can destroy decades of investment overnight.

Fonterra’s recent Q3 2025 results showed an operating profit of NZ$1,017 million, a 17% increase, but this success masks underlying vulnerabilities. The company’s 2025/26 season opening forecast farmgate milk price is at NZ$10.00 per kgMS midpoint with heightened market volatility due to geopolitical tensions.

This creates a perfect storm of revenue risk and demands destruction that forward-thinking operations must address proactively.

The financial case for domestic market investment includes:

  • Risk Mitigation: Diversified revenue streams reduce exposure to trade policy changes
  • Margin Enhancement: Local premium positioning commands higher prices than commodity exports
  • Market Development: Investing in domestic demand creates long-term revenue growth
  • Political Insurance: Strong local relationships provide protection against regulatory intervention

How much of your business plan depends on politicians in other countries making decisions in your favor?

Why This Matters More Than Ever: The Technology Parallel

Three global trends make domestic market strength increasingly critical, and they directly parallel what progressive dairy farmers already understand about technology adoption:

Supply Chain Vulnerability: Just as farmers diversify their genetics portfolio to reduce disease risk, dairy operations need diversified market portfolios. Geopolitical conflicts and climate events can disrupt export markets instantly. Local market strength provides resilience when global systems fail.

Political Risk: Food sovereignty is becoming a political priority worldwide, similar to how environmental regulations increasingly impact dairy operations. Operations that strengthen local food security will benefit from policy support rather than face regulatory pressure.

Consumer Evolution: The families making expensive butter represent a broader shift toward values-driven consumption that prioritizes control, quality, and locality over pure convenience. This mirrors the trend toward premium dairy products with verified quality attributes—higher protein content, grass-fed certification, or specific butterfat levels.

Smart strategic planners recognize these trends aren’t temporary responses to economic pressure—they’re permanent shifts in consumer values that will define future market dynamics.

Implementation Strategies for Different Operation Types

Large Commercial Operations (1,000+ cows): Develop separate product lines and marketing strategies for domestic vs. export markets. Just as you separate high-genetic-merit animals for your breeding program, separate premium milk for local markets. Invest in regional processing capabilities that serve local communities while maintaining export scale.

Implementation timeline: 18-24 months for market development, with significant initial investment required depending on processing infrastructure needs.

Mid-Size Family Farms (250-1,000 cows): Build direct-to-consumer channels that capture retail margins and strengthen community relationships. Focus on quality differentiation rather than volume competition. This is like shifting from breeding for maximum milk volume to breeding for milk components and longevity.

Implementation timeline: 6-12 months for direct sales setup, with a moderate initial investment for on-farm processing and marketing capabilities.

Cooperative Structures: Balance member services between export revenue maximization and domestic market stability. Develop internal markets that protect local purchasing power, similar to how cooperatives already balance individual member needs with collective efficiency.

Are you ready to challenge the export-first orthodoxy that’s leaving communities behind?

The Innovation Imperative: Learning from Transition Management

The butter churning trend reveals something profound about consumer priorities that dairy farmers should recognize immediately: people value empowerment over efficiency when they feel exploited by existing systems.

This parallels what we know about transition cow management. During the critical transition period—three weeks before and after calving—cows need extra monitoring and care despite the additional cost and complexity. Smart farmers invest in transition cow technology, specialized nutrition programs, and dedicated facilities because they understand that short-term costs prevent larger long-term problems.

The same logic applies to domestic market investment. Yes, it’s more complex and potentially less profitable than pure commodity export focus. But the long-term benefits—political insurance, market diversification, premium positioning—justify the investment.

What if you applied the same proactive thinking you use for transitioning cows to your market strategy?

The Numbers Behind the Revolution

Let’s quantify what’s really happening in New Zealand’s dairy transformation:

Market IndicatorImpactStrategic Implication
Butter price increase65.3% in 12 monthsDomestic affordability crisis
Export dependency95% of productionExtreme global market exposure
Food price inflation3.7% annuallyConsumer trust erosion
Milk production forecast21.3 million metric tonsSupply constraints amid demand

These numbers tell a story of systematic domestic market failure that creates both immediate crisis and long-term strategic vulnerability.

The Technology Opportunity That Changes Everything

Here’s something that should make every dairy tech company sit up and take notice: people are voluntarily choosing 30-minute manual processes over convenient store purchases. They’re accepting 5-7 day shelf lives instead of preserved products.

Why? Because they want ingredient transparency and production control.

This creates massive opportunities for dairy operations willing to serve domestic markets with premium, locally-focused products. Forget the race to the bottom on commodity exports—there’s gold in serving people who value quality and locality over pure convenience.

The operations that capture these opportunities will build sustainable competitive advantages that transcend commodity price cycles.

What would happen if you designed your entire operation to empower local consumers instead of satisfy distant commodity buyers?

Challenging the Export-First Orthodoxy

Let’s be blunt about something the industry doesn’t want to admit: the export-first model is fundamentally broken when it creates food insecurity in producing regions.

This isn’t just bad economics—it’s bad strategy. When New Zealand’s government is considering grocery price freezes on essentials, including milk and bread, you know the political risks of export obsession are real and immediate.

The conventional wisdom says export markets offer higher prices and better margins. But what good are higher margins if they come with:

  • Political vulnerability to foreign trade policies
  • Consumer revolt that creates regulatory pressure
  • Market concentration risk that amplifies global volatility
  • Community alienation that undermines social license to operate

It’s time to challenge the assumption that more exports automatically mean better business.

The Bottom Line: Why Change Starts Now

New Zealand’s butter crisis exposes the fatal flaw in export-obsessed dairy strategy: when you price out your own people, you create political risk, market vulnerability, and consumer revolt that can destroy decades of investment.

The families churning expensive butter aren’t nostalgic—they’re strategic. They’re building skills, relationships, and systems that reduce their dependence on global commodity markets. Smart dairy operations will join them instead of fighting them.

Here’s what strategic planners need to do immediately:

  1. Assess domestic market vulnerability: Calculate how global price volatility affects local affordability, just as you’d assess how a disease outbreak would impact your specific genetic lines.
  2. Develop balanced portfolio strategies: Build revenue streams that serve both export and domestic markets, similar to maintaining breeding programs for both production and longevity.
  3. Invest in community relationships: Strengthen local connections before political pressure forces intervention, the same way you invest in cattle comfort before lameness becomes a herd problem.
  4. Create premium local positioning: Differentiate on quality, transparency, and locality rather than competing on commodity pricing. Market your milk’s butterfat content, protein levels, and production standards the way you market your genetics.
  5. Monitor consumer sovereignty trends: Track DIY adoption and local food movement growth in your market using the same data-driven approach you use for monitoring milk production trends.
  6. Challenge export orthodoxy: Question whether maximum export volume truly serves your long-term business interests or if balanced market development offers better risk-adjusted returns.

The revolution has already started. The question isn’t whether domestic food sovereignty will reshape dairy markets—it’s whether you’ll lead the transformation or become its victim.

Don’t wait for your own butter crisis to discover that sustainable success requires serving the communities where you operate, not just the highest bidder globally.

The future belongs to dairy operations that balance global opportunity with local responsibility—just like successful breeding programs balance production potential with genetic diversity. Make sure you’re building both.

Ready to challenge the export-first orthodoxy that’s creating political risk and missing massive opportunities? The choice is yours, but the clock is ticking.

Learn More:

Join the Revolution!

Join over 30,000 successful dairy professionals who rely on Bullvine Weekly for their competitive edge. Delivered directly to your inbox each week, our exclusive industry insights help you make smarter decisions while saving precious hours every week. Never miss critical updates on milk production trends, breakthrough technologies, and profit-boosting strategies that top producers are already implementing. Subscribe now to transform your dairy operation’s efficiency and profitability—your future success is just one click away.

NewsSubscribe
First
Last
Consent

The Butter Revolution That’s Rewriting Dairy Economics: Why Smart Farmers Are Laughing All the Way to the Bank

Stop chasing milk volume. Smart farmers banking 32¢/lb butter gains while you’re missing the component revolution that’s rewriting profitability.

EXECUTIVE SUMMARY: The biggest “I told you so” moment in modern dairy just hit: while everyone obsessed over milk volume, the real money was hiding in plain sight – and butter markets just proved it with a stunning $0.32/lb surge. CME spot butter exploded from $2.24/lb spring lows to $2.56/lb peaks while most farmers focused on the wrong metrics, missing the component revolution that’s fundamentally changed dairy economics. Your Holstein genetics now produce 4.40% butterfat compared to 3.70% two decades ago – that’s nearly 20% more profit per pound of milk, yet most operations still get paid like they’re running 1990s genetics. Americans are consuming butter at 1965 levels despite having 150 million more people, April 2025 consumption hit an all-time record of 200.1 million pounds (up 23%), and U.S. butter trades at a 60% discount to EU prices creating unprecedented export opportunities. Meanwhile, corn at $4.60/bu and favorable feed costs create a golden window for locking contracts while margins remain strong. Stop optimizing for volume and start maximizing component value – the farmers who understand this shift are literally banking the difference.

KEY TAKEAWAYS

  • Genetic Goldmine Unlocked: First and second lactation Holstein cows now average 5% butterfat in top herds, with national averages jumping from 4.01% to 4.33% since 2021 – farms optimizing for components over volume can capture $7,430 additional annual profit per 100 cows through strategic feed cost management
  • Export Arbitrage Opportunity: U.S. butter’s 60% discount to EU prices ($5,140/MT vs $8,250/MT) creates immediate export competitiveness, with 2025 exports already doubling to 42.6 million pounds through April – position now before this pricing advantage disappears
  • Consumer Demand Explosion: Americans consumed 746.8 million pounds of butter through April 2025 (up 8% year-over-year), with March and April setting all-time monthly records – this isn’t seasonal baking, it’s structural market transformation driven by Gen Z’s preference for natural products
  • Component Economics Reality Check: Despite milk production growing just 15.9% from 2010-2024, butterfat pounds surged 30.6% – operations still focused on volume metrics are missing the profit revolution happening in their own bulk tanks
  • Strategic Risk Management Window: CME futures pricing butter at $2.60-$2.70 for Q3 while current spot prices sit around $2.43 creates optimal hedging opportunities – implement tiered coverage at 60-70% while maintaining upside exposure to capture this unprecedented component premium
butter market trends, dairy component pricing, milk profitability strategies, butterfat production optimization, dairy farm economics

The butter market just delivered the biggest “I told you so” moment in modern dairy history. While everyone obsessed over milk volume, the real money was hiding in plain sight – and it’s about to get a whole lot bigger.

The $0.32 Wake-Up Call That Changed Everything

Here’s what happened while you weren’t looking: CME spot butter exploded from December 2021 lows of $2.24/lb to a stunning $2.56/lb peak on June 5 – that’s a 32-cent swing that should have every dairy farmer rethinking their entire operation.

But here’s the kicker – this wasn’t some random market blip. This was the inevitable result of the most significant shift in dairy economics since we started milking cows.

Why Your Holstein Herd Just Became a Goldmine

Let’s cut through the noise and talk numbers that actually matter to your bottom line. U.S. butterfat levels have quietly skyrocketed from 3.70% to 4.40% over the past two decades. That’s not a gradual improvement – that’s a genetic revolution that’s fundamentally changed the math on dairy profitability.

Think about it: your cows produce nearly 20% more butterfat per pound of milk than in 2000. Yet most farmers are still getting paid like they’re running 1990s genetics.

The Component Reality Check:

  • First and second lactation Holstein cows now average 5% butterfat in top herds
  • Federal Order data shows butterfat jumping from 4.01% in March 2021 to 4.33% by March 2025
  • Despite milk production growing just 15.9% from 2010-2024, butterfat pounds surged 30.6%

This isn’t just data – it’s your competitive advantage if you know how to use it.

Americans Are Eating Butter Like It’s 1965 (But There Are 150 Million More of Them)

Here’s where the demand story gets absolutely wild. Americans consumed 6.5 pounds of butter per capita in 2023 – the highest level since 1965. But here’s what most analysts miss: we had 150 million fewer people in 1965.

The spring 2025 consumption numbers are breaking every record in the book:

  • April 2025: 200.1 million pounds consumed (all-time April record, up 23% year-over-year)
  • March 2025: 209.9 million pounds (new March record, up 3%)
  • Year-to-date through April: 746.8 million pounds, representing an 8% jump over 2024

This isn’t seasonal baking demand – this is structural transformation. And it’s happening while plant-based alternatives are supposedly taking over the world.

The Export Opportunity Everyone’s Missing

While domestic demand explodes, U.S. butter exports more than doubled to 42.6 million pounds through April 2025. Why? Because we’re selling at a massive discount to global prices.

The Global Arbitrage Goldmine:

  • U.S. butter: $5,140/MT
  • EU butter: $8,250/MT
  • That’s a 60% discount that won’t last forever

European butter prices were 45% higher than U.S. levels in April 2025. This pricing differential creates unprecedented export opportunities that could vanish overnight if trade dynamics shift.

Why Feed Costs Are Your Secret Weapon Right Now

Here’s your tactical advantage: corn at $4.60/bu, soybean meal at $290/ton, and alfalfa hay at $159/ton are trending lower than 2024. Smart farmers can lock in these costs and save $7,430 annually per 100 cows.

Your Action Plan:

  1. Audit your milk contract’s component premiums immediately
  2. Consider culling low-fat cows to maximize per-cow profitability
  3. Lock in feed contracts while costs remain favorable
  4. Focus breeding decisions on butterfat genetics, not just volume

The Production Reality That’s Confusing Everyone

Here’s the paradox that’s driving markets crazy: despite reducing the national herd by 557,000 cows in 2024, calculated milk solids production increased by 1.345%.

February 2025 U.S. butter production rose 2.6% year-over-year to 203 million pounds, partly because “weaker cheese, ice cream, and sour cream production freed up some fat for butter.”

This “silent growth” in component output means effective butter supply can continue expanding even if raw milk volume stays flat. That’s why volume-focused farmers are missing the boat while component-focused operations are printing money.

The Class IV Revolution You Need to Understand

Butter now absorbs 18% of the U.S. milk supply on a milkfat basis, up from 16% in 2000. The weighted average retail price has maintained a higher range since April 2022, typically fluctuating between $3.79/lb and $4.68/lb, providing strong support for Class IV milk prices.

CME futures are pricing butter in the $2.60-$2.70 range for Q3, compared to current spot prices around $2.43. If food service cream demand improves and new cheese plants absorb more milk, prices could climb even higher.

What the Smart Money Is Doing Right Now

Current market conditions represent what analysts call a “golden window” for 2025, with futures trading at significant premiums to USDA forecasts. Here’s how forward-thinking operations are positioning themselves:

Risk Management Strategy:

  • 60-70% coverage at current premium levels
  • Maintain upside exposure for potential rallies
  • Lock feed costs while margins remain favorable

Genetic Focus:

  • Prioritize butterfat content over volume in breeding decisions
  • Cull low-component cows that dilute profitability
  • Track component premiums in milk pricing

The Global Reality Check

Plant-based alternatives could capture 15-20% of the U.S. market by 2030. But here’s what the doom-and-gloom crowd isn’t telling you: the growth is happening in premium, organic, and grass-fed butter varieties that command higher prices.

Gen Z consumers are leading a charge toward “better-for-you” and natural products. They’re not abandoning butter – they’re upgrading to premium versions and paying more for them.

The Bottom Line: Component Economics Have Permanently Changed

The butter market’s explosive rally isn’t just about supply and demand – it’s validation that dairy economics have permanently shifted toward components over volume. The convergence of genetic advances producing unprecedented butterfat levels, surging consumption among younger demographics, and export opportunities created by favorable U.S. pricing has created a perfect storm of profitability.

Your competitive advantage depends on three critical decisions:

  1. Optimize for components, not volume – Audit your breeding program and milk contracts
  2. Lock in favorable input costs – Feed prices won’t stay this friendly forever
  3. Implement strategic risk management – Use tiered hedging to capture the upside while protecting the downside

The data is crystal clear: butter demand isn’t just lifting markets – it’s rewriting the rules of dairy profitability. The question isn’t whether this trend will continue but whether your operation is positioned to capitalize on the most significant transformation in dairy economics in a generation.

Americans are consuming butter at levels not seen since 1965 despite having 150 million more people today. Your cows produce butterfat levels that would have been impossible two decades ago. Global pricing favors U.S. exports like never before.

The revolution is here. The only question is: are you ready to profit from it?

Learn More:

Join the Revolution!

Join over 30,000 successful dairy professionals who rely on Bullvine Weekly for their competitive edge. Delivered directly to your inbox each week, our exclusive industry insights help you make smarter decisions while saving precious hours every week. Never miss critical updates on milk production trends, breakthrough technologies, and profit-boosting strategies that top producers are already implementing. Subscribe now to transform your dairy operation’s efficiency and profitability—your future success is just one click away.

NewsSubscribe
First
Last
Consent

Global Dairy Markets Navigate Choppy Waters as Trading Volumes Surge Despite Price Pressures

Stop believing high trading volumes equal market strength. Record 20,641-tonne SGX week signals price chaos—smart money’s repositioning now.

EXECUTIVE SUMMARY: The biggest trading week in months just revealed what conventional market wisdom won’t tell you: massive volumes don’t mean bullish sentiment. While Singapore Exchange crushed records with 20,641 tonnes traded—nearly 14 times European volumes—whole milk powder prices still dropped 4.3% and skim milk powder fell 2.1%. China’s strategic 5% import reduction is permanently reshaping global demand patterns, forcing a fundamental supply-demand recalibration that conventional analysis misses entirely. Irish farmers capitalizing on 12.6% production growth while European butter prices climb €50 weekly demonstrates the bifurcated reality: consumer-facing products outperform industrial ingredients by massive margins. U.S. cheese exports hit all-time daily averages, yet spot Cheddar failed to break $2.00—proving that production records don’t automatically translate to price premiums. The data screams one truth: we’re witnessing early-stage rebalancing where efficiency and market positioning matter more than historical volume assumptions. Stop trading on yesterday’s patterns and start positioning for tomorrow’s supply-demand reality.

KEY TAKEAWAYS

  • Volume Deception Alert: Record SGX trading (20,641 vs 1,500 tonnes EEX) with simultaneous price drops signals smart money repositioning—not bullish sentiment. Farmers relying on volume indicators for pricing decisions are missing critical market shifts.
  • China’s Structural Pivot: 5% import reduction isn’t cyclical—it’s permanent domestic production strategy. Operations targeting Chinese export markets must diversify immediately or face chronic oversupply conditions through 2026.
  • Bifurcated Profit Zones: European butter gains €50 weekly while powder markets crater, revealing the €462 (+11.8% y/y) consumer-facing premium. Producers should prioritize cheese and butter over commodity powders for immediate margin protection.
  • Irish Production Surge: 12.6% collection growth (1,104kt April) creates supply pressure that traditional seasonal analysis underestimates. Competing regions must focus on cost efficiency and quality premiums to maintain market share.
  • U.S. Export Contradiction: All-time cheese export records with failed .00 Cheddar breakthrough proves global competitiveness doesn’t guarantee domestic pricing power. American producers need forward contract strategies, not volume celebration.
global dairy market, dairy commodity prices, milk futures trading, dairy market analysis, dairy industry trends

The past week delivered a masterclass in market contradictions, with record-breaking trading volumes masking underlying price weakness across multiple dairy commodity platforms. While European butter prices continue their relentless climb and cheese markets show surprising resilience, powder markets send mixed signals that should have every dairy farmer paying attention.

Trading Floors Heat Up While Prices Cool Down

EEX’s Modest Performance Tells a Bigger Story

The European Energy Exchange saw 1,500 tonnes change hands last week, with Thursday emerging as the standout session at 525 tonnes. But here’s what the headline numbers don’t tell you: butter futures actually dropped 0.3% to €7,383, while skim milk powder fell to €2,541.

This isn’t just market noise. When you see heavy trading volumes alongside price declines, you’re witnessing real-time disagreement between buyers and sellers about where the fair value lies. The fact that 1,275 tonnes of butter traded while prices slipped suggests either profit-taking from earlier gains or genuine supply pressure building in European markets.

SGX Dominates with Massive Volume Surge

Now, let’s talk about where the real action happened. Singapore Exchange crushed it with 20,641 tonnes traded – nearly 14 times EEX’s volume. Whole milk powder led the charge with 11,115 lots, followed by SMP at 8,816 lots.

But here’s the kicker: even with this massive trading interest, WMP prices still dropped 0.1% to $3,841, and SMP fell harder at 1.0% to $2,866. The only bright spots were anhydrous milk fat jumping to $6,910 and butter edging up 0.5% to $6,862.

What does this tell us? Asian buyers are actively repositioning their portfolios, but they’re not paying premiums to do it. That’s either smart money sensing opportunity in the weakness or institutional selling creating the very pressure we’re seeing.

European Quotations Paint a Contradictory Picture

Butter Marches Higher Despite Futures Weakness

The EU weekly quotations delivered some head-scratching results. While EEX butter futures were declining, physical European butter prices gained €50 to €7,457 – a solid 0.7% weekly jump. Dutch butter led the charge with a €100 increase to €7,400, while French butter added €51 to €7,521.

This disconnect between physical and futures pricing isn’t accidental. It suggests immediate European demand remains robust while longer-term sentiment cools. For dairy farmers, this means current milk checks might stay strong even if forward contract prices are softening.

Powder Markets Show Resilience

SMP quotations gained €25 to €2,425, with Dutch SMP posting the strongest performance at €2,440 after a €50 increase. German SMP added €15 to €2,435, while French SMP gained €10 to €2,400. This strength in physical markets while futures decline creates an interesting arbitrage opportunity that smart traders are already exploiting.

Regional Production Patterns Reveal Critical Trends

Ireland’s Explosive Growth Continues

Irish milk collections jumped 12.6% in April to 1,104 thousand tonnes, pushing year-to-date volumes to 2.46 million tonnes – an impressive 8.5% ahead of 2024. Irish farmers deliver both volume and quality, with milkfat at 4.08% and protein at 3.47%.

This isn’t sustainable at current growth rates. Irish dairy expansion is happening faster than global demand growth, which means either prices have to adjust or production growth has to slow. The laws of supply and demand haven’t been suspended.

Southern Europe Struggles While Northern Europe Thrives

Spain’s milk production fell 1.0% to 641 thousand tonnes, while Italy dropped 0.6% to 1.17 million tonnes. Meanwhile, Ireland’s explosive growth creates a tale of two Europes. The weather patterns explain much of this – Ireland’s optimal grassland conditions contrast sharply with drought concerns across much of southern Europe.

China’s Farmgate Reality Check

Chinese farmgate prices at 3.07 Yuan/kg represent a brutal 9.4% year-over-year decline. At €37.00/100kg equivalent, Chinese farmers are getting paid roughly half what their European counterparts receive. This price differential explains why Chinese domestic production continues expanding while import demand weakens.

Weather Wildcards Reshape Production Landscapes

Europe’s Tale of Extremes

This spring ranks among the driest on record since 1991 across Benelux, northern France, Germany, western Poland, and Sweden. Most regions received only 50% of normal precipitation, raising serious concerns about crop yields.

But here’s the twist: Ireland’s grasslands remain in optimal condition with perfect growing weather. Meanwhile, Italy and Greece benefit from abundant rainfall and positive yield expectations. This creates a productivity gap that will influence milk production patterns for months ahead.

New Zealand’s Cautious Contraction

Dairy cow slaughters in New Zealand plummeted 25.2% in April, with 12-month rolling slaughters down 7.3% to 751 thousand head. This represents a deliberate herd size reduction that will constrain Oceania’s export capacity moving forward.

Smart Kiwi farmers are reading the global demand signals and adjusting accordingly. When your primary export markets show weakness, you don’t expand – you optimize.

US Market Dynamics Offer Global Lessons

Export Surge Masks Domestic Challenges

US cheese exports hit all-time daily averages in April, jumping 6.7% from already strong 2024 levels. American cheese and butter remain the world’s cheapest, creating a competitive export advantage that’s supporting domestic prices.

But there’s trouble brewing. Due to tariffs and trade tensions, Canadian butter buyers are looking elsewhere, causing US butter export momentum to slow from its February-March peak. When politics interfere with the dairy trade, everybody loses.

Powder Markets Face Structural Headwinds

The US-China trade war continues reshaping whey powder flows. China historically takes 40% of US whey exports, but tariff threats prompted massive March purchases followed by an April retreat to Belarus and New Zealand suppliers. CME spot dry whey rallied 0.75¢ to 58¢ per pound – its highest level in nearly four months.

US nonfat dry milk exports fell 20.9% in April to 113.5 million pounds as European suppliers gained market share in Southeast Asia. Mexico remains strong, but losing Asian market share to European competitors signals a fundamental competitiveness challenge.

Production Surge Creates Market Tensions

Cheese Plants Ramp Up Output

US cheese production reached 1.23 billion pounds in April – the highest daily average on record. Cheddar production jumped 8.1% year-over-year as new plants work through startup issues. This production surge explains why spot Cheddar failed to reach $2.00 and pulled back to close at $1.8575.

Butter Production Peaks Despite Price Strength

Manufacturers filled churns with cheap cream in April, pushing butter output to 215.8 million pounds – the highest April volume since 2020. Yet healthy domestic demand and improving exports offset this production increase, keeping prices climbing to $2.555 per pound.

This demonstrates that strong demand can absorb significant production increases when export markets remain competitive.

Class Prices Reflect Market Realities

Class III Futures Signal Caution

Cheese market weakness deflated nearby Class III prices, with June falling 41¢ to $18.80 per cwt and July dropping nearly 70¢ to $18.90. However, deferred contracts edged higher, promising milk revenues in the high-$18s and low $19s into early 2026.

Class IV Shows Strength

Class IV futures climbed across the board, with June settling at $18.42 and July reaching $19.16. September through December contracts returned above $20. Combined with record-high beef revenues, these milk checks easily cover operating costs.

Feed Markets Provide Stability

Corn Prices Hold Steady

July corn finished at $4.42 per bushel, down just 1.5¢ for the week. The December contract rallied over 10¢ to $4.49 as wet conditions in Ohio, Pennsylvania, and the Southeast forced some farmers to abandon unplanted acres.

Soybean Complex Gains on Policy Speculation

Soybean oil prices climbed on rumors that the Trump administration might announce renewable fuel credit decisions benefiting biodiesel. July soybeans closed at $10.58, up 16¢ weekly, while meal held steady at $296 per ton.

The Bottom Line

This week’s trading data reveals a global dairy market in transition. Record trading volumes reflect real disagreement about fair value, while regional production patterns create both opportunities and risks for forward-thinking farmers.

The key insight? We’re seeing the early stages of a supply-demand rebalancing that will favor producers who can maintain efficiency while competitors struggle with weather, feed costs, or market access.

European farmers should capitalize on current strength while monitoring powder market signals. US producers need to watch cheese production capacity and export market developments. And everyone should pay attention to China’s farmgate price trends – they’re previewing what happens when domestic production growth outpaces local demand.

Smart money is positioning for volatility. The question is whether you’re ready to navigate the choppy waters ahead or if you’re still fighting the last market cycle.

What’s your operation doing to prepare for these shifting global dynamics? The data suggests now’s the time to decide.

Learn More:

Join the Revolution!

Join over 30,000 successful dairy professionals who rely on Bullvine Weekly for their competitive edge. Delivered directly to your inbox each week, our exclusive industry insights help you make smarter decisions while saving precious hours every week. Never miss critical updates on milk production trends, breakthrough technologies, and profit-boosting strategies that top producers are already implementing. Subscribe now to transform your dairy operation’s efficiency and profitability—your future success is just one click away.

NewsSubscribe
First
Last
Consent
Send this to a friend