


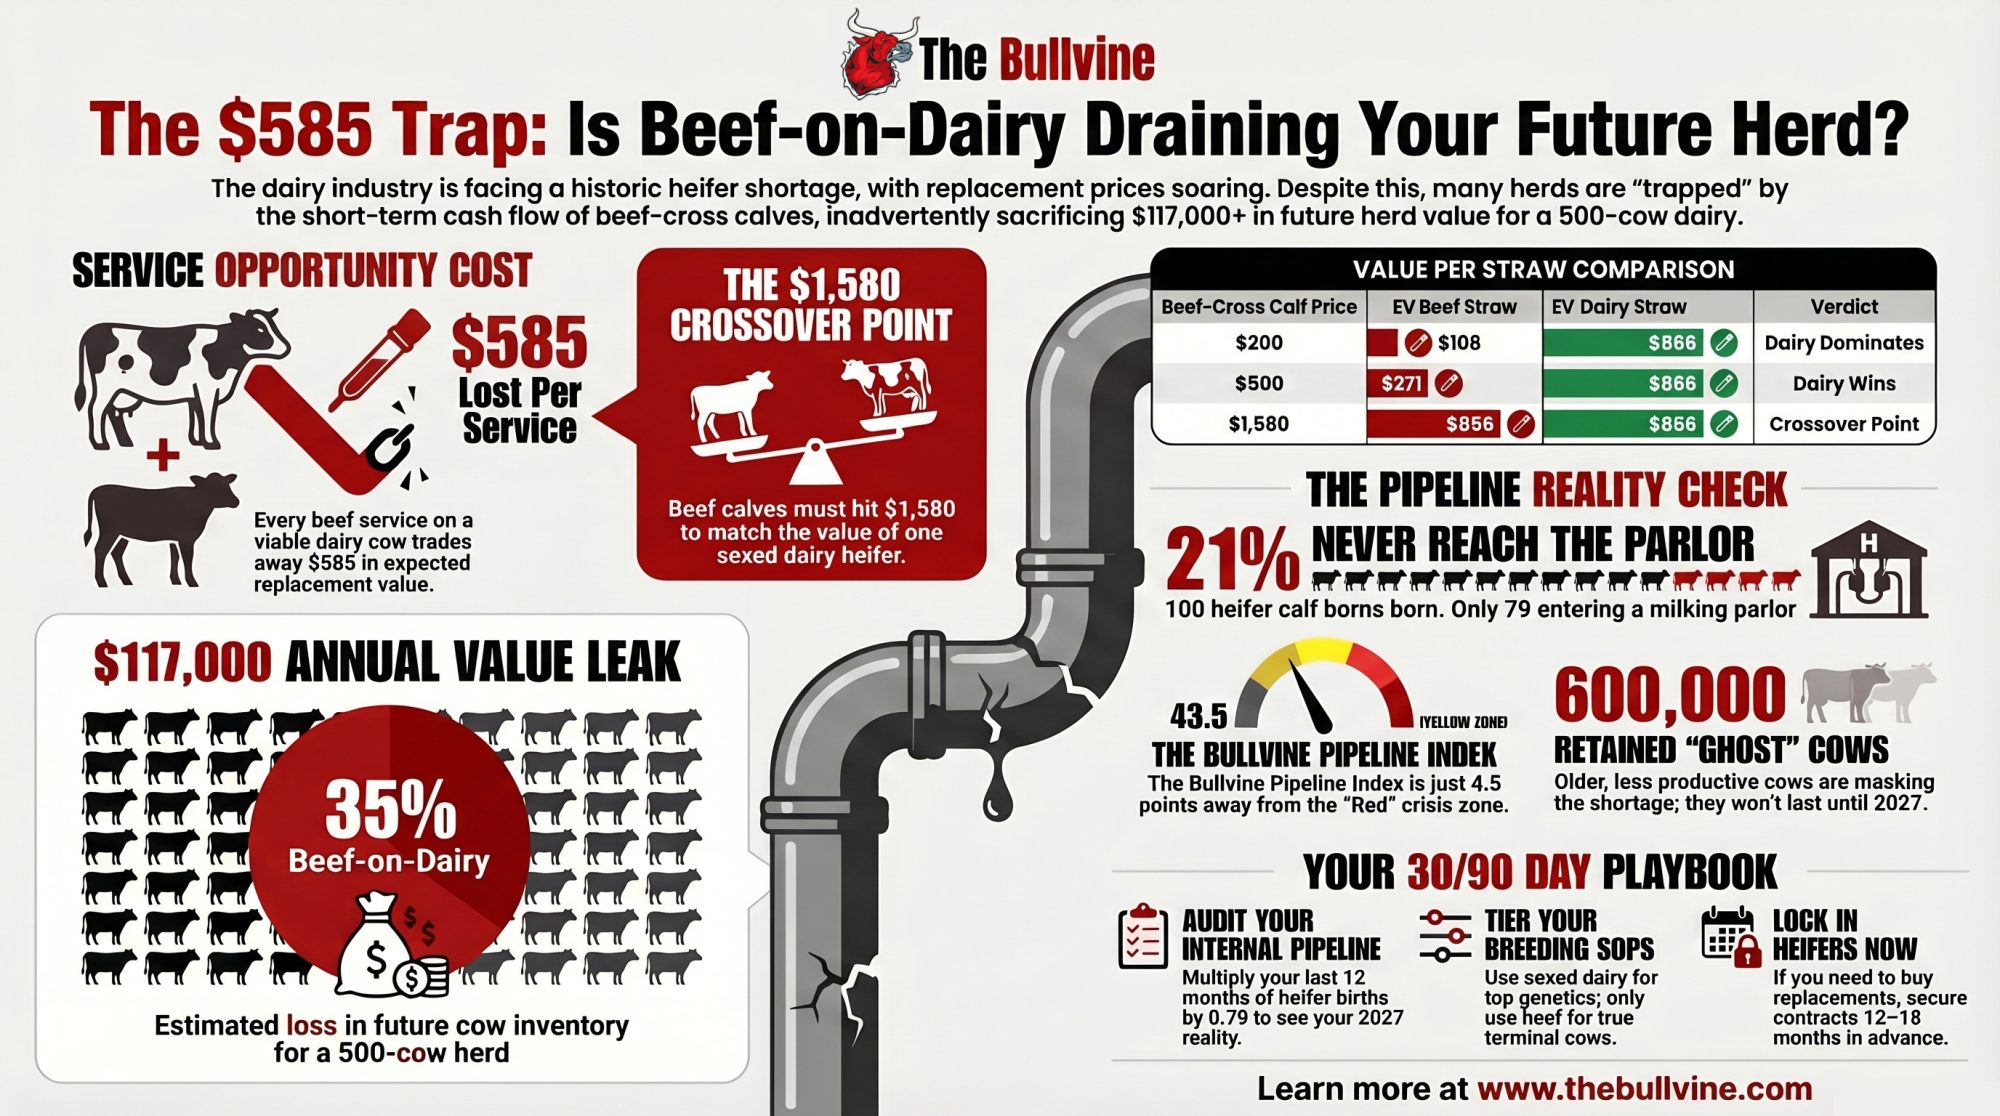
200 beef services on a 500‑cow herd work out to $117,000 in lost replacement value. The calves look good today. The pipeline doesn’t in 2027.
A 500‑cow Panhandle dairy shipping to one of the new plants outside Amarillo needs 135 replacement heifers a year at a 27 percent turnover rate. At the current national average of $3,010 per head (USDA Agricultural Prices, July 2025), that’s a $406,350 annual replacement line — closer to $500,000 in the premium bands Texas and California producers are actually paying. And the Bullvine Replacement Pipeline Tracker shows only 4.29 million heifers entering the national milking herd in 2027 from 2025 breedings, against a herd of 9.35–9.57 million cows and $11 billion in new processing steel that needs milk.
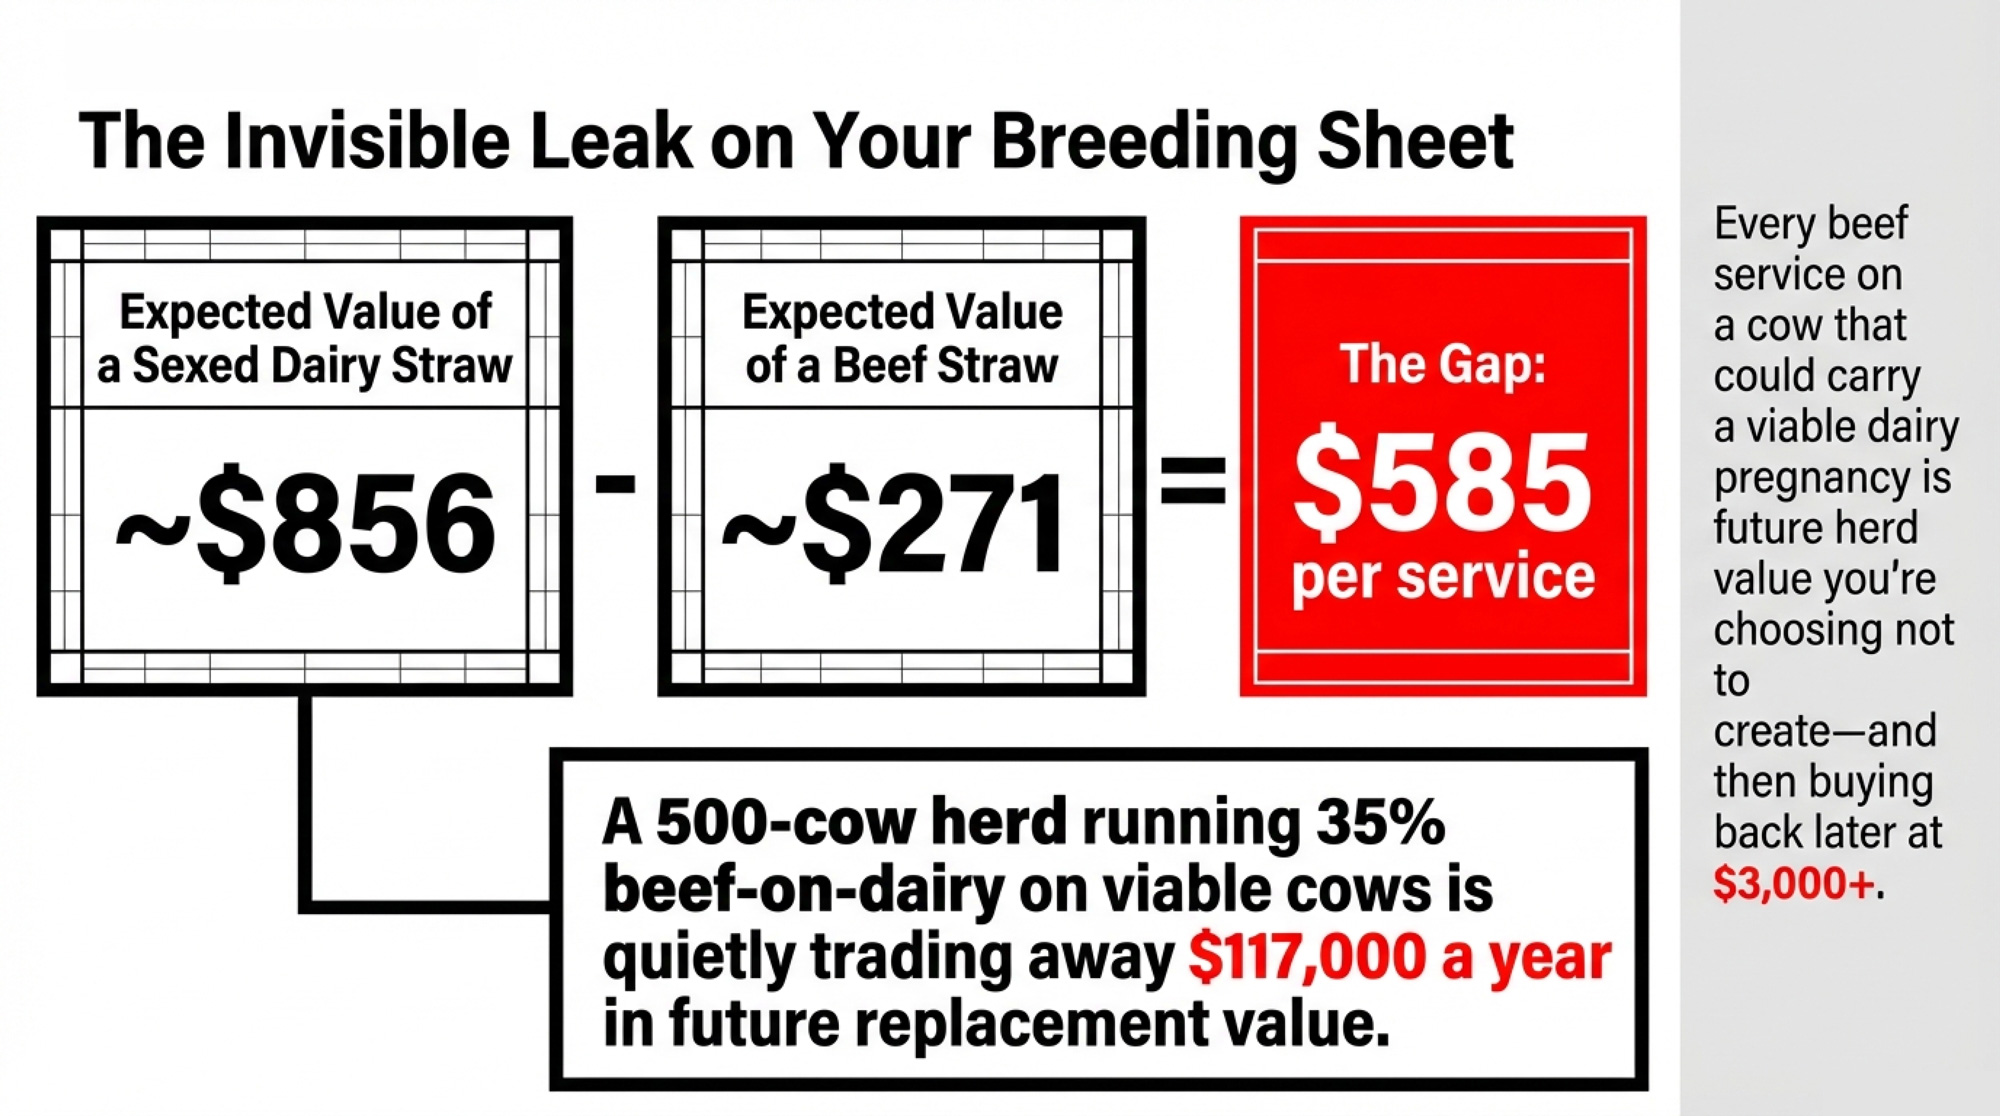
Meanwhile, that same herd’s breeding sheet is probably still heavy on beef‑on‑dairy. Two years ago, beef‑cross calves brought $900–$1,400 in the right programs. Today, a sexed dairy straw generates an expected value of roughly $856while a beef straw sits near $271 at a $500 calf price. Every beef service on a cow that could carry a viable dairy pregnancy is a $585 gap in expected replacement value. How many of those services can your 2027 herd absorb before you’re buying someone else’s genetics at $3,500+?
The Pipeline Math: From Semen Straw to Milking Cow
The Bullvine Replacement Pipeline Tracker takes NAAB’s domestic semen sales and applies biological conversion rates. Not vibes. Multiplication.
From the NAAB 2025 Year‑End Report (released March 2026), domestic units only:
- 10.6 million units of sexed dairy semen (+644,000, up 6 percent vs. 2024).
- 6.0 million units of conventional dairy (down about 280,000).
- 8.1 million units of beef‑on‑dairy (flat).
NAAB members exported 63 percent of the dairy semen they produced in 2025. Those export doses never enter U.S. cows. Only the domestic units drive your pipeline.
Sexed semen now represents 64 percent of domestic dairy units, up from roughly 58 percent a year earlier. That shift matters enormously in the pipeline math because of what happens at each biological step.
The conversion rates — documented by Dr. Michael Overton of Zoetis from field data across 85 commercial Holstein herds:
| Parameter | Sexed | Conventional |
| Conception rate | 42 percent (range 40–45) | 57 percent (range 55–60) |
| Pregnancy survival | 95 percent | 95 percent |
| Sex ratio (heifer) | 90 percent | 50 percent |
| Completion rate (calf to milking cow) | 79 percent | 79 percent |
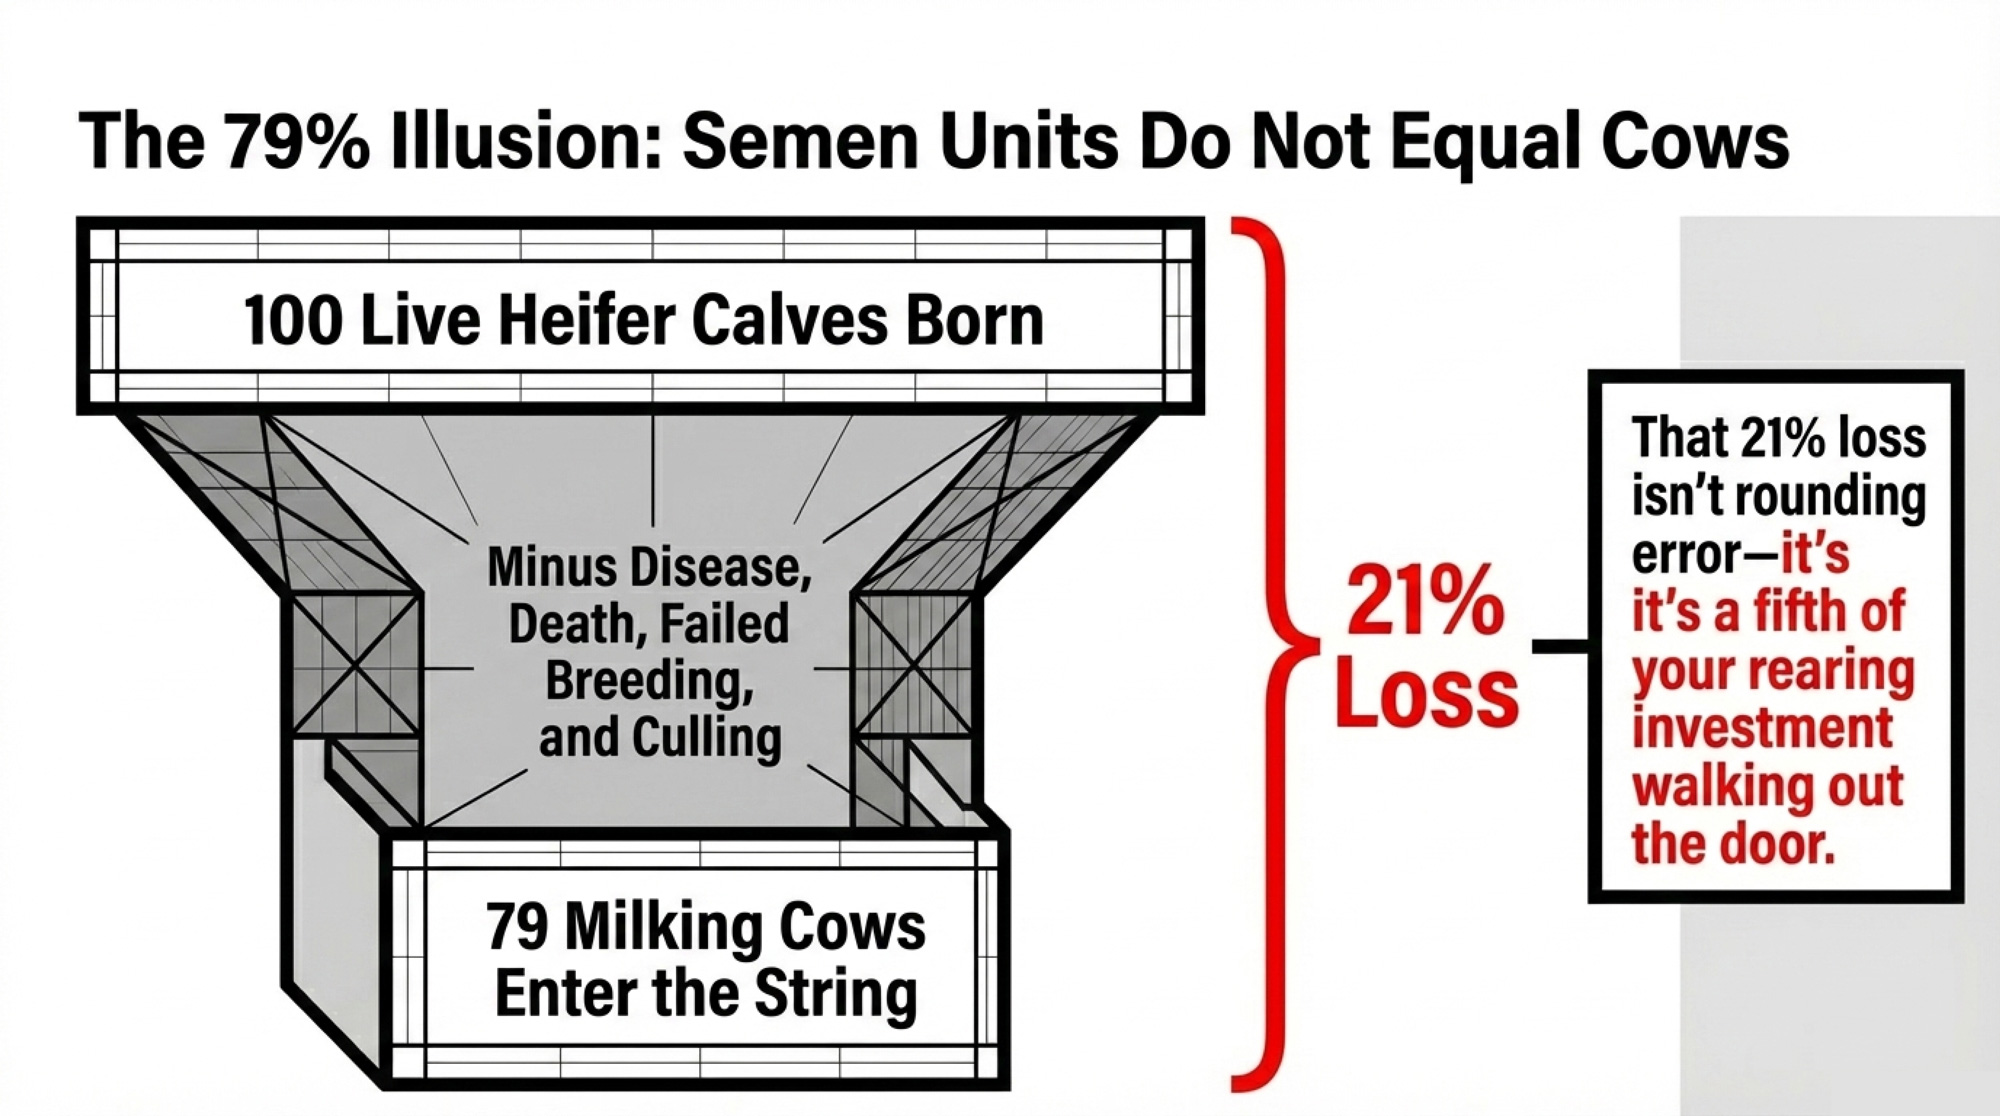
That 79 percent completion rate is the one most producers underestimate. Twenty‑one out of every 100 heifer calves born alive never make it to the milking string. Disease. Death. Failed breeding. Culled before first calving. That’s not rounding error — it’s a fifth of your rearing investment walking out the door.
Run the national numbers:
| Stage | Sexed Dairy | Conventional | Total |
|---|---|---|---|
| Domestic Semen Units | 10.60M | 6.00M | 16.60M |
| Pregnancies | 4.45M | 3.42M | 7.87M |
| Live Calves | 4.23M | 3.25M | 7.48M |
| Heifer Calves | 3.81M | 1.62M | 5.43M |
| Milking Herd Entries | 3.01M | 1.28M | 4.29M |
That’s your 4.29 million heifers for 2027. The USDA Cattle Inventory (January 2025) counted just 3.91 millionreplacement heifers on U.S. farms — the lowest in nearly five decades and 18 percent below the 2018 peak. Corey Geiger and the CoBank team (CoBank Knowledge Exchange, August 2025) project the heifer trough extending through 2026 — roughly 438,844 fewer heifers vs. 2025 — before a partial rebound of about 285,387 more in 2027. Geiger’s CoBank model works at the national level with annual NAAB data, which is a huge step forward, and the Bullvine version builds on it in three ways. First, we overlay weekly USDA dairy cow slaughter data so that the projections adjust as culling behavior shifts, rather than waiting for the next annual semen report. Second, we break the projections down by state, because a heifer surplus in Idaho doesn’t help a short herd in New York once you factor in freight, biosecurity, and breed mix. Third, we bolt on a beef‑on‑dairy tipping‑point calculator that turns semen mix trends into an expected‑value crossover number — like the $1,580 beef‑calf price where beef finally matches sexed dairy — so breeding decisions can move now, not a year from now.
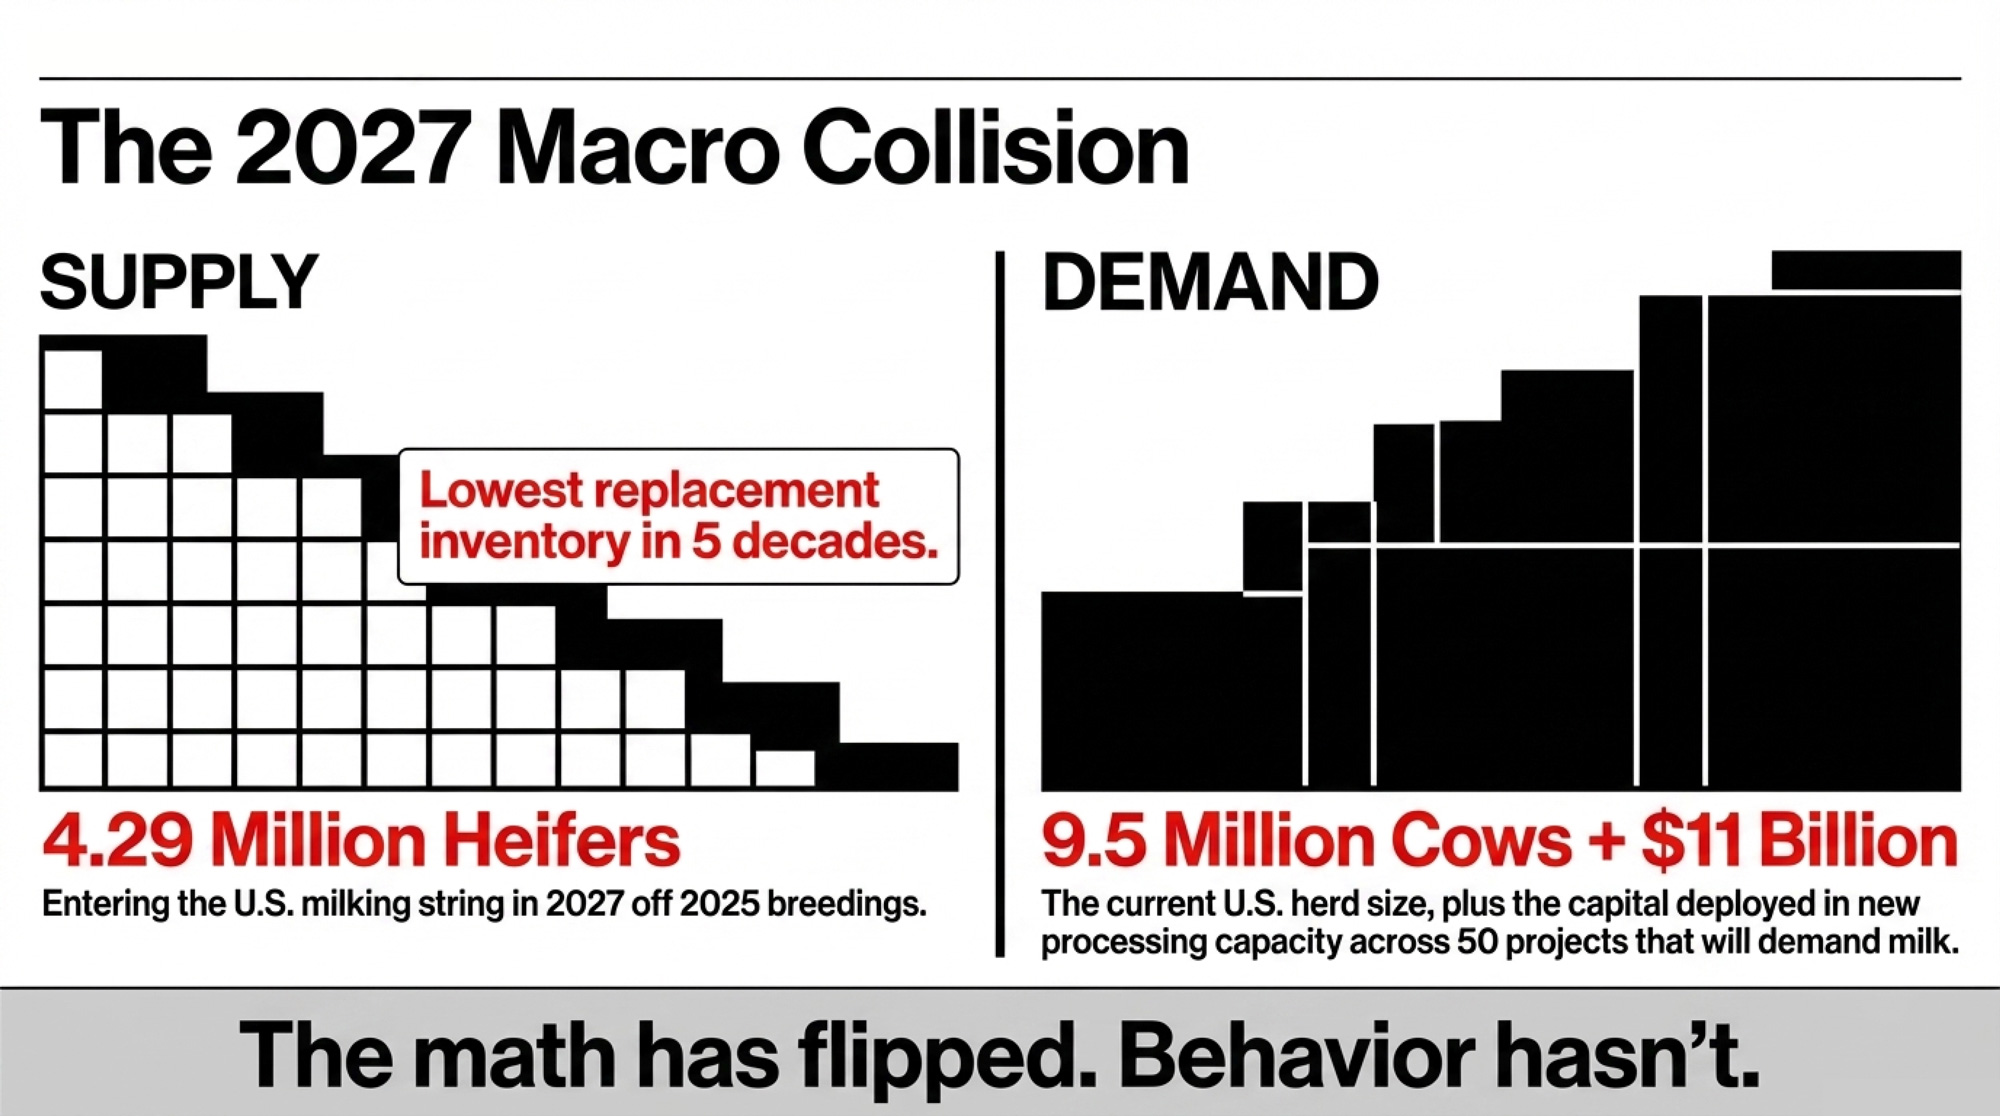
That 2027 rebound is real. But it’s a rebound from a historic low, into a herd that’s expected to fill $11 billion in new processing capacity across more than 50 projects in 19 states.
That conversion pipeline — semen to pregnancy to live calf to heifer to milking cow, with losses at every step — is the spine of the Bullvine Replacement Pipeline Tracker and the reason it can tell you today what your 2027 cow supply will look like.
How Many Replacement Heifers Do 2025 Breedings Actually Produce?
Here’s where that national number lands on your farm. If you’re running 500 cows with a 27 percent replacement rate, you need 135 heifers a year. To produce 135 heifers internally, you need your sexed dairy services generating enough heifer calves — multiplied by 0.79 — to cover that number.
A herd using 50 percent beef‑on‑dairy on the bottom tier produces almost exactly the number of heifers it needs to hold size after applying Overton’s 79 percent completion rate. Zero margin for error. One bad calfhood disease event, one stretch of below‑average conception rates, and you’re short. That’s not a plan — that’s a coin flip with $406,350consequences.
Quick check: your last 12 months of heifer‑calf births × 0.79 vs. herd size × your replacement rate — that spread is your 2027–2028 problem. If you land at 110 or 115 instead of 135, your future herd is already under‑built. No market rally generates animals that aren’t in your pipeline.
When Does Beef‑on‑Dairy Actually Stop Paying?
At what beef‑cross calf price does beef semen become a better economic play than sexed dairy on the same cow?
Sexed dairy expected value per straw: $3,010 × 0.42 × 0.95 × 0.90 × 0.79 ≈ $856.
Beef expected value per straw (at a $500 pre‑weaned calf): $500 × 0.57 × 0.95 ≈ $271.
More than three times the expected value for dairy. But the scenario table tells the full story:
| Beef Calf Price | Beef EV/Straw | Sexed Dairy EV | Dairy Advantage | Verdict |
|---|---|---|---|---|
| $200 | $108 | $856 | $748 | Dairy dominates |
| $500 | $271 | $856 | $585 | Dairy wins |
| $1,000 | $542 | $856 | $314 | Dairy still ahead |
| $1,500 | $812 | $856 | $44 | Near breakeven |
| $1,580 | $856 | $856 | $0 | Crossover |
| $2,000 | $1,083 | $856 | –$227 | Beef wins |
Beef calves have to clear $1,580 per newborn/pre‑weaned calf to match sexed dairy’s expected value at a $3,010heifer. Current beef‑cross calf prices from dairy herds range from $200 to $500+, depending on genetics and region. Some high‑end weaned feeders at 500–700 pounds push higher in program and video sales, but at the breeding‑decision level — the straw going in the gun — the math isn’t close.
Three behavioral reasons explain why producers haven’t caught up. Cash flow timing: a beef calf brings a check in weeks; a heifer generates milk in about 24 months. Strategy inertia: programs built when calves pulled $900–$1,400haven’t been rewritten. The lag itself: any heifer you aim to calve in 2028 has to be conceived now, and that feels like forever when feed bills hit monthly.
None of that makes the choice crazy in the moment. It just explains why behavior hasn’t caught up to the math — and why the pipeline keeps bleeding.
The Turn: $117,000 on One Panhandle Breeding Sheet
Here’s where this gets personal for that 500‑cow Panhandle herd.
Say the operation’s been running 35 percent beef‑on‑dairy on cows classified as bottom‑third — roughly 200 beef services a year on animals that could carry a dairy pregnancy. At a $585 per‑service expected‑value gap:
200 beef services × $585 ≈ $117,000 in expected replacement value traded away per year.
| Cost Driver | Annual $ Exposure | Category |
|---|---|---|
| Base Replacement Budget (27% rate × $3,010/head) | $406,350 | Base Budget |
| TX/CA Premium Band Uplift | $93,650 | Direct Cost Premium |
| Lost EV: 200 Beef Services × $585 | $117,000 | Hidden Risk (Red) |
| Potential 2027 Bid Premium ($3,500+ vs. $3,010) | $295,000 | Future Risk (Red) |
That’s not a clean line item on the P&L. It’s future cow inventory value you’re choosing not to create — and then buying back at $3,010+ when the auction ring gets to it. The number shifts with your calf price and your local heifer cost, but the direction doesn’t. At current market levels, that Panhandle herd’s breeding sheet is quietly writing checks that the pipeline can’t cash in 2027.
This is where the conversation should change. Not “heifers are tight” — which is weather talk — but “how much expected value am I giving up per service, and can my pipeline absorb it?”
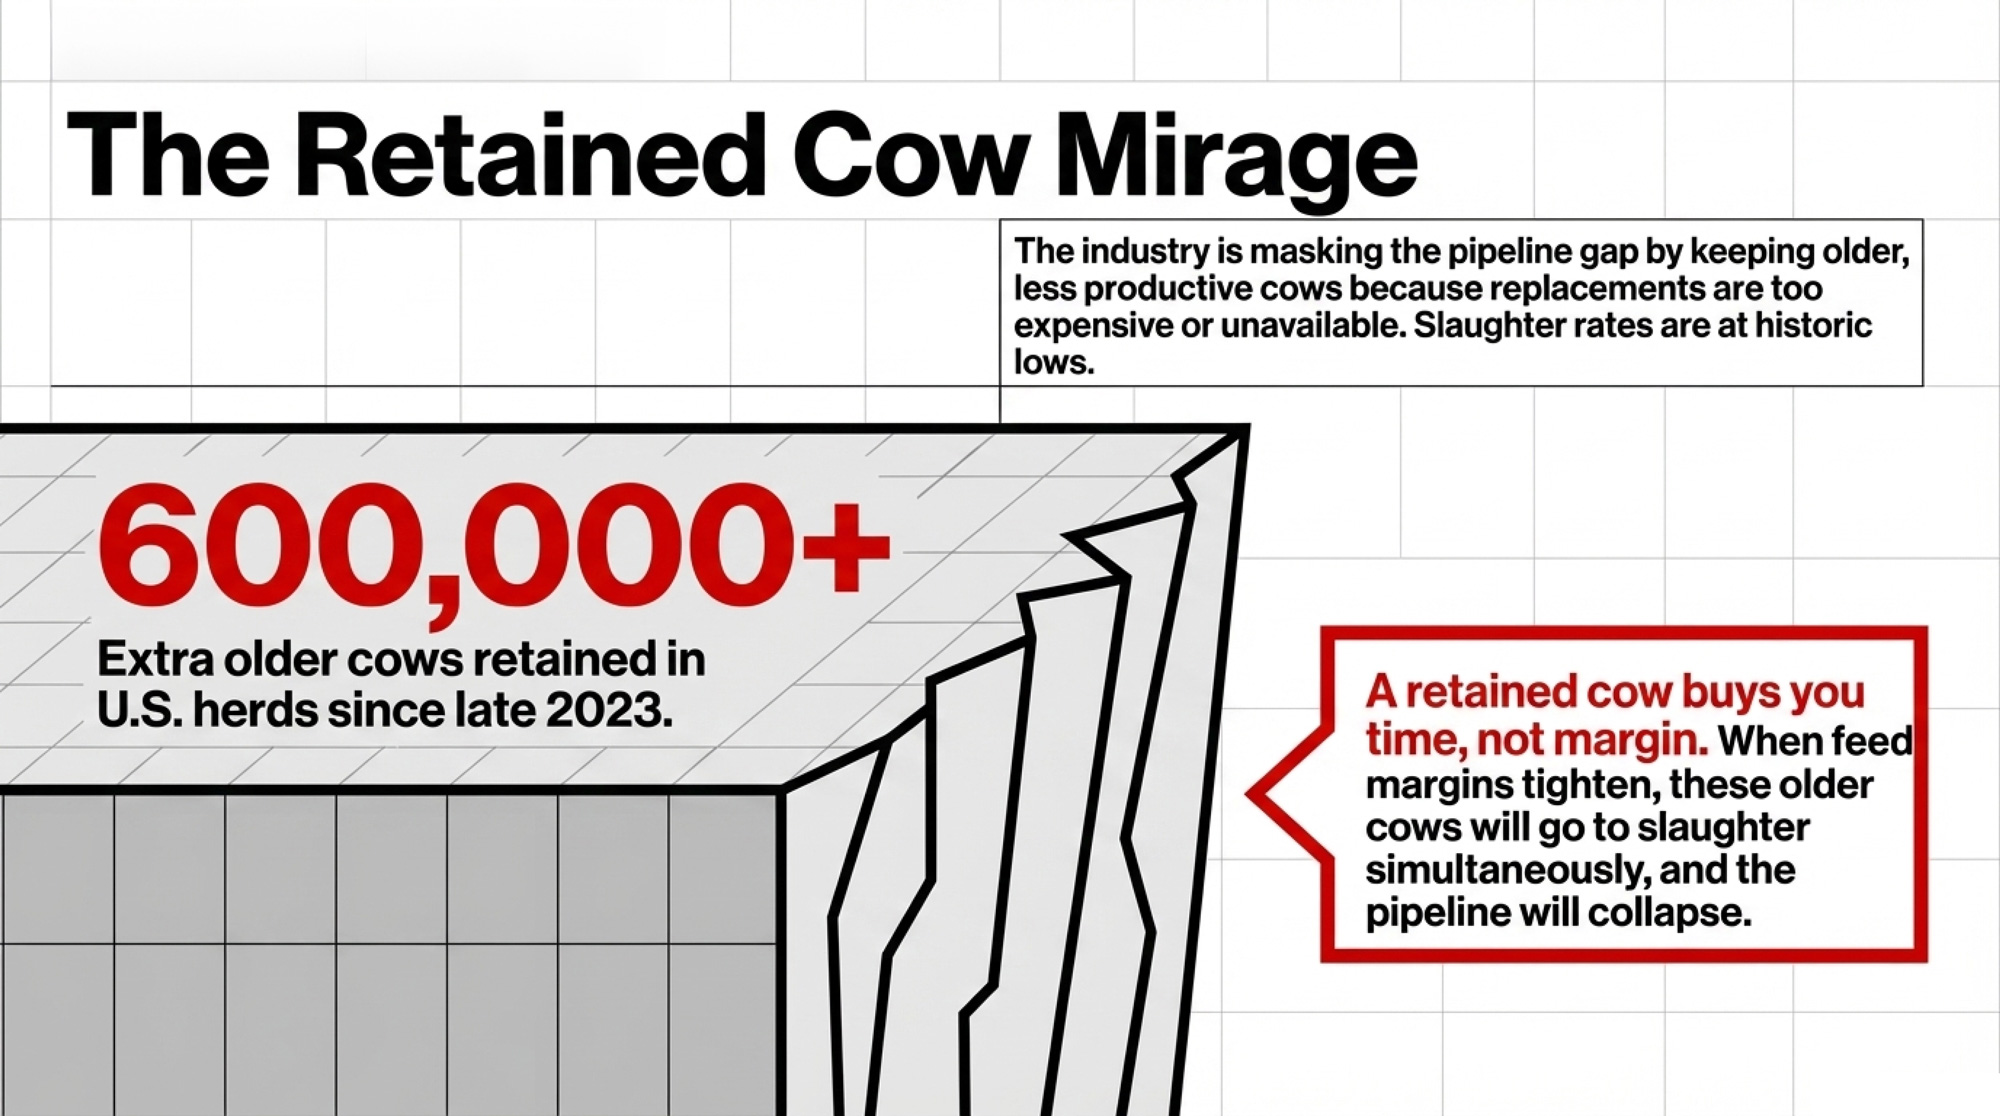
600,000 Retained Cows and the Cliff Underneath
The industry’s been masking the pipeline gap with cow retention. Iowa State Extension’s NW Iowa Dairy Outlook has tracked it since late 2023: from September 2023 through mid‑May 2025, weekly dairy cow slaughter ran behind year‑earlier levels in 86 of 88 weeks. January–April 2025 slaughter came in at roughly 889,900 head — the lowest start to a year since 2008. By the second half of 2025, culling ticked up 2.7 percent as the herd reached 9.57 million head — its largest since the early 1990s — but levels remain historically low.
Bullvine’s modeling extends that documented deficit through late 2025 and estimates the cumulative “extra cows kept” at roughly 600,000–611,600 head vs. the normal culling pace. These aren’t USDA’s numbers — they’re our extrapolation from ISU’s documented weekly deficit. But the direction is consistent: producers kept cows they would normally have shipped because replacements were either too expensive or literally unavailable.
Those retained cows carry the milk volume today. When margins compress further — Class III was $14.59/cwt in January 2026, $14.94 in February, and $16.16 in March (USDA Class and Component Prices). — producers start culling harder. If a meaningful share exit simultaneously, the void can’t be filled by a pipeline set two years earlier. And the cows being retained to supply the $11 billion in new processing capacity are, by definition, the least productive animals in the herd.
| Month | Class III Price |
|---|---|
| January 2026 | $14.59/cwt |
| February 2026 | $14.94/cwt |
| March 2026 | $16.16/cwt |
The Bullvine Pipeline Index: 43.5 and 4.5 Points from Red
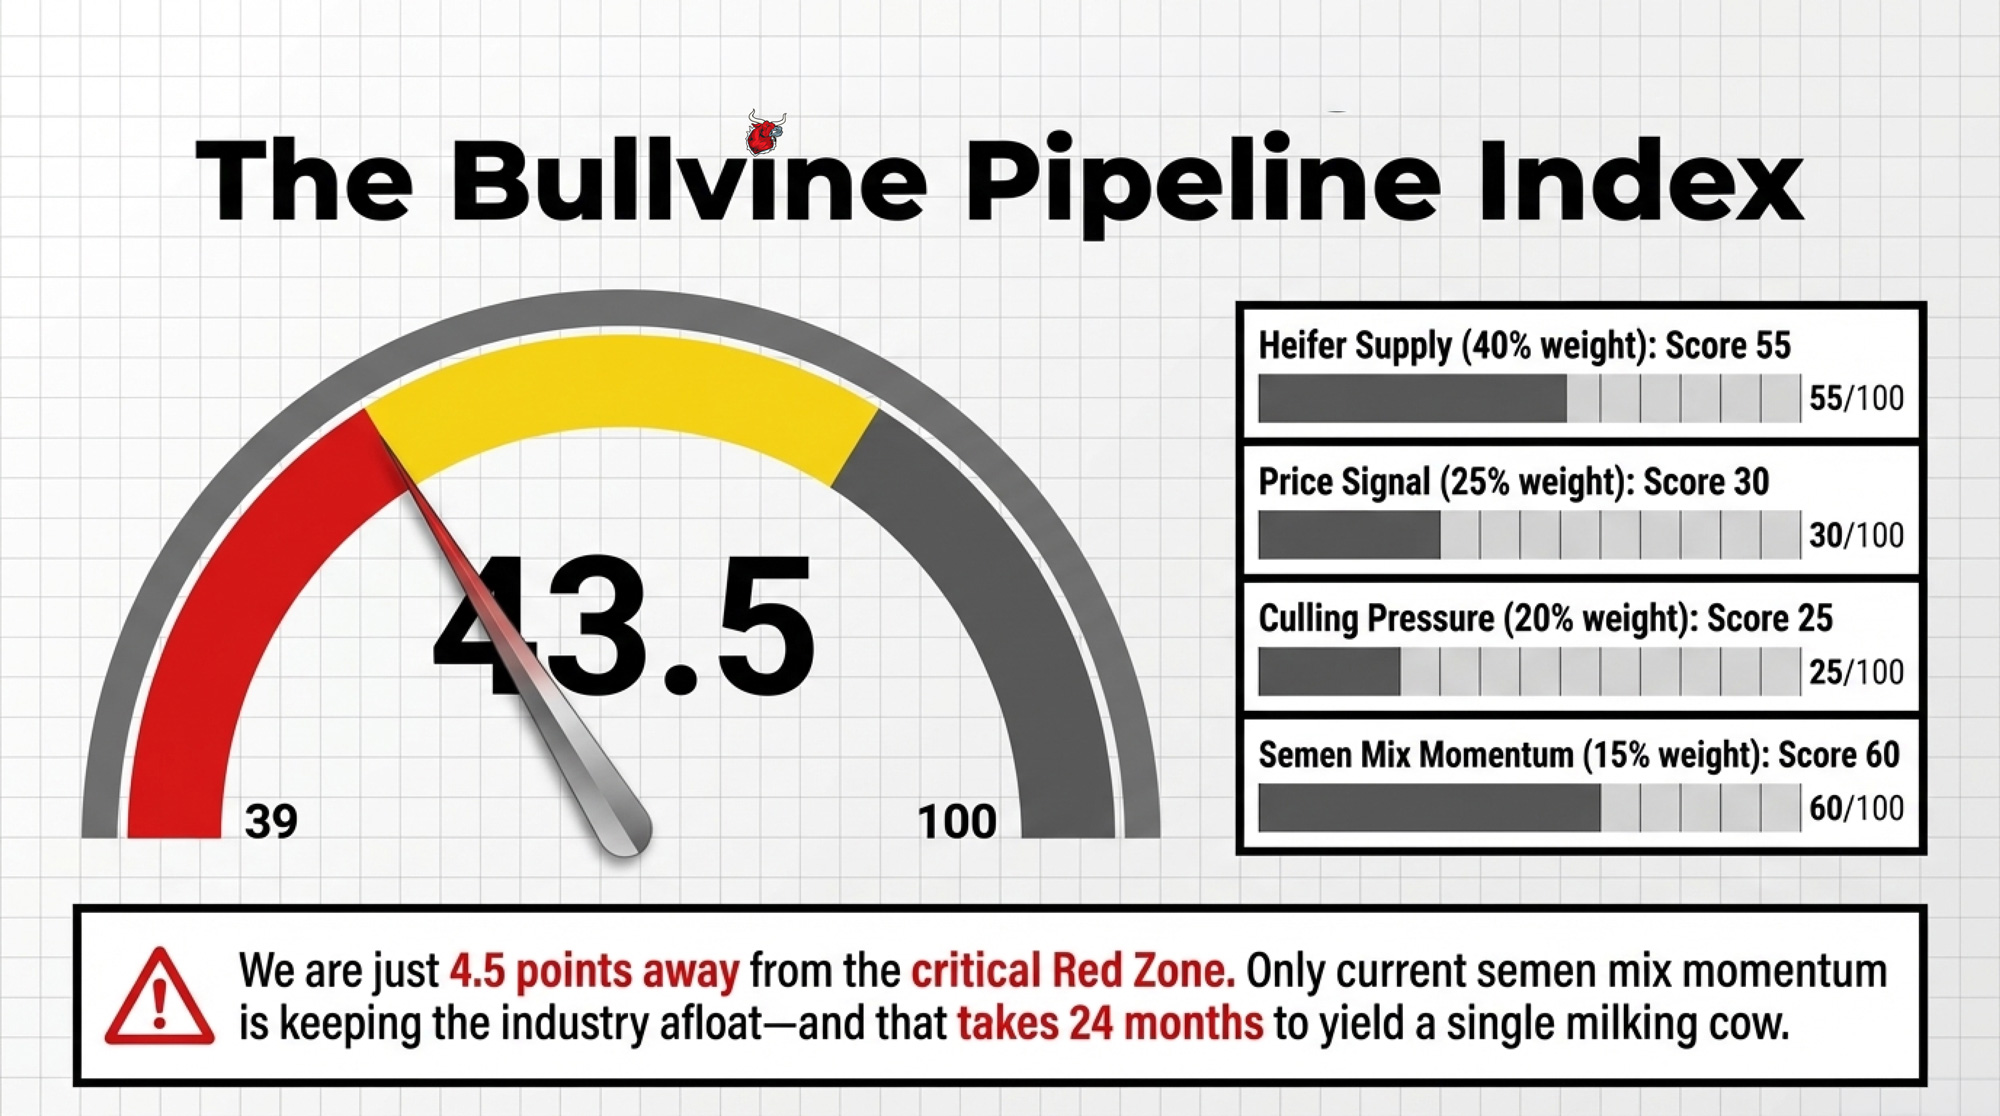
We built a single composite score to track the pipeline’s health. It runs 0 (crisis) to 100 (abundant), weighted across four components:
| Component (weight) | What it measures | Current score | Weight | Current Status |
| Heifer Supply (40 percent) | Replacement ratio — currently ~27 per 100 cows | 55 | 40% | Marginal |
| Price Signal (25 percent) | Inverse of heifer price — $3,010/head | 30 | 25% | Red Zone Range |
| Culling Pressure (20 percent) | Deviation from normal culling pace | 25 | 20% | Red Zone Range |
| Semen Mix Momentum (15 percent) | Sexed dairy share — 64 percent and rising | 60 | 15% | Adequate |
| Composite | 43.5 | 100% | Yellow Zone |
Index = (55 × 0.40) + (30 × 0.25) + (25 × 0.20) + (60 × 0.15) = 43.5.
Yellow Zone (40–69). Barely. The Red threshold is 39.
This Index is sensitive to culling. If slaughter normalizes and the Culling Pressure Score drops from 25 to 15, the Index slides to 41.5. If sexed semen adoption stalls at the same time — possible if cash‑strapped herds revert to cheaper conventional — you’re at 38. Red Zone. No catastrophe needed. Just normal economics catching up.
For that Panhandle herd, the Index confirms what the breeding sheet already showed: the semen mix momentum is the only indicator keeping the pipeline above the critical threshold. And that momentum takes roughly 24 months to yield a single milking cow. The race is whether retained cows hold long enough for the 2025 breeding surge to reach the milking string in 2027.
Where the Shortage Bites First
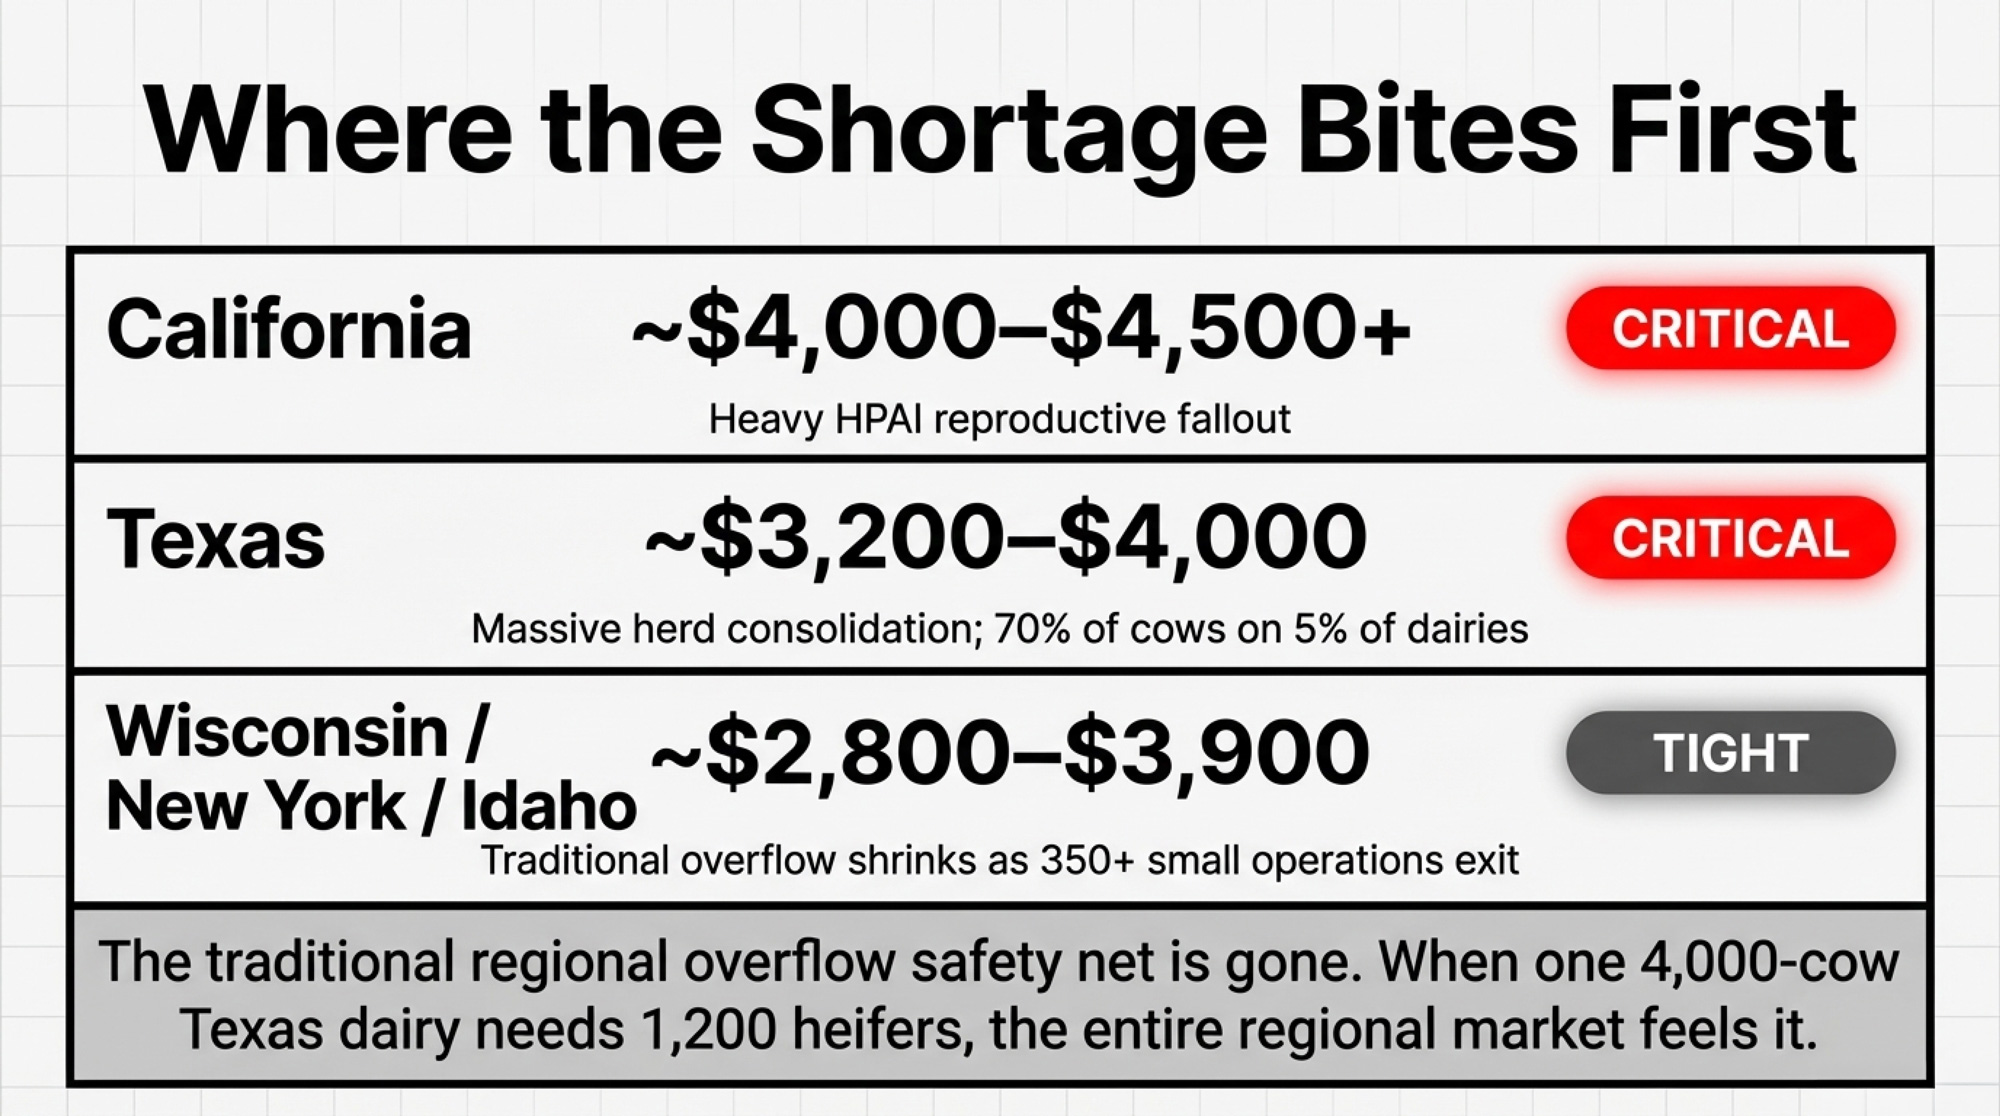
| State | Share of herd | Est. 2027 pipeline | Replacement ratio | Heifer price range | Status |
| California | ~18 percent | ~772,000 | ~25 per 100 | $4,000–$4,500+ | Critical |
| Wisconsin | ~14 percent | ~600,000 | ~28 per 100 | $2,800–$3,750 | Tight |
| Texas | ~7.5 percent | ~322,000 | ~24 per 100 | $3,200–$4,000 | Critical |
| Idaho | ~7.5 percent | ~322,000 | ~26 per 100 | $3,100–$3,900 | Tight |
| New York | ~6.5 percent | ~279,000 | ~28 per 100 | $3,000–$3,600 | Tight |
| Minnesota | ~4.7 percent | ~202,000 | ~27 per 100 | $2,800–$3,850 | Tight |
Bullvine Pipeline Tracker estimates based on USDA cow inventory, NAAB data, and regional replacement ratios.
California has a 25‑per‑100‑cow replacement ratio, heavy HPAI reproductive fallout (750‑plus dairies affected from August 2024–March 2025, with some reporting a 7 percent drop in conception rate), and premium Central Valley springers routinely selling for over $4,500. Texas added 39,000 cows in 2025 — 70 percent of the state’s cows sit on just 5 percent of its dairies in the Panhandle. When one 4,000‑cow dairy needs 1,200 heifers, the regional market feels it. The traditional overflow from Wisconsin and Minnesota shrinks as small operations exit — 230 farms lost in Wisconsin and 120 in New York in 2025 alone.
What This Means for Your Operation
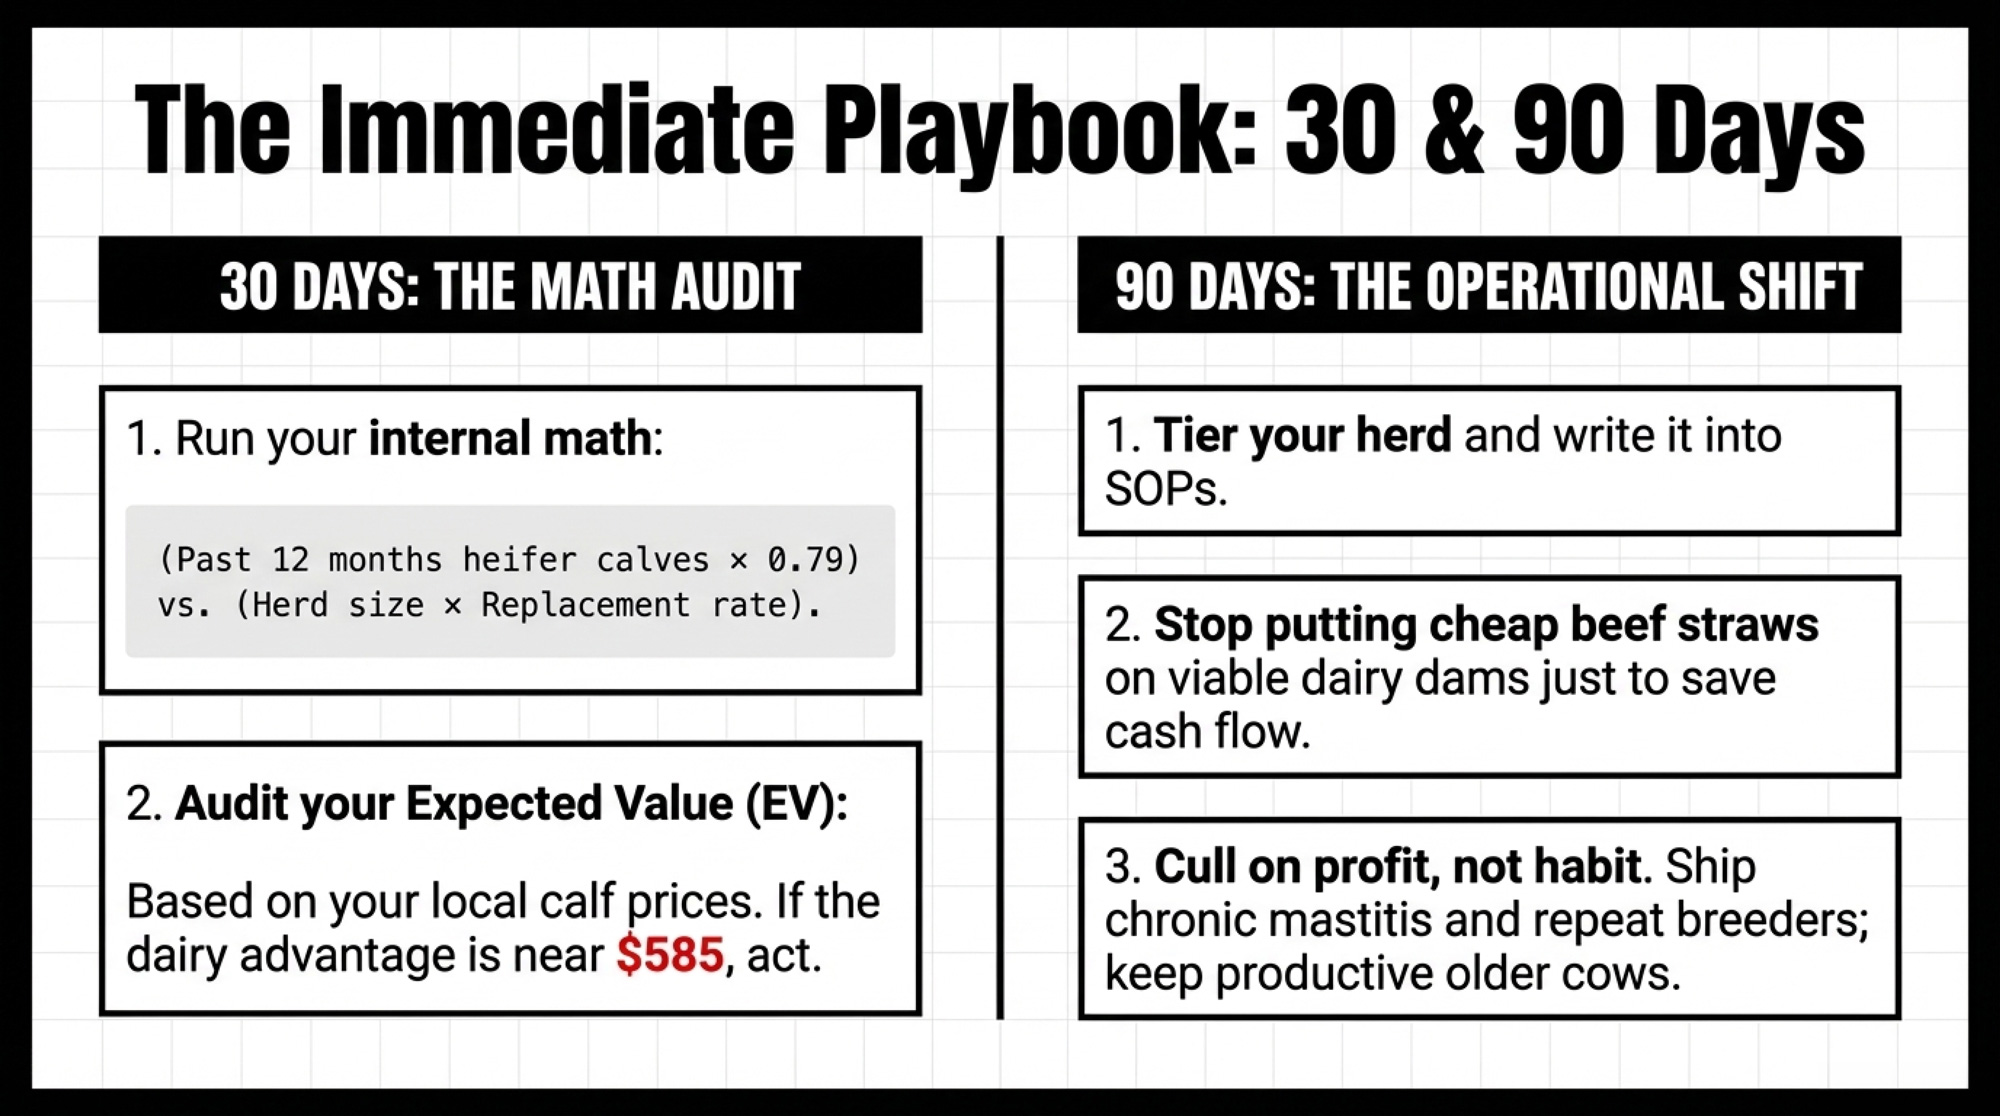
In the next 30 days:
- Run your pipeline math. Pull 12 months of heifer‑calf births. Multiply by 0.79. Compare to herd size × replacement rate. If you’re short, that gap is baked into 2027–2028 regardless of what happens to prices.
- Audit beef‑on‑dairy with your own prices.
EV_beef = your calf price × 0.57 × 0.95.
EV_dairy = your local heifer cost × 0.42 × 0.95 × 0.90 × 0.79.
If the dairy advantage looks anything like $585, decide how many beef services you keep on viable dairy dams. You gain near‑term cash. You give up future replacement inventory at today’s expected‑value spread. - Call your heifer suppliers this week. Ask how far they’re booked and whether they’ll lock in numbers 12–18 months out. If “I’ll just buy later” is your plan, find out whether the supply actually supports that.
In the next 90 days:
- Tier your herd and write it into SOPs. Top genetics go to sexed dairy. The middle tier is a mix. True terminal cows only get beef. Don’t let beef creep back onto viable dams just because the straw is cheaper that day.
- Cull on profit, not habit. Keep productive older cows if SCC and repro allow. Ship chronic mastitis, repeat breeders, and low‑index animals. A retained cow buys you time. She doesn’t buy you margin.
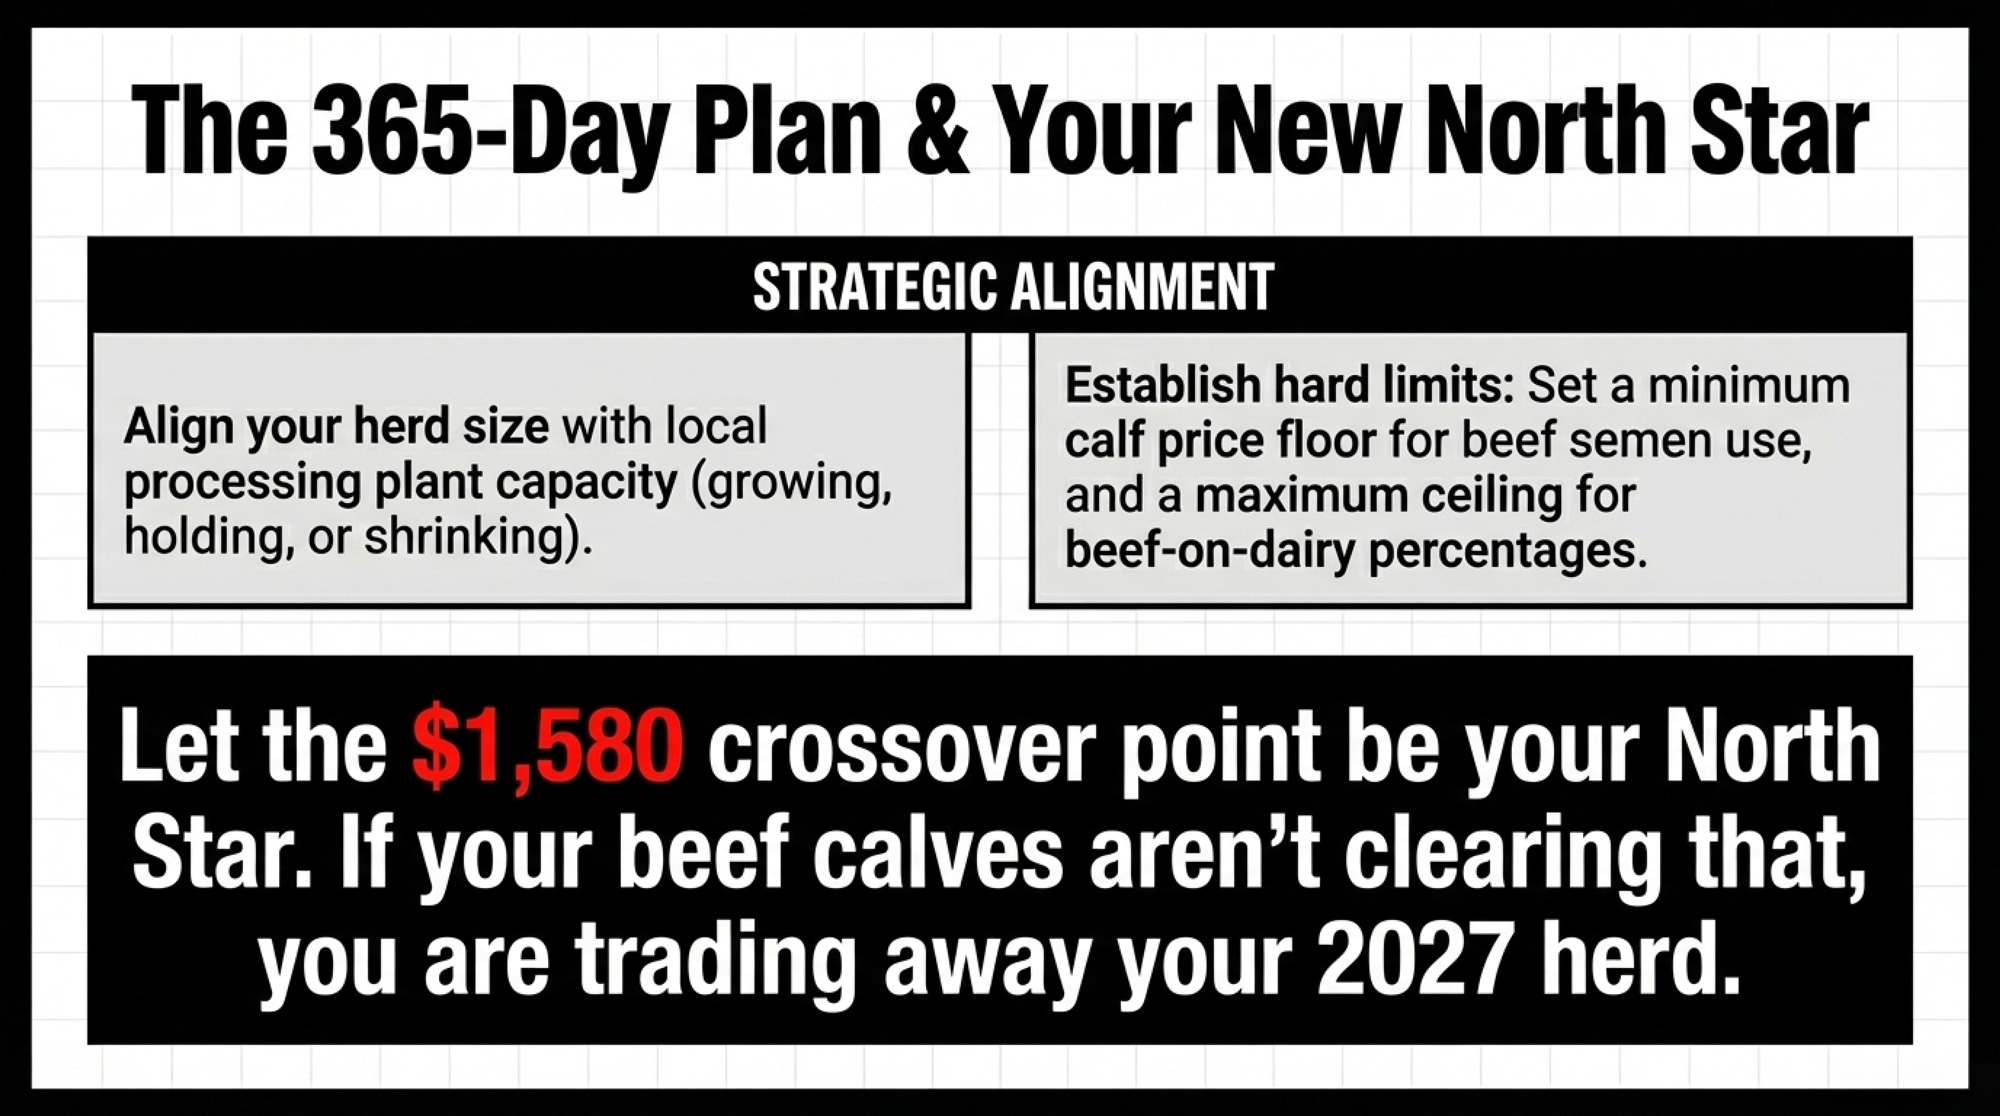
Over the next 365 days:
- Align your herd plan to your plant. If you’re near new processing steel, decide whether you’re growing, holding, or shrinking. Your pipeline, beef percentage, and culling strategy need to match that call.
- Set hard floors and ceilings. Floor: the minimum beef‑calf price where beef services still make cash‑flow sense. Ceiling: the maximum percentage of breedings you’ll put to beef on viable dairy dams. The $1,580crossover is your north star.
Key Takeaways
- If your 12‑month heifer‑calf count × 0.79 doesn’t cover herd size × replacement rate, you’re already short on future cows. That shortage is baked into 2027–2028 and can only be solved with purchased heifers, breeding changes, or culling adjustments starting now.
- Every beef service on a viable dairy dam trades away roughly $585 in expected replacement value at current prices. The crossover requires beef calves at $1,580 per head. Most markets aren’t in the same zip code. Run the expected‑value calculation with your own calf receipts before your next breeding round.
- The Pipeline Index sits at 43.5 — Yellow Zone, 4.5 points from Red. Semen mix momentum is the only component holding the score up, and it takes about 24 months to turn semen into a milking cow. One bad culling quarter pushes the national pipeline into critical territory.
Before your next lender review or processor supply meeting, print the EV table and your pipeline math side by side. Ask yourself one question: does your current breeding program produce the cows your operation will need in 2028, or are you planning to compete for someone else’s heifers at $3,500+? The breeding decisions locking in that answer are being made right now. Biology won’t wait for the market to make them comfortable.
We’ll update the Bullvine Replacement Pipeline Tracker and Pipeline Index quarterly as NAAB and USDA data refresh, with the next full reading publishing after the Q3 2026 NAAB report and fall culling data are in.
Methodology Note: Pipeline and economic data in this article comes from the NAAB 2025 Year‑End Report (March 2026), USDA Cattle Inventory (January 2025), USDA Agricultural Prices (July 2025), USDA Class and Component Prices (January–March 2026), CoBank Knowledge Exchange (August 2025), and ISU Extension NW Iowa Dairy Outlook (May and December 2025). Biological conversion rates reference Dr. Michael Overton/Zoetis field data from 85 commercial Holstein herds. The 600,000–611,600 retained‑cow estimate is Bullvine’s extrapolation from ISU’s documented weekly deficit data, not a USDA statistic. National averages may not reflect your specific region, herd size, or management system. All dollar figures are USD. We welcome producer feedback and corrections at editor@thebullvine.com
Learn More
- When Your Calves Outearn Your Cows: The 357,000-Heifer Shortage and the $200K Math Reshaping Dairy Survival – Exposes the brutal $3,315 hidden cost of rearing replacements and delivers the practical “Monday morning” math needed to stop the $200,000 equity drain hitting mid-size herds today.
- The $19 Milk Trap: How 2026 Prices Quietly Drain a 400‑Cow Dairy’s Equity – Reveals how $11 billion in new processing capacity creates a paradox for producers and arms you with a strategic playbook to protect family equity as bargaining power shifts downstream in 2026.
- Super Bowl LX and the $869-Per-Cow Sire Gap: The Breeding Strategy Your Dairy Can’t Ignore – Breaks down the December 2025 genetic base changes and delivers a concrete genomic game plan to identify your most profitable heifers, ensuring your future pipeline outearns the industry average.
 The Sunday Read Dairy Professionals Don’t Skip.
 The Sunday Read Dairy Professionals Don’t Skip.
Every week, thousands of producers, breeders, and industry insiders open Bullvine Weekly for genetics insights, market shifts, and profit strategies they won’t find anywhere else. One email. Five minutes. Smarter decisions all week.
