Jersey cattle have many attributes. As more and more of the uses for dairy cows’ milk are based on the solids portion, the Jersey gene pool and its ability to perform well in all environments and efficiently produce high solids milk becomes an alternative sought after by performance-oriented herds.
Currently, in the United States 23% of milk goes for fluid uses and 77% for solid uses. The future trend will be to 80+% solids uses.
With this opportunity available to Jersey cattle, The Bullvine is offering an overview of what steps could be taken by Jersey supporters and milk processors to increase Jerseys’ market share in the dairy industry.
Jersey Goals – Realistic and Profit-Driven
National statistics show that Jersey cattle represent almost 10% of US dairy cows and 5% of Canadian. Currently, at auction and in private sales, Jersey females are in demand as herd replacements. Milk producers see the merit of milking Jerseys. In North America, with over 9.3M dairy cows in the United States and .93 M in Canada, doubling the current proportions of Jersey genes would result in over 19% Jerseys in North America.
The next decade will be very important for Jerseys. 2030 is only three to four female generations away and a unified proactive progressive expansion plan is needed to achieve an increased Jersey market share.
Ten Steps to Jersey Success
This paper is intended to provide a big picture view and to initiate discussion. Bullvine readers will, no doubt, be able to add steps and actions that can add to a dynamic growth in Jerseys.
It is Necessary to Work Together
- Create Stable to Table Alliances
Research and innovation are the keys to Jersey’s future success. A way must to be found to bring all areas that touch Jerseys, from crops to consumer, into an over-arching alliance. Where such a structure to be in place, Jersey stakeholders would be able to source the funds for research needed to drive innovation.
At the retail end, consumers will buy quality foods. Tomorrow’s consumers are today’s millennials and their children. A Jersey milk product line would have appeal for consumers wanting variety and quality.
Some programs have been started in North America to expand the presence of Jerseys. However, a program is needed that includes as many stakeholders as possible. A program that does not wait for everyone to buy-in and participates. Visionary leadership is needed. Immediately.
No breeder or organization serving farms with Jerseys is independent onto themselves. Collectively working together can be to everyone’s benefit. - Data Central
Jersey animal data currently exists in many databases all the way from the farm to central national systems for animals and from farm to the consumer for milk products. All Jersey animal and farm data need to reach data central. Without centralization recommendations on genetics, nutrition and management are too often siloed recommendations.
Industries that are successful in the future will depend on research having one-stop access to all the data. Applying Science is the Key - Use Technologies
Genomic Testing: After a decade of genomic testing being available to Jersey owners, uptake remains low. The age of breeders using appearance, perception, instinct and only phenotypic data for analysis is in the past for dairy cattle. Nevertheless, many Jersey animal owners don’t see the benefit of genomically testing all female calves. However, one route to get started on getting answers would be for A.I. to genomically test and capture all relevant animal lifetime and herd data on the first 300 daughters for all sires for which semen is collected.
Sexed Semen: To expand the Jersey population, 90% of A.I. Jersey services need to be using sexed semen. This would assist in supplying the surplus replacement animals needed for expansion. Breeding Jersey could be more profitable than breeding a portion of a Jersey herd to beef. Other dairy breeds could be bred to high genetic Jersey sires to produce healthy, fertile crossbreds (i.e. HoJo’s).
Precision Dairying: Many companies serving dairy farms have established precision dairying initiatives. In the next few years, farms systems and equipment will become available by which farms can profit from applying new technologies and systems.
- Turn Generations
In less than ten years genomic indexes will be over 80% reliable. The fast-moving trend is for young animals to be the parents of the next generation and genomic sires should be used 90+% of the time. New traits, especially many health and wellness related traits, that positively influence profitability will have genetic indexes. Older animals will, in most cases, not be evaluated for the new traits. If Jersey owners need any examples of where rapid turnover of generations have been very successful, they need look no further than the poultry, swine and crop growing industries.
Add to an Already Solid Foundation
- Breed for Key Profit Traits
An entire article could be written on which traits are or are not important for the future. Successful selection must be driven on which economically important traits milk producers need. The future success of Jersey breeding will be achieved from putting the overall focus on driving up farm and other stakeholder revenue and lowering or keeping costs under control.
Jersey breeding could be a world leader if there were four lines:- high lifetime energy corrected milk,
- high component percentages,
- productive grazing animals, and
- animals suitable for the sub-tropics.Future Jersey breeding should be about performance and business success not about breed purity.
- Capture Heifer Data
The economics and science of heifer rearing remain in its infancy. Dairy managers need to know how the costs and benefits associated with genetics, feeding, management and performance from birth to first calving affect the bottom line and, thus, the performance in the milking herd.
It is possible that Jersey stakeholders working collectively on heifer performance could improve not only animal lifetime profit but perhaps as far as what consumers are willing to buy in the grocery store.
Adding full scope heifer data to milking cow data would put Jersey owners on a rising trajectory to becoming the gene pool of choice.
Apply Information for Success
- Jersey Improvement Clubs
People sharing information with their peers is an effective means of learning and applying facts, figures and science.
Dairy farm finance clubs and income over feed costs clubs have been popular with dairy herd owners. Today these clubs can meet face-to-face or through on-line communities. Clubs for Jersey herd managers and Jersey youth can serve from training on the basics all the way to advanced dairying. The focus and priorities can be set by the members and work best when led by trained facilitators
.
The Dairy Industry is More Than Cows and Farms
- Field to Consumer Approach
As mentioned above, successful dairying goes all the way from the soil that grows the crops to the consumer purchasing and eating the food produced. Jerseys are but one of the many parts to the total equation that comprises dairying. In the end, it all comes down to the profit and success of the stakeholders. In the past, the model followed has been based on individual and organizational goals, preferences and focus. In the future, modelling will be more expansive and inclusive. Systems with Jerseys as the animals in the model could well be with us in the next half-decade. Remember what the consumer will buy will be the benchmark for every successful model.
- Guarantee the Product. Put Customer Trust First.
Consumers of all products want a guarantee that their purchase is what it is sold as and that it can be backed up with facts. This practice will soon be mainstream. Jersey stakeholders would be well served to proactively participate in programs that ensure that the consumer knows and can rely on Jersey sourced products they buy meeting the product claims.Jerseys Fit Everywhere
- Go Global with Alliances
Dairy cattle exist on every continent and in a multitude of production environments. Jerseys have already shown that they perform well in sub-tropical environments. Could they do even better there if the Slick Gene was incorporated into a line of Jersey cattle? A universal theme could be healthy productive animals, healthy nutritious food, healthy stakeholder bank accounts.
With the next 2 Billion people on this planet predicted to be residents of Asia and Africa, Jersey cattle should not miss the opportunity to perform in those environments.
Jersey alliances must cross borders.
The United States and Canada need to initiate expanded collaboration and to lead the way to Jerseys achieving a 20% market share.
The Bullvine Bottom Line
Are performance-oriented Jersey people ready to take the leap to the future? It requires thinking and acting beyond the cow and farm. It requires forming alliances at every step of the food chain. Two immediate challenges for Jerseys to increase market share are leadership and stakeholder support.
The Jersey Cow is ready. Are Jersey people on board for what can be an exciting, successful and sustainable future? If so, then tell others.
It only takes a spark to get a fire going!

Get original “Bullvine” content sent straight to your email inbox for free.
[related-posts-thumbnails]
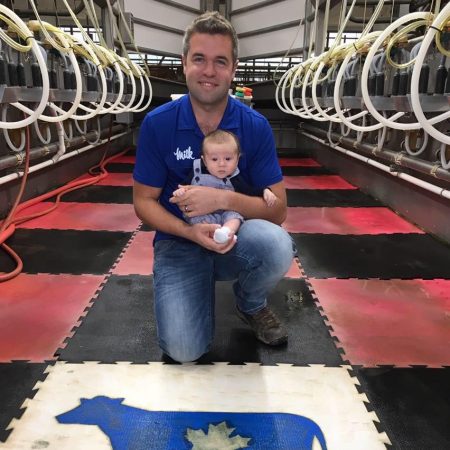 Last year I had the opportunity to contact an energetic 27-year-old dairyman who has enthusiastically selected the Jersey breed for his dairy operation. Listening to Tyler Hendriks of Seaforth Ontario as he talks about the dairy industry and Jersey breeding made me excited about the future possibilities for Jerseys.


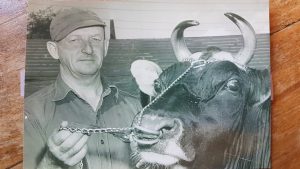
 Kevin’s parents started dairy farming in 1973 with grade Holsteins. By 1981 they had a fully purebred Holstein herd that has twice (2000 & 2014) won the coveted Canadian Holstein Master Breeders Shield. The herd had been intensively selected for both production and conformation, but also important was sound cropping on the fertile land south of the City of Montreal.
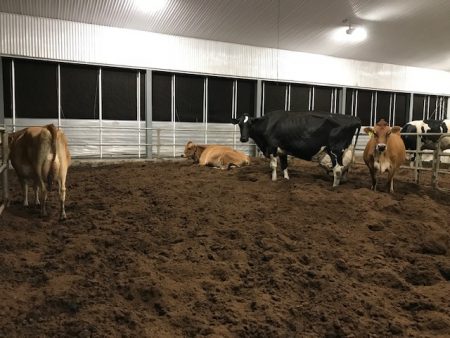
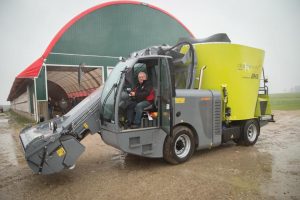
 Kevin and Amanda had a very smooth transition. Amanda and Kevin shared the following ideas to help others transition to robotic single stall milking.
 Being lauded and recognized by your peers gives one a special feeling. That is exactly what happened recently to Russell Gammon when he was awarded the 2017 Canadian Dairy Cattle Improvement Industry Distinction Award. For Bullvine readers living outside of Canada, this is Canada’s equivalent to The Industry Person of the Year which is awarded annually, in the United States, at World Dairy Expo time.
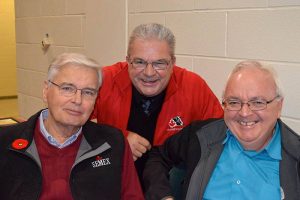
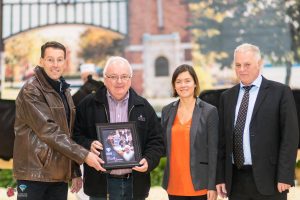
 Always Moving On


.jpg)