Is your herd’s protein‑to‑fat ratio making your processor money—or quietly costing you on every 2026 milk check?
Executive Summary: Looking at 2026, what’s really moving the needle on dairy profitability isn’t just how many hundredweights you ship—it’s how much protein and butterfat are in each one. CoBank’s recent component analysis points out that U.S. herds excelled at boosting butterfat, but processors and cheese plants now need more protein, and that’s starting to change which components lead the milk check. USDA outlooks add another layer of pressure, with softer butter prices and tighter margins, meaning component value and processor fit will matter more than ever. This feature unpacks that “component economy” in plain language, explains why your herd’s protein‑to‑fat ratio matters to plant yield and standardization costs, and shows how nutrition, fresh cow management, and genetics can be tuned to support stronger protein without sacrificing fat. It also walks through how this plays out differently in Upper Midwest cheese country, Western dry lot systems, Northeast fluid markets, and under Canadian quota, so you can see your own reality in the numbers. By the end, you’ll have a clear set of questions to ask at your own kitchen table—about your milk check, your processor contracts, and your breeding and feeding strategy—so you can decide if you’re still built for the butterfat era or ready for protein to do more of the heavy lifting.

You know, after watching milk checks and component trends for a lot of years now, I’m more convinced than ever that we’re in one of those quiet turning points you only really see clearly in hindsight. In October 2025, USDA’s National Agricultural Statistics Service reported that the 24 major dairy states shipped about 18.7 billion pounds of milk, up 3.9% from the previous October, with total U.S. production up 3.7% year‑over‑year. That’s real growth on top of an already big base. What’s interesting here is that when you look under the hood, the story isn’t just about more milk—it’s about what’s in that milk, especially in terms of butterfat performance and protein yield.
The herds that read this shift right are going to hang on to more dollars per cow in 2026. The ones that don’t may find money quietly slipping away, even if the tank looks full.
Looking at This Trend From the Plant Side

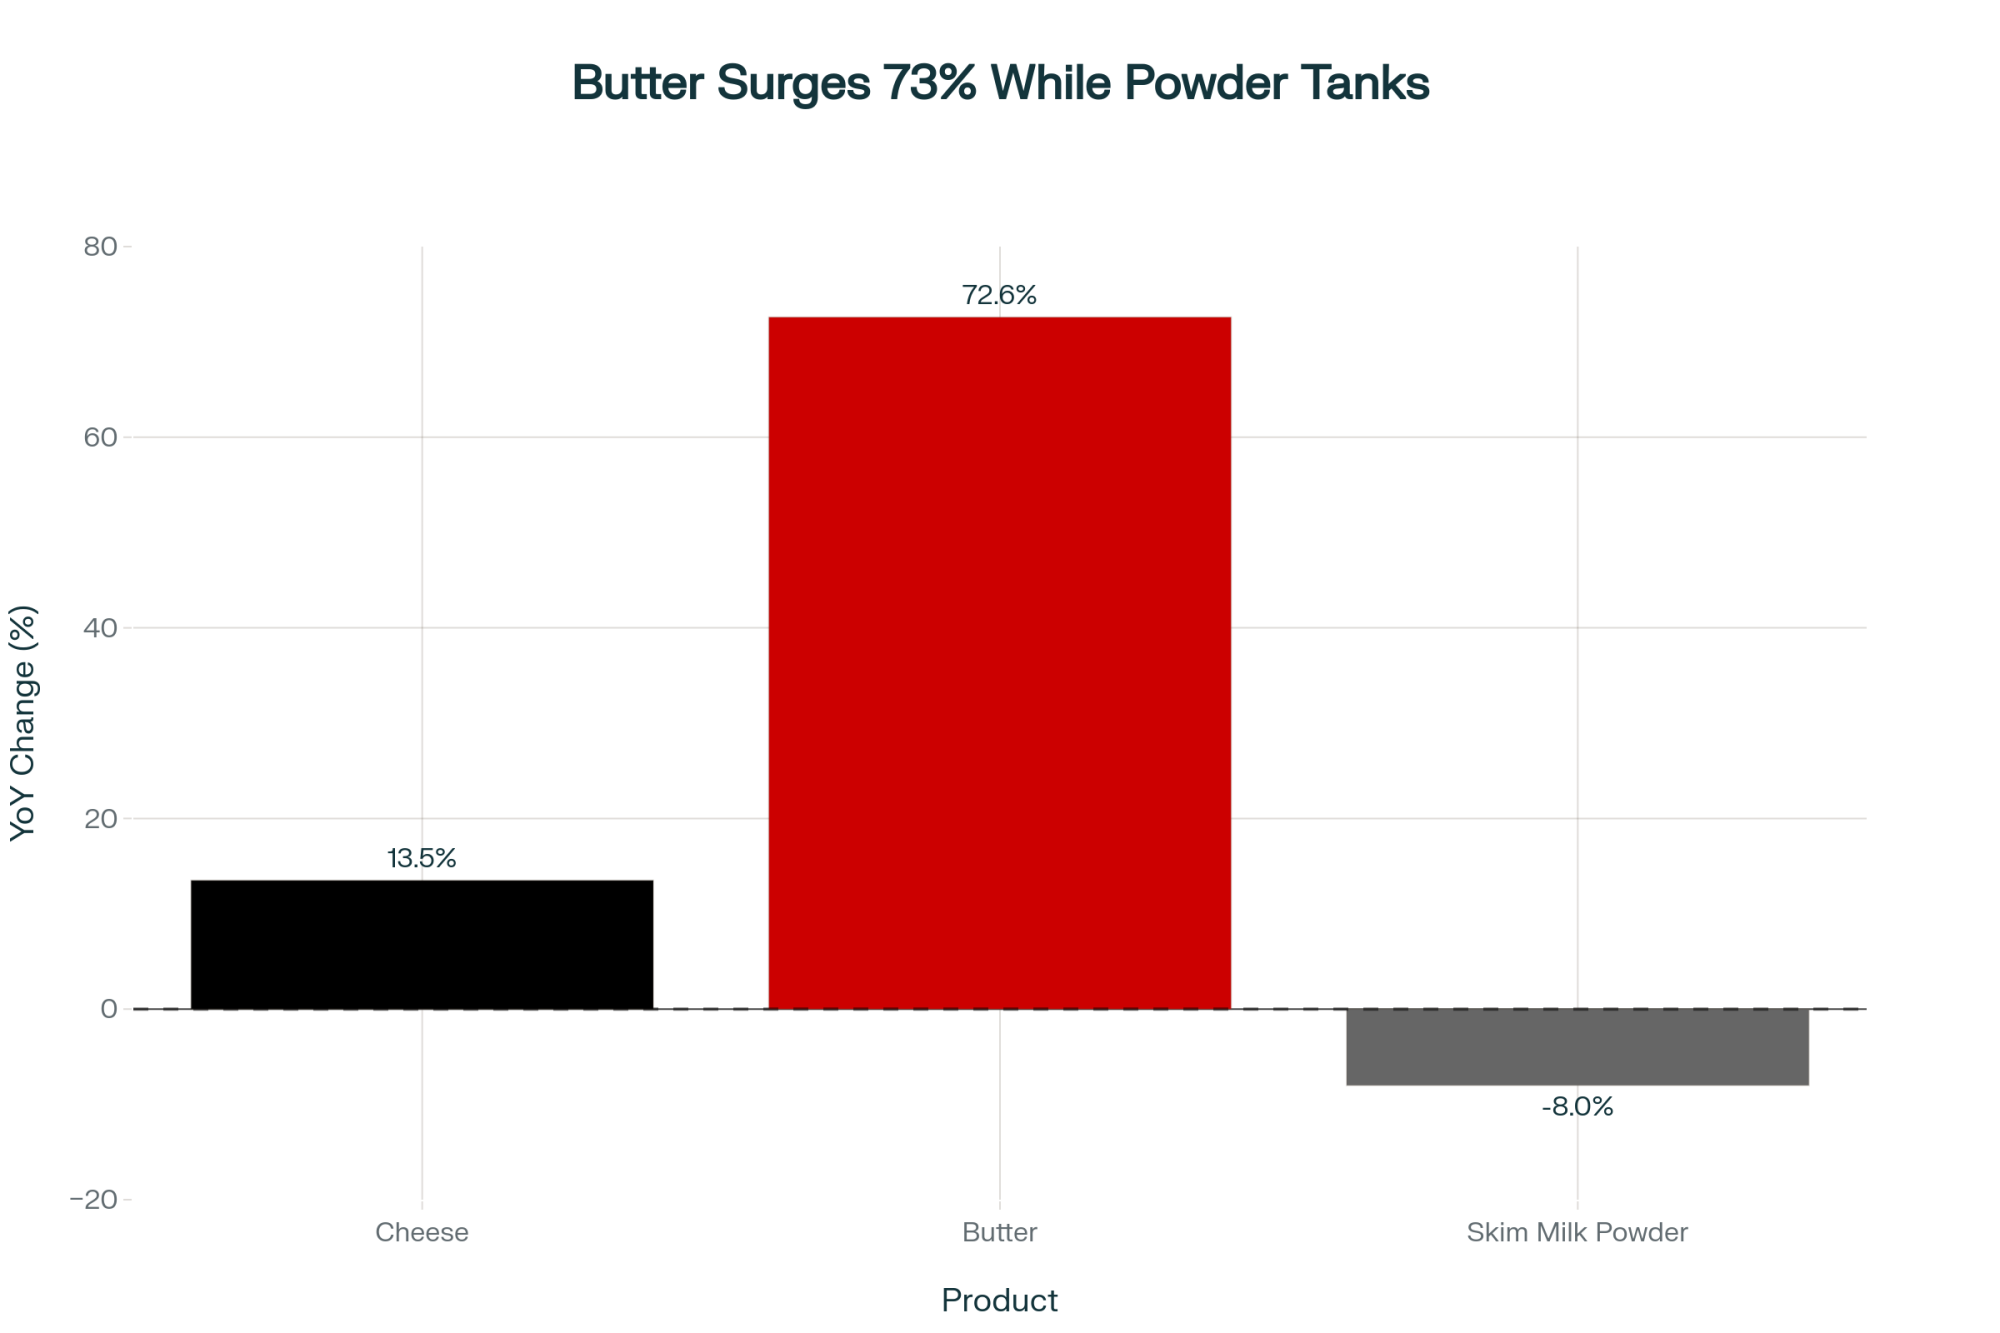
Looking at this trend from the plant side, you start to see a different layer of the story. A 2025 analysis from CoBank’s Knowledge Exchange group, led by Corey Geiger—lead dairy economist at CoBank—dug into how milk components have changed over the last decade. They found that butterfat levels in U.S. milk climbed about 13.1% over 10 years, while butterfat levels in the European Union and New Zealand rose only about 2.4–2.5%. Geiger’s team linked that jump to strong domestic demand for butter and full‑fat dairy products, plus component‑based pricing in many Federal Orders that paid generously for fat. Other market coverage has pointed out that U.S. cows are shipping more total fat and protein per hundredweight today than they did a decade ago, thanks to genetics and feeding.

| Year | Butterfat Growth (%) | Protein Growth (%) | Protein-to-Fat Ratio |
|---|---|---|---|
| 2015 | 0.0 | 0.0 | 0.82 |
| 2017 | 3.5 | 1.2 | 0.81 |
| 2019 | 7.2 | 2.1 | 0.79 |
| 2021 | 9.8 | 3.0 | 0.78 |
| 2023 | 12.1 | 3.8 | 0.77 |
| 2025 | 13.1 | 3.9 | 0.77 |
On paper, that sounds great—and to be fair, it has been. Many Midwest producers will tell you there were years when butterfat premiums essentially “saved the year” on cheese‑market milk. But as butterfat kept rising, something else began to appear in the data. CoBank’s follow‑up commentary and articles in dairy media have begun asking whether the U.S. might actually have more butterfat than some processors really need, especially cheese plants that also depend heavily on protein to make both cheese and whey efficiently.
If you look at late‑2025 market coverage, you see that tension showing up in prices. News outlets reported butter falling sharply from the record territory seen in 2022, with analysts warning that lower butter values and larger supplies were helping pull down milk prices and setting up weaker milk checks moving into 2026 as production stayed strong. USDA’s own outlook work around the same time projected continued growth in milk production and lower average butter, cheese, and all‑milk prices compared with those earlier highs.

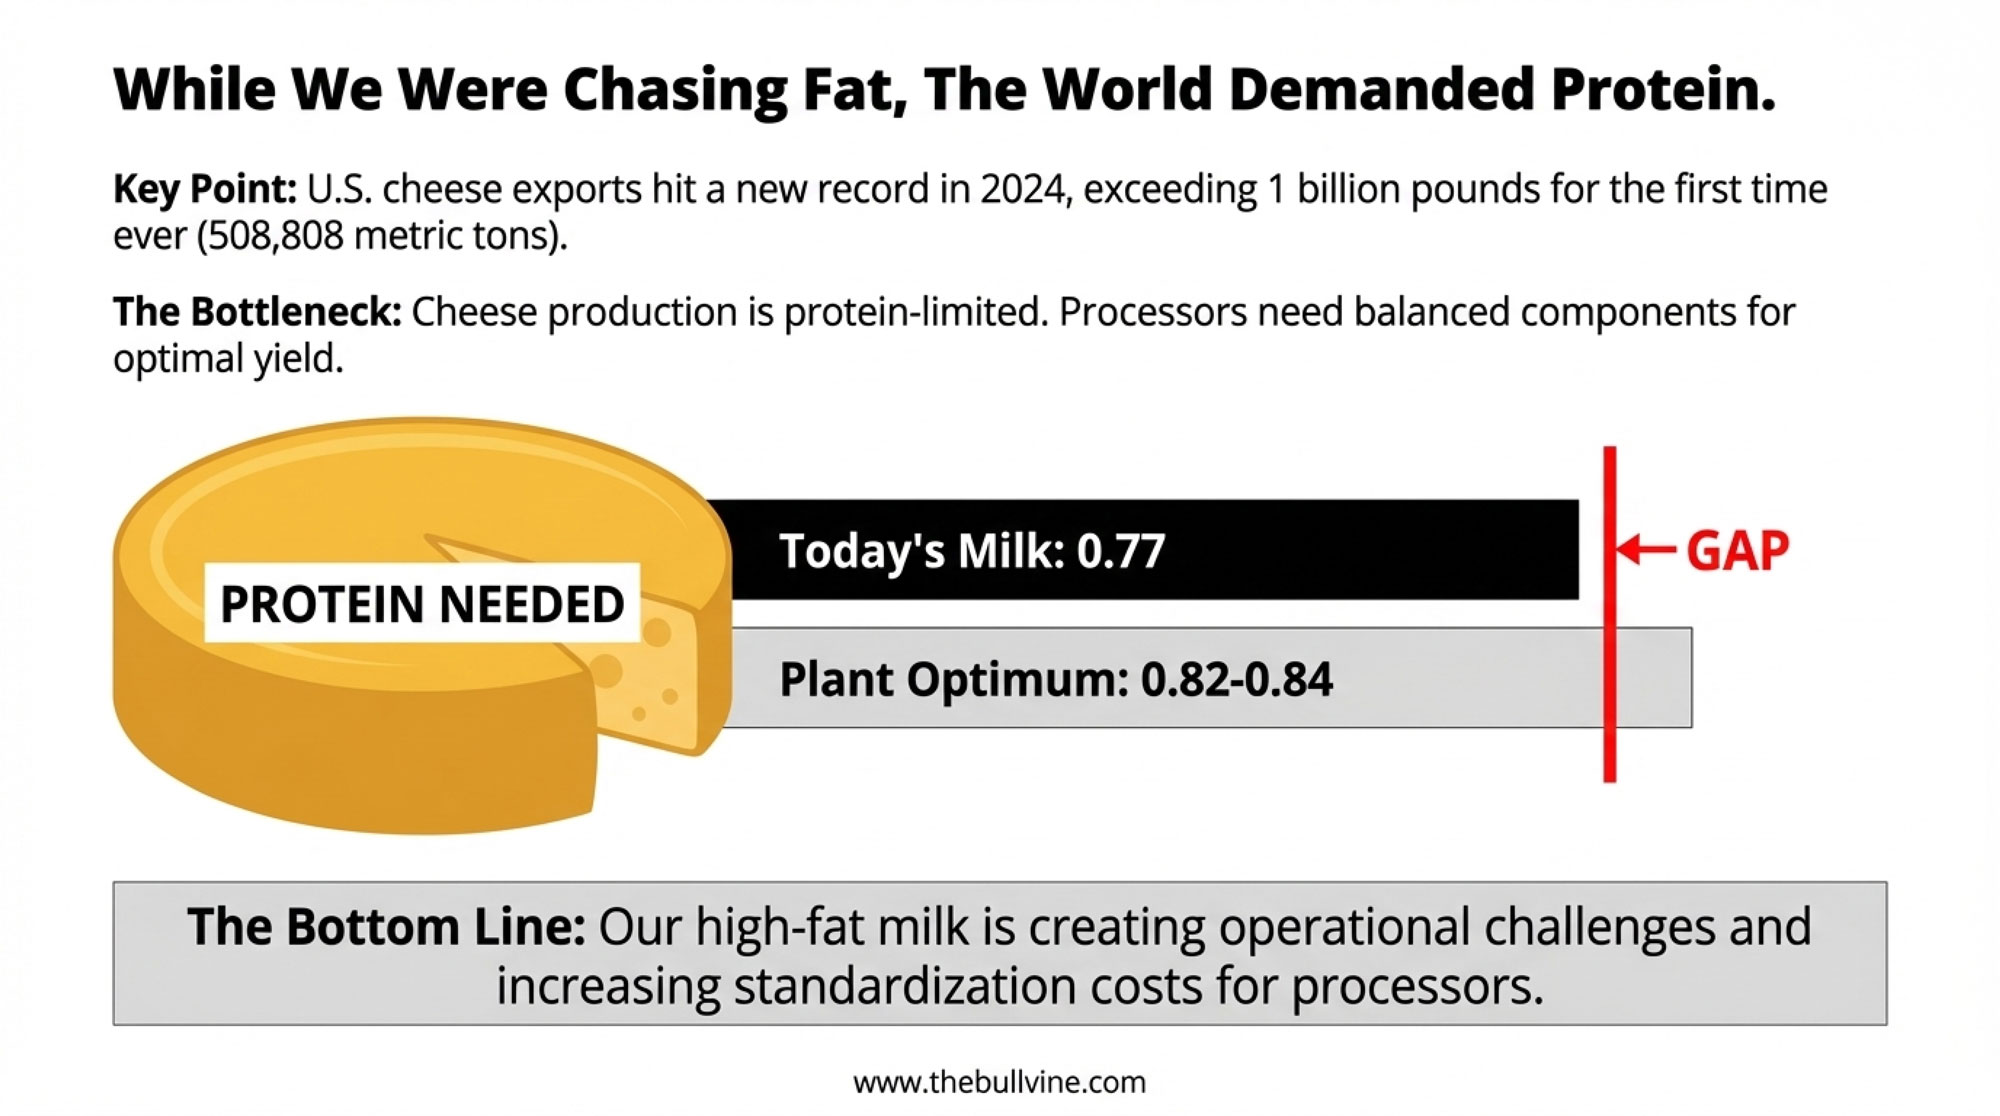
Now, here’s where components and ratios come into play. Cheesemaking research and USDA work on predicting cheese yield have shown for years that cheese and whey yields are highly sensitive to the balance of protein and fat in the vat. Plants can standardize milk, of course, but they run most efficiently when the incoming milk is already in a workable range. Industry guidance and component tables suggest that, for many common U.S. cheeses, milk somewhere just over 3% true protein and in the upper‑3s to around 4% butterfat—often yielding a protein‑to‑fat ratio near 0.80—makes life a lot easier in the plant.
It’s worth noting that this isn’t about chasing a single magic target to two decimal places. What CoBank’s report points out is the trend: for much of the 2000s and early 2010s, the U.S. protein‑to‑fat ratio hovered around 0.82–0.84, then drifted down toward roughly 0.77 as butterfat grew faster than protein. When that ratio drops, cheesemakers are forced to do more standardizing—adding protein or skimming off fat—to hit the composition they need. That extra work is routine, but it isn’t free.
In an article on “reading the signs” from milk components, Mike Hutjens—Emeritus Professor of Animal Sciences at the University of Illinois—suggests using the protein‑to‑fat ratio as a simple “dashboard light.” He notes that when herd averages sit below about 0.75, cows are often “missing milk protein,” and when they’re above about 0.90, milkfat may be depressed. That rule of thumb aligns with what cheesemakers and plant managers have been telling CoBank and others: they don’t just want high butterfat levels; they want balanced components that fit their vats and product mix.
| Herd Size (cows) | Protein-to-Fat Ratio | Herd Type | Region |
|---|---|---|---|
| 80 | 0.88 | Tie-stall | Northeast |
| 125 | 0.85 | Organic | Northeast |
| 150 | 0.76 | Freestall | Wisconsin |
| 220 | 0.82 | Organic | Midwest |
| 300 | 0.78 | Freestall | Wisconsin |
| 400 | 0.81 | Freestall | California |
| 700 | 0.74 | Drylot | California |
| 1200 | 0.79 | Freestall | Midwest |
| 2000 | 0.75 | Drylot | California |
So the big takeaway from the plant side is this: butterfat is still valuable, but now that we’ve pushed fat so hard, protein is starting to carry more weight in cheese and ingredient markets. And more plants are watching that protein‑to‑fat ratio than a lot of farms realize.
Looking at This Trend in Consumer Behavior and GLP‑1
You’ve probably heard plenty of noise about GLP‑1 medications like Ozempic and Wegovy and what they might do to food demand. Some general media stories make it sound like these drugs are going to hollow out the whole snack aisle and maybe dairy with it. When you dig into the food‑industry analysis that actually looks at what these consumers buy, the picture is more measured.

Analysts following GLP‑1 users’ eating habits report that, as use of these medications grows, many people do change how they eat: they generally cut overall calories, but they also tend to gravitate toward foods that deliver more protein and nutrition per bite. Several large food and dairy companies, in their own product briefings and category outlooks, have pointed to high‑protein Greek yogurts, strained yogurt drinks, cottage cheese, and cheese‑based snacks as growth areas for health‑conscious consumers. A theme that keeps coming up is grams of protein per serving and satiety in a smaller portion.
For plants making concentrated or high‑protein dairy products, that puts a premium on milk that brings strong protein content right through the door. Filtration and concentration technology can boost solids, but starting with milk that already has good protein levels makes the whole system more efficient. So instead of seeing GLP‑1 as “anti‑dairy,” it’s probably more accurate to say it nudges part of the market further toward higher‑protein, nutrient‑dense dairy products—a direction that was already building.
The Bigger Protein Story That’s Been Building for Years
Stepping back from GLP‑1 for a moment, the bigger story is that consumers have been chasing protein for quite a while. Surveys from the International Food Information Council over the last several years, including a 2025 spotlight on protein, have found that roughly seven in ten Americans say they’re actively trying to increase their protein intake. Trade coverage summarizes this as a kind of “protein obsession”—you’ve likely noticed how often “high protein” shows up on packaging now, from snack bars to coffee creamers.
Dairy naturally sits in the middle of that trend. Peer‑reviewed nutrition research has repeatedly described dairy proteins as high‑quality, with complete amino acid profiles and good digestibility. Phillip Tong, Professor Emeritus of Dairy Science at California Polytechnic State University and former director of the Dairy Products Technology Center, has emphasized in his work that milk proteins provide not just nutrition but also functional properties—gelling, foaming, water‑binding, emulsifying—that make them valuable to food manufacturers. Those properties are a big reason why whey protein concentrates, isolates, and milk protein ingredients have grown steadily in sports nutrition, medical nutrition, products for older adults, and a whole list of “better‑for‑you” foods.
So when you line these things up—consumer protein interest, functional advantages of milk protein, and CoBank’s finding that butterfat has outpaced protein growth and pulled the national protein‑to‑fat ratio downward—the pattern is pretty clear. We’re not just living in a “butterfat era” anymore. We’re operating in a component economy where protein is moving closer to center stage, especially in processing‑heavy, cheese‑oriented regions.
What Farmers Are Finding at the Feed Bunk
All right, enough big‑picture talk. Let’s bring this back to decisions you can make at the feed bunk and in fresh cow management.
Land‑grant university nutrition work—from Nebraska, Illinois, and others—has reinforced for years that butterfat and protein both respond to the basics: forage quality and chop length, effective fiber, starch fermentability, physically effective NDF, and overall energy balance. They also stress that the transition period and early fresh cow management are critical. Poor intakes, subclinical ketosis, and cow comfort problems in the first weeks after calving often manifest later in milk volume and components.
You probably know this from your own records: when energy gets tight, or rumen health slides, protein is often the first to sag while fat hangs on a bit longer. That’s a signal.
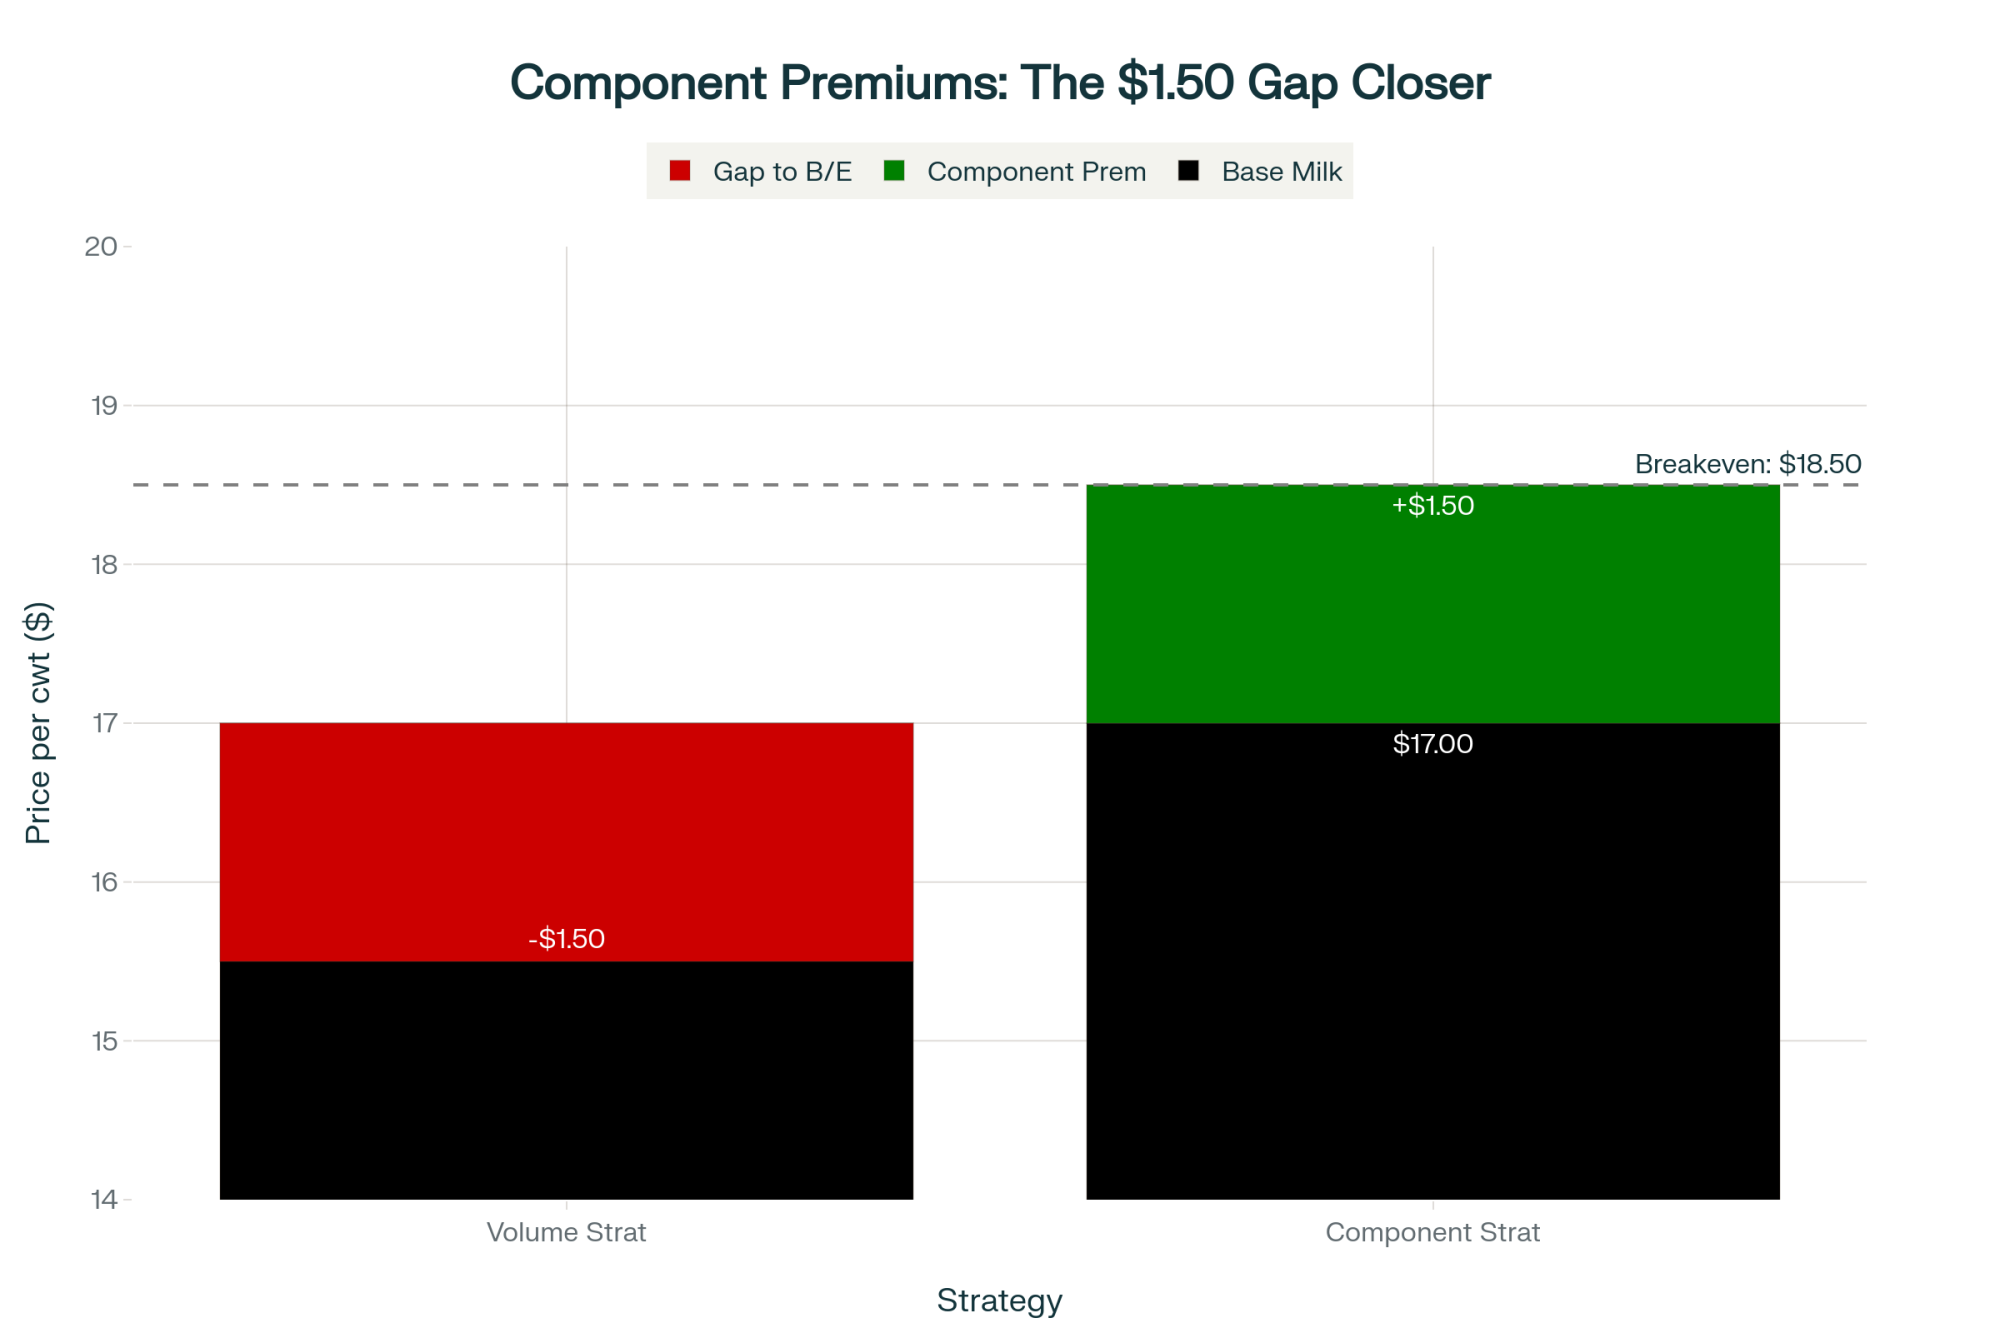
Over the last decade, a lot of herds leaned on palmitic‑rich rumen‑protected fat supplements to push butterfat performance. Research and field experience have shown that, in well‑balanced rations with healthy rumens, these products can bump milkfat percentage and, in some cases, fat yield. Combined with genetics and management, that helped drive regional butterfat averages upward. Some herds in the Upper Midwest increased their components toward 7 pounds of fat and protein per cow per day by focusing on both nutrition and genetics.
| Scenario | Component | Annual Cost/Value | Result |
|---|---|---|---|
| 2022 Butter Peak | Supplement Cost | -$54,000 | Baseline |
| 2022 Butter Peak | Butterfat Value @ $2.20/lb | +$43,362 | Net: +$10,638 |
| 2026 Outlook | Supplement Cost | -$54,000 | Baseline |
| 2026 Outlook | Butterfat Value @ $1.35/lb | +$26,608 | Net: –$27,392 |
| Protein-Focused Alternative | Nutrition + Genomics Cost | -$30,000 | Baseline |
| Protein-Focused Alternative | Protein Value @ $1.80/lb | +$31,200 | Net: +$1,200 |
But as butter prices have come off their highs and more processors are paying attention to protein, it’s worth sharpening the pencil on those investments. The exact cost per cow per day and the exact response in butterfat for any one product will depend on your ration and conditions. Rather than relying on a canned example, the best move is to sit down with your own numbers:
- What are you actually paying per cow per day for any fat supplement?
- What change in butterfat test and fat pounds shipped have you documented when using it versus not using it?
- What’s your current value per pound of butterfat on your milk check?
If, after that exercise, the extra butterfat dollars comfortably outrun the cost—and you’re not harming rumen health or protein—then that tool may still have a solid place in the ration. If the margin has narrowed or turned negative under today’s component prices, it might be time to consider shifting some of that budget into strategies that help both protein and overall efficiency, like higher‑quality forages, more precise starch and fiber balance, or amino acid balancing.
On the protein side, extension and research consistently highlight a few themes in diets that support higher true protein:
- Forages harvested at the right stage and moisture, with consistent quality across the year.
- A solid balance of rumen‑degradable and rumen‑undegradable protein, so microbes and the cow both get what they need.
- Enough fermentable starch to fuel microbial protein production without driving subacute ruminal acidosis.
- Targeted methionine and lysine supplementation when diets are limited in those key amino acids.
- Strong transition and fresh cow programs that keep intakes up and cows out of deep negative energy balance.

Hutjens’ component “dashboard” fits nicely with this. When the protein‑to‑fat ratio averages below about 0.75 across a herd, there’s usually room to improve protein yield. When the ratio climbs above about 0.90, milkfat may be compromised. That gives you a simple, herd‑level way to keep an eye on how well your feeding program, fresh cow management, and genetics are working together.
So here’s a practical check that’s worth doing: pull your last 12 months of test results and calculate the average protein‑to‑fat ratio. If most of your milk goes to cheese and that ratio is consistently down in the low‑to‑mid 0.70s, it’s probably time to sit down with your nutritionist—and maybe your plant field rep—and ask whether your feeding program and your plant’s needs are still aligned.
Genetics: The Quiet Lever Behind Tomorrow’s Components
Once you’ve taken a hard look at the feed bunk, the next quiet lever is genetics.

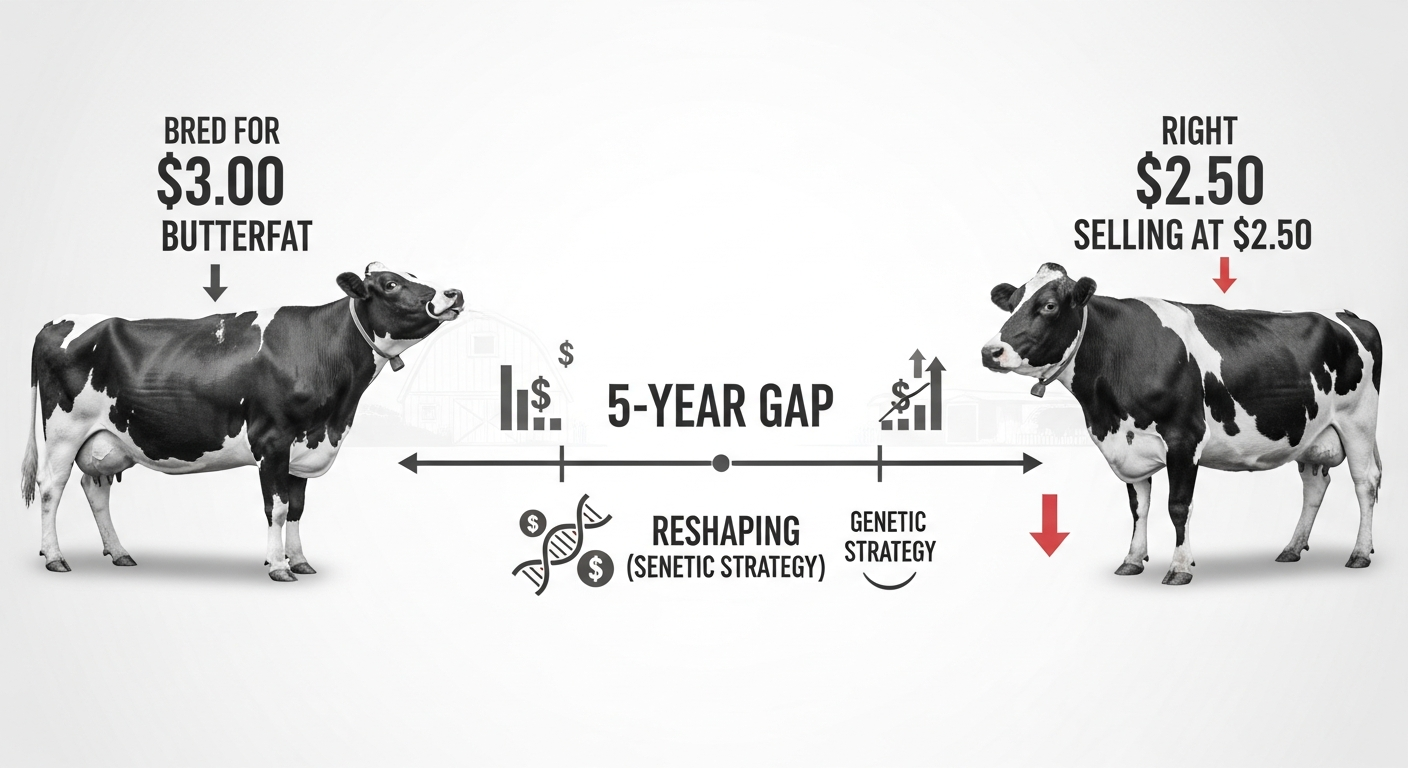
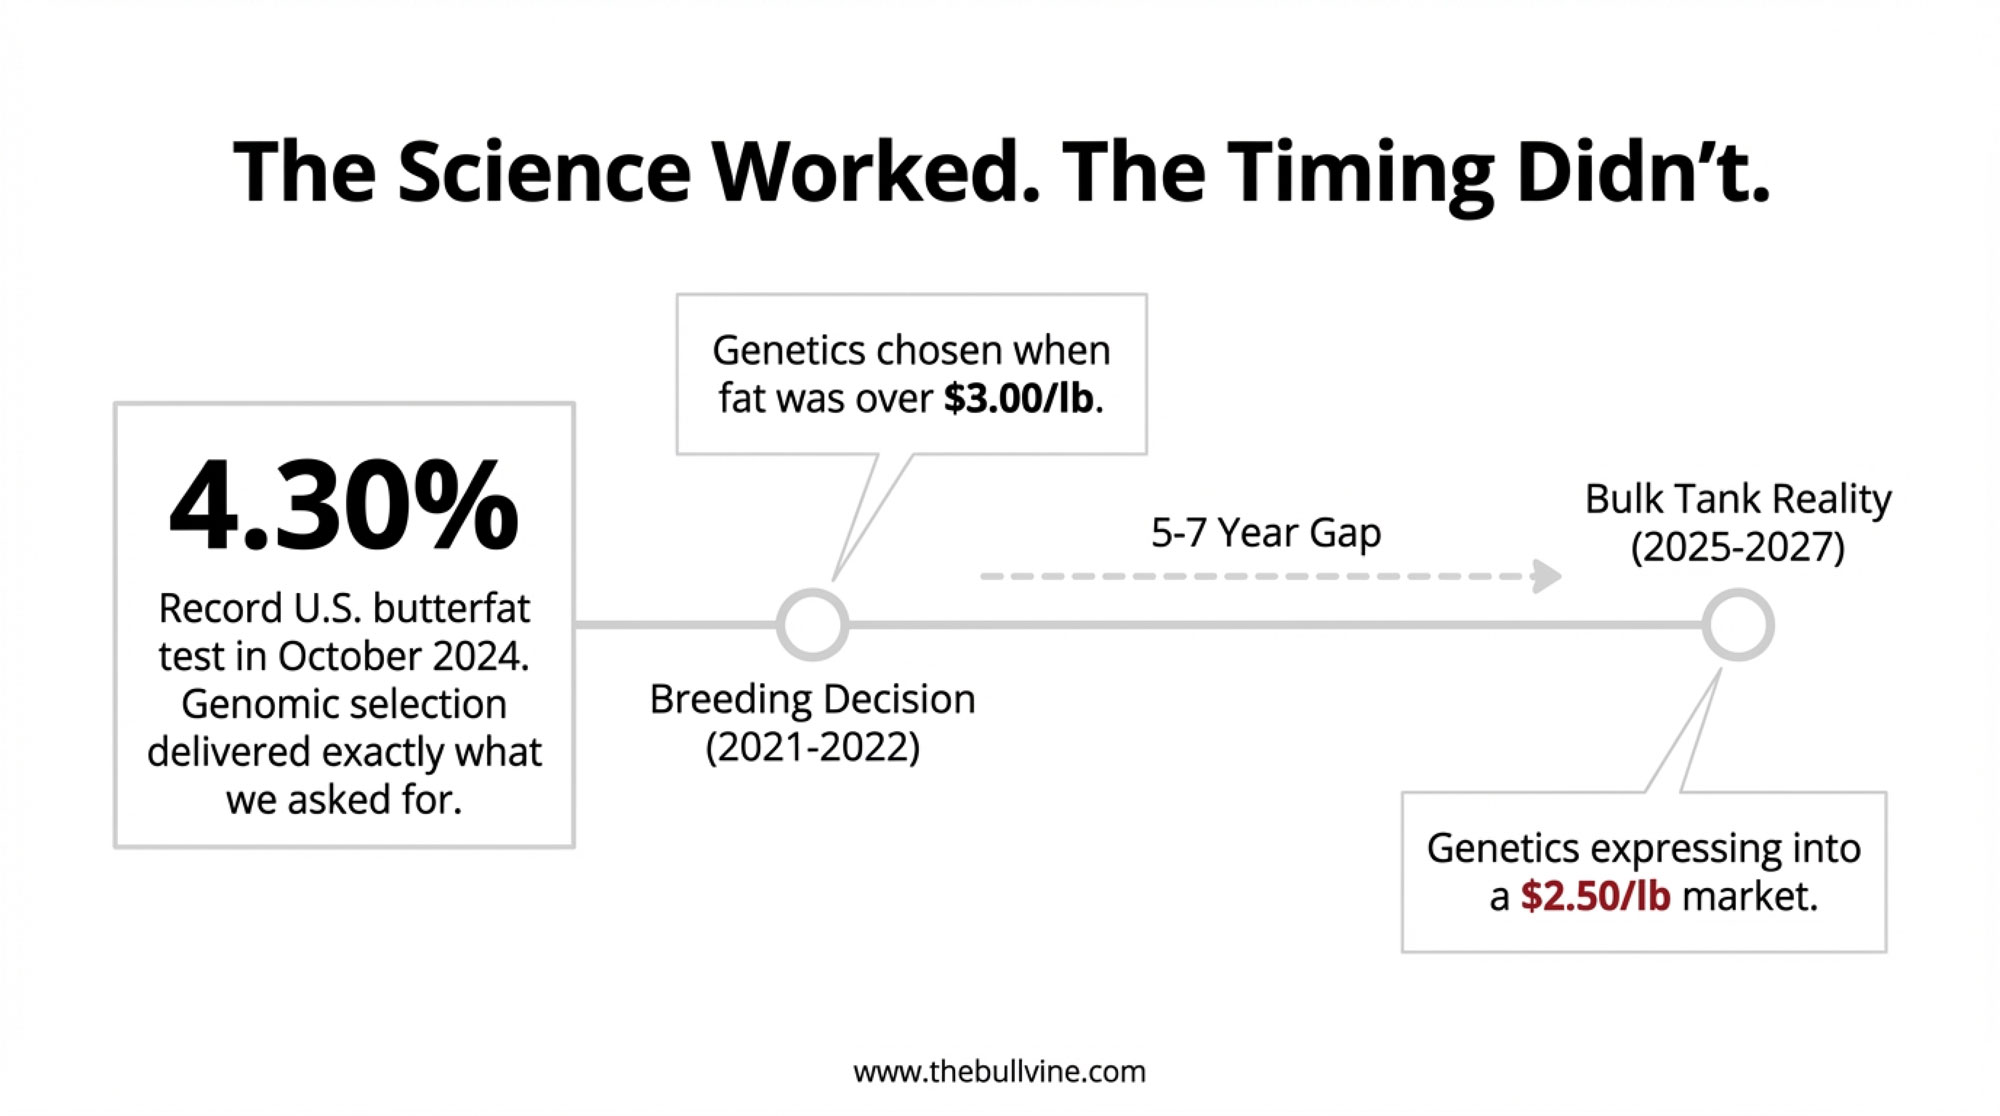
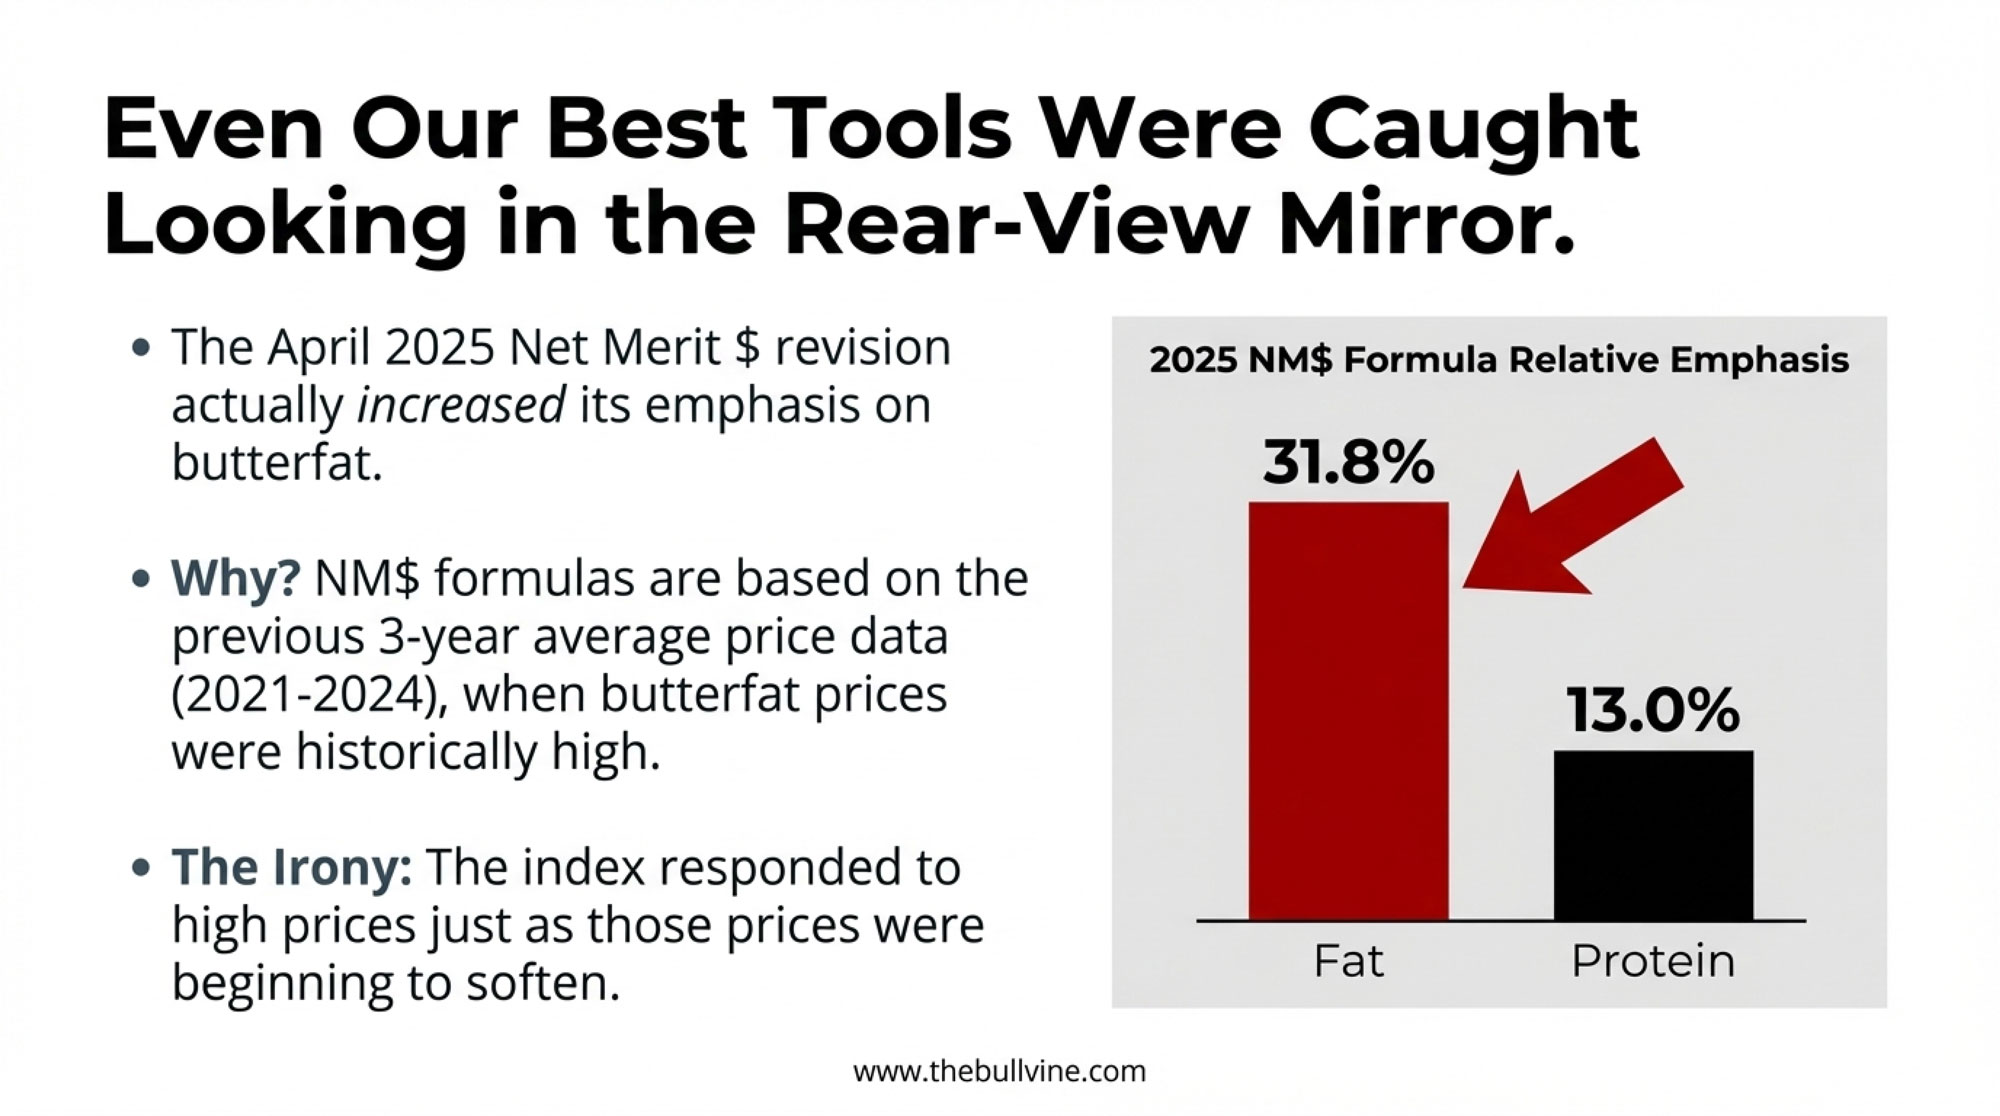
Genetic evaluations in Holsteins and Jerseys show that fat and protein yields are positively correlated—selecting for more milk and better components generally moves both traits upward, though not always at the same rate. Economic indexes like Net Merit (NM$) put explicit economic weights on fat and protein, and USDA’s 2021 revision documented changes to those values based on updated milk and component prices. For much of the last decade, strong butterfat pricing helped push index emphasis toward fat, and that made sense in the markets at the time.
As plants and markets begin to value protein more heavily—particularly in cheese, whey, and protein ingredients—that weighting becomes worth a second look. Some recent commentary and genetic updates have already noted that bulls with strong protein proofs and overall solids are climbing in rankings as the economics shift.
Genomic testing has made it much more practical for commercial herds to act on this. Many herds now test heifers genomically, at costs typically ranging from the mid‑teens to around $50 per head, depending on the panel and country, and use those results to:
- Rank replacement heifers by projected lifetime profit, including fat and protein yields.
- Identify families that consistently underperform on components.
- Tune sire selection so that the component profile—fat and protein percentages and pounds—matches where their milk actually goes.
Breed mix also plays a role. Typical Holstein herd averages often sit around 3.7% butterfat and just over 3.1% true protein, giving a protein‑to‑fat ratio in the mid‑0.80s. Jerseys commonly run up in the high‑4s for fat and around 3.8% protein, with a ratio just under 0.80. Crossbred herds land in between, depending on the breeds and selection emphasis. None of these profiles is “right” or “wrong” on its own. The key is whether your genetics give you a component profile that fits your market.
What I’ve noticed, looking at sire lists in a lot of herds, is that there’s still a tendency to default to a single index number and only later ask, “Does this bull actually fit my processor’s needs?” In a world where cheese plants and ingredient makers are increasingly vocal about wanting more protein to catch up with butterfat, it’s worth pulling out those proofs and asking a slightly different question: “Is my sire selection moving my herd toward a better protein‑to‑fat balance for where my milk is going?”
| Region | Primary Market | Ideal Butterfat | Ideal True Protein | Target P:F Ratio | Payment Emphasis |
|---|---|---|---|---|---|
| Upper Midwest (WI, MN, MI) | Cheddar, mozzarella, whey concentrate | 3.8–4.0% | 3.2–3.4% | 0.80–0.85 | Ratio-sensitive; protein gaining |
| Western States (CA, ID, NV) | Mixed (cheese, powder, fluid, ingredients) | 3.6–3.9% | 3.0–3.2% | 0.77–0.82 | Volume + flexibility; less ratio-rigid |
| Northeast & Atlantic Canada | Fluid, yogurt, regional cheese, specialty | 3.4–3.7% | 3.1–3.3% | 0.85–0.95 | Quality premium + components vary |
| Canadian Quota Markets | Butter, cheese, powder (supply-managed) | 3.9–4.1% | 3.1–3.3% | 0.78–0.82 | Factors adjusted annually; quota limits output |
| Organic Processors | Premium fluid, specialty cheese, yogurt | 3.5–3.8% | 3.0–3.2% | 0.80–0.88 | Organic premium overshadows fine diffs |
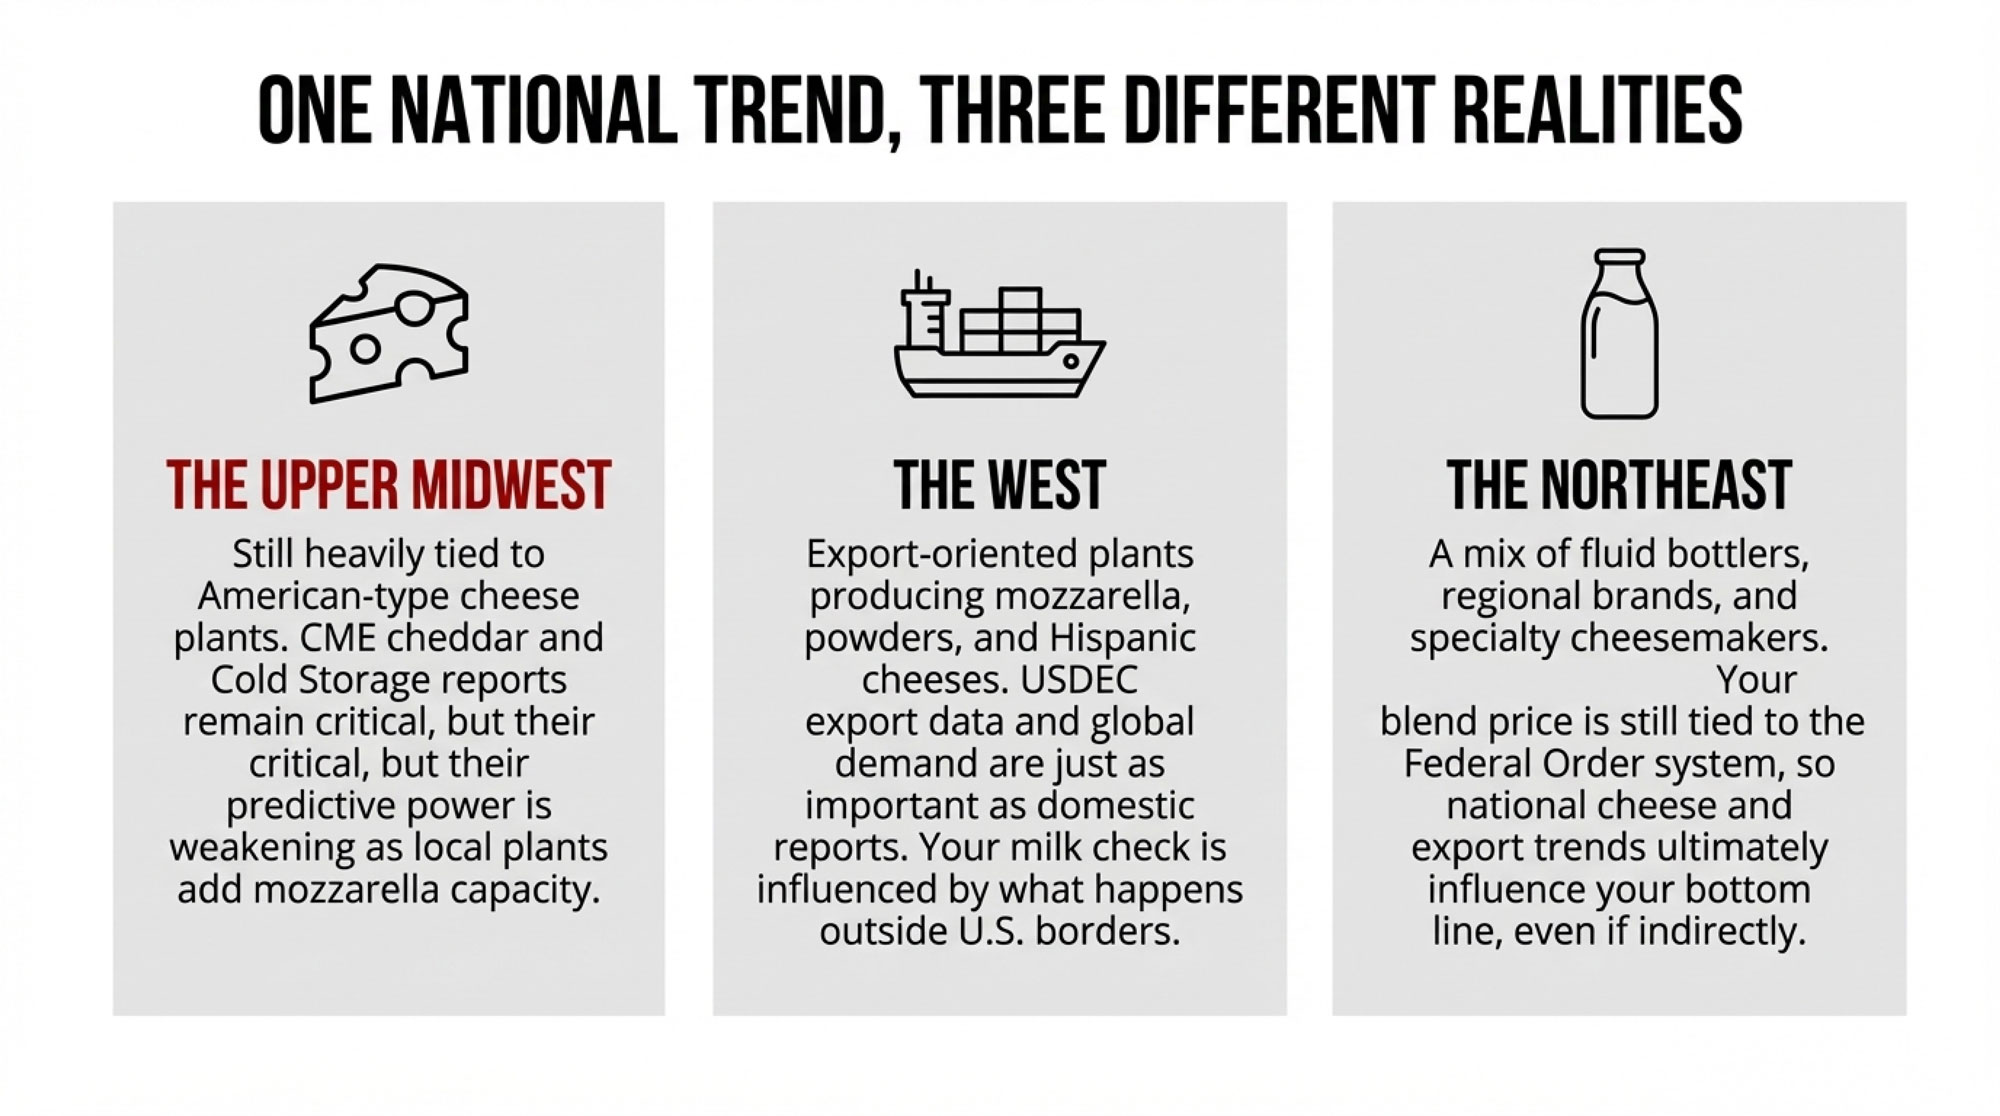
Regional Realities: One Trend, Many Local Versions
As many of us have seen, these trends don’t play out exactly the same way everywhere, and it’s important to respect that.

In Wisconsin and other Upper Midwest cheese states, the fit between components and plant needs is front and center. A large share of the milk in these regions is used to make Cheddar, mozzarella, and other cheeses, thanks to modern whey recovery systems. CoBank and regional market coverage have emphasized that cheesemakers there are especially sensitive to the protein‑to‑fat ratio and total solids because both cheese and whey yields depend heavily on those numbers. Education pieces walking through new pricing rules have shown examples where herds with modestly lower fat but stronger protein outperform very high‑fat, low‑protein herds at the same cheese plant, purely on yield and component value. That’s the kind of quiet math that makes protein more than just a “nice to have” in those markets.
In Western states like California, the picture gets more layered. Many herds are large, often in dry lot systems, and ship into a mix of cheese, powders, fluid milk, and value‑added products. At the same time, they’re operating under high feed costs, water limitations, and some of the toughest environmental regulations in the business. Market analysis and sustainability work from that region make it clear that components still matter, but they’re just one lever among many—alongside stocking density, water use, regulatory risk, and plant capacity.
In the Northeast and across Atlantic Canada, much of the milk ends up in fluid markets, regional brands, yogurt plants, and specialty cheeses. Some cooperatives and proprietary processors in these areas have moved more aggressively toward component‑based payments, including protein, while others still lean heavily on volume and quality premiums. In Canada, national supply management and quota limit total output, but planning documents from the Canadian Dairy Commission emphasize the need to manage components to meet butter and cheese requirements; component allowances and factors are adjusted accordingly.
Organic herds see yet another twist. Many have a base premium for organic milk that can overshadow fine‑grained component differentials, but processors and organic brand programs still pay attention to components because they affect product yield and cost. Some organic buyers include composition and quality benchmarks as part of their sourcing criteria, even if the pay formula is simpler.
So while the big pattern says protein is gaining importance, the way it shows up in your milk can be quite different in Wisconsin, California, New York, or Ontario. That’s why those local conversations with your nutritionist, field rep, and lender matter just as much as the national reports.
What the Outlook for 2026 Is Really Saying
When you bring together USDA’s outlooks, CoBank’s component analysis shared that the picture for 2026 is pretty consistent: it’s likely to be another tight‑margin year for many dairies. USDA projections anticipate continued growth in milk production, driven mainly by higher milk per cow, while average prices for butter, cheese, and the all‑milk price are expected to stay below the highs we saw a few years ago. Analysts have already noted that rising supply and strong component levels are weighing on prices, and that “weaker milk checks” are a real possibility if production doesn’t moderate.

At the same time, more and more people in the industry are using that “component economy” language to describe where we are. Fat and protein are being priced, managed, and in some cases hedged more independently. New or revised pay formulas are paying closer attention to how each component contributes to product yield and plant margins.
For your farm, the message is pretty straightforward: when base prices soften, the share of your milk check that comes from components, quality, and program premiums becomes more important. If protein is gradually gaining ground in your pay structure and your herd’s protein‑to‑fat ratio is drifting in the wrong direction, you can end up working just as hard for a less competitive milk check.
| Year | Base Milk | Butterfat Premium | Protein Premium | Quality/Other | Total |
|---|---|---|---|---|---|
| 2022 | 18.50 | 3.42 | 1.86 | 0.92 | 24.70 |
| 2024 | 18.20 | 2.64 | 2.07 | 0.89 | 23.80 |
| 2026E | 17.90 | 2.10 | 2.42 | 0.88 | 23.30 |
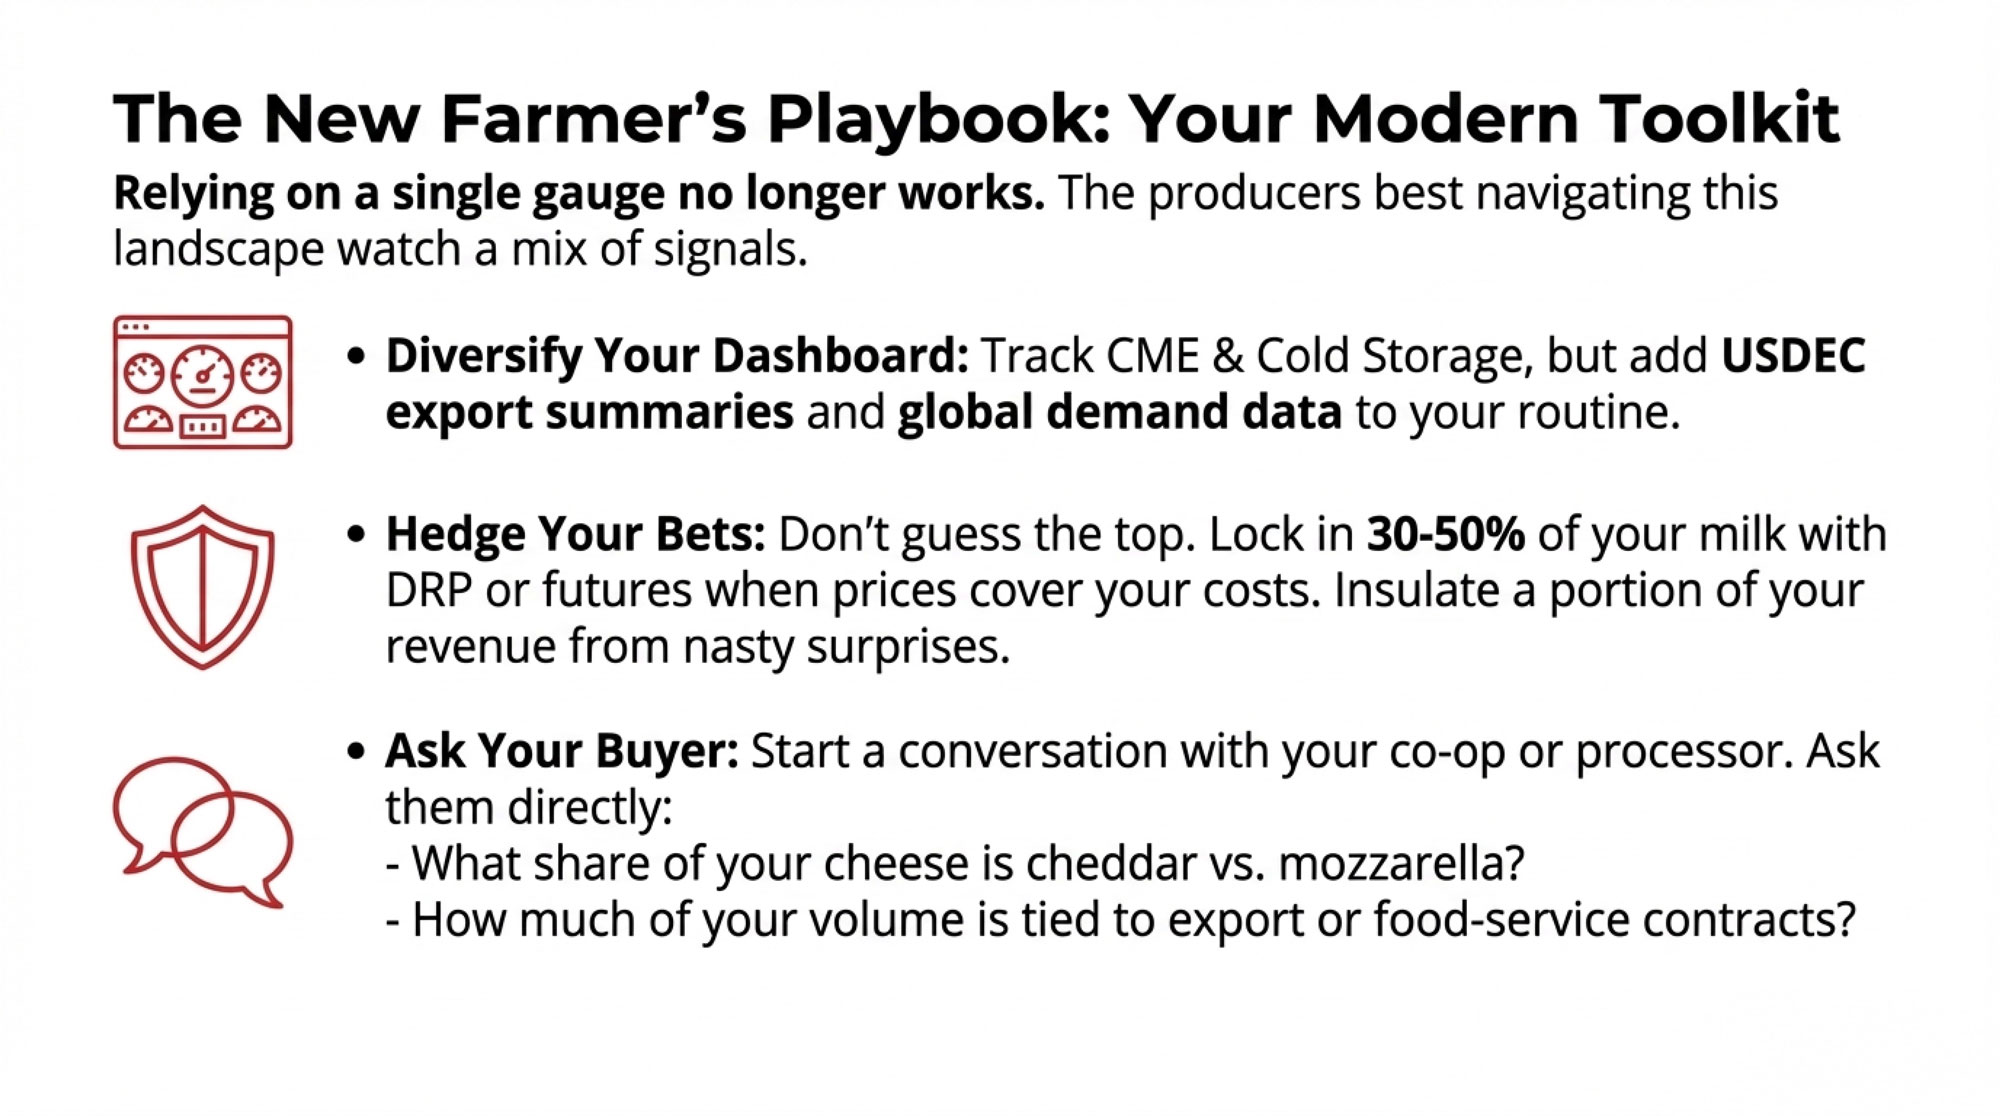
Practical Questions to Ask at Your Own Kitchen Table
So, with all that in mind, if we were sitting together at your kitchen table with a stack of milk checks and test reports between us, here are the questions I’d want to walk through:
- Over the past 12 months, what’s your average protein‑to‑fat ratio—not just on one test, but across the year? Are you closer to 0.72, 0.78, or 0.85? How does that compare to the 0.75–0.90 “healthy range” Hutjens and others talk about?
- Looking at your milk checks, how many dollars per hundredweight in the last year came from butterfat, and how many from protein? Has that mix shifted as butter prices eased and protein held or strengthened?
- When was the last time you asked your processor or cooperative, “If you could design the ideal butterfat and protein tests for your plant today, what would they be—and how would you pay for that?” Some plants and contracts are quietly adjusting to encourage the component balance they need.
- Are you still spending money on fat supplements mostly to chase higher butterfat levels, and have you re‑run that ROI using your current butterfat value, actual response in your herd, and today’s feed costs?
- Are you using genomic testing—or at least looking closely at sire proofs—to nudge your herd toward a component profile that matches where your milk actually ends up: cheese, yogurt, fluid, or export ingredients? Are protein traits getting the weight they deserve on your bull list?
- When you look at your top sires, how many are genuinely strong on protein, not just fat and total yield?
The answers will look different for a 120‑cow tie‑stall herd in the Northeast, a 400‑cow freestall in Wisconsin, a 2,500‑cow dry lot in California, or a quota‑managed herd in Ontario. And that’s okay. The goal isn’t to chase every trend or copy the neighbor. It’s to be intentional about which trends actually matter to your milk check and which don’t.
A Balanced Way to Look at the Future
When you line up the current numbers—from USDA’s production and price outlooks, from CoBank’s component growth analysis, from IFIC’s consumer protein surveys, and from cheesemaking research and extension work—the pattern is pretty clear: protein is becoming a bigger part of how milk is valued, especially in cheese and ingredient markets. That doesn’t mean butterfat suddenly stops mattering. Butter, cream, and full‑fat dairy products still resonate with consumers, and strong butterfat performance will remain a point of pride on many farms.
What’s encouraging is that a lot of the practices that help protein also help build durable, resilient dairies in general: good forages, thoughtful starch and fiber balance, strong fresh cow and transition management, attention to cow comfort, and smart use of genetics and genomics. You’re not being asked to tear your operation down to the studs. You’re being invited to fine‑tune a few dials based on where the money seems to be heading instead of where it used to be.
For some herds, that might mean easing off an “all‑in on fat” mindset and giving protein a bit more focus in both rations and sire selection. For others, especially those already shipping to plants that pay well for protein and running healthy protein‑to‑fat ratios, it might simply confirm that the path you’re on lines up well with your market.
Either way, as you look ahead to the next few seasons, it’s probably worth pouring another coffee, spreading out those milk checks and test reports, and asking yourself a simple question: Is your herd set up for the protein pivot that’s shaping 2026 milk checks—or mainly for the butterfat boom we were cashing in a few years ago?
Key Takeaways:
- Butterfat won the decade—protein didn’t keep pace: U.S. fat jumped ~13% in ten years while protein lagged, pulling the national ratio from ~0.82 to ~0.77. Cheese plants are pushing back.
- Your plant needs balance, not just fat: Cheese and whey yields hinge on a ~0.80 protein-to-fat ratio. Fat-heavy milk means extra standardization—and that cost comes back to you.
- Protein is about to do more heavy lifting on your milk check: Butter prices are off their highs, USDA sees tighter 2026 margins, and component formulas are shifting toward protein.
- Know your number and act on it: Pull your 12-month protein-to-fat ratio. Below 0.75? Protein opportunity. Above 0.90? Possible fat depression. Tune rations, transition protocols, and your bull lineup.
- One trend, many local versions: Upper Midwest cheese plants are ratio-obsessed; Western herds weigh components against water and regulations; Canadian quota adjusts factors to hit national targets.
Complete references and supporting documentation are available upon request by contacting the editorial team at editor@thebullvine.com.
Learn More
- How Your Ketosis Cut‑Point Is Leaking $25,000 a Year – And the Fresh Cow Playbook to Stop It – Stop leaking cash at the fresh cow pen by sharpening your testing protocols. This playbook reveals why blanket treatments are failing and arms you with a precision-driven strategy to save your herd up to $35,000 annually.
- You Only Get 15.9¢ of the Food Dollar: A Dairy Farmer’s Playbook for Hauling, Co‑ops, and Premium Milk – Regain leverage at the plant gate by understanding where your dairy dollar is actually going. This guide breaks down hauling efficiencies and reveals exactly when premium programs provide the margin boost your operation needs.
- Same Tag, Different Feed: The Molasses Problem – Protect your heifer investment from hidden nutritional swings that derail growth. This research breakdown exposes massive variability in common feed ingredients and delivers the critical questions you need to ask your supplier to ensure performance.
 Join the Revolution!
 Join the Revolution!
Join over 30,000 successful dairy professionals who rely on Bullvine Weekly for their competitive edge. Delivered directly to your inbox each week, our exclusive industry insights help you make smarter decisions while saving precious hours every week. Never miss critical updates on milk production trends, breakthrough technologies, and profit-boosting strategies that top producers are already implementing. Subscribe now to transform your dairy operation’s efficiency and profitability—your future success is just one click away.