


On a 750‑cow dairy, a 12% power hike quietly costs 3¢/cwt. One VSD‑level upgrade can swing your margin 9¢/cwt. What’s your electricity cost per cwt?
Executive Summary: Mark’s 750-cow freestall just took a 12% power rate hit. That’s 3¢/cwt gone — $7,650/year. The trap is waiting on efficiency. One VSD vacuum pump upgrade flips his margin by 9¢/cwt (2-6-year payback). Ontario wholesale prices surged 90%+ in 2025. REAP grants are paused. If your DSCRs are near 1.20×, lender talks get harder. This piece runs the barn math and hands you a 30/90/365 playbook to check your own exposure.
Mark and Lisa are composite illustrations built from published benchmarks and common industry patterns — not specific individuals. All numbers are walked through transparently, so you can plug in your own.
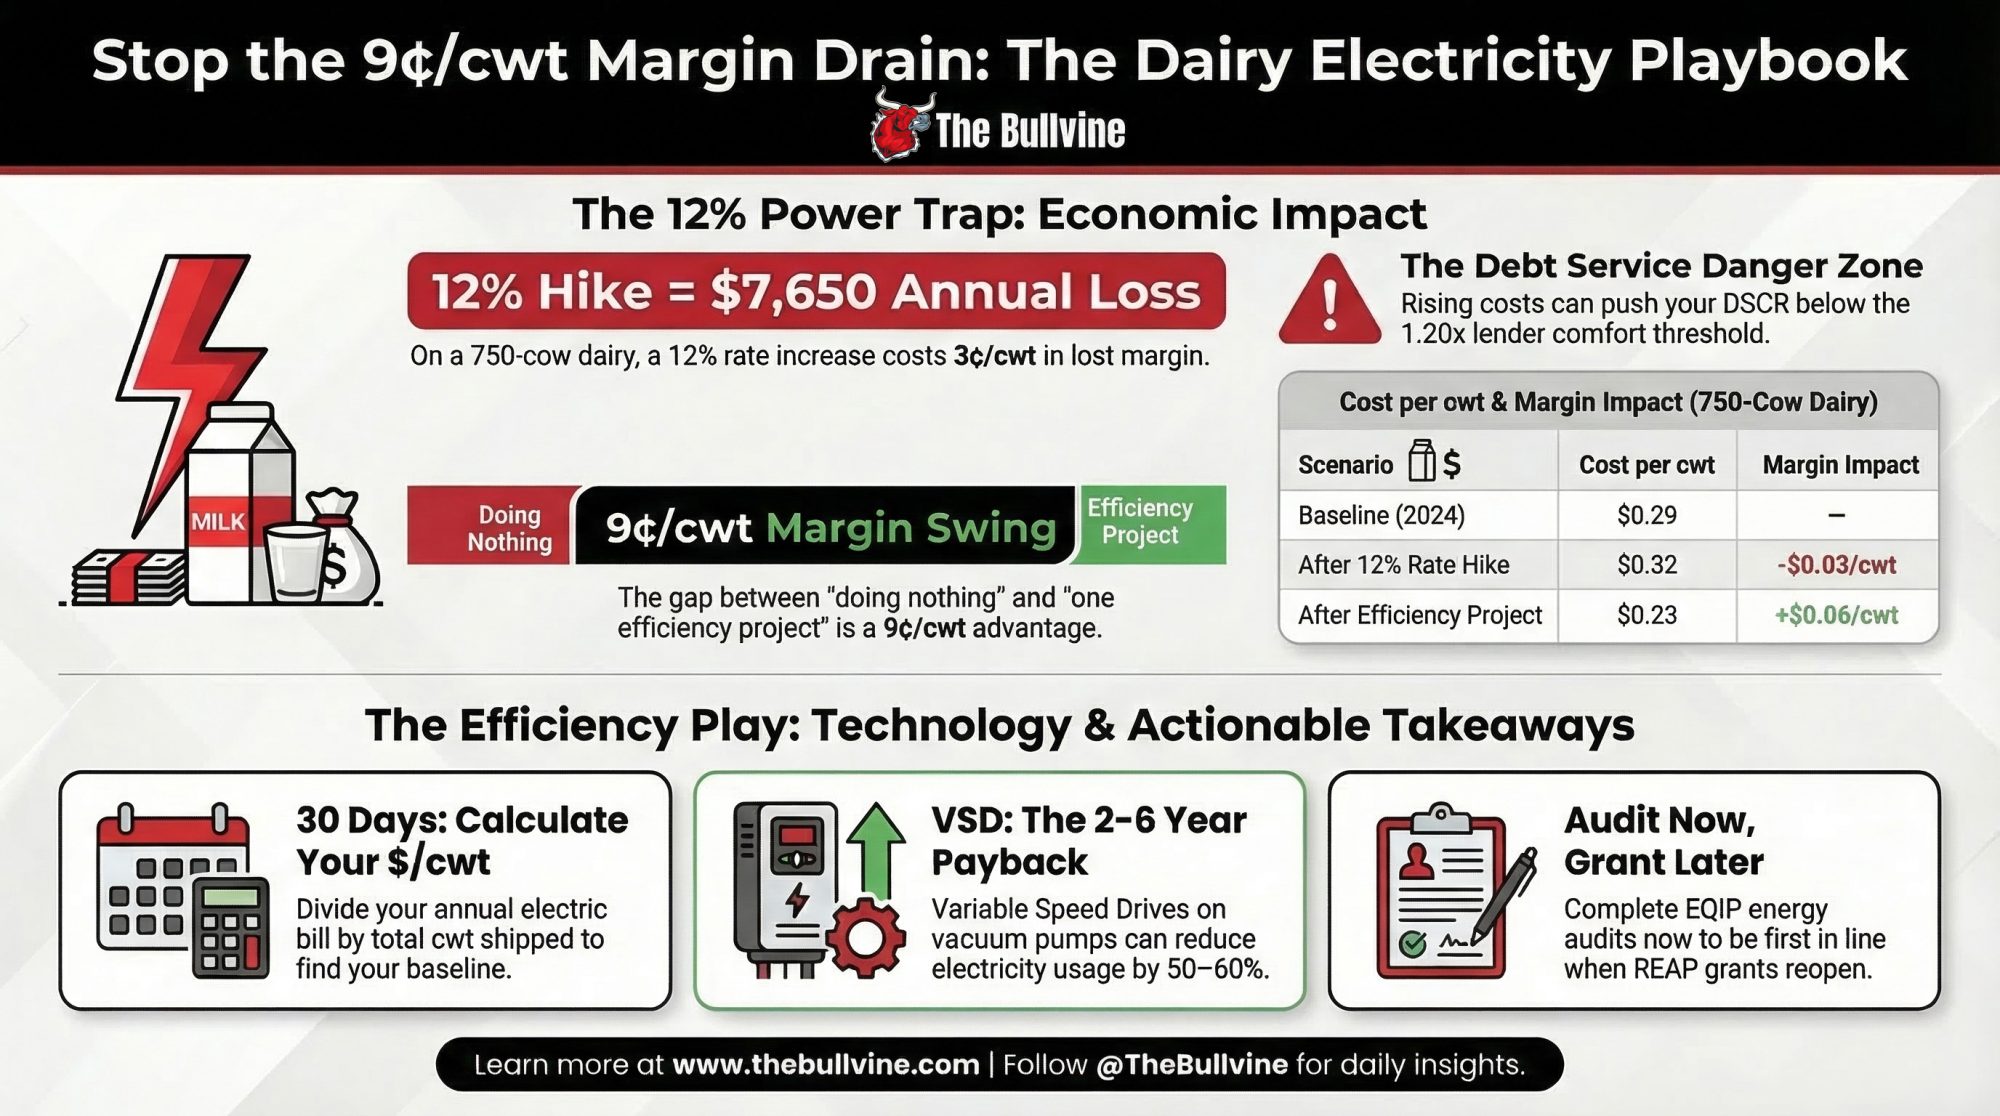
A 12% bump in dairy electricity costs quietly strips about 3¢/cwt — or $7,650 a year on 220,000 cwt — out of a 750-cow dairy’s milk check. That’s not a modeling exercise. It’s what happens when you run the actual kWh through current rates.
Consider a 750-cow freestall — call him Mark — whose power bill climbed that much in early 2025. The reaction from operations in that position is almost universal: We can’t afford to invest in efficiency right now. We’ve got to preserve cash. On the surface, that feels conservative. Look at the math and the timeline to 2030, and it starts to look more like a trap.
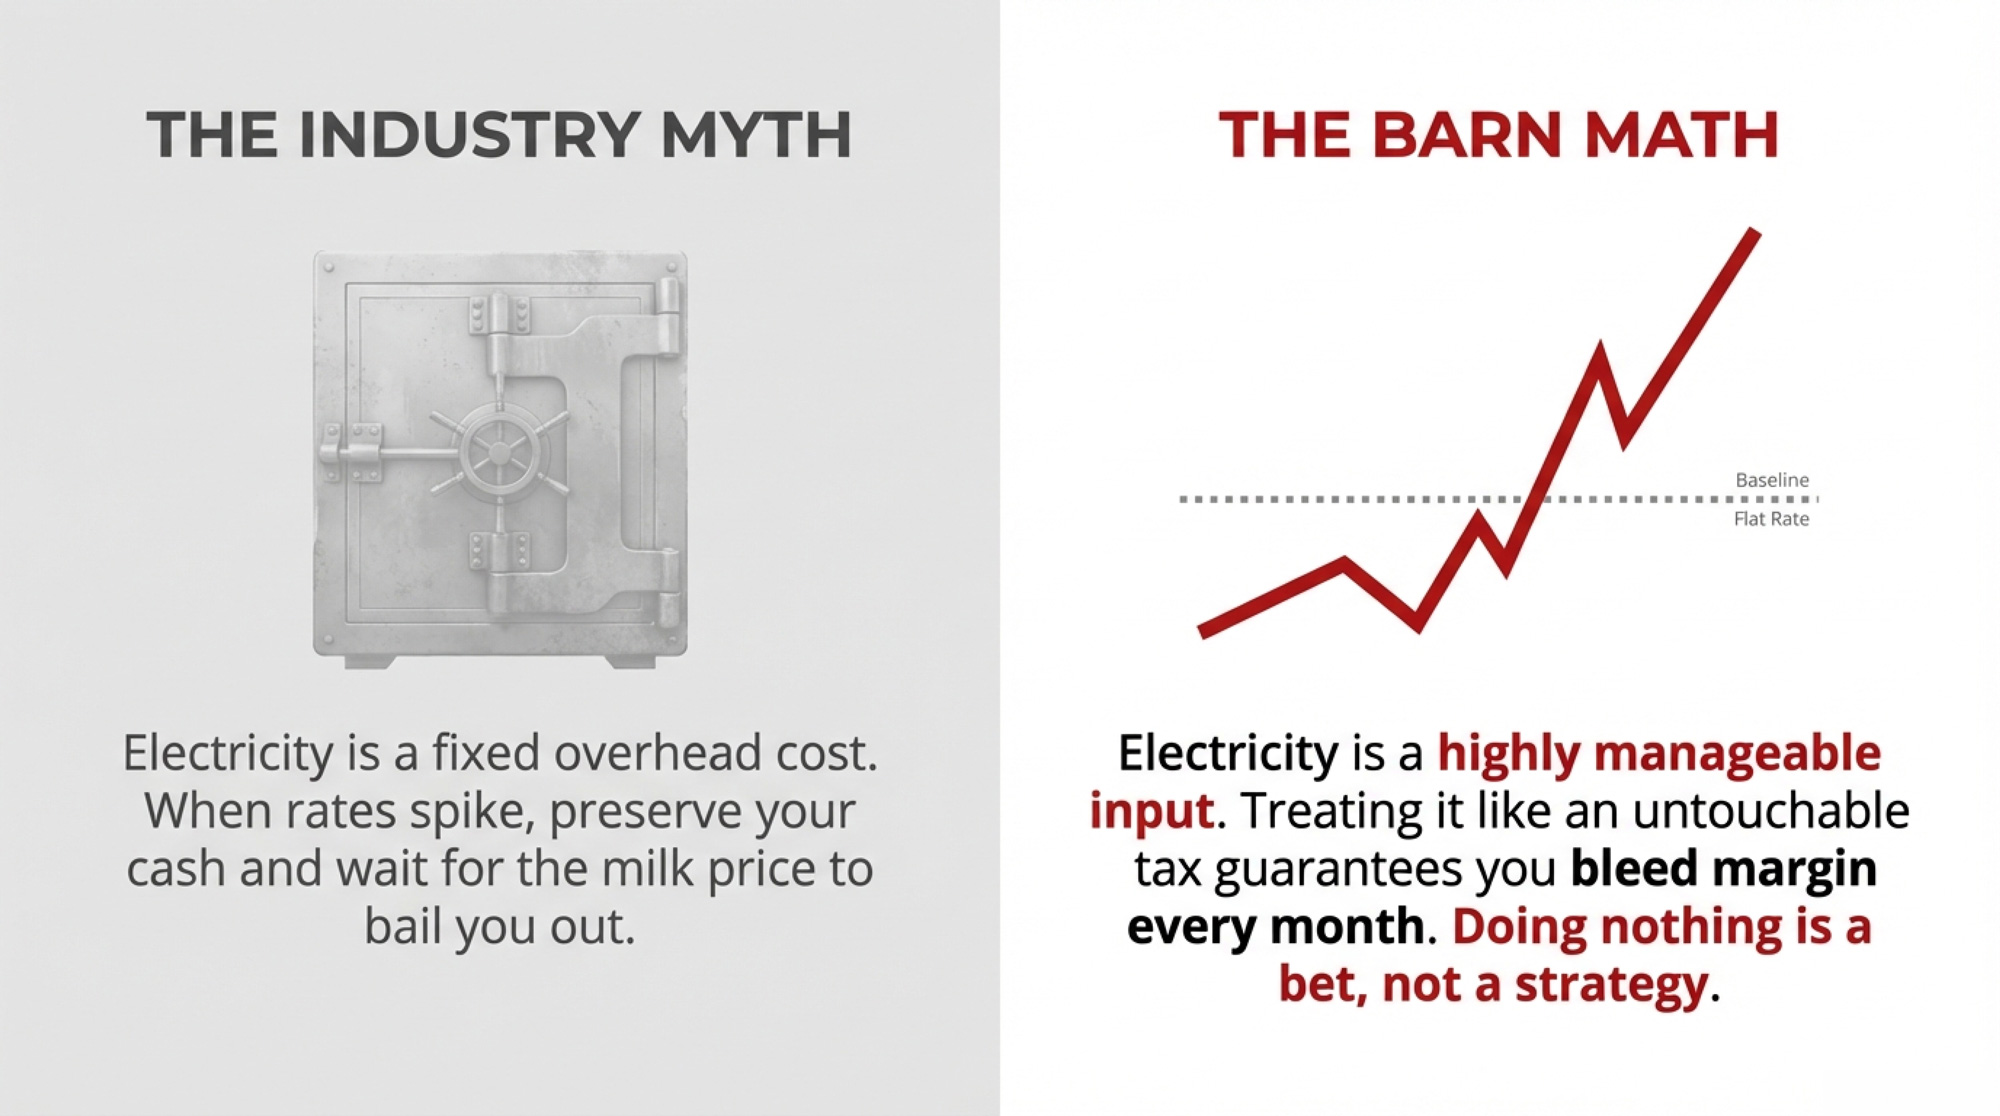
Electricity isn’t the fixed overhead line that most producers treat it as. A significant chunk moves with management decisions, herd size, and equipment choices. You can manage it the same way you manage feed cost. The operations that treat power like untouchable overhead? They’re leaving margin on the table every single month.
The Rate Hike Hitting Herds Like Mark’s
Mark’s scenario is a 750-cow North American freestall. Solid component milk, but a 2024–2025 milk price that’s nothing to brag about. Then the electricity bill jumps around 12% in one renewal cycle. No new barn. No robot install. Just rate changes and fees.
And 12% may be mild. Ontario’s wholesale electricity market price (the IESO’s Hourly Ontario Energy Price) averaged approximately 3.4¢/kWh across 2024, per IESO year-end data. Then wholesale prices surged over 90% in 2025 — the highest annual average since 2005, according to Scott Luft’s January 2026 analysis on Cold Air. Ontario utilities layered distribution rate increases on top — Milton Hydro’s OEB-approved distribution rate increase was 3.70% effective January 1, 2026. Total delivered costs for farm customers are partially offset by the Ontario Electricity Rebate (23.5%as of November 1, 2025, per OEB), so the net bill impact is smaller than the headline wholesale jump — but the direction is unambiguous.
Ontario and US benchmarking have found dairy electricity use in confinement systems ranging from 800–1,400 kWh/cow/year, with freestalls averaging around 837 kWh/cow/year and tiestalls near 1,417 kWh/cow/year (Ontario OMAFRA). A 2022 Progressive Dairy article summarizing USDA REAP and EQIP projects noted that energy-efficiency upgrades on dairies can reduce energy costs by 10 to 35 percent, saving 2¢ to 30¢ per hundredweight in avoided costs.
The unspoken bet behind the preserve cash stance is that milk price will bail you out faster than power costs keep climbing. That’s a bet — not a strategy.
What Does a 12% Rate Hike Actually Cost a 750-Cow Dairy?
You don’t feel percentages. You feel dollars leaving the account.
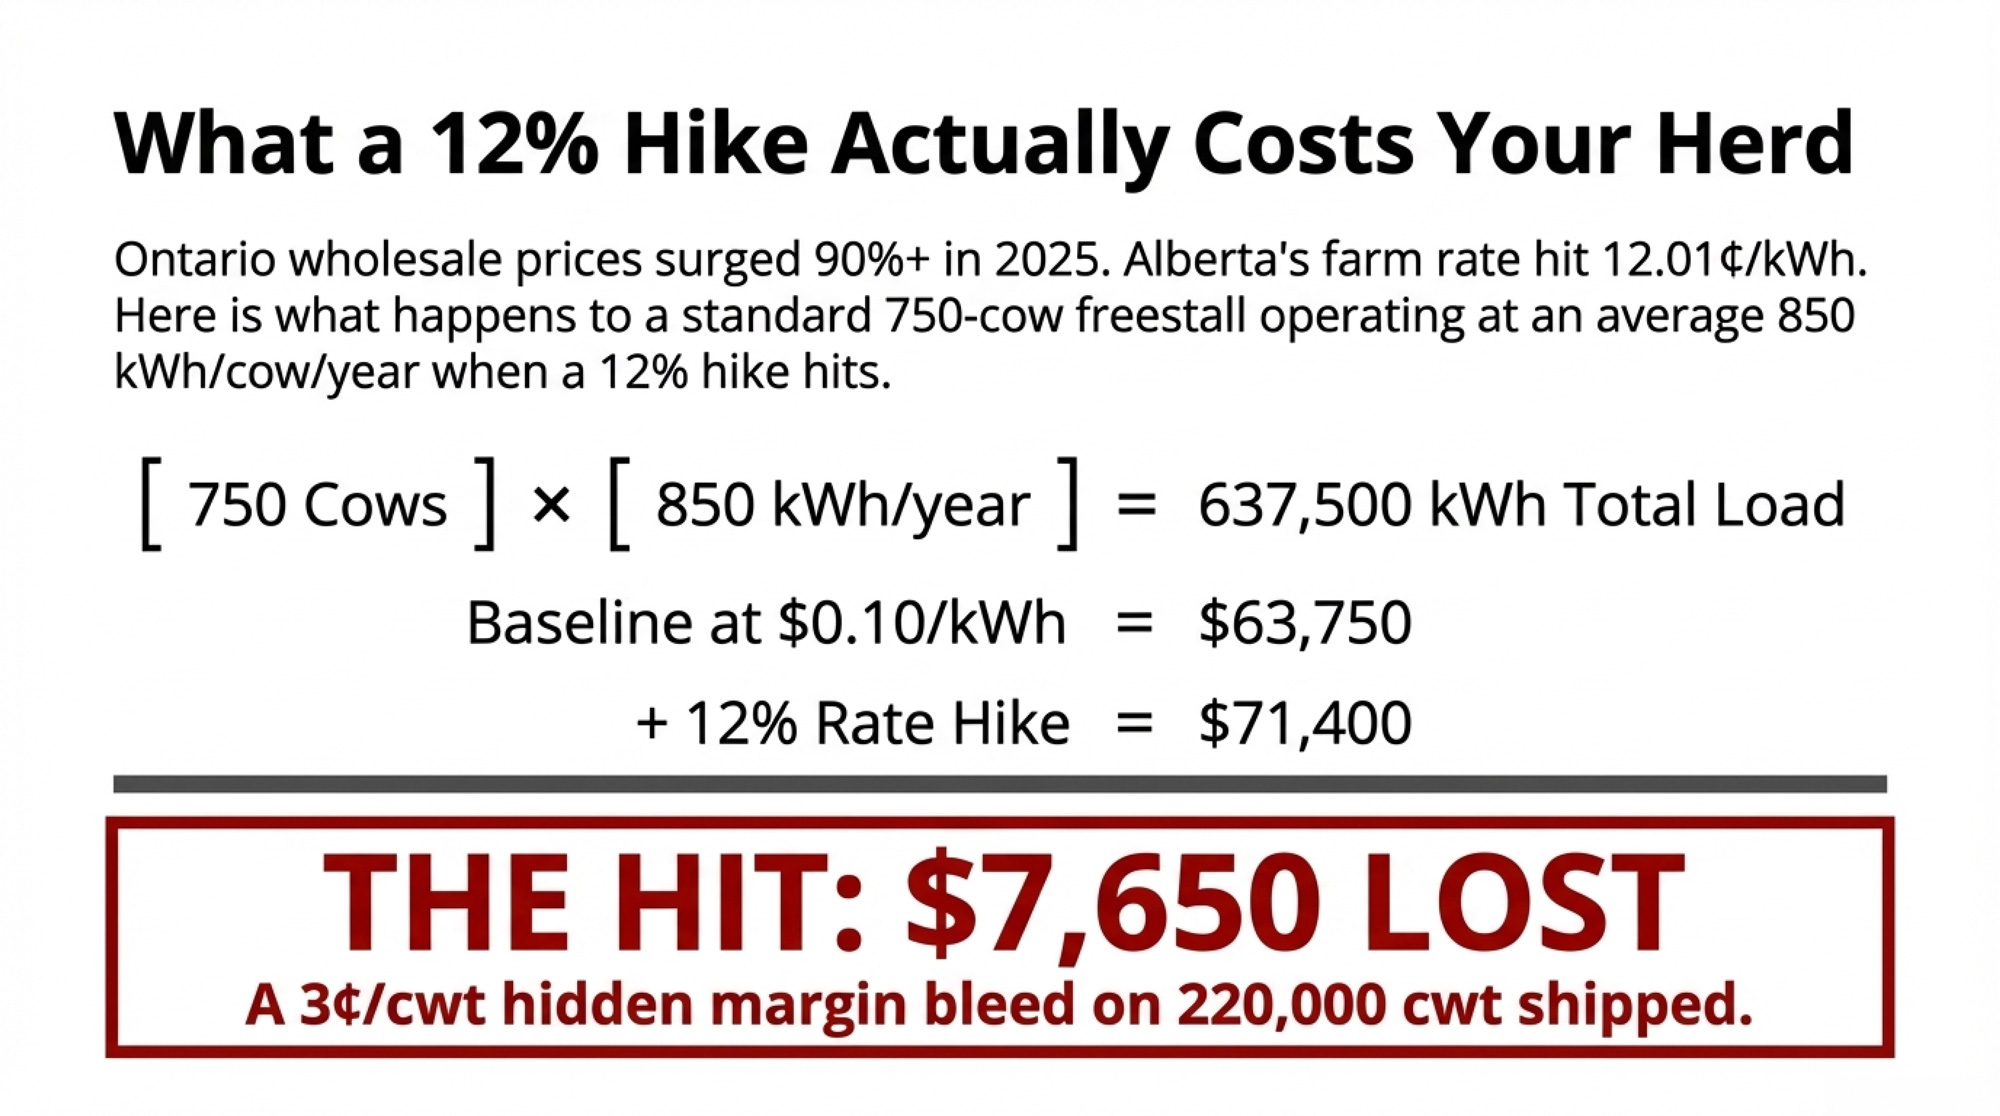
A Minnesota Department of Commerce dairy energy study found that US dairy farms range from 400 to 1,700 kWh per cow annually, with electric utility costs of about $0.035 to $0.045 per cwt in the Midwest. Using freestall averages from Ontario and Midwest data, work with 850 kWh/cow/year for Mark’s 750-cow scenario:
750 cows × 850 kWh/cow/year = 637,500 kWh/year
For the rate assumption, Alberta’s current Rate of Last Resort for farm customers sits at 12.01¢/kWh as of March 2026, per EPCOR’s published schedule. Index (spot) prices ran lower through 2025 — averaging roughly 4–9¢/kWh,depending on the month. To keep the example conservative and broadly applicable, use $0.10/kWh:
Baseline: 637,500 kWh × $0.10 = $63,750/year
After 12% hike: $63,750 × 1.12 = $71,400/year
Annual hit: $7,650
Assuming the operation ships 220,000 cwt/year:
| Metric | Baseline (2024) | After 12% Hike (Doing Nothing) | After Efficiency Project* |
| Annual Electricity Cost | $63,750 | $71,400 | $51,000 |
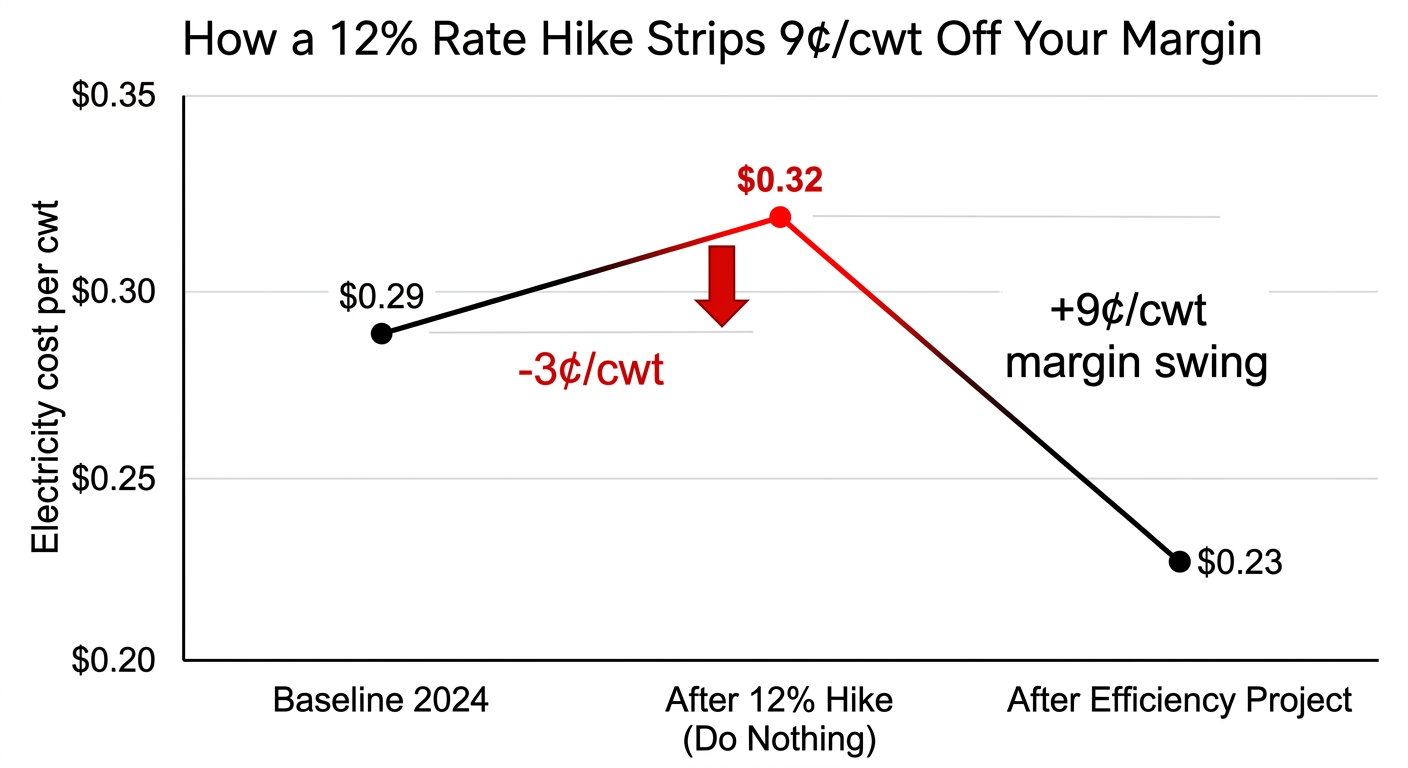
| Cost per cwt ($/cwt) | $0.29 | $0.32 | $0.23 |
| Margin Impact vs. Baseline | — | −$0.03/cwt | +$0.06/cwt |
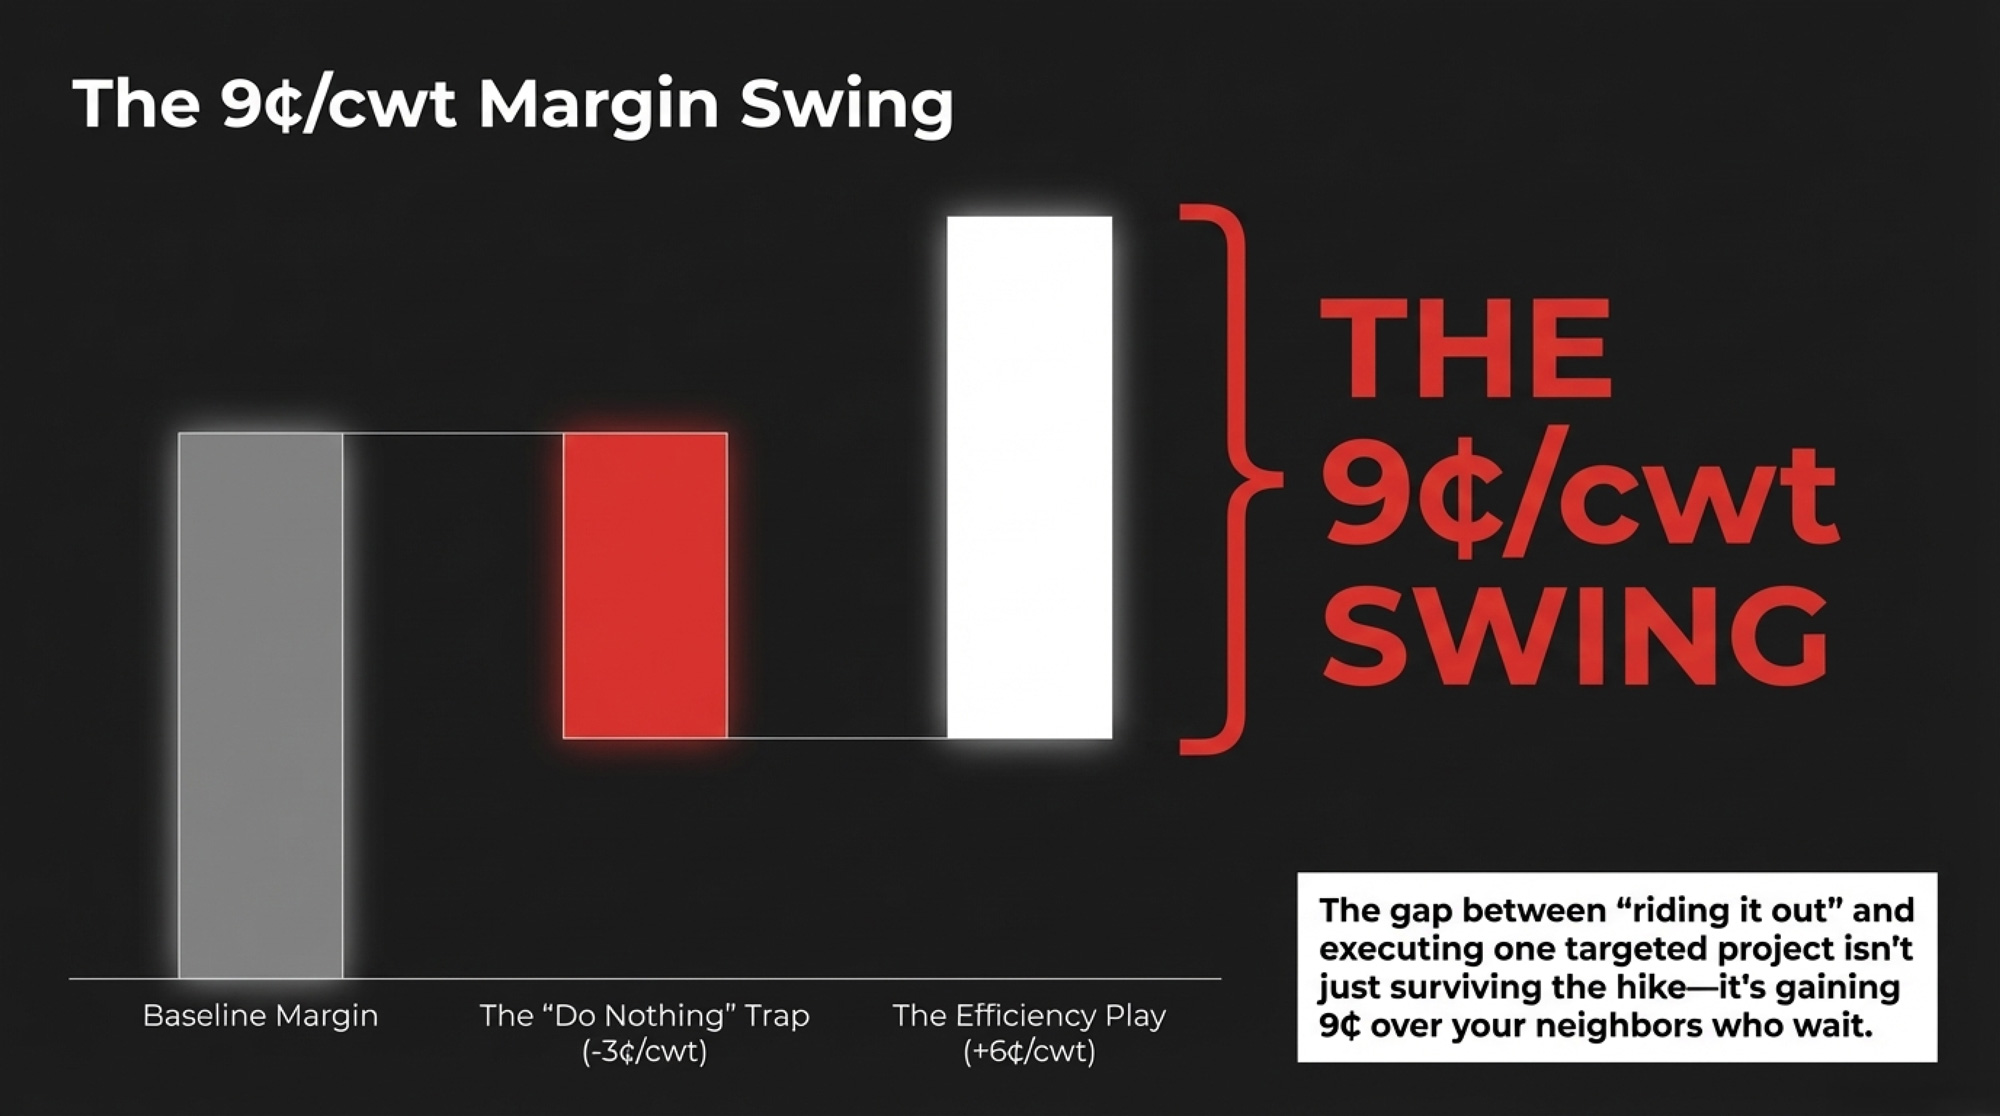
*Assumes 20% efficiency gain at the baseline rate, consistent with the 10–35% savings range documented in USDA-funded projects. Note: the 9¢/cwt swing compares the post-hike do-nothing scenario against the baseline with efficiency gains — it combines the cost of the hike (3¢) with the project’s benefit (6¢).
Plug in your own numbers: if your herd ships [X] cwt per year and your annual electricity bill is [Y], your electricity cost per cwt is simply Y ÷ X. Do that once, then rerun it after the next rate change.
The gap between “doing nothing” and “doing one project” isn’t 3¢ — it’s 9¢/cwt of margin swing. If your herd sits closer to the upper end of the 2.3–4.5 kWh/cwt range documented across five US farms, the impact is worse.
How Fast Does a VSD on Dairy Vacuum Pumps Pay for Itself?
Most producers don’t start with digesters or solar. They start with a variable-speed drive on vacuum pumps — the math is straightforward, and field results are documented. The Minnesota Department of Commerce dairy energy study found VSDs on vacuum pumps presented “the greatest savings potential, especially for farms with long milking hours.”
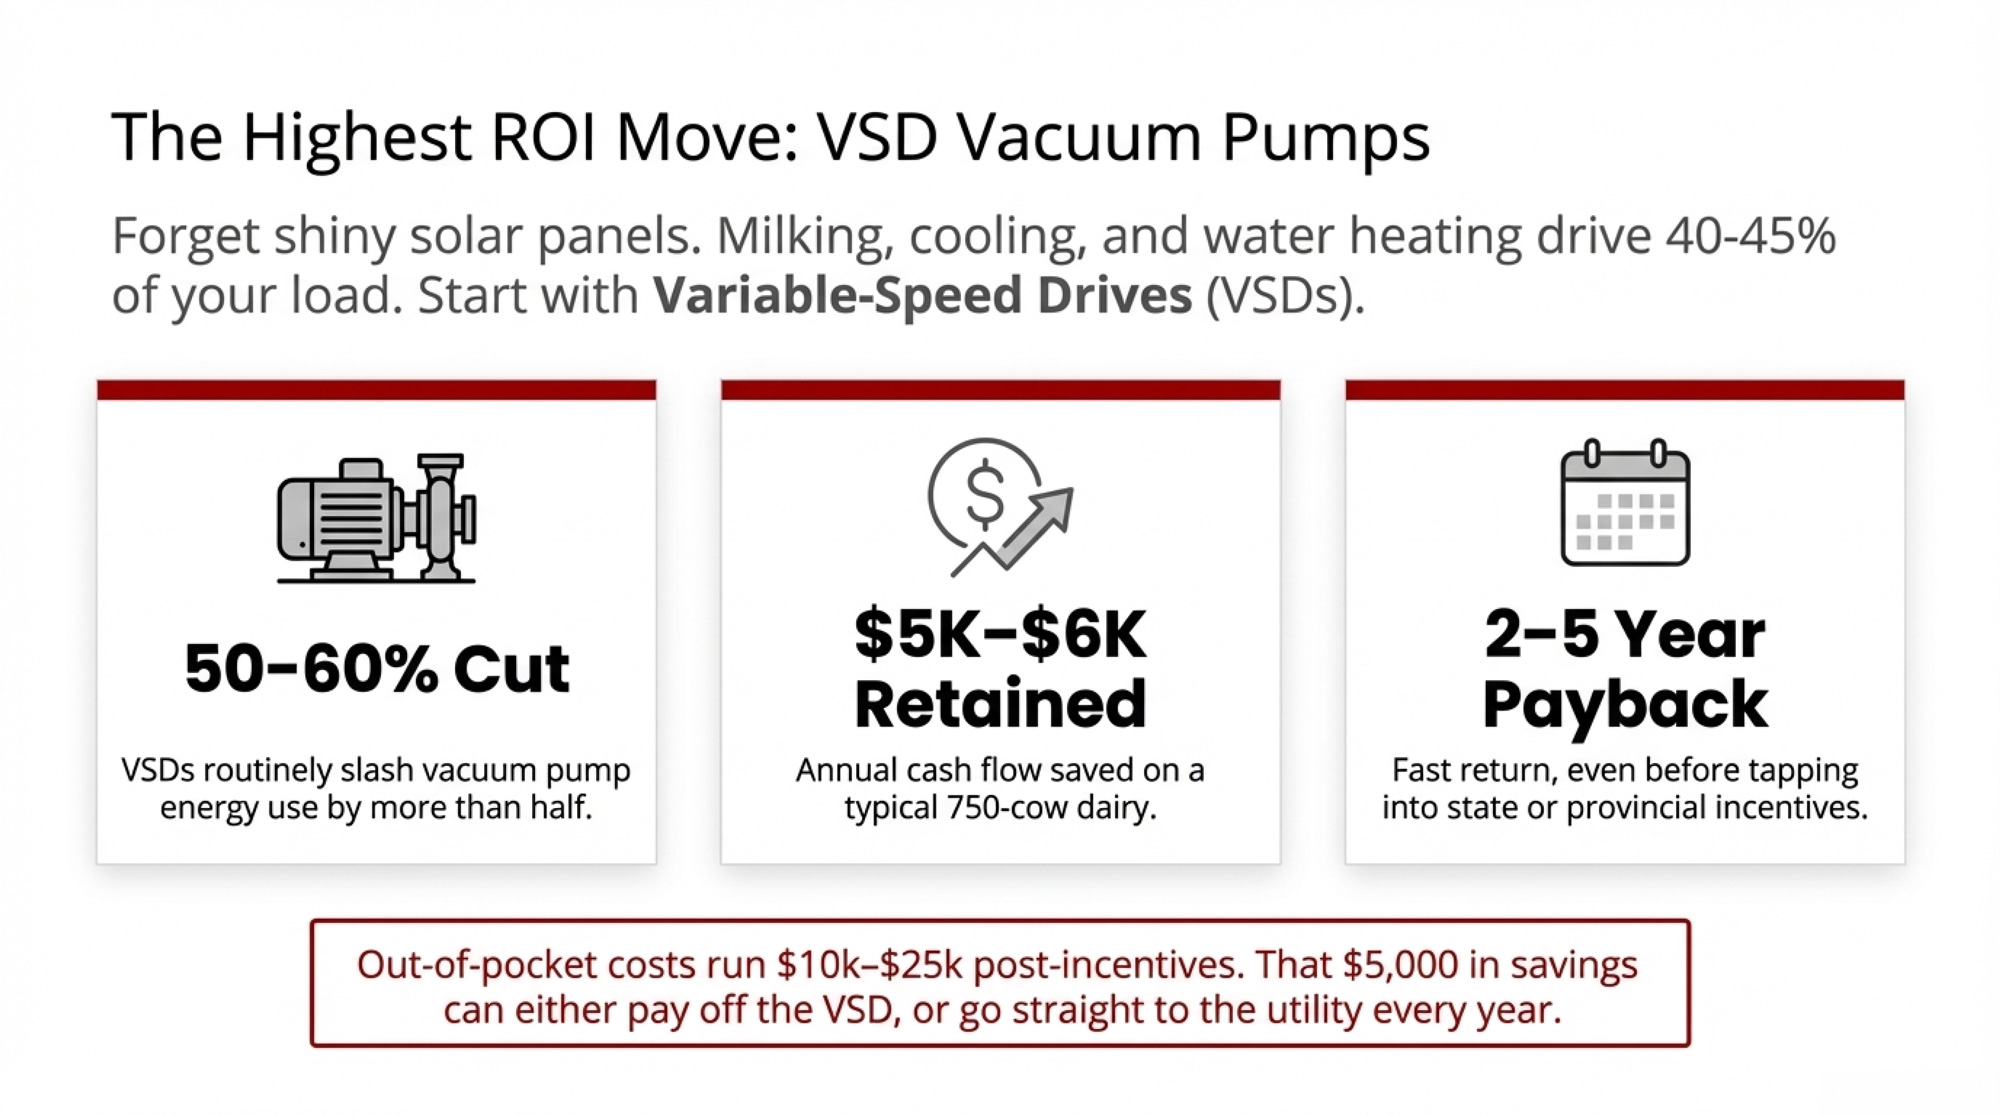
New York parlor studies report that milk harvesting — vacuum pumps, cooling, and water heating — accounts for roughly 40–45% of electricity use on those dairies. Alberta data estimated about 44% for milking on a typical 100-cow dairy. DairyConservation’s VFD practice sheet confirms a VFD “can typically reduce the electricity usage of the vacuum pump system by 50–60% and generally has a fast payback period even without financial incentives.” Wisconsin Extension reports a broader range of 30–80% savings depending on conditions. The National Dairy FARM Program similarly documents 50–60% reductions in vacuum pump electricity use with 3- to 7-year payback periods.
For Mark’s 750-cow operation, assume vacuum and milk pumps burn about 100,000 kWh/year of that 637,500 kWh total — plausible given milking and cooling combine for nearly half the load:
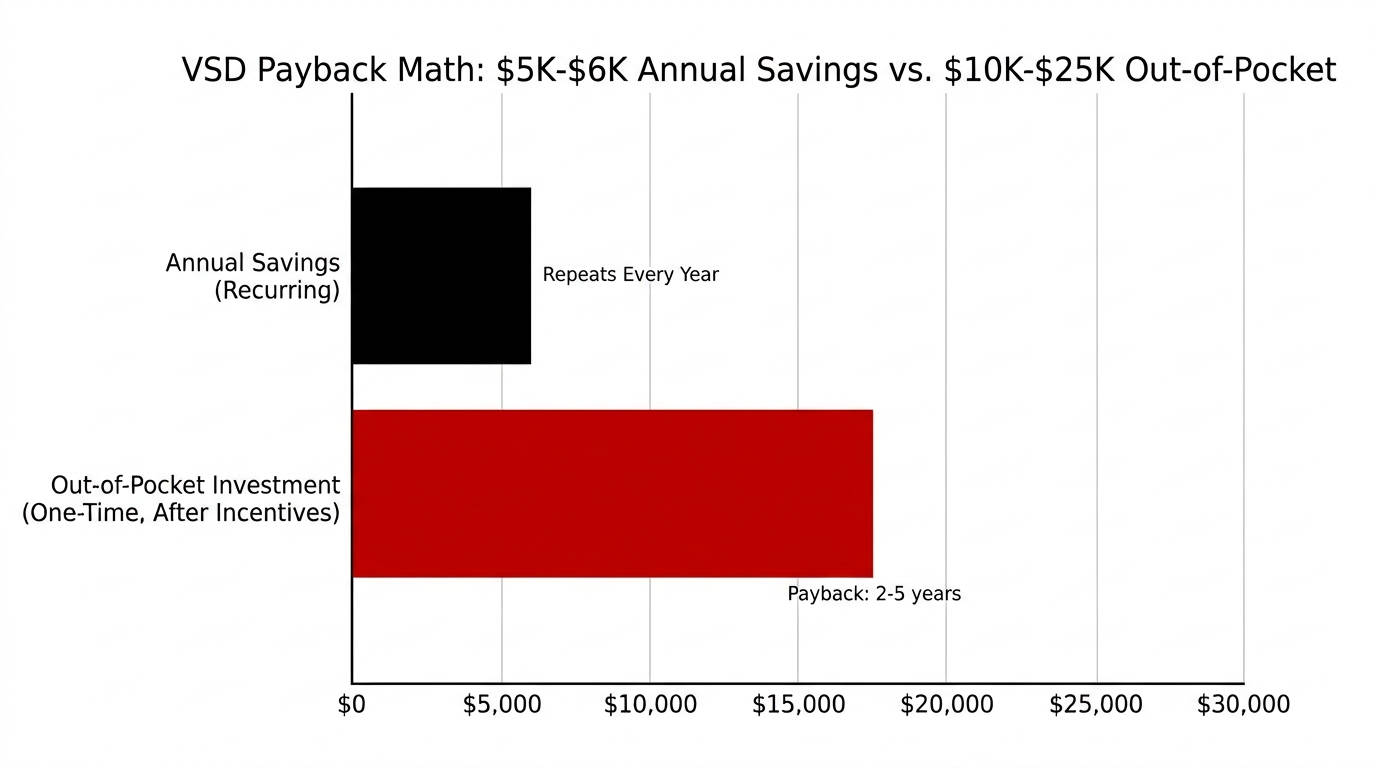
50,000–60,000 kWh saved × $0.10/kWh = $5,000–$6,000/year
You’re likely looking at multiple VSD units across vacuum and milk transfer pumps, potentially new compatible motors, and professional installation. A single 7.5 HP vacuum pump VSD retails around $4,450 from dairy equipment suppliers, and total project costs for multi-pump systems can run $30,000–$50,000 gross before incentives. EQIP typically covers 50 to 75 percent of eligible costs, and several state and provincial incentive programs layer on top — putting realistic out-of-pocket costs in the $10,000–$25,000 range, depending on your program stack:
Payback: $10,000–$25,000 ÷ $5,000–$6,000/year ≈ 2–5 years
That range aligns with Penn State Extension’s assessment: “There is often a 2- to 6-year payback on investments for variable speed drive vacuum pumps, well water pre-cooling of milk, and heat recovery from the refrigeration system,” per Dr. Doug Reinemann’s recommendations published in a Penn State Extension article on parlor retrofits. One caveat: the Minnesota Commerce study found a 6.6-year mean payback specifically for receiver jar milk pump VSDs. Vacuum pump drives pencil faster than milk pump drives, and your mileage depends on milking hours and system configuration.
In Mark’s scenario, that $5,000–$6,000 goes to the utility every year instead. In the Lisa scenario — call her a neighbour running 600-some cows who made a different call — those dollars stay in the operation’s cash flow. The risk of doing the project isn’t zero; equipment can underperform, and one farmer on NewAgTalk reported his VFD controller failed twice at $2,000 per repair. But the risk of doing nothing in a rising-rate world is now visible in the barn math.
Why Your Lender Cares More About This Than You Think
The $7,650/year hit from a rate hike doesn’t just show up on your power bill. It shows up on your lender’s spreadsheet — specifically in your Debt Service Coverage Ratio (DSCR).
Farm Credit Canada defines DSCR as net cash income divided by total annual debt obligations. Many ag lenders look for a DSCR above 1.20–1.25×. Fall below that, and conversations about credit access get harder.
If your DSCR is already sitting near 1.15–1.20× — the zone The Bullvine’s own composite herd analysis of Kansas City Fed data placed at the edge of “significant financial stress” for agricultural producers — a $7,650 swing in annual OPEX can tip a lender conversation from routine to uncomfortable. It’s not just the electricity dollars. It’s the signal. When your lender sees rising energy costs on a flat kWh/cwt line, they see a farm absorbing input inflation with no management response.
When they see a declining kWh/cwt line with audit data and before-and-after numbers? They see the kind of operator they want to keep lending to. That’s the Lisa scenario in a nutshell — same rate hike, different signal to the banker.
| Scenario | Assumed DSCR (2025 Baseline) | DSCR After Electricity Impact (2026) | Lender Risk Tier |
| Baseline (2025, No Rate Hike) | 1.25 | 1.25 | Standard |
| Do Nothing (Post-Hike) | 1.25 | 1.18 | Elevated Risk |
| Efficiency Project Executed | 1.25 | 1.32 | Preferred |
Cornell Pro-Dairy’s 2024 Dairy Farm Business Summary (published July 2025, authored by Jason Karszes and Lainey Koval) showed the operating cost gap between New York’s highest- and lowest-earning quartiles widened to more than $6.50/cwt — up from $4.32/cwt in the 2023 DFBS. That’s 129 farms, in the same milk-price environment, separated by efficiency and cost control. RaboResearch’s Lucas Fuess, analyzing 2022 Ag Census data, told Brownfield Ag News that large-herd operators (2,000+ cows) can operate roughly $10/cwt less than 100–199-cow farms. Your lender knows where you sit in those ranges. The question is whether you’re moving in the right direction.
The Real Trap: Why Waiting Until 2027 Makes Everything Worse
Here’s what makes the we’ll deal with it later stance a trap — not just a delay.
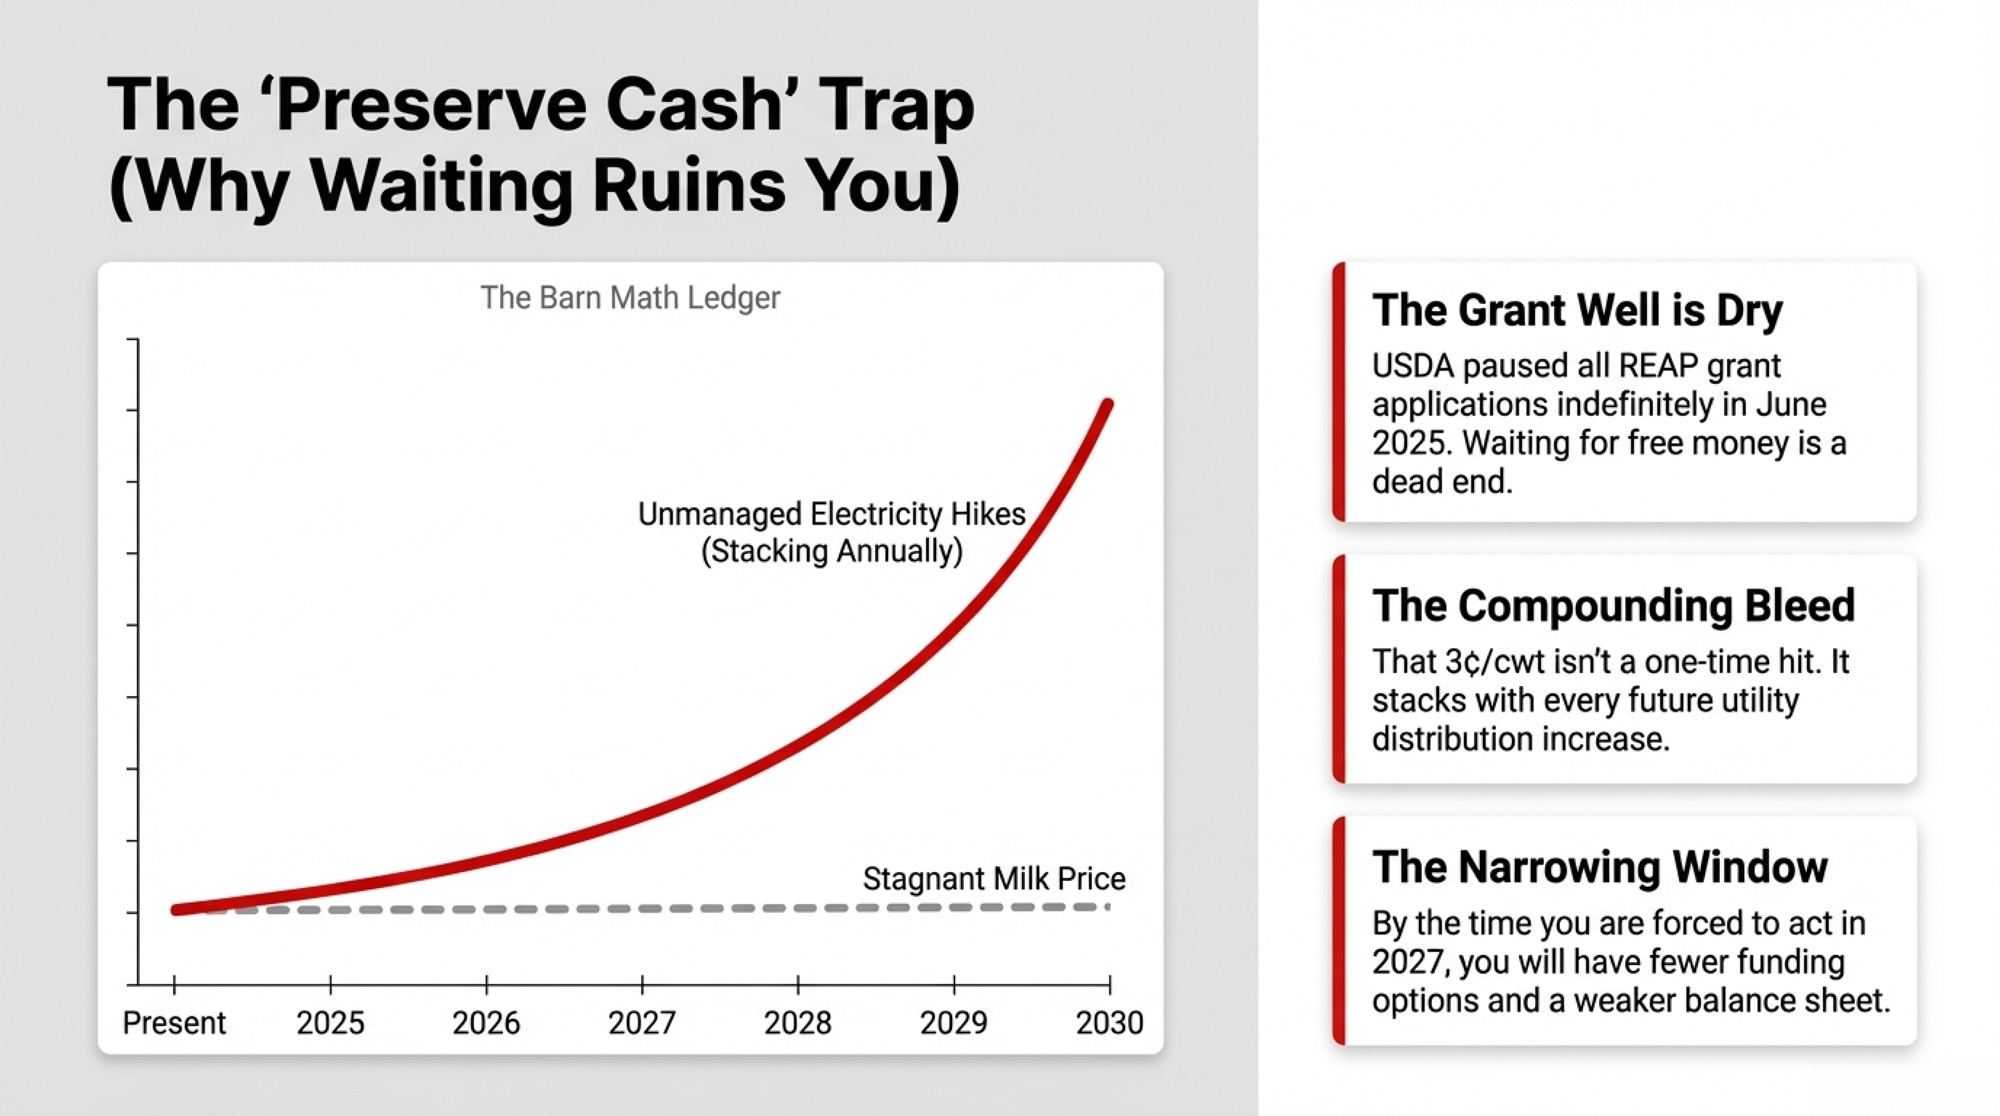
The grant money isn’t there right now. USDA paused all REAP grant applications on June 30, 2025, due to an overwhelming backlog of applications. The agency anticipated reopening on October 1, 2025, but as of January 2026, TPI Efficiency confirmed USDA’s REAP page still stated: “The Agency is not accepting REAP grant applications at this time.” REAP remains funded and authorized through at least 2027 via the Farm Bill, with IRA money available for obligation through September 30, 2031 — but the original FY 2026 grant deadlines (September 30, 2025; December 31, 2025; and March 31, 2026) have all passed without reopening. Guaranteed loan applications remain open year-round through local Rural Development offices.
The grant dollars that make fast-payback projects pencil out easiest are in limbo. And USDA has publicly indicated it’s implementing the Secretary’s direction to “disincentivize solar panels on productive farmland” in future application windows, adding further uncertainty to FY 2026 scoring criteria.
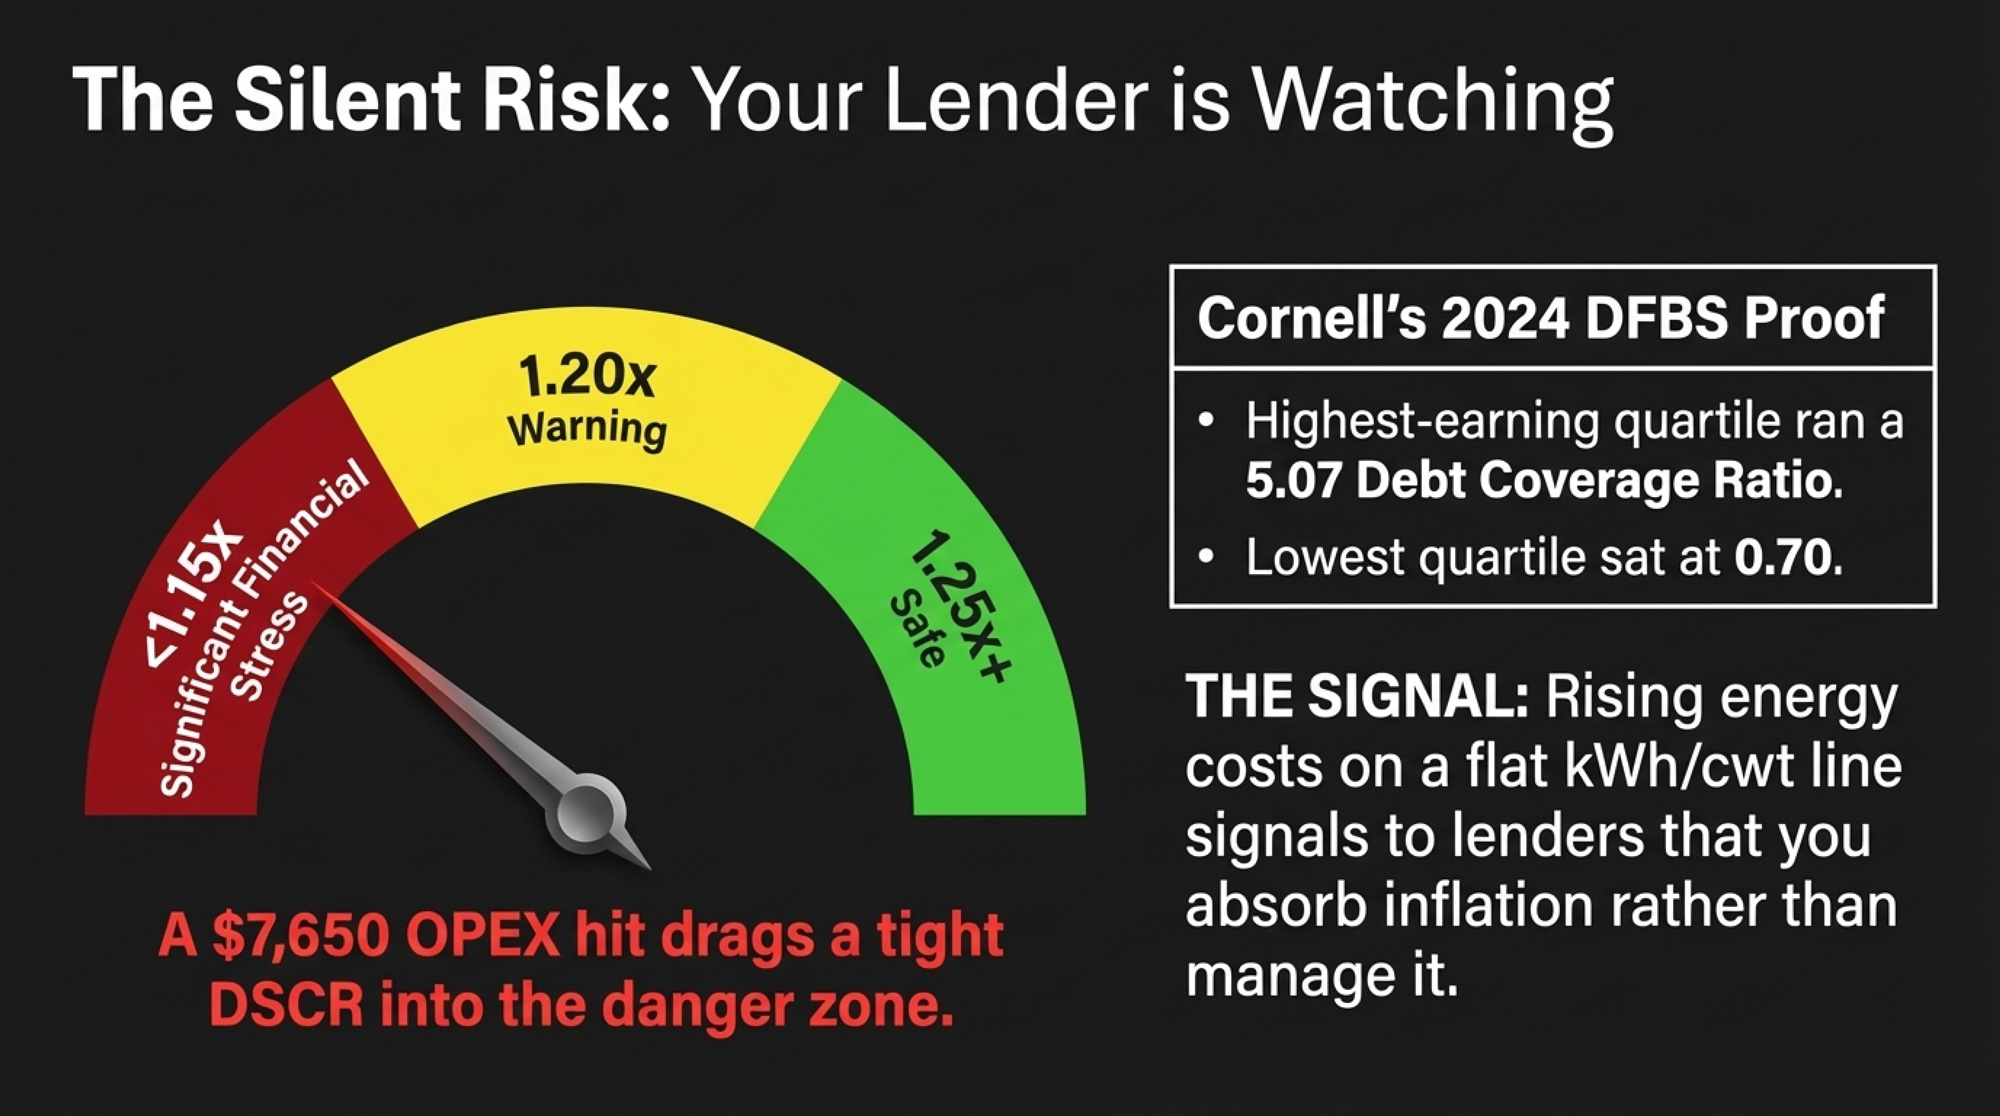
Your credit position is eroding. Every year you absorb rising electricity costs without a management response, DSCR drifts lower. By 2027, if milk prices haven’t bailed you out, your lender may not approve the capital for the upgrade you need — precisely because you waited too long to act when conditions were better. Cornell’s 2024 DFBS showed that the lowest-earning quartile of New York farms averaged a debt coverage ratio of just 0.70, while the highest-earning quartile averaged 5.07.
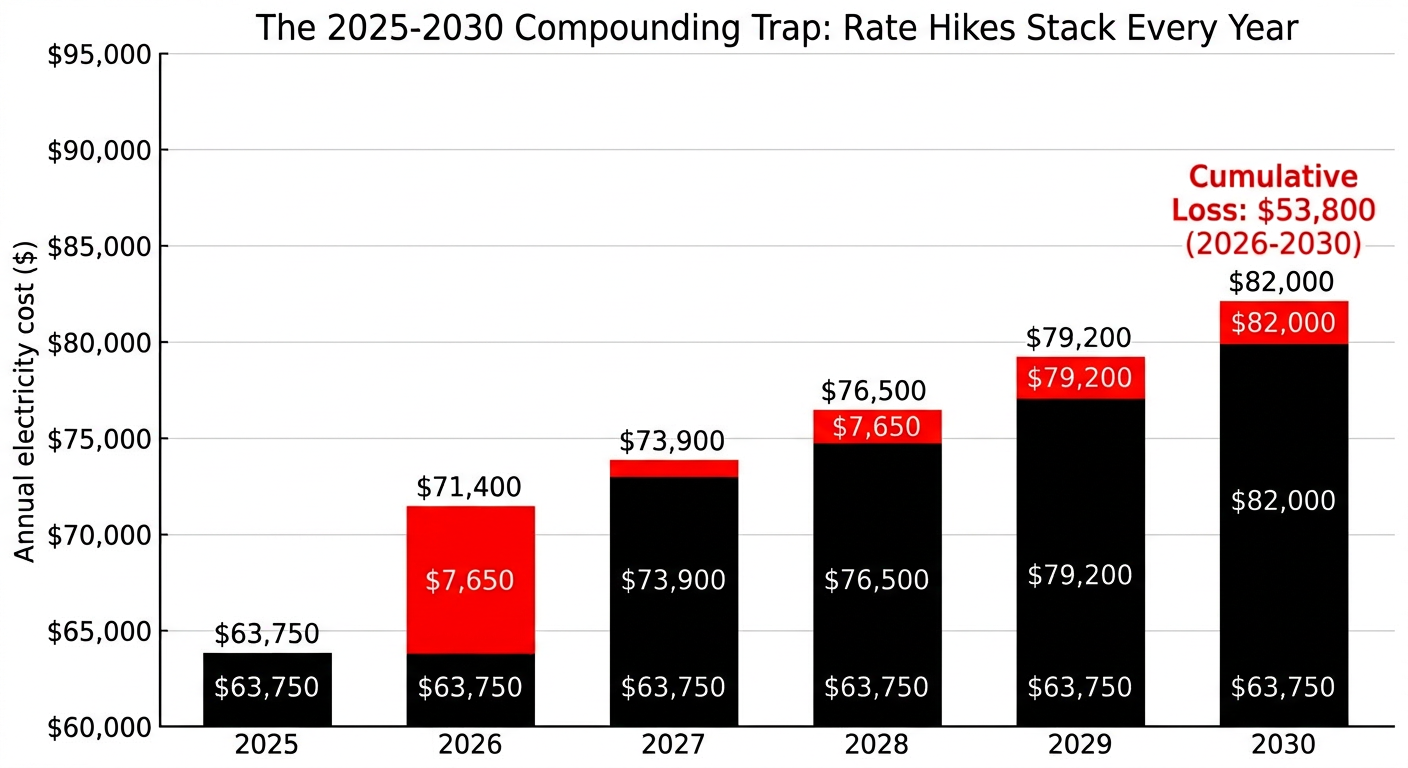
The compounding is relentless. That 3¢/cwt isn’t a one-time hit. It’s $7,650/year, every year, stacking on top of whatever the next rate increase adds. Two more rounds of distribution increases — consistent with Milton Hydro’s 3.70% distribution rate hike for 2026 and Ontario’s wholesale price trajectory — and the electricity line could drift several thousand dollars per year higher without a single new cow or piece of equipment.
In Mark’s scenario, you arrive at 2027, paying whatever the utility charges for the same kWh/cwt as in 2024, with a thinner DSCR and fewer funding options. In the Lisa scenario, you’ve got before-and-after data to show a lender and a kWh/cwt line moving in the right direction.
| Metric | Mark: Do Nothing | Lisa: One VSD Project |
| Annual Electricity Cost (2026) | $71,400 | $51,000 |
| Cost per cwt (2026) | $0.32 | $0.23 |
| Cumulative 3-Year Loss (2026–2028) | −$22,950 | +$38,400 (savings) |
| DSCR Trajectory (2026–2027) | 1.20 → 1.12 | 1.20 → 1.35 |
| Lender Conversation (2027) | “Concerns about cost control” | “Proof of management response” |
The Playbook: What to Do in 30, 90, and 365 Days
30 Days: Put Energy on Your Dashboard
No hardware. Just your own bills and milk records. In Mark’s scenario, this step never happens. In Lisa’s, it starts with one ugly spreadsheet.
- Pull 12 months of electricity bills. Total kWh and total dollars.
- Pull shipped milk for the same period.
- Calculate monthly kWh/cwt and $/cwt for electricity.
- Put those numbers wherever you track feed cost and margin.
Midwest benchmarking suggests $0.035–$0.045/cwt for electricity. If you’re well above that, your exposure is real. Calculate your actual electricity cost per cwt for the last year and write it down. That number is your starting point for every efficiency conversation in the future.
90 Days: Get an Audit Someone Else Helps Pay For
As of early 2026, USDA isn’t accepting REAP grant applications — but guaranteed loan applications remain open year-round, and EQIP energy audits are still available through your local NRCS service center. Most advisors are steering clients to structure projects, so they pencil in loan guarantees alone, treating any future grant awards as upside.
Don’t let the grant pause stop you from getting the audit done now. When applications reopen, farms with completed audits will be first in line. Many state incentive programs operate on their own timelines — Efficiency Vermont offers $1,125 cash back on VFDs for dairy vacuum pumps for herds of 50+ cows, and Wisconsin’s Focus on Energy program provides VFD incentives for dairy farms through participating utilities and equipment dealers.
Projects at the front of the line:
- Save ≥ 2¢/cwt at current rates
- Pay back in ≤ 7 years without grant money
- Target milking, cooling, or ventilation — not nice-to-have gadgets
If your DSCR is already near 1.20× or below, bring your lender into the conversation early. A $5,000–$6,000/year savings improves that ratio over time, but a new payment obligation in year one may tighten it before the savings compound.
365 Days: Execute One Big Win and Prove It Paid
Pick a single project targeting milking, cooling, or ventilation with a post-incentive payback under 7 years. Gather 3–6 months of baseline data before installation. Track the same metrics for 6–12 months after.
Make sure the base-case payback works without the most generous assumptions. Choose projects where savings show up in your own meter data, not just in marketing material. Then take that data back to your lender — before-and-after proof that the investment performed is the strongest possible argument for the next one. That’s exactly how the Lisa scenario becomes a lender conversation her neighbour in the Mark scenario can’t have.
| Efficiency Quartile | kWh/cow/year (Freestall) | $/cwt Benchmark (at $0.10/kWh) | Risk Level |
| Top 25% (Best Efficiency) | 400–650 | $0.025–$0.035 | Low |
| 2nd Quartile | 650–837 | $0.035–$0.040 | Moderate |
| 3rd Quartile | 837–1,000 | $0.040–$0.045 | Elevated |
| Bottom 25% (High Use) | 1,000–1,700 | $0.045–$0.075 | High Risk |
What This Means for Your Operation
- If your kWh/cwt sits above the 837 kWh/cow/year freestall average from Ontario or the 400–1,700 kWh/cow/year US band, energy is a top-three risk lever heading into 2030.
- Check your DSCR. If you’re running near 1.20× or below, a $7,650/year swing in electricity OPEX is the kind of line item that shifts a lender conversation. Cornell’s 2024 DFBS showed the lowest-earning quartile averaging a debt coverage ratio of 0.70 versus 5.07 for the top quartile.
- REAP grants are paused, but loan guarantees remain open, and EQIP energy audits are still available. Structure your project to pencil without grant dollars.
- Where does your kWh/cwt sit against that $0.035–$0.045/cwt Midwest benchmark — and have you ever shown that number to your lender?
- In the next 30 days: pull your last 12 electric bills, divide total dollars by total cwt shipped, and write down your $/cwt for electricity. Until you do, every energy conversation is guesswork.
Key Takeaways
- If your electricity cost per cwt has climbed and you’re not tracking kWh/cwt, you’re flying blind on one of the few cost lines you can still move before 2030.
- A 12% hike on a 750-cow dairy quietly shaves roughly 3¢/cwt off margin — but the real gap is the 9¢/cwt swingbetween doing nothing and executing one 20%-efficiency project.
- The trap isn’t the rate hike itself. It’s that by the time you decide to act, grant money is paused, your DSCR may have drifted below your lender’s comfort zone, and the compounding losses make the upgrade harder to finance — not easier. If your DSCR sits near 1.20× or below, you’re in that zone right now.
- Any energy project with a post-incentive payback period longer than 7 years belongs at the back of the line — unless it also addresses a non-energy constraint, such as cooling capacity or animal comfort.
The Bottom Line
The dairies that make it to 2030 won’t be the ones with the shiniest solar installs. They’ll be the ones that treated kWh/cwt the same way they treat feed efficiency — a number to chip away at, year after year, while the operations next door were still calling electricity a fixed cost.
Complete references and supporting documentation are available upon request by contacting the editorial team at editor@thebullvine.com.
Learn More
- The Four Numbers Every Dairy Producer Needs to Calculate This Week – Arms you with a survival-focused framework to stop the “equity bleed.” This diagnostic tool reveals your true breakeven and liquidity runway, transforming reactive worry into a 90-day execution plan for immediate cash-flow stability.
- The Next 18 Months Will Decide Who’s Still Milking in 2030 – Exposes the structural red lines in debt-to-asset ratios that lenders are watching right now. It delivers a strategic checklist for long-term positioning, helping you navigate global supply shifts before market consolidation forces the choice for you.
- Unlock Hidden Dairy Profits Through Lifetime Efficiency – Breaks down how selecting for Residual Feed Intake (RFI) can slash feed costs by $251 per cow. It connects genetic advancements to metabolic efficiency, offering a permanent, high-ROI solution to the margin squeeze discussed in this article.
 The Sunday Read Dairy Professionals Don’t Skip.
 The Sunday Read Dairy Professionals Don’t Skip.
Every week, thousands of producers, breeders, and industry insiders open Bullvine Weekly for genetics insights, market shifts, and profit strategies they won’t find anywhere else. One email. Five minutes. Smarter decisions all week.


