


December 2025’s DMC margin hit $9.42/cwt — the only payment all year. One nutritionist pulled the feed tickets. The leak wasn’t price. It was efficiency.
Executive Summary: At 1.3 feed efficiency, a 300‑cow high group feeding a $0.33/kg DM ration is burning roughly $64,000 a year on dry matter it doesn’t need to hold current milk. This article walks through a composite Midwest herd that looked “fine” at 32 kg 3.5% FCM until December 2025, when the DMC margin of $9.42/cwt on $9.58/cwt feed costs exposed how little protection there was in the safety net. Using the updated NASEM 2021 model, the same ration that NRC 2001 would run at higher DMI shows it can support that milk on about 1.8 kg less DMI per cow per day, if bunk management, starch/NDF balance, and cow flow line up. The piece then tackles additives and shows how a common inert fat example — $0.54/cow/day in for $0.37/cow/day back — turns some “supplements” into straight donations to your feed bill. It also hits the mineral blind spot: water with elevated iron, manganese, or sulfate can quietly block copper and zinc and drag down intake even when your premix looks perfect. You’ll come away with specific thresholds (high group FE, RDP %, MUN range, fat and DDGS caps) and a 30‑day plan to calculate FE by pen, re‑run your ration through NASEM 2021, and order a full water test. If your high group is anywhere near 1.3 FE right now, this is a 10‑minute read that could easily be worth $0.50–$0.60 per cow per day in recovered margin.
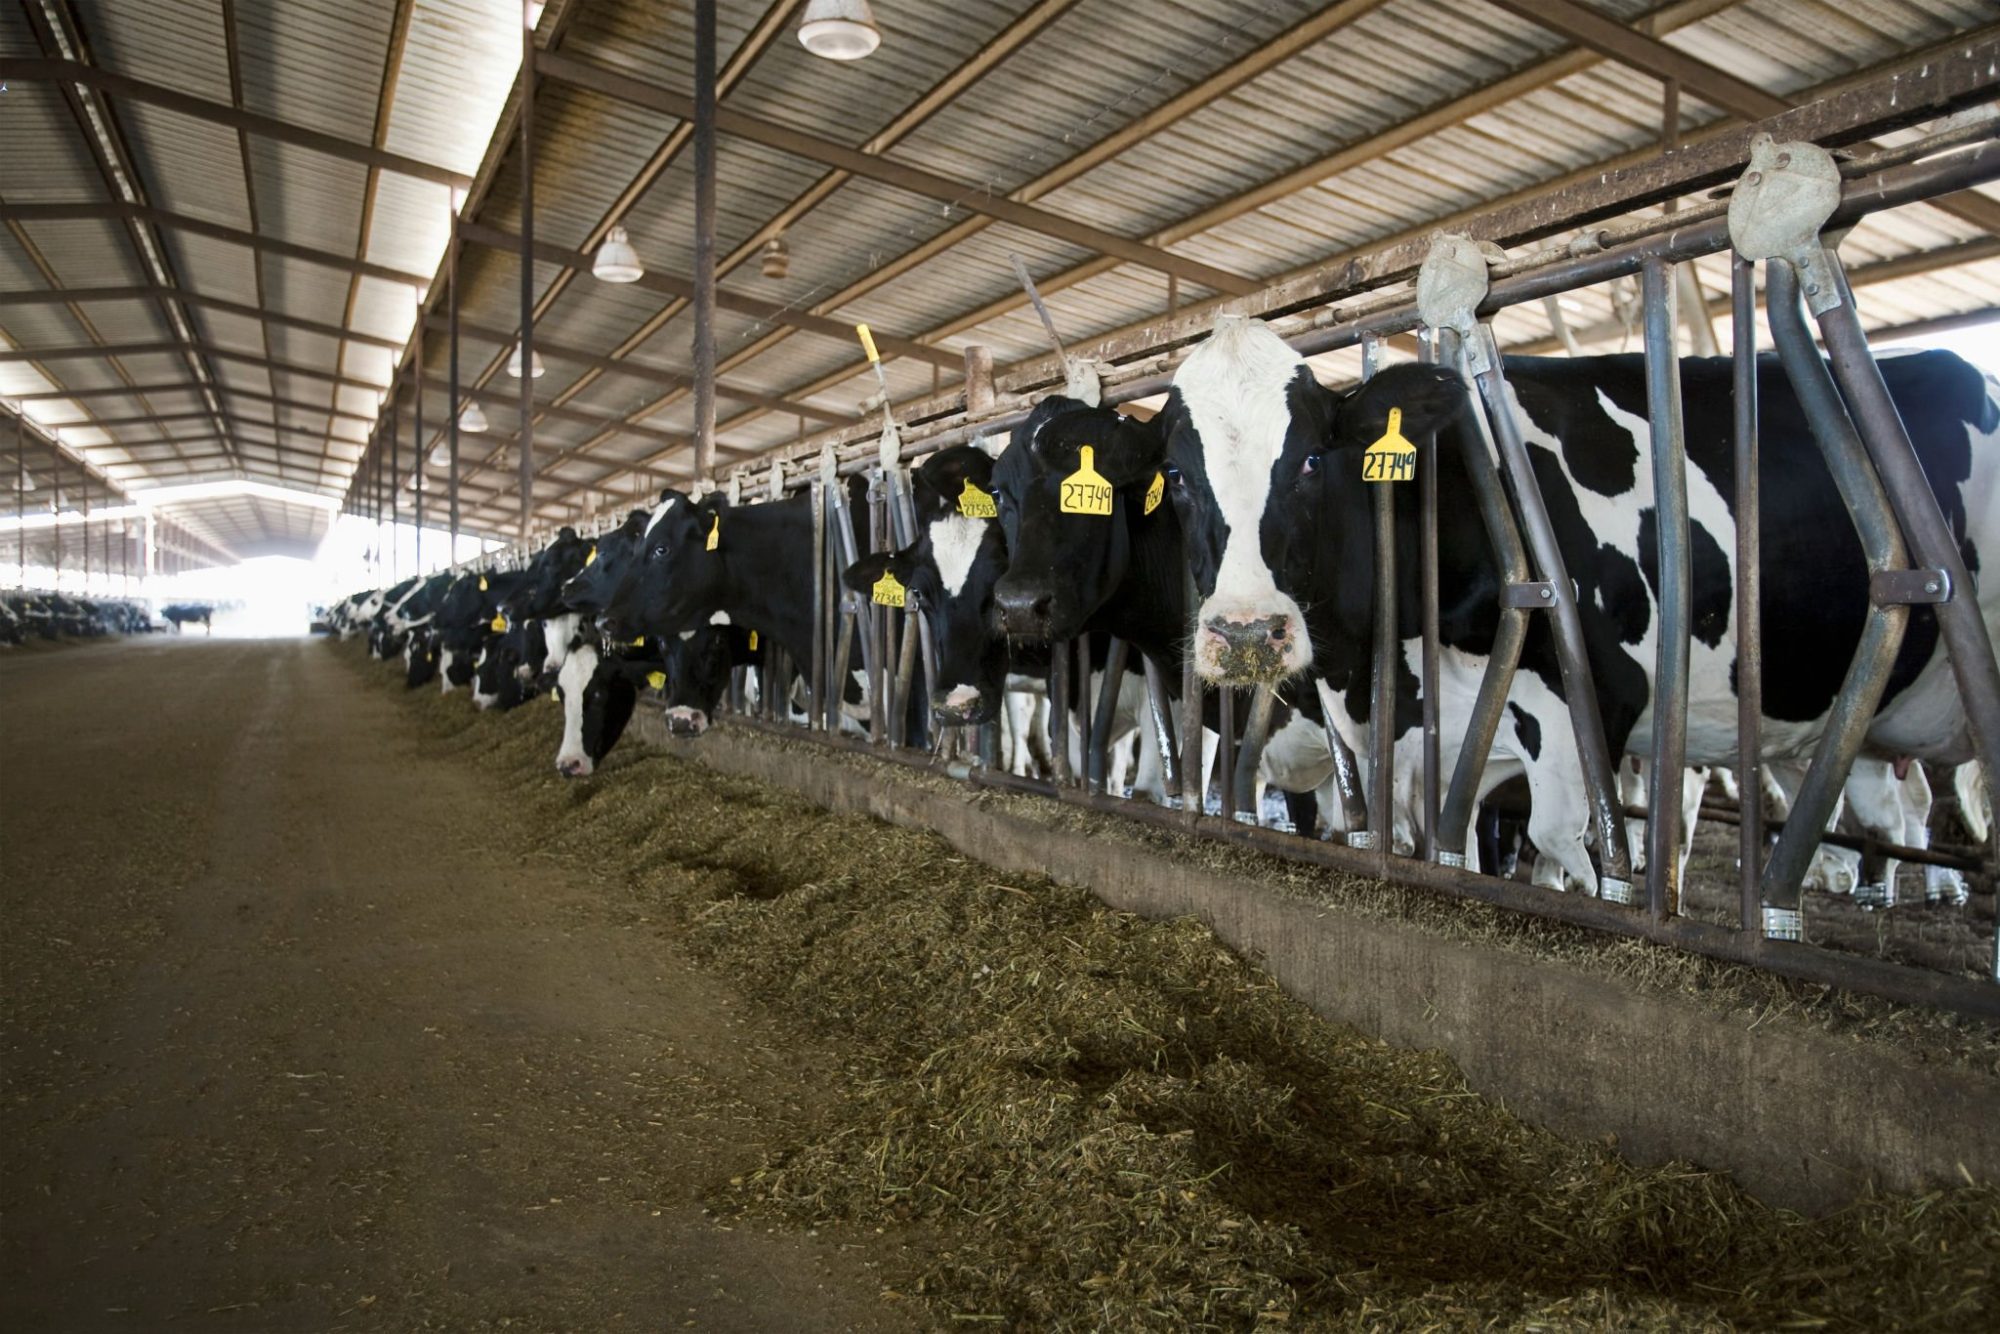
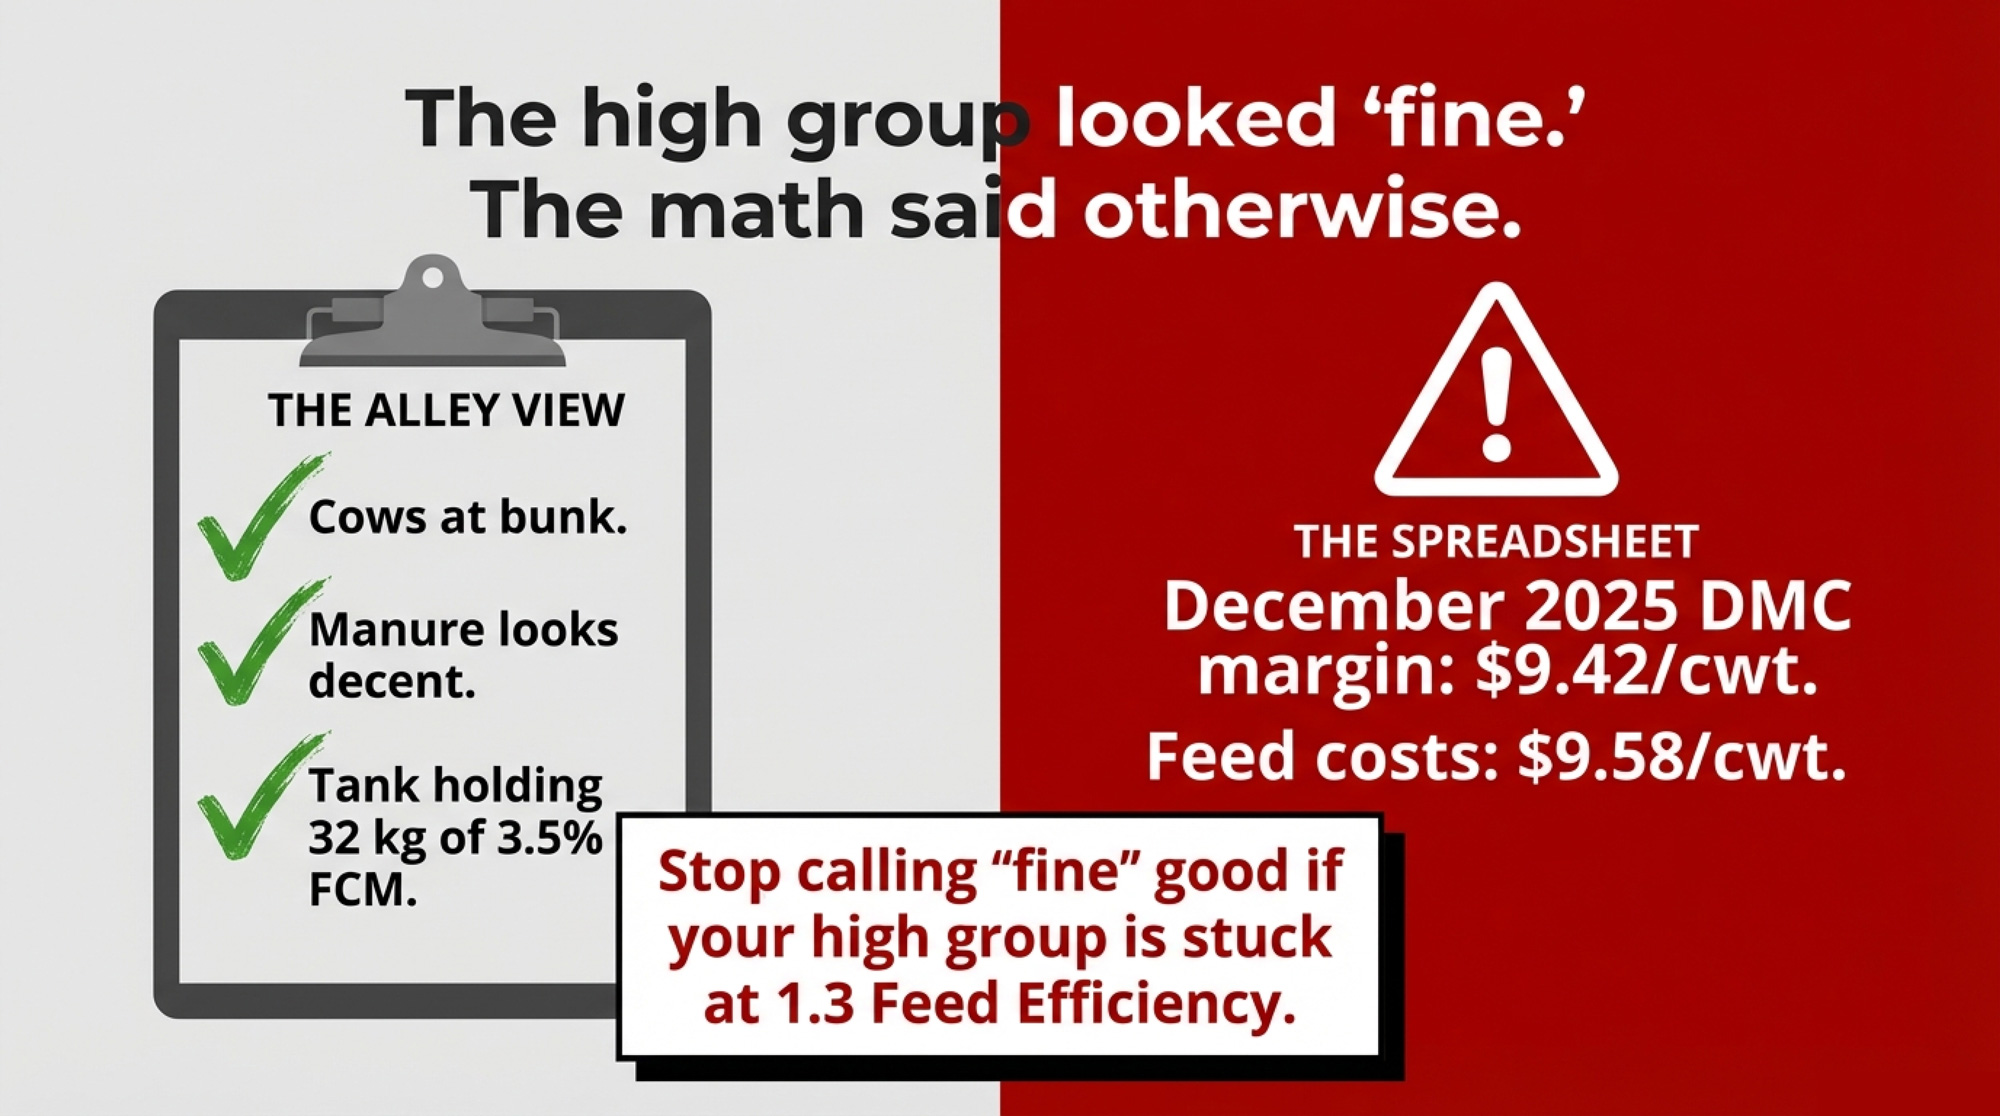
On a 300‑cow Holstein dairy in the U.S. Midwest, the high group looked fine. Cows were at the bunk, manure looked decent, and the tank was holding around 32 kg of 3.5% fat‑corrected milk per cow. Fine. But when feed costs climbed to roughly $0.33 per kilogram of dry matter — with corn in the $7–$7.60 per bushel range and soybean meal around $440 per ton in recent U.S. examples — “fine” stopped lining up with the milk cheque.
Then the December 2025 Dairy Margin Coverage (DMC) report landed: a national margin of $9.42 per hundredweight on a $9.58 per hundredweight feed‑cost component, the first and only DMC payment of the year. When the farm’s nutritionist pulled a week of feed tickets and ran the high‑group ration through the 2021 National Academies (NASEM) dairy model, the alley view and the spreadsheet didn’t match. The high group everyone called “fine” was quietly stuck at 1.3 feed efficiency — and the barn math said that number had a $64,000 price tag.
This isn’t one farm’s story — it’s a composite built from NASEM 2021 data, widely used feed‑efficiency benchmarks, USDA DMC numbers, and common bunk‑side patterns. The math is real. The herd is illustrative.
The $64,000 Feed Efficiency Leak
The nutritionist didn’t start with a software update. They started with a calculator.
Across extension and industry resources, feed efficiency for lactating cows is defined as energy‑ or fat‑corrected milk divided by dry matter intake — for example, 3.5% fat‑corrected milk (FCM) ÷ DMI. On this Midwest dairy, the high‑group numbers looked like this:
- 32 kg of 3.5% fat‑corrected milk.
- 24.5 kg of dry matter intake.
- FE = 32 ÷ 24.5 ≈ 1.3.
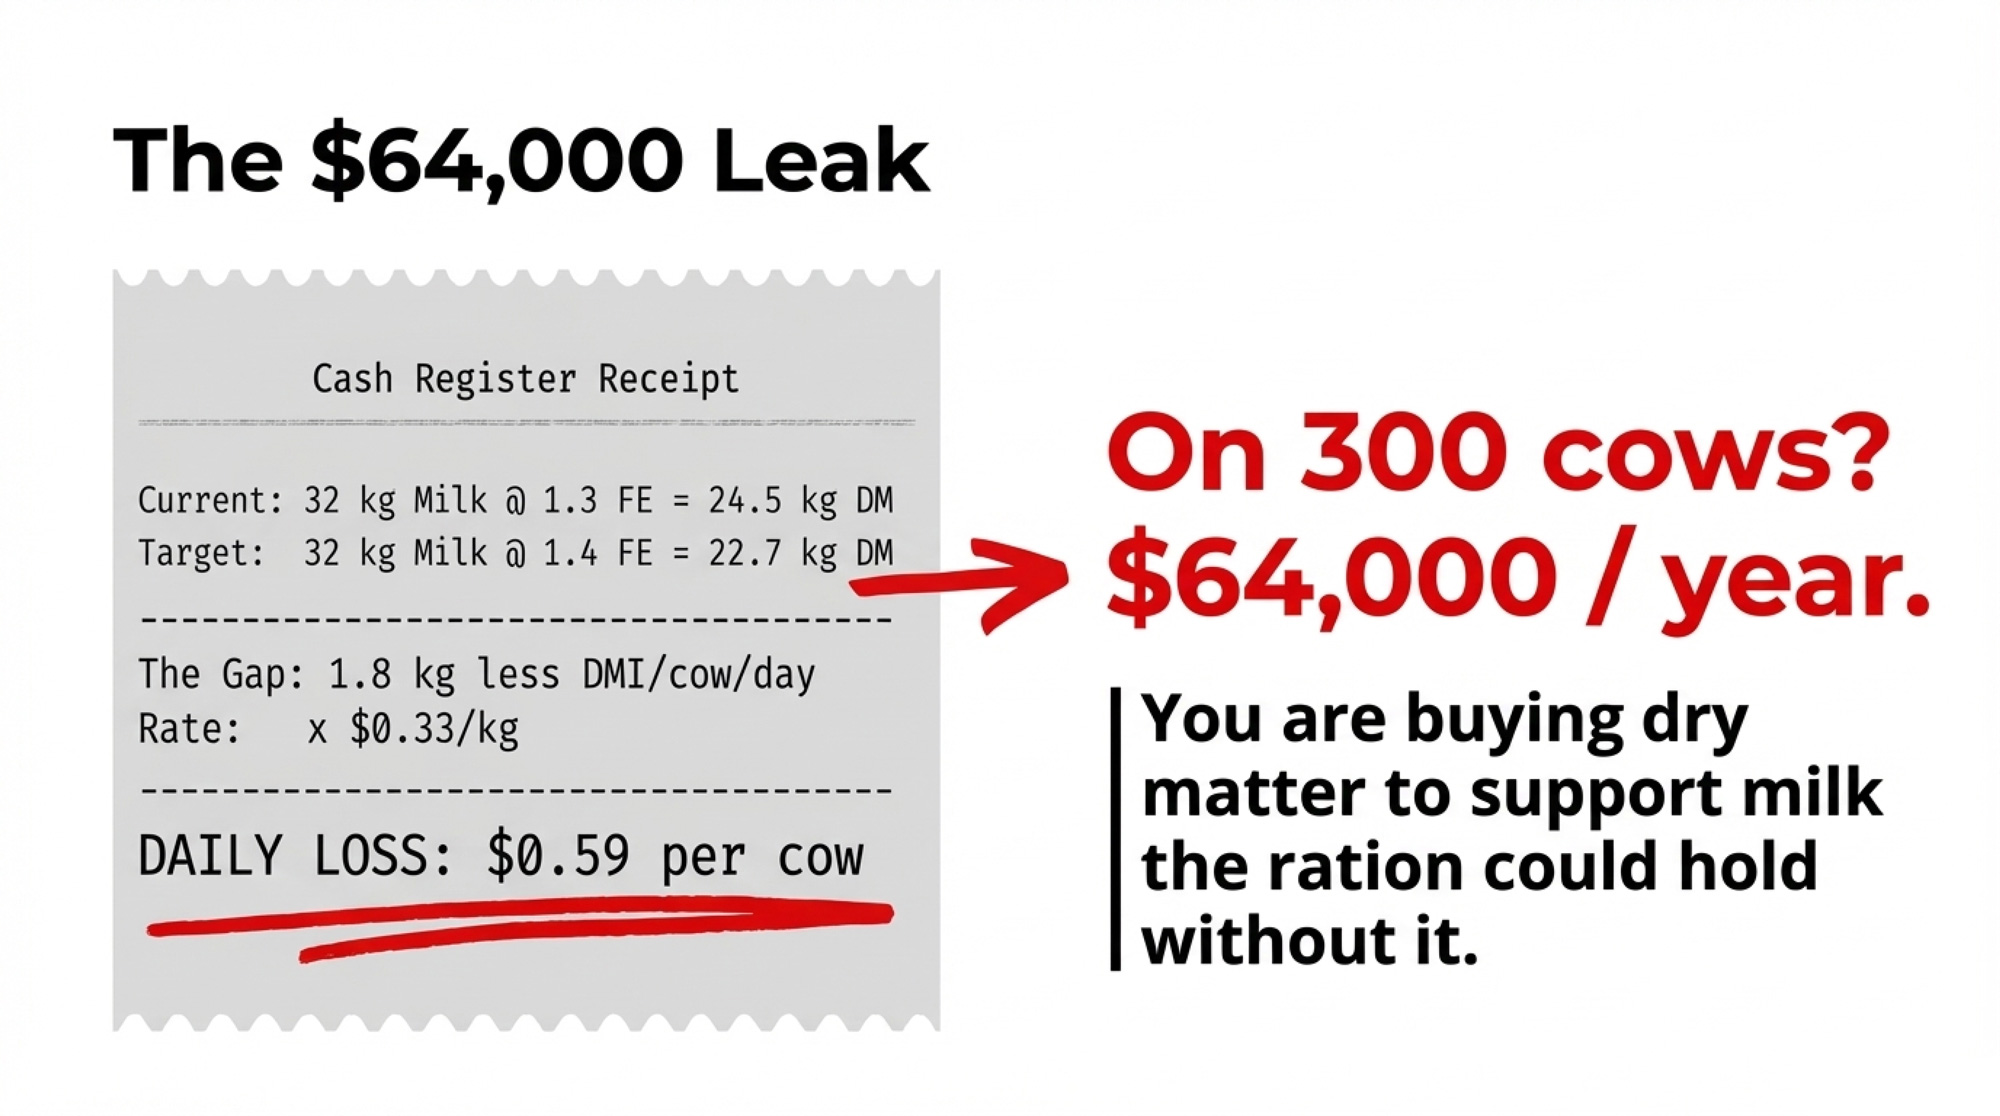
Using a dry‑matter cost of about $0.33 per kg, a very simple barn‑math exercise shows what a move from 1.3 to 1.4 feed efficiency would look like at the same milk:
- At 1.3 FE, cows eat 24.5 kg of dry matter per day.
- At 1.4 FE, they’d eat 22.7 kg to produce that same 32 kg of FCM.
- That’s 1.8 kg less DMI per cow per day.
- 1.8 kg × $0.33/kg ≈ = $0.59 per cow per day in feed cost.
On 300 cows, that’s roughly $64,000 per year in dry matter to support the exact same milk. In a year where DMC only paid once — December 2025, with that $9.58/cwt feed‑cost component and $9.42/cwt margin — that extra 1.8 kg of DMI per cow per day starts to look less like “cow comfort” and more like an overdraft.
In plain language, the high group was eating as much as the low group. The bank account didn’t care how “fine” it looked at the bunk.
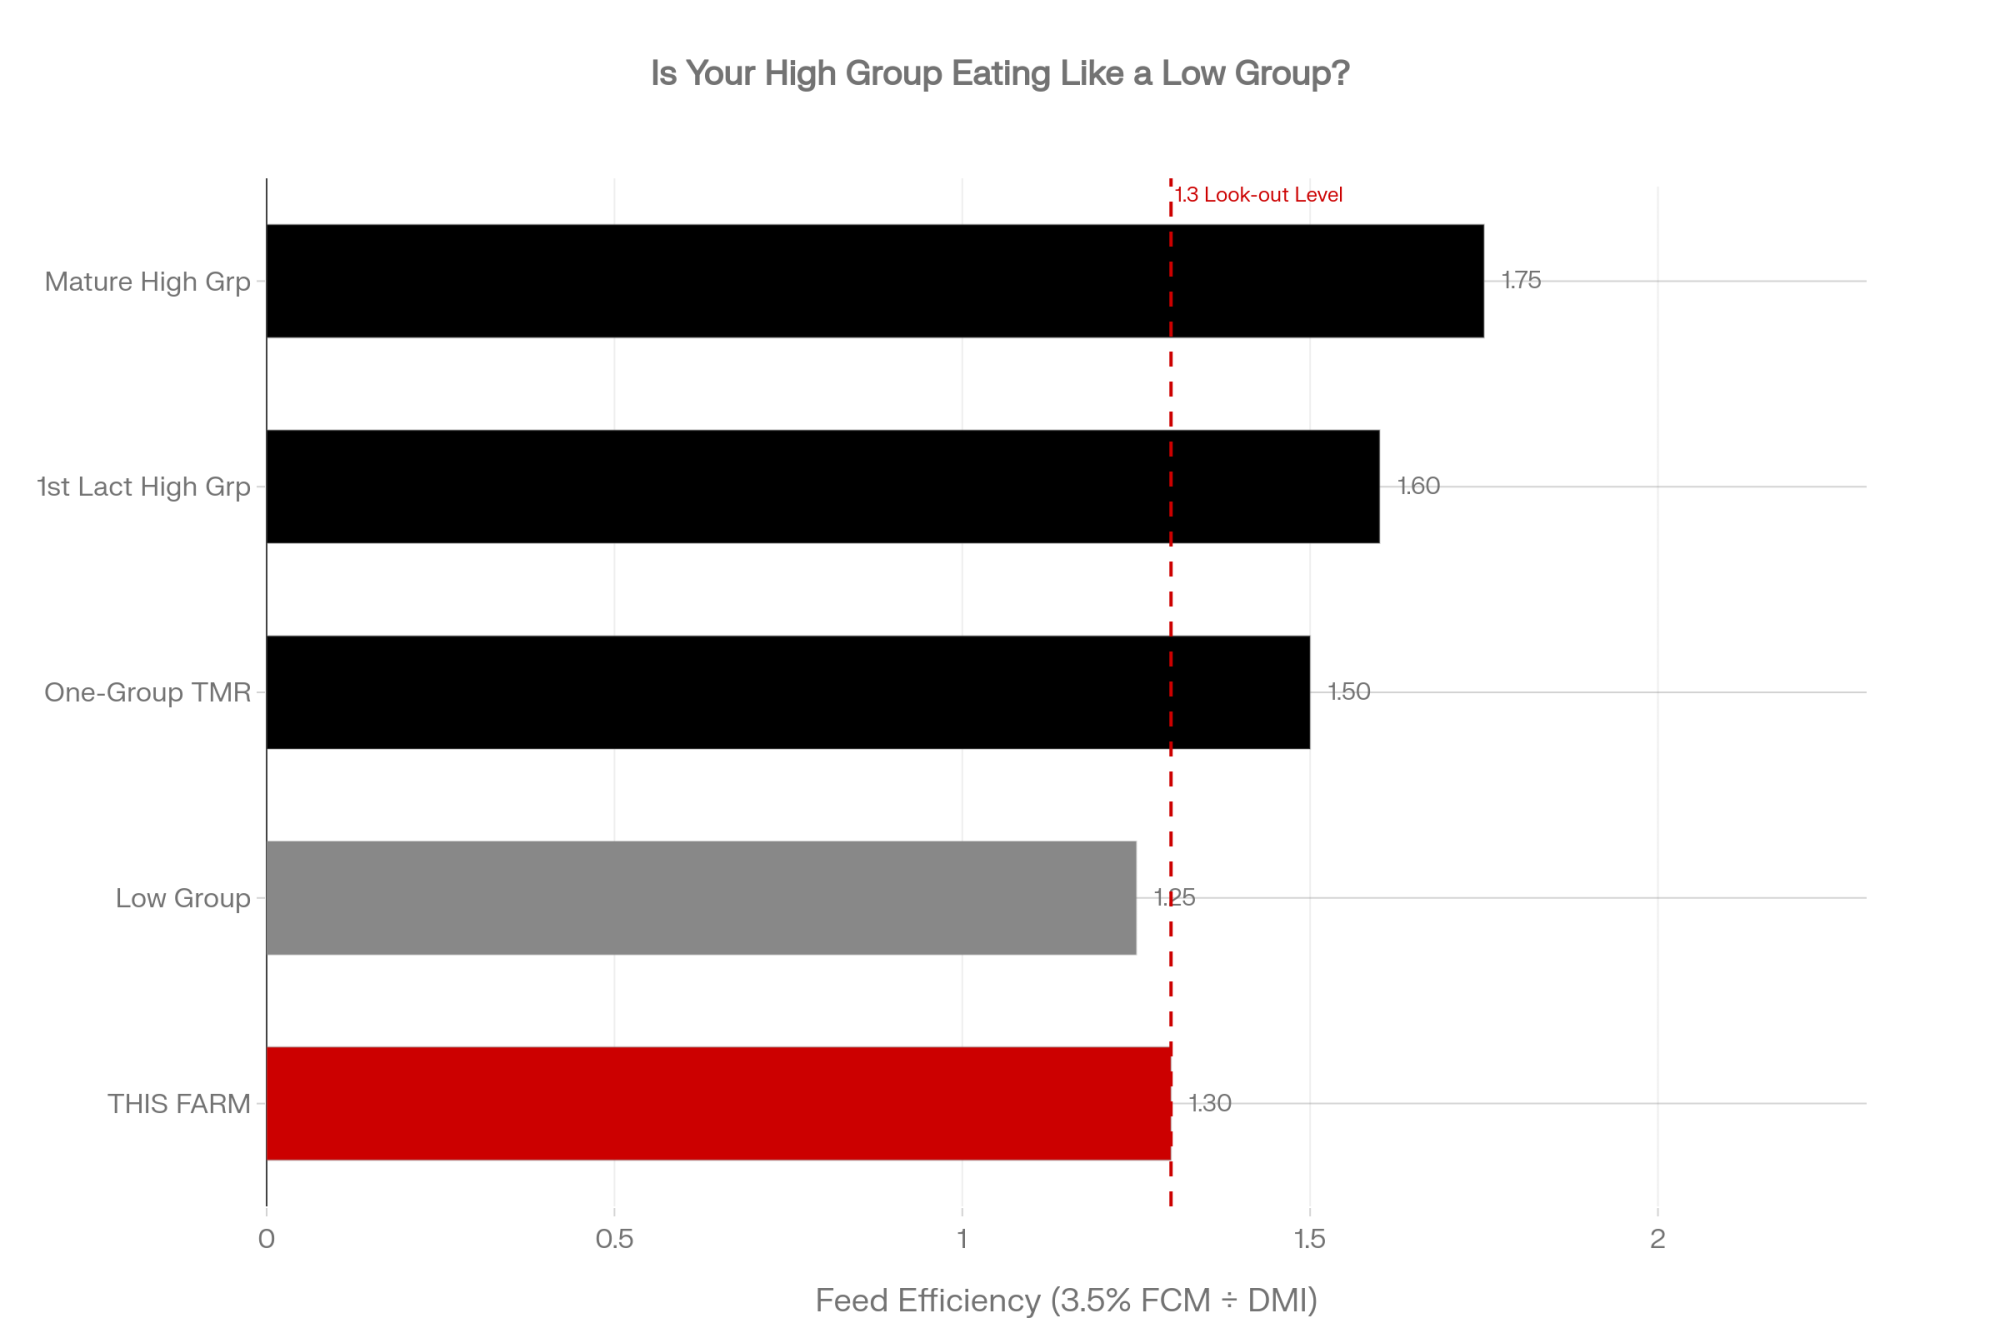
Is Your High-Group Eating Like a Low-Group?
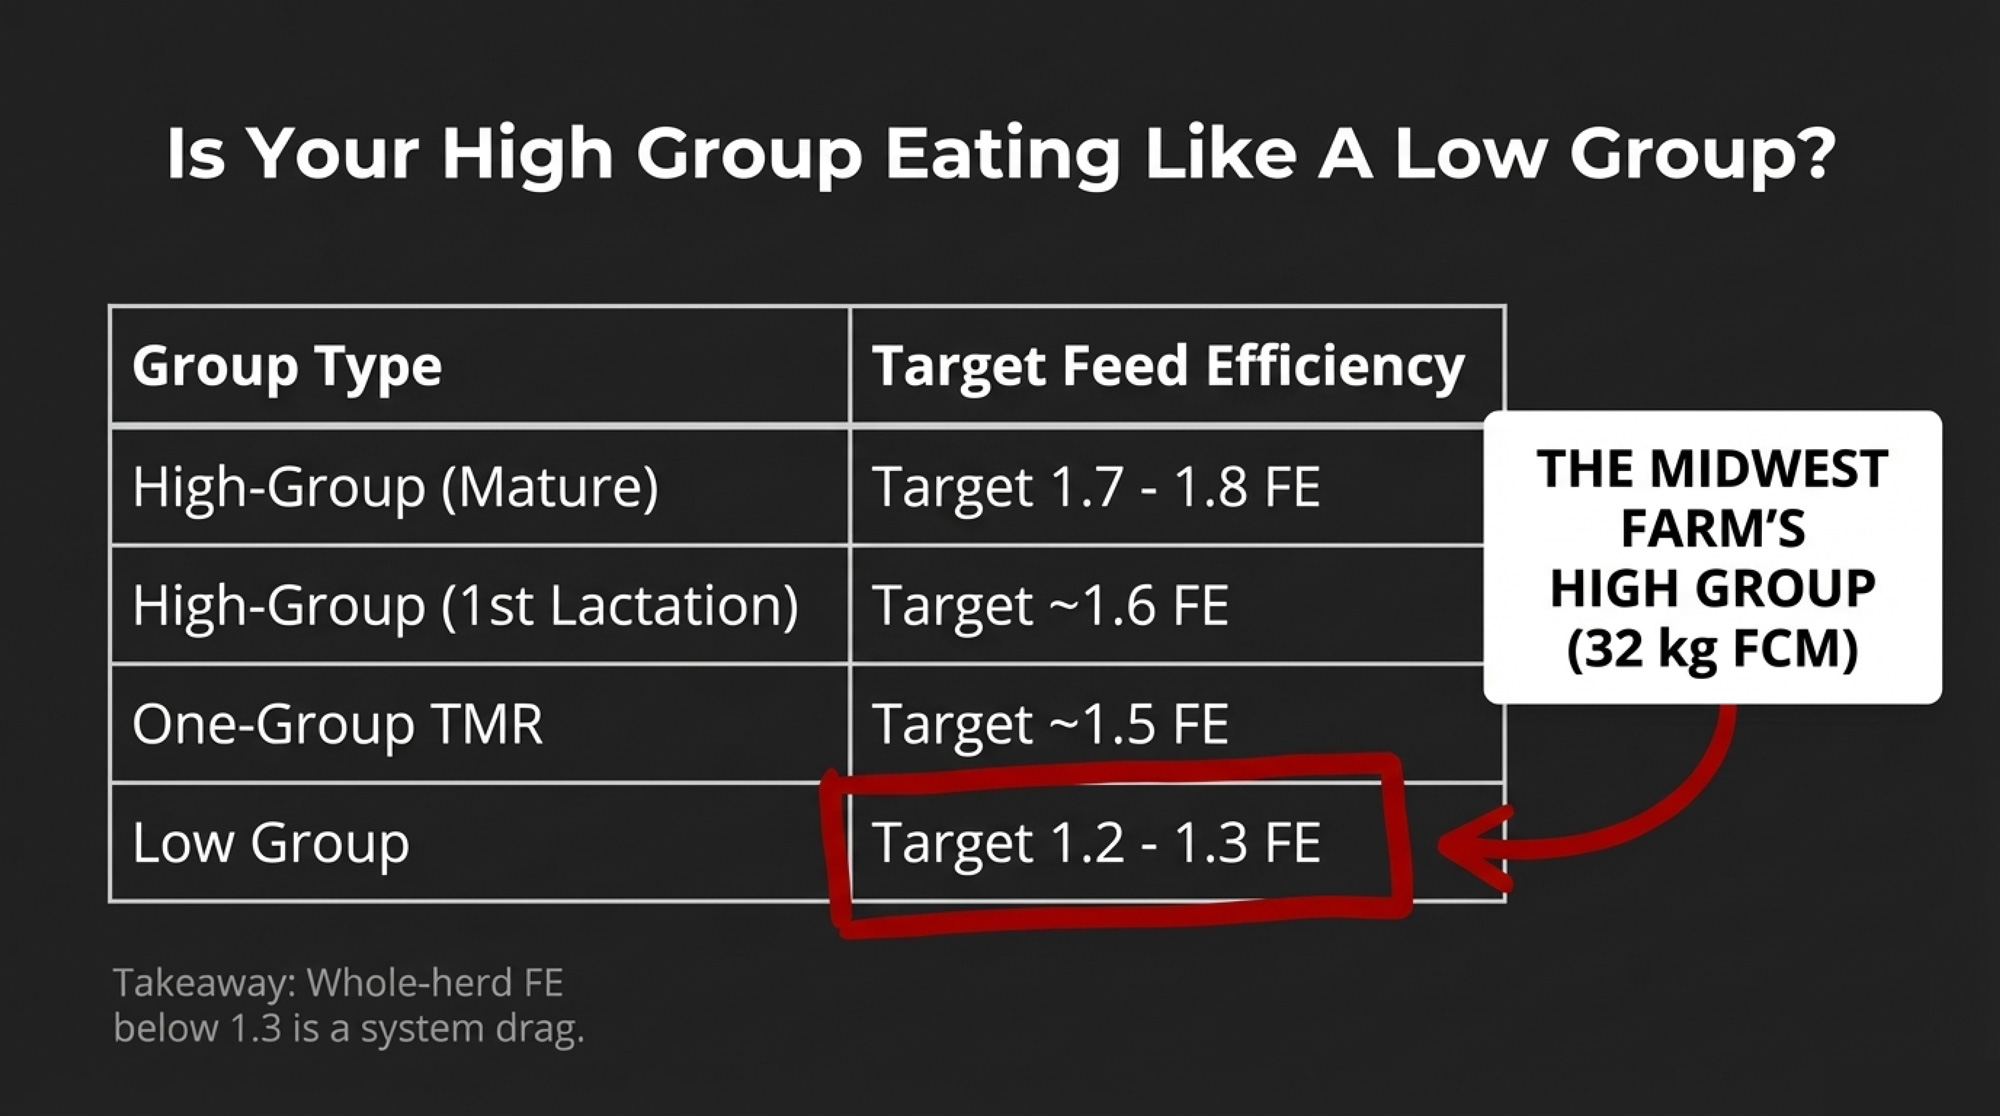
Recent extension and technical pieces report typical feed‑efficiency ranges for dairy cows of 1.3-1.8, depending on stage of lactation and grouping. Benchmarks commonly used on commercial Holstein herds look roughly like this:
- High‑group, mature cows: about 1.7–1.8 FE.
- High‑group, first‑lactation cows: around 1.6 FE.
- Low group: 1.2–1.3 FE.
- One‑group TMR herd: about 1.5 FE.
- Whole herd below 1.3 FE is generally a “look‑out” level — something in the system is dragging.
Tables from university and industry sources that relate milk yield to feed efficiency show the same pattern: as milk moves from the mid‑20s into the 30s and 40s (kg), FE typically rises into the mid‑1.4s and beyond. So a high group giving 32 kg at 1.3 FE is behaving more like a low group, at least on paper.
That’s where our composite Midwest dairy found itself: buying an extra 1.8 kg of dry matter per cow per day for milk that the ration should have been able to support without it.
The first 30‑day job on that farm was straightforward and a bit uncomfortable:
- Pull a week of pen‑level milk and convert to 3.5% FCM.
- Weigh actual DMI, refusals included.
- Write the feed‑efficiency number on the whiteboard in every pen.
- Stop calling “fine” good if the high group started with 1.3.
If you did the same thing on your farm this week, what number would you be staring at?
The NASEM Shift: Why Feeding to 2001 Costs You in 2026
Plenty of solid rations in North America were built around NRC 2001 assumptions and then tuned over time. In late 2021, the National Academies released the updated “Nutrient Requirements of Dairy Cattle” — often referred to as NASEM 2021 — with new equations for intakes, energy, protein, and minerals.
The new volume runs 482 pages and introduces an updated model that many nutritionists now use to compare rations with current research. The ingredients in this Midwest ration didn’t change. The math underneath them did.
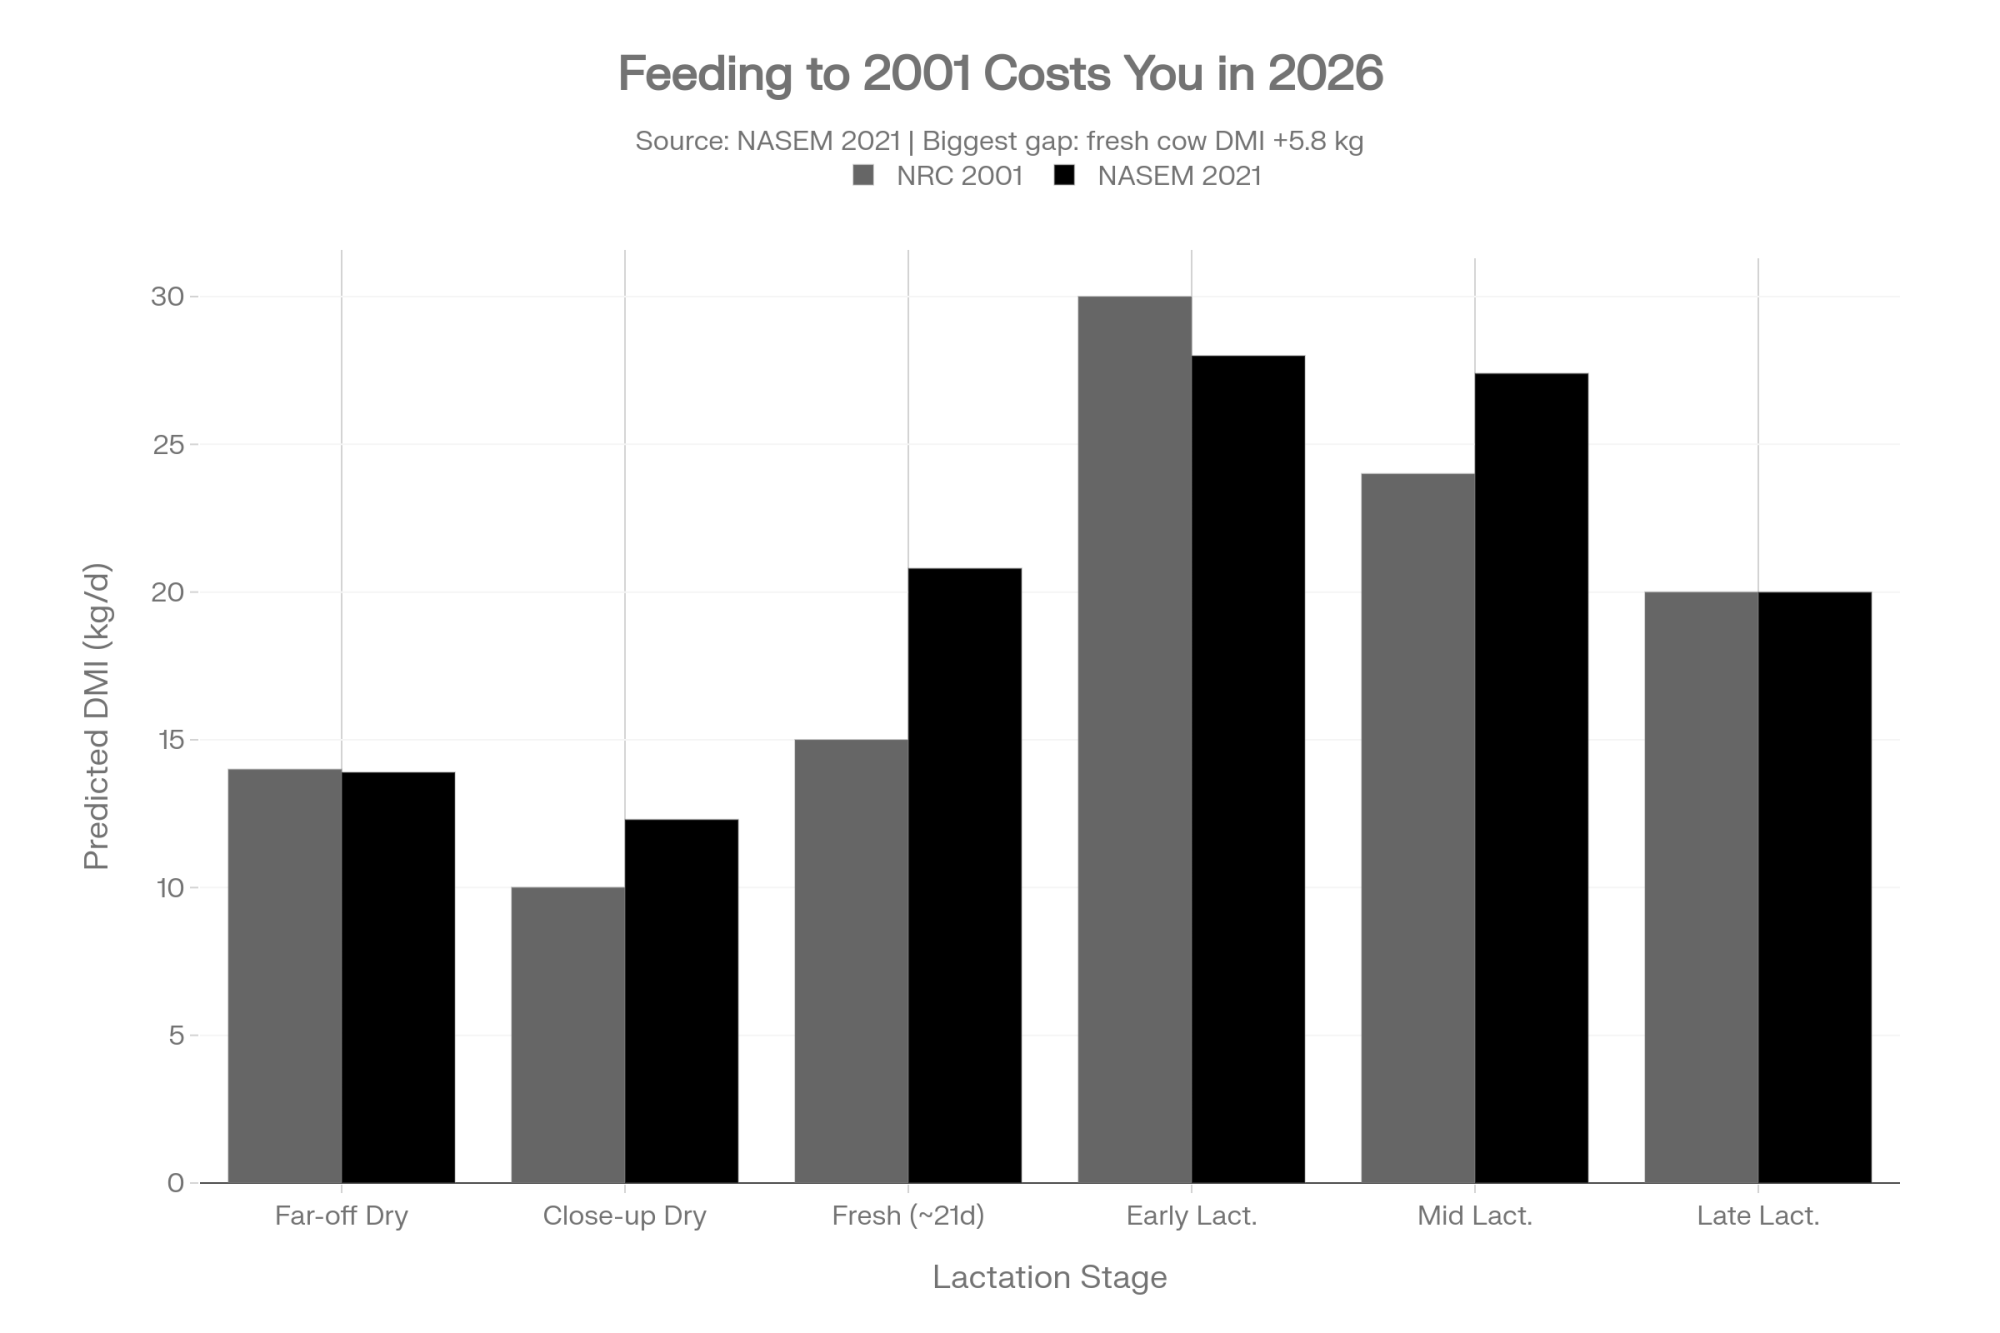
On dry matter intake for a 680‑kg Holstein, the 2021 model makes three big changes relative to the old 2001 book:
- Predicted DMI for high‑producing cows is about 2 kg lower.
- Predicted DMI for low‑producing cows is about 1 kg higher.
- The reduced DMI “penalty” in early lactation shrinks from roughly 90 days to 31 days.
Example guideline tables for a 680‑kg Holstein show how the targets move:
| Stage | 2001 DMI (kg) | 2021 DMI (kg) | 2001 Milk (kg) | 2021 Milk (kg) |
| Far‑off dry | 14.0 | 13.9 | – | – |
| Close‑up dry | 10.0 | 12.3 | – | – |
| Fresh (≈21 d) | 15.0 | 20.8 | 35 | 33 |
| Early lactation | 30.0 | 28.0 | 55 | 55 |
| Mid lactation | 24.0 | 27.4 | 35 | 43 |
| Late lactation | 20.0 | 20.0 | 25 | 25 |
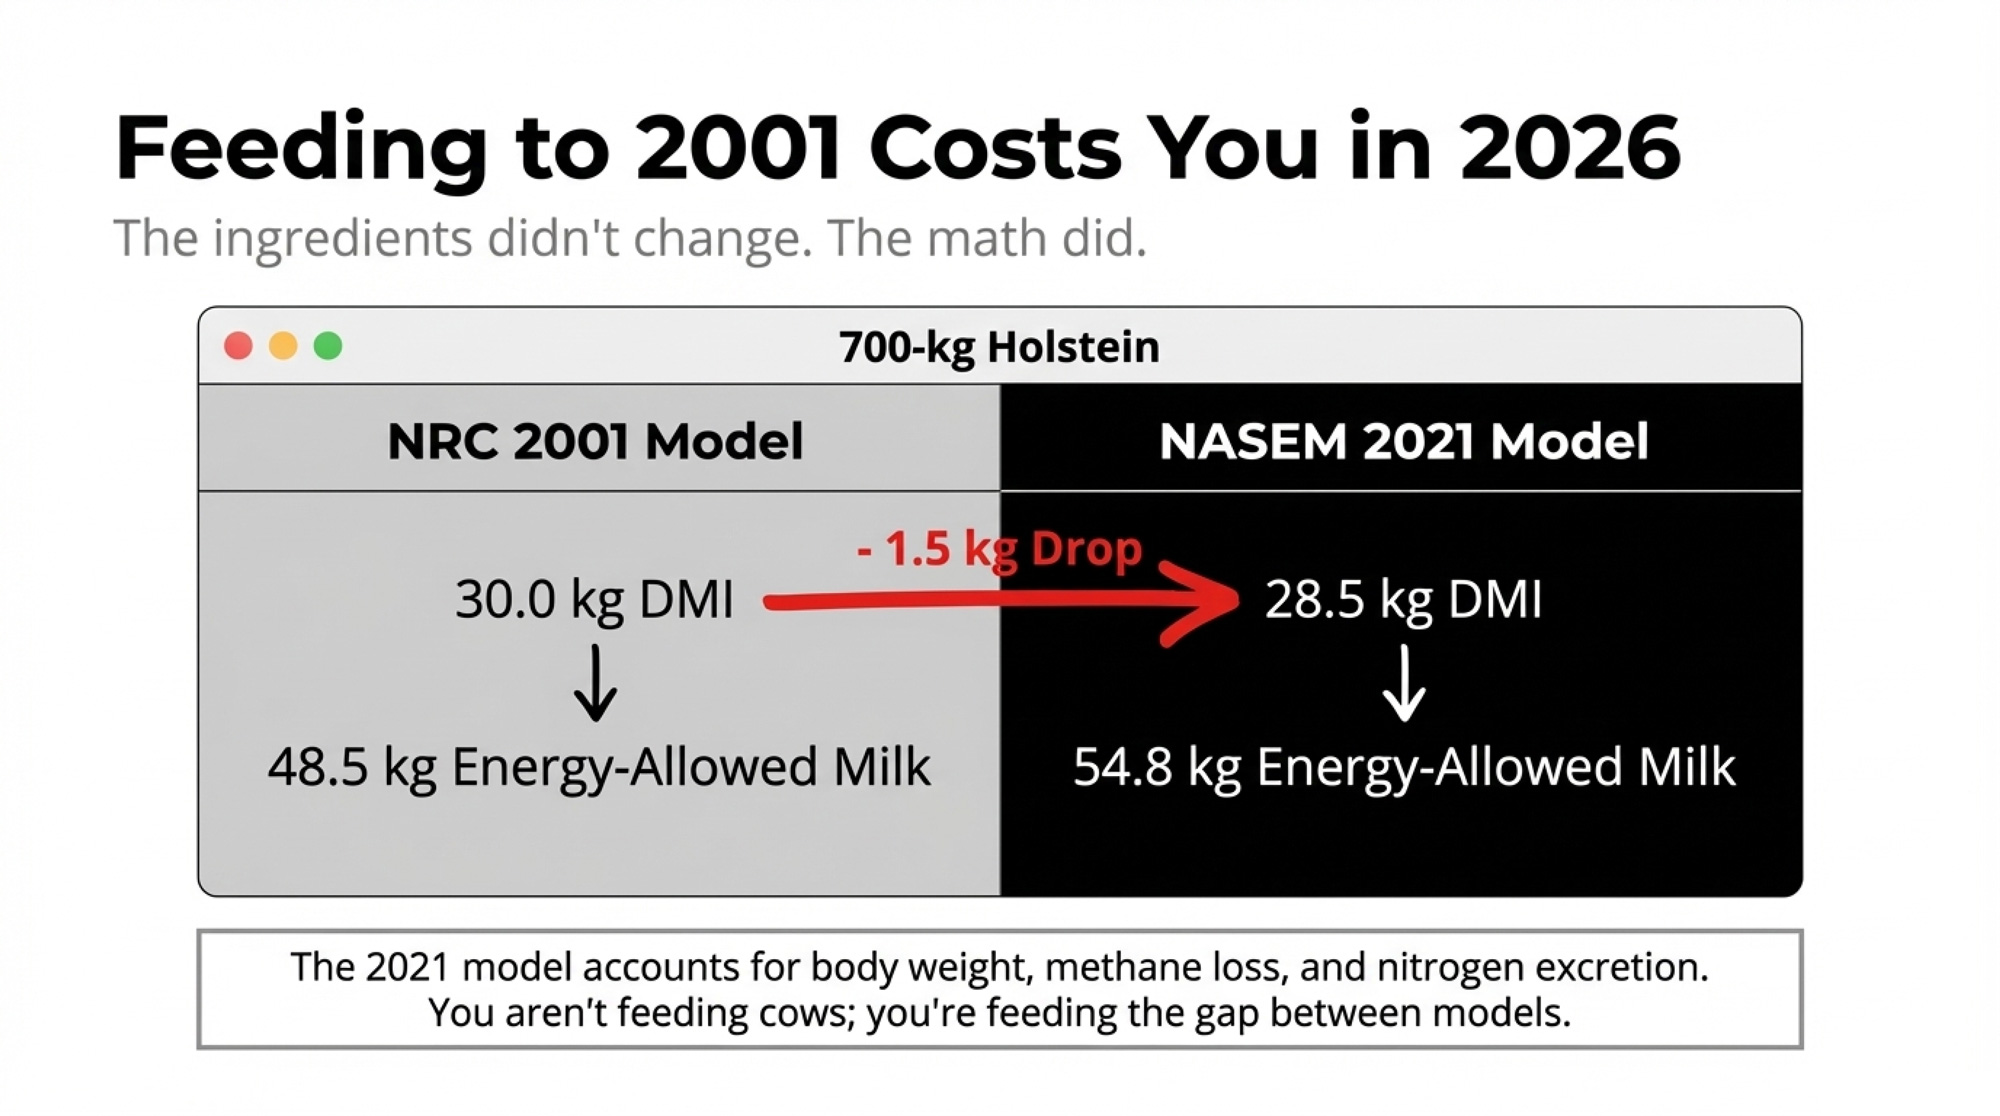
When a typical high‑cow ration (corn silage, haylage, shelled corn, cottonseed, soybean meal, by‑products) is run through both models for a 700‑kg Holstein, the comparison often looks something like this:
| Item | NRC 2001 | NASEM 2021 |
| DMI (kg) | 30.0 | 28.5 |
| Net energy (Mcal/kg) | 1.66 | 1.81 |
| Energy‑allowed milk (kg) | 48.5 | 54.8 |
The newer model doesn’t create energy out of thin air — it changes how it discounts the energy you already bought.
In particular, the 2021 equations:
- Discount energy based on percent of body weight, not just multiples of maintenance.
- Explicitly subtract energy lost as methane, calculated from digestible NDF.
- Include the energy cost of excreting excess nitrogen, at about 14.3 Kcal per gram of nitrogen.
For our composite Midwest dairy, plugging the existing ration into the 2021 model was a wake‑up call. The model said the energy density was there to support the current milk on slightly lower DMI. Their high group was still eating 24.5 kg and stuck at 1.3 FE. In other words, they weren’t just feeding cows. They were feeding the gap between 2001 and 2021.
Bunk Management: Where Energy Walks Out the Back of the Cow
When the numbers don’t match, you don’t start with a new product. You start at the bunk.
The 2021 model treats starch as a separate nutrient and assumes a default digestibility of around 91%, replacing older NFC groupings with residual organic matter (ROM). That matters when you look at how your corn is processed, not just what the lab sheet says.
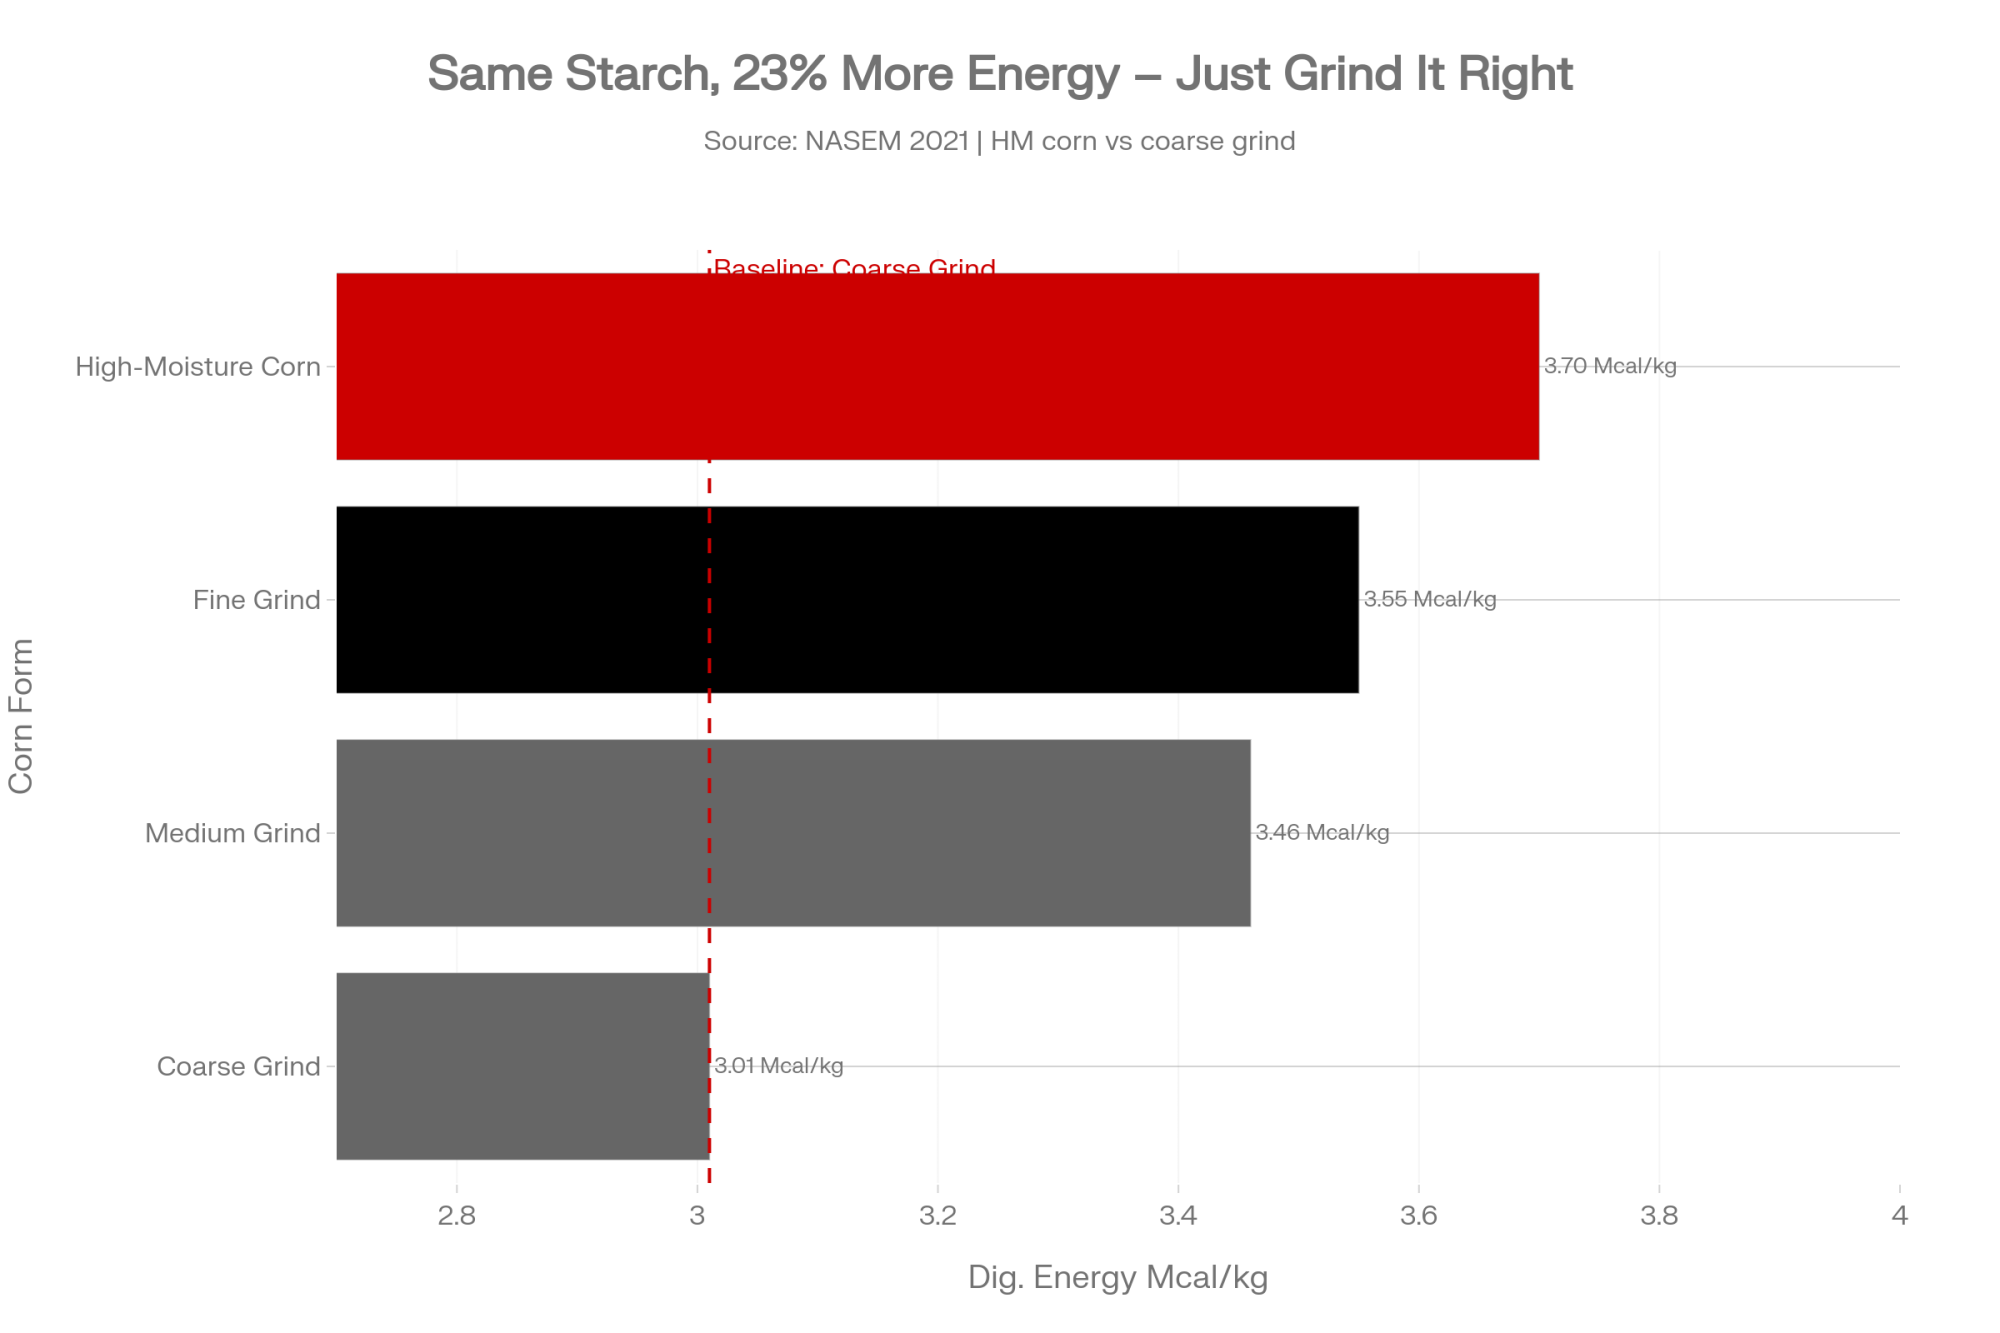
Example comparisons of shelled corn forms show the impact on digestible energy:
| Feed ingredient | Digestible energy (Mcal/kg) | Starch (%) |
| Shelled corn, coarse grind | 3.01 | 70.4 |
| Shelled corn, medium grind | 3.46 | 70.4 |
| Shelled corn, fine grind | 3.55 | 70.4 |
| High‑moisture corn (28% DM) | 3.70 | 70.9 |
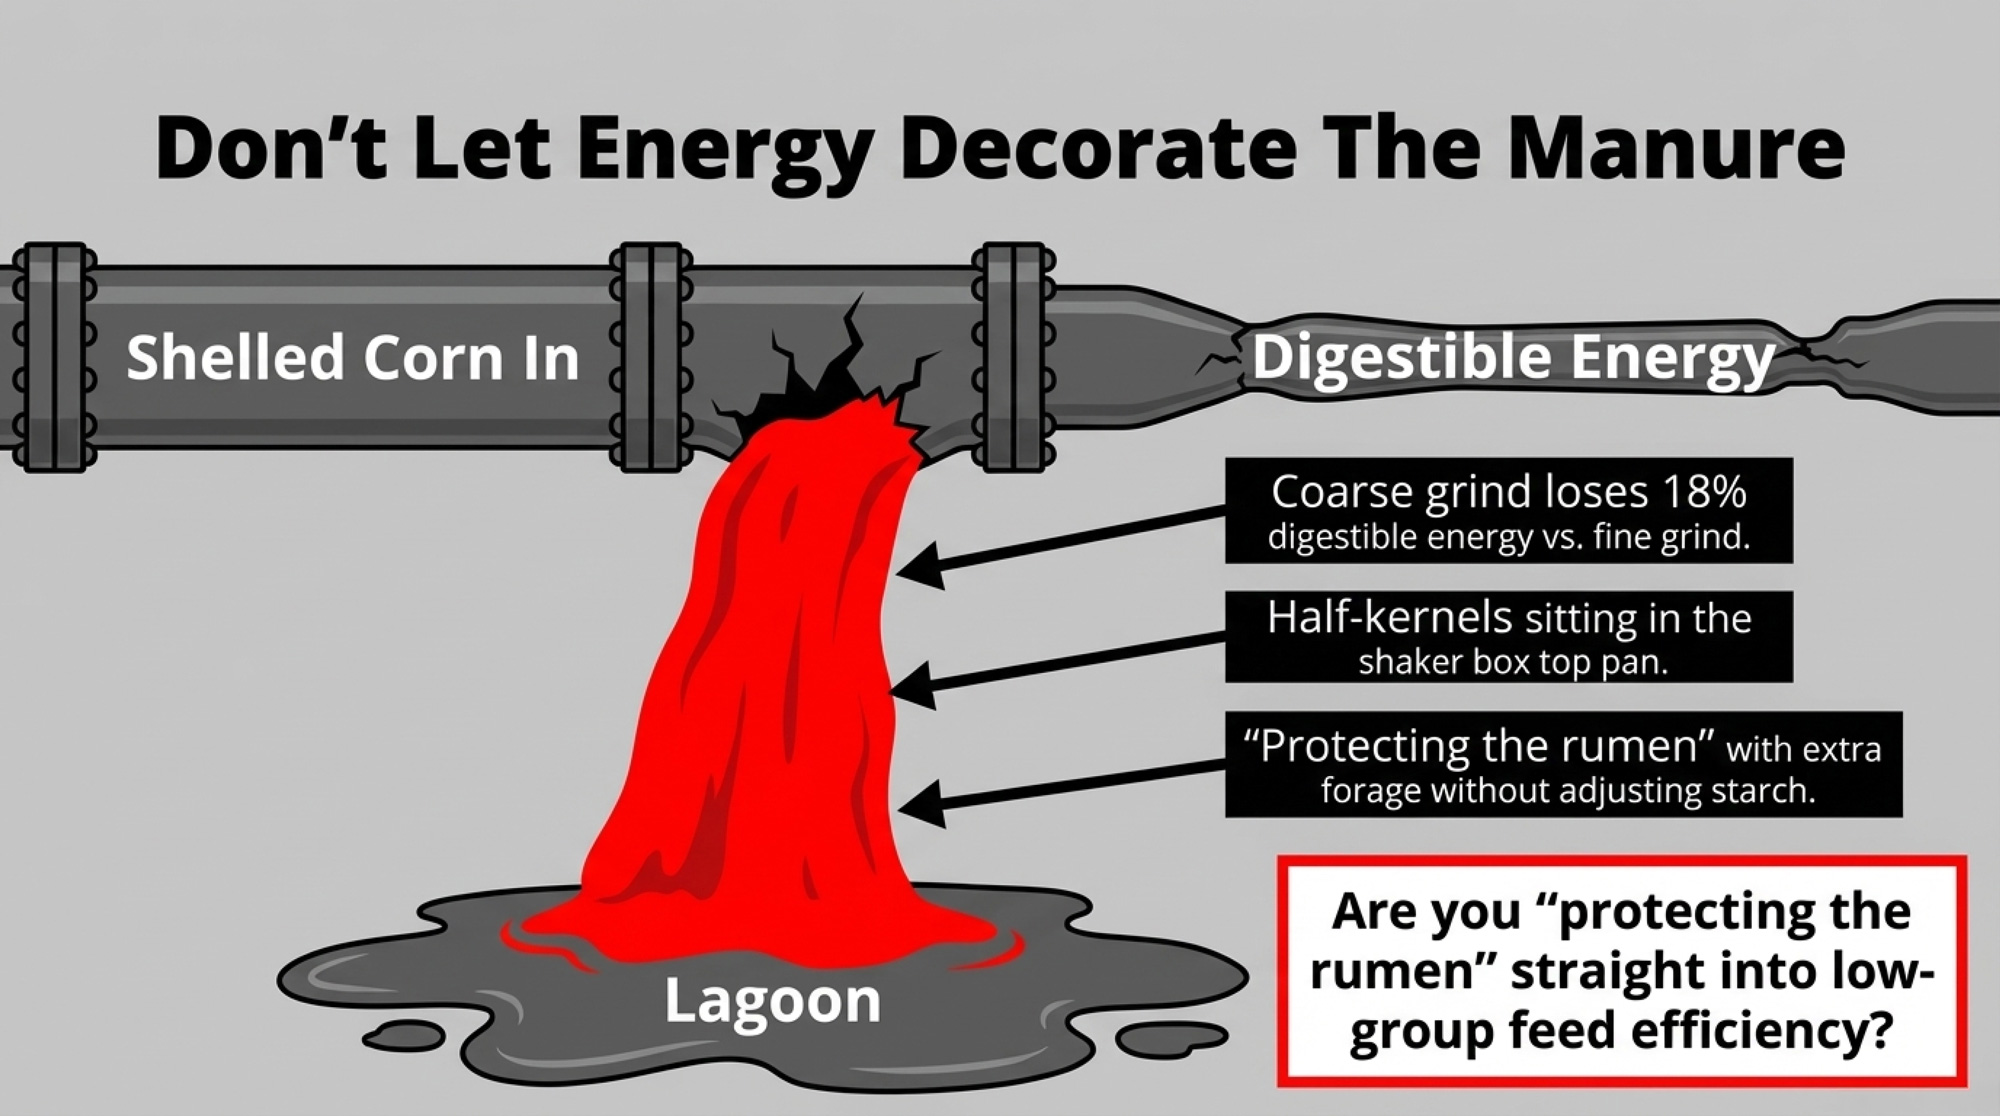
Same starch. More usable energy. A kilo of fine‑ground corn carries roughly 18% more digestible energy than coarse‑ground, with high‑moisture corn a bit higher again.
On this composite farm, the bunk and manure told a familiar story:
- Half- and whole-kernel seeds are sitting in the top pan of the shaker box.
- Shiny, intact corn pieces in manure.
- Extra forage pushed into the ration when corn got expensive, in the name of “protecting the rumen.”
To stop guessing, they set their numbers against a commonly used forage‑NDF/starch guide for high‑producing Holsteins:
| Minimum forage NDF (%) | Minimum total NDF (%) | Maximum starch (%) |
| 19 | 25 | 30 |
| 18 | 27 | 28 |
| 17 | 29 | 26 |
| 16 | 31 | 24 |
| 15 | 33 | 22 |
Drop forage NDF because drought hammered corn silage or hay is pricey, and you can’t keep starch high without flirting with sub‑acute rumen acidosis. Practical levers many nutritionists use:
- If forage NDF has to come down, either add by‑product NDF (soy hulls, corn gluten feed, citrus pulp, beet pulp) or pull starch back.
- If chop length is shorter and starch is “fast,” raise your forage‑NDF minimum.
- Buffers and higher DMI give some room to lower forage NDF, but not limitless room to do so.
- If cows slug‑feed in robots or parlours, or you’re overcrowded at the bunk, you need more forage NDF, not less.
On this composite Midwest dairy, the bunk‑side to‑do list looked like this:
- Tighten corn processing so the energy you’re paying for doesn’t show up in the lagoon.
- Bring in targeted by‑product NDF to support rumen fill and chewing.
- Trim ration starch a couple of points once corn is actually disappearing, not decorating manure.
- Fix overcrowding so cows aren’t slug‑feeding and sorting.
The aim was simple: move feed efficiency from 1.3 toward 1.4+ without exploding lameness, cows off feed, or vet bills.
Are You Buying Supplements — or Making Donations?
Once starch and NDF were under control, the next question was what all those fat and amino‑acid products were actually doing.
Modern ration models, including NASEM 2021, track fatty acids in more detail and group lipids into multiple categories with different digestibilities; basal oils from feeds like corn and corn silage are often modeled at around 70–75% digestibility. The model also reflects what recent research has shown: fat doesn’t generate methane, and polyunsaturated fatty acids (PUFAs) can reduce methane from other nutrients. And unlike older approaches, added fat isn’t automatically hit with a DMI penalty in the equations, especially in early lactation.
On paper, that makes it tempting to think rumen‑protected fats and amino acids are always a good buy. The economics don’t always cooperate.
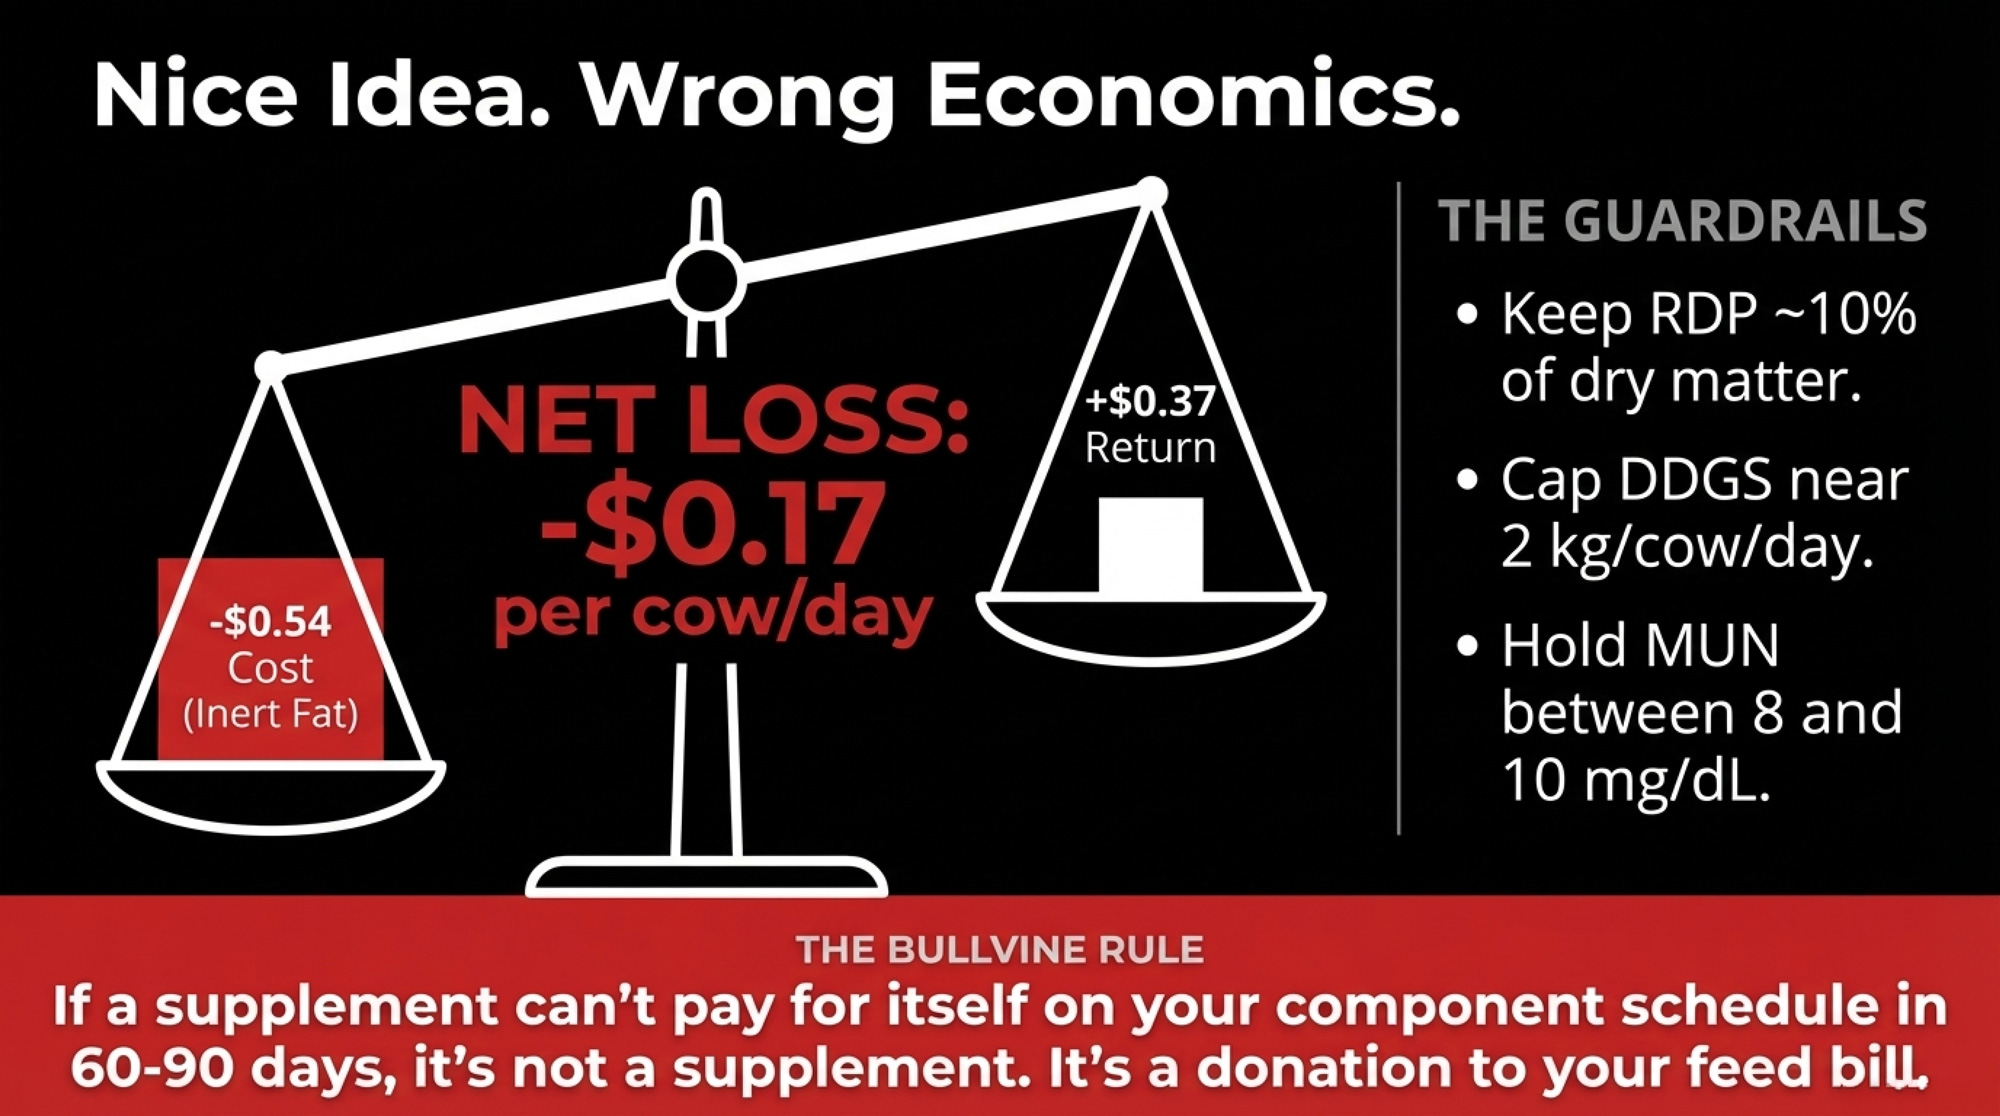
A typical on‑farm example for inert fat looks like this:
- 0.30 kg of an inert fat product costs about $0.54 per cow per day.
- The milk and milk‑fat response brings back about $0.37 per cow per day.
- Net: roughly −$0.17 per cow per day.
Working guidelines used in many high‑cow programs:
- Raw or extruded soybeans: up to 1 kg/cow/day.
- Roasted/cracked soybeans: up to 2 kg/cow/day.
- Fuzzy cottonseed: up to 2 kg/cow/day.
- Distillers grains: about 2 kg/cow/day.
- Keep PUFAs under about 500 g/cow/day and RUFAs around 700 g/cow/day.
On the protein side, the 2021 model predicts milk protein from a set of key amino acids and generally points toward RDP around 10% of dry matter as an efficient target, with caution about going much past 12%. Fresh‑cow programs aiming at around 17.5% crude protein with roughly 10% RDP and 7.5% RUP, while holding milk urea nitrogen (MUN) between 8 and 10 mg/dL, are common in both research and field practice.
For our composite Midwest herd, that turned into a very blunt filter:
- Rumen‑protected methionine or lysine stayed in only if the model clearly showed those amino acids as limiting, and the milk cheque actually rewarded more protein.
- DDGS were capped near 2 kg/cow/day to stay inside fat and amino‑acid guardrails.
- Inert fat for fresh cows was judged by its impact on feed efficiency, ketosis, and pregnancy, not just by model output or fat test results.
If a product costs $0.54 and your numbers say it only brings back $0.37, it’s not acting like a supplement — it’s a donation to your input costs. If it can’t pay for itself on your component schedule within 60–90 days, it probably belongs in the “nice idea, wrong economics” pile.
| Supplement Type | Typical Cost/Cow/Day | Typical Return/Cow/Day | Net ROI | Verdict |
|---|---|---|---|---|
| Inert bypass fat (0.30 kg) | $0.54 | $0.37 | $-0.17 | ❌ Donation |
| Rumen-protected Met (justified by model) | $0.18–$0.22 | $0.25–$0.40 | +$0.05 to +$0.18 | ✅ Keep if model confirms limitation |
| Raw/extruded soybeans (≤1 kg/d) | $0.15–$0.22 | $0.20–$0.30 | +$0.05 to +$0.10 | ✅ Efficient fat + protein source |
| DDGS (>2 kg/d cap exceeded) | $0.10–$0.14 | Diminishing return above cap | $0.00 to -$0.08 | ⚠️ Cap at 2 kg; beyond that, fat/AA guardrails break |
| Fuzzy cottonseed (≤2 kg/d) | $0.18–$0.25 | $0.22–$0.32 | +$0.04 to +$0.08 | ✅ When fat budget allows |
| Buffer/NDF support (soy hulls, beet pulp) | $0.08–$0.12 | Indirect: fewer health events, steadier DMI | Positive when FE improves ≥0.05 | ✅ Structural, not optional |
The Blind Spot: Water, Minerals, and What the Model Can’t See
| Water Contaminant | Safe Level | Watch Level | ⚠️ Action Level | Dairy Impact |
|---|---|---|---|---|
| Iron (Fe) | <0.3 mg/L | 0.3–1.0 mg/L | >1.0 mg/L | Blocks copper & zinc absorption; off-taste reduces intake |
| Manganese (Mn) | <0.05 mg/L | 0.05–0.2 mg/L | >0.2 mg/L | Depresses intake; competes with copper |
| Sulfate (SO₄) | <500 mg/L | 500–1,000 mg/L | >1,000 mg/L | Reduces milk fat; elevates Se/Vit E/Cu requirements |
| Molybdenum (Mo) | <0.5 mg/L | 0.5–2.0 mg/L | >2.0 mg/L | Severely blocks copper; can cause scours in high-forage herds |
| Total Dissolved Solids | <1,000 mg/L | 1,000–3,000 mg/L | >3,000 mg/L | Reduced palatability; lower voluntary water intake |
| Nitrate-N | <10 mg/L | 10–20 mg/L | >20 mg/L | Interferes with oxygen transport; heat stress magnifies risk |
The last place this farm looked was the one even the best ration model can’t see: water.
NASEM 2021 updates macro‑minerals by basing them on absorbed amounts, using absorption coefficients for most elements except sulfur, iodine, and a few others. Common guideline tables for lactating Holsteins look like this:
| Mineral | NASEM 2021 (%) | NRC 2001 (%) | Extension guideline (%) |
| Calcium | 0.64 | 0.60 | 0.70 |
| Phosphorus | 0.39 | 0.38 | 0.38 |
| Magnesium | 0.18 | 0.21 | 0.30 |
| Sodium | 0.23 | 0.22 | 0.40 |
| Potassium | 1.10 | 1.07 | 1.20 |
| Chloride | 0.20 | 0.29 | 0.30 |
| Sulfur | 0.20 | 0.20 | 0.25 |
Because the model doesn’t set explicit DCAD targets for heat stress, many field programs push heat‑stress rations toward about 1.6% potassium and 0.5% sodium of dry matter for high‑producing cows.
Trace‑mineral recommendations for lactating cows typically include: cobalt 0.2 ppm, copper 10 ppm, iodine 0.4–0.5 ppm, iron 20–25 ppm, manganese 30–35 ppm, selenium 0.30 ppm (regulatory cap), and zinc 60–70 ppm. But the model has big blind spots:
- It doesn’t account for antagonists such as iron, sulfur, or molybdenum from water.
- It doesn’t assign absorption advantages to organic trace minerals.
- It doesn’t address chromium directly, even though research suggests potential milk and health benefits in some situations.
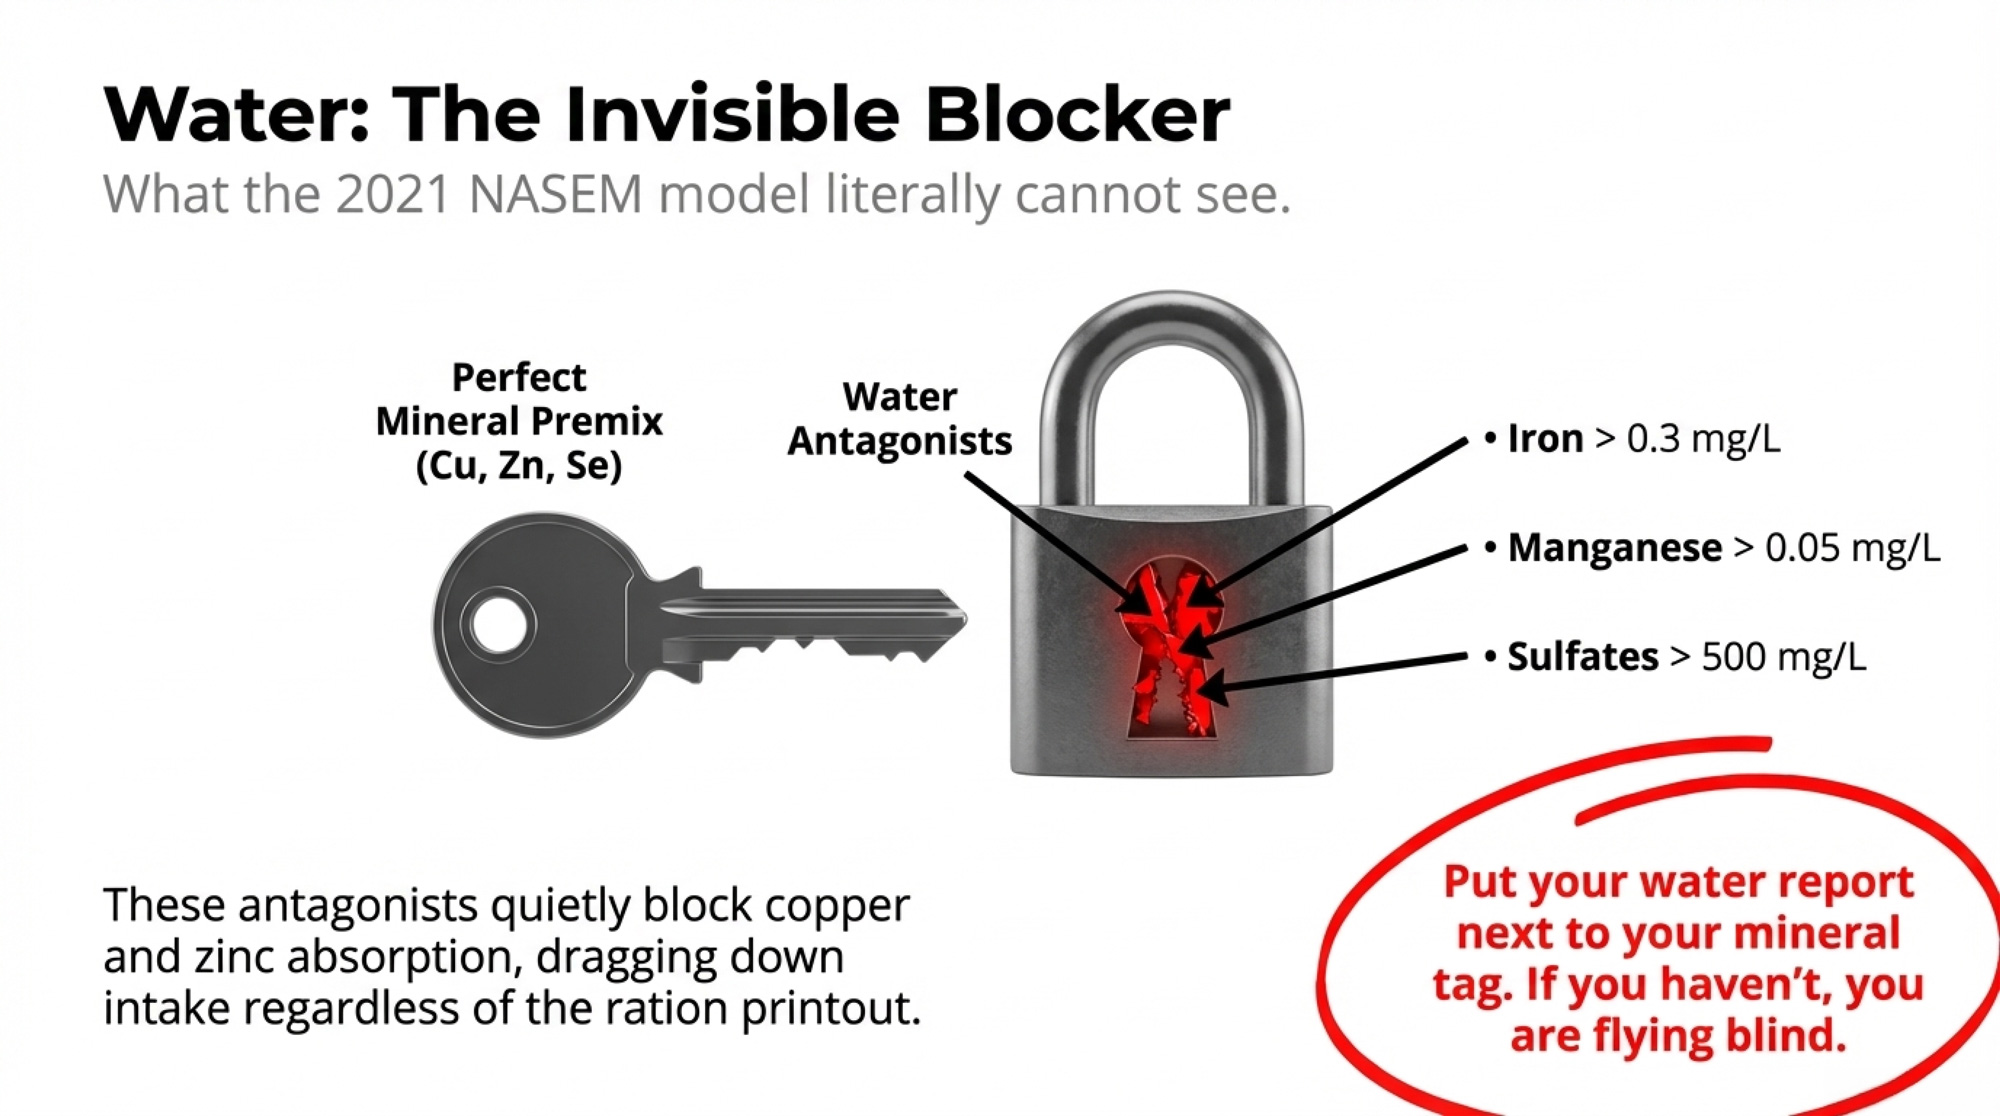
That’s where water quality steps in. Penn State Extension’s 2024 guidance flags iron and manganese as the most common water‑related culprits for reduced intake and milk production in Pennsylvania herds, with iron levels above 0.3 mg/L and manganese above 0.05 mg/L enough to create off‑tastes that cut intake and production. Elevated sulfatelevels (over 500–1,000 mg/L) have been linked to reduced milk fat and increased requirements for selenium, vitamin E, and copper.
For our composite Midwest dairy, that turned into one more lab report on the kitchen table: a full water test, not just a quick strip check. With actual iron, sulfur, manganese, and molybdenum numbers in hand, they could decide whether to push trace‑mineral levels, change mineral forms, treat water, or leave a program that’s working alone.
If you’ve never put your water report beside your mineral tag and ration printout, you’re asking a model to solve a problem it literally can’t see.
What This Means for Your Operation
- In the next 30 days, calculate feed efficiency by pen. Pull a week of data, convert milk to 3.5% FCM, weigh actual DMI (refusals included), and divide. If your mature‑cow high group is under about 1.7 FE, your first‑lactation high group under 1.6, or your one‑group herd under 1.5, you’re likely feeding into the same 1.3‑level leak this composite herd showed — especially when the only DMC payment in 2025 came at a margin of $9.42/cwt on $9.58/cwt feed costs.
- Within 90 days, sit down with your nutritionist and run your current ration through NASEM 2021. Keep your cow weights and ingredients the same, and compare the old vs. 2021 assumptions for predicted DMI, energy density, and energy‑allowed milk. If the newer model says your ration should carry the same milk on less DMI, that gap is the target for bunk management, grouping, and NDF/starch corrections — not an excuse to pour on more grain.
- Audit starch and forage NDF at the bunk, not just in the lab report. Use a shaker box and manure checks to see how much corn you’re dragging through cows. Then line your forage NDF, total NDF, and starch up against a forage‑NDF/starch reference, and adjust with chop length, by‑product NDF, buffers, feeding frequency, and bunk space so you’re not “protecting” cows into low‑group feed efficiency.
- Run every fat and amino‑acid product through a simple ROI screen using your own milk cheque. Take the inert fat example — $0.54/cow/day in vs $0.37/cow/day back out, net −$0.17 — as a template. Check that RDP is around 10% of dry matter, MUN sits between 8 and 10 mg/dL, and the model shows a genuine amino‑acid limitation before you let those products live in your fresh‑cow ration.
- Order a full water test and put it beside your mineral program. If you don’t know your iron, manganese,sulfate, and molybdenum levels, you’re flying blind on trace‑mineral absorption. Compare that report to the ranges in your ration and premix; decide if the bottleneck is actually in the trough, not in the bag.
- Over the next year, make feed efficiency part of how you judge every “safety net.” The 1.3→1.4 example — 1.8 kg DMI saved, about $0.59/cow/day, or $64,000/year for 300 cows — shows how much margin sits inside your own feed pad before any government program cuts a cheque. When you look at Dairy Margin Coverage or similar tools, treat feed efficiency as the lever that decides how much of that national margin actually ends up in your bank account.

Key Takeaways
- If your high group sits around 1.3 feed efficiency at roughly 30–32 kg of 3.5% fat‑corrected milk, you’re almost certainly feeding about 1.8 kg of dry matter per cow per day that isn’t needed to hold that milk, worth around $0.50–$0.60 per cow per day at a $0.33/kg DM cost.
- If your ration is still mentally anchored to 2001‑era assumptions, the updated NASEM 2021 model suggests you may be able to hold or increase milk on less DMI by tightening energy density, fixing corn processing, and getting forage NDF and starch back into a safe but efficient zone — instead of throwing more dry matter and hoping the bunk cleans up.
- If your market doesn’t pay rich protein premiums, you still need about 10% RDP, MUN between 8 and 10 mg/dL, and DDGS capped near 2 kg per cow per day, but you don’t have to assume every rumen‑protected amino acid or inert fat is money in the bank just because a model tags an amino acid as “limiting.”
- If you’ve never set a current water analysis beside your mineral tag and ration printout, you’re leaving a big blind spot in an otherwise tight mineral plan — high iron or sulfate in water can quietly undo a lot of careful copper, zinc, and selenium work and quietly drag down intake and milk.

The Bottom Line
This Midwest dairy composite isn’t a fairy tale or a horror story. It’s what happens when a “fine” 1.3‑FE ration gets forced through 2021‑era math, December 2025’s DMC margin and a couple of blunt bunk‑side conversations. When you run your own feed‑efficiency, starch, NDF, protein, and water numbers over the next month, do they say you’re getting paid for the dry matter you’re buying — or that your high group is quietly eating like a low group?
Complete references and supporting documentation are available upon request by contacting the editorial team at editor@thebullvine.com.
Learn More
- The $30,000 Question: Why You Must Measure Individual Feed Efficiency Before You Buy the Next Additive – Stop “shotgun” nutrition by using these exact implementation protocols to measure individual cow performance. This guide arms you with the math to capture recovered margin before you sign for your next additive.
- The $200,000 Dairy Margin Trap: Why National Averages Hide Your True Risk in 2026 – Relying on national averages for 2026 hides your true operational risk. This strategic breakdown delivers a personalized economic roadmap to protect your capital and position your dairy for long-term growth.
- The Feed Efficiency Revolution: How ‘Feed Saved’ Genomics Reshapes the Herd Bottom Line – How do you build a herd that converts dry matter into components with surgical precision? This analysis reveals how Feed Saved genomics is transitioning into the ultimate profit-building tool for modern herds.
 The Sunday Read Dairy Professionals Don’t Skip.
 The Sunday Read Dairy Professionals Don’t Skip.
Every week, thousands of producers, breeders, and industry insiders open Bullvine Weekly for genetics insights, market shifts, and profit strategies they won’t find anywhere else. One email. Five minutes. Smarter decisions all week.


