


Same cows, same milk, $15,000 apart. This spring, Class III won’t decide your future—your DRP and risk plan will.
Executive Summary: Class III and Class IV price swings are quietly putting five‑figure gaps between herds that look almost identical on paper. Using current USDA class prices and the latest 2026 milk production forecast, this piece shows how the same 500‑cow herd can end up roughly $10,000–$15,000 apart in a month, just on pooling and price exposure.It then sorts risk management into three simple lanes—defensive, balanced, and aggressive—with practical DRP and Class III options ideas, suggested coverage ranges, and clear cheese/Class III triggers for when to act. The article also walks through five numbers you’ll want on paper before you call your DRP agent: production, components, basis, utilization mix, and break‑even. If you’re planning for Spring 2026, it’s built to help you move from watching Class III to running a risk plan that actually fits your herd.

You know that feeling when Class III is up on the screen, but your milk check sure doesn’t look like it got the memo? You’re not alone. A lot of 400–800 cow herds are finding that when the Class III/Class IV spread opens up, two 500‑cow dairies with very similar cows, butterfat levels, and fresh cow management can still end up thousands of dollars apart each month, just because their milk is pooled and used differently.
What I want to walk through here is a simple, practical playbook for Spring 2026: three risk “lanes,” five numbers you need in front of you, and some Dairy Revenue Protection (DRP) timing and price triggers that actually help you decide, not just worry.
How the Class III/Class IV Spread Quietly Moves Your Milk Check
Let’s start with what the numbers really look like. USDA’s own class price reports make it pretty clear the spread between Class III and Class IV moves around more than most of us would like. For example, in February 2025, the USDA reported Class III and Class IV milk prices of 20.18 and 19.90 dollars per hundredweight, respectively. So in that month, Class III had a small edge.

By October 2025, those class prices had shifted again. USDA’s Announcement of Class and Component Prices shows a Class III price of 16.02 dollars per hundredweight and a Class IV price of 14.30 dollars per hundredweight, giving Class III about a 1.72‑dollar advantage. So the story isn’t “Class IV always wins” or “Class III always wins.” The point is that the relationship between the two can change within a year, and your pay price rides on how your milk is used.

Here’s an easy way to picture it. Say you’ve got a 500‑cow Holstein herd averaging about 60 pounds per cow per day. That’s roughly:
- 500 cows × 60 lb = 30,000 lb per day
- 30,000 lb × 30 days ≈ 900,000 lb per month
- 900,000 lb ÷ 100 = 9,000 cwt per month

Now imagine two different pools:
- One is effectively 70% cheese (Class III) and 30% butter‑powder (Class IV).
- The other is closer to 25% Class III and 75% Class IV.
If Class III is a couple of dollars higher than Class IV for a stretch, that cheese‑heavy pool is going to capture a lot more of that value. A 2‑dollar spread on 9,000 cwt is 18,000 dollars on paper. Even if only part of that makes it into your final mailbox price because of pooling and adjustments, you can see why it’s realistic for two similar 500‑cow herds, sitting in two different utilization situations, to be ten‑plus thousand dollars apart in some months. The cows don’t know it, but the blend sure does.
Uniform prices tell the same story in a different way. USDA’s 2025 uniform milk price tables show that the monthly uniform price at 3.5% butterfat can differ by more than a dollar per hundredweight between some Federal Orders, depending on class utilization and the month. Industry coverage of those uniform prices in late 2025 noted that when class prices fell together, all 11 orders saw lower uniform prices, but the actual level on the milk check still varied by order and utilization mix. On 9,000 cwt, a 1‑dollar uniform price gap is 9,000 dollars before you even talk about premiums or penalties.
And here’s something that’s easy to miss: the FMMO numbers are useful, but they’re still averages. Your co‑op’s monthly statement will often show how your specific pool and plant mix are behaving, and that’s the document you really want to study alongside the federal reports.
The bottom line: you don’t control the spread. You don’t control how your co‑op pools. But you do control how much of your business is exposed to that spread, and that’s where this risk “lane” idea comes in.
Three Risk Lanes: Which One Looks Most Like You?

What I’ve found, sitting at kitchen tables in Wisconsin and the Northeast, is that most herds don’t need a PhD in futures. They need an honest look at their balance sheet and a simple way to decide how much downside they can live with. When you do that, most 400–1,000 cow dairies fall into one of three lanes:
- Defensive: “We really can’t afford a bad quarter.”
- Balanced: “Let’s protect the downside, but don’t cap all the upside.”
- Aggressive: “Feed’s lined up, equity’s good, we’ll ride more risk.”
Here’s an illustrative snapshot for that 500‑cow, 2.7‑million‑lb‑per‑quarter herd:
| Strategy | Production Covered | Premium Commitment* | Floor Strength | Upside Exposure | Best Fits |
| Defensive | 65–70% | Higher | Near sustainable break‑even | ~30–35% | Tight cash, higher leverage |
| Balanced | 40–50% | Moderate | Good, but not maximum | ~50–55% | Moderate leverage, modest reserves |
| Aggressive | 20–25% | Low | Disaster‑only | ~75–80% | Strong equity, feed locked, higher risk |
*Premium commitment here is total premiums over several months as a rough share of gross milk revenue, not a quote.
A quick way to check your lane:
- Defensive herds have less than 6 months of cash cushion, debt-to-asset ratios around 50–60%, and a genuinely scary outlook if one quarter goes badly.
- Balanced herds have six to twelve months of operating cushion, manageable debt, and enough breathing room to absorb a tough quarter without the banker reaching for the restructuring file.
- Aggressive herds have strong equity, feed covered through the next harvest at tolerable prices, and enough cash flow to ride out a bad quarter or two without forced cow sales.
What’s interesting is that no lane is “right” or “wrong.” They just come with different trade‑offs. More coverage buys stability but trims upside. Less coverage keeps upside but magnifies the swings. In many cases, producers I work with aim to keep at least 15–20% of production covered with something—DRP, deep out‑of‑the‑money puts, or a mix—just as catastrophic protection. It’s the rest of the milk where the lane really shows up.
If You’re Defensive: “We Can’t Afford a Bad Quarter”
Let’s talk about the herd that’s built new facilities, maybe added robots, and is carrying more debt than they’re comfortable with. If one really bad quarter would have your lender asking hard questions, you’re in the defensive lane, whether you feel like a risk‑taker or not.

You probably recognize yourself if:
- Your cash cushion is under six months of expenses.
- Debt‑to‑asset is 50–60% or more.
- Your sustainable break‑even is at least in the mid‑15‑dollar range, once you account for all costs.
- A quarter of low prices isn’t just “tight,” it’s a survival issue.
In this lane, it generally makes sense to cover about 65–70% of your projected production. For that 500‑cow herd producing about 2.7 million pounds a quarter, that’s roughly 1.8–1.9 million pounds insured in some way.
A practical defensive toolkit often includes:
- DRP at around 90% coverage using Class Pricing that leans toward Class III if your plant is largely cheese‑focused.
- At‑the‑money or slightly out‑of‑the‑money Class III put options on part of that same milk to pull your effective floor closer to your sustainable break‑even once you factor in basis and component premiums.
The catch with going defensive:
- DRP coverage is more expensive, net, at higher coverage levels because subsidy percentages are smaller.
- You’re deliberately giving up some upside in exchange for a tighter floor.
- You’ll feel the premium cost in a good year—but you’ll sleep better in a bad one.
What DRP materials and risk‑management guides consistently show is that premium subsidies are relatively larger at lower coverage levels and smaller at higher coverage levels, so an 80% policy usually has a larger subsidy share than a 95% policy. That’s why your out‑of‑pocket cost per insured hundredweight rises as you push coverage closer to 95%.

What I’ve seen in many Wisconsin and Minnesota operations is that herds who accept the premium cost and stick to a consistent DRP and options plan tend to have calmer conversations at the bank when cheese and class prices fall than those who keep riding everything on the cash market. The year might still be tough, but the floor does its job.
If that sounds like you, here’s what this means in practical terms:
- Your main question isn’t, “Where’s Class III going?” It’s, “What’s the lowest mailbox price we can live with and still pay the bills and keep the lender comfortable?”
- If your sustainable break‑even is around 16 dollars per hundredweight and a quarter, and a 14‑dollar Class III would put you in real trouble, then your structures need to focus on keeping realized prices above that danger zone, not chasing every rally.
- Once Q2 Class III futures sit 1.50–2.00 dollars above your sustainable break‑even for a while, you can justify easing off new coverage on part of your milk and letting some upside run. Until then, your priority is staying in business, not maximizing upside.
If You’re Balanced: “Protect the Downside, Don’t Miss the Rally”
A lot of progressive herds fall into this middle lane. You’ve tightened costs, you know your numbers, and your debt and cash position give you room, but you’re not interested in gambling.

You’re probably here if:
- You’ve got six to twelve months of operating cushion.
- Debt service fits comfortably into your cash flow most years.
- You accept that you won’t call the top or the bottom.
- You want real downside protection, but also want to participate when Class III runs.
In this lane, covering about 40–50% of your projected production often makes sense. For that same 500‑cow example, that’s roughly 1.1–1.4 million pounds hedged, with 1.3–1.6 million pounds left open.
The balanced toolkit usually has two pieces:
- Slightly out‑of‑the‑money Class III puts—say, in the mid‑15 to low‑16‑dollar range if Q2 futures are in the mid‑16s—on around one‑third to two‑fifths of your milk. That way, a 1.50–2.00‑dollar slide in Class III starts to trigger protection, but you still fully enjoy a strong rally.
- DRP at 80–85% coverage on another slice of milk as a safety net. Because DRP subsidies are generally more generous at these coverage levels than at 90–95%, the net cost per hundredweight on that insured volume is more manageable.
In this setup, the options tend to do the heavy lifting for routine price swings, while DRP is there for the really ugly quarters.
For your herd, this lane means:
- You’re trading moderate premiums for a decent floor and lots of upside.
- A bad quarter still hurts, but it doesn’t put the whole operation at risk.
- It helps to define a couple of simple triggers, so you’re not guessing in the heat of the moment:
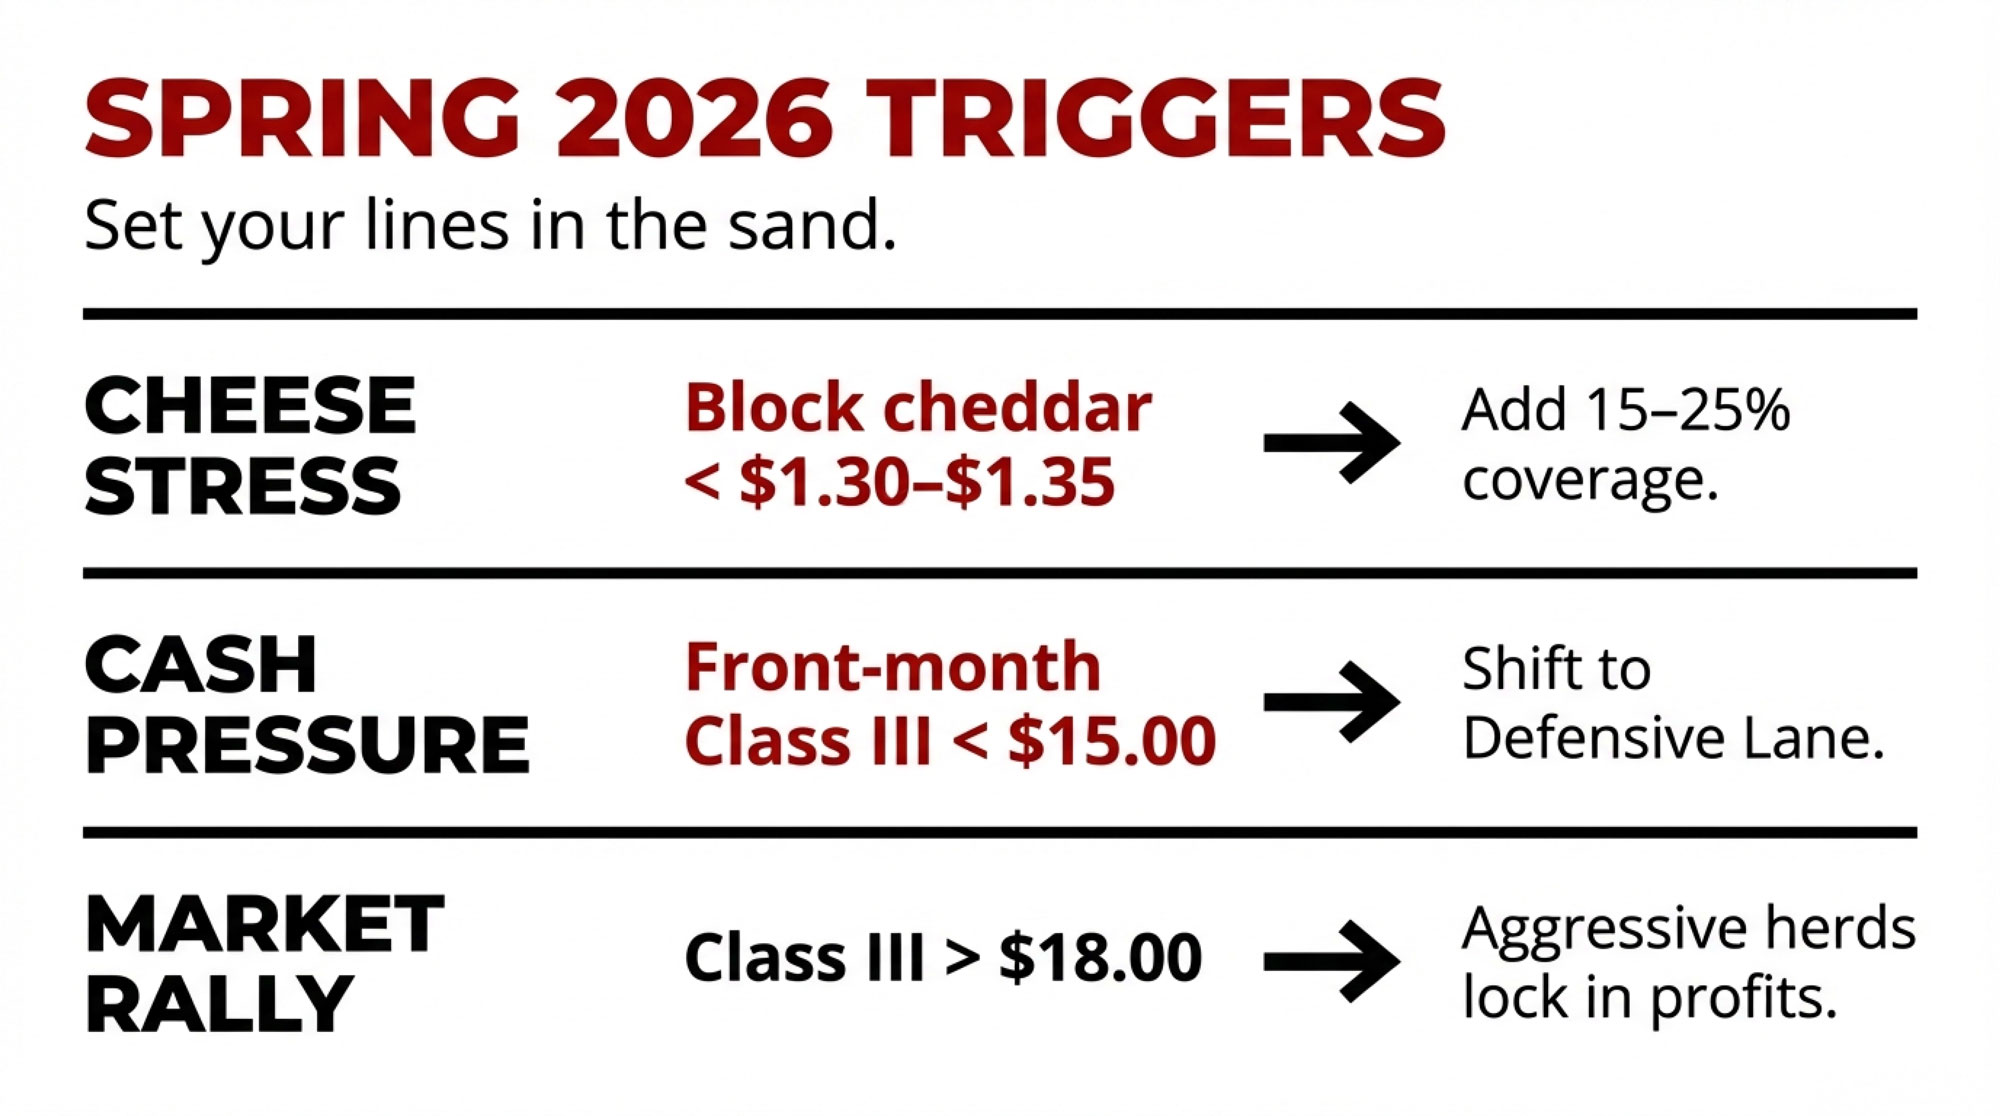
- If CME block cheddar sits under roughly 1.30–1.35 dollars per pound for several trading sessions, that’s usually a sign the cheese market is under real stress. In that situation, many balanced or aggressive herds add another 15–25% coverage via DRP or puts.
- If front‑month Class III slips under about 15.00 dollars per hundredweight, that’s a reasonable point to shift your posture a little more defensive and protect more of your production.
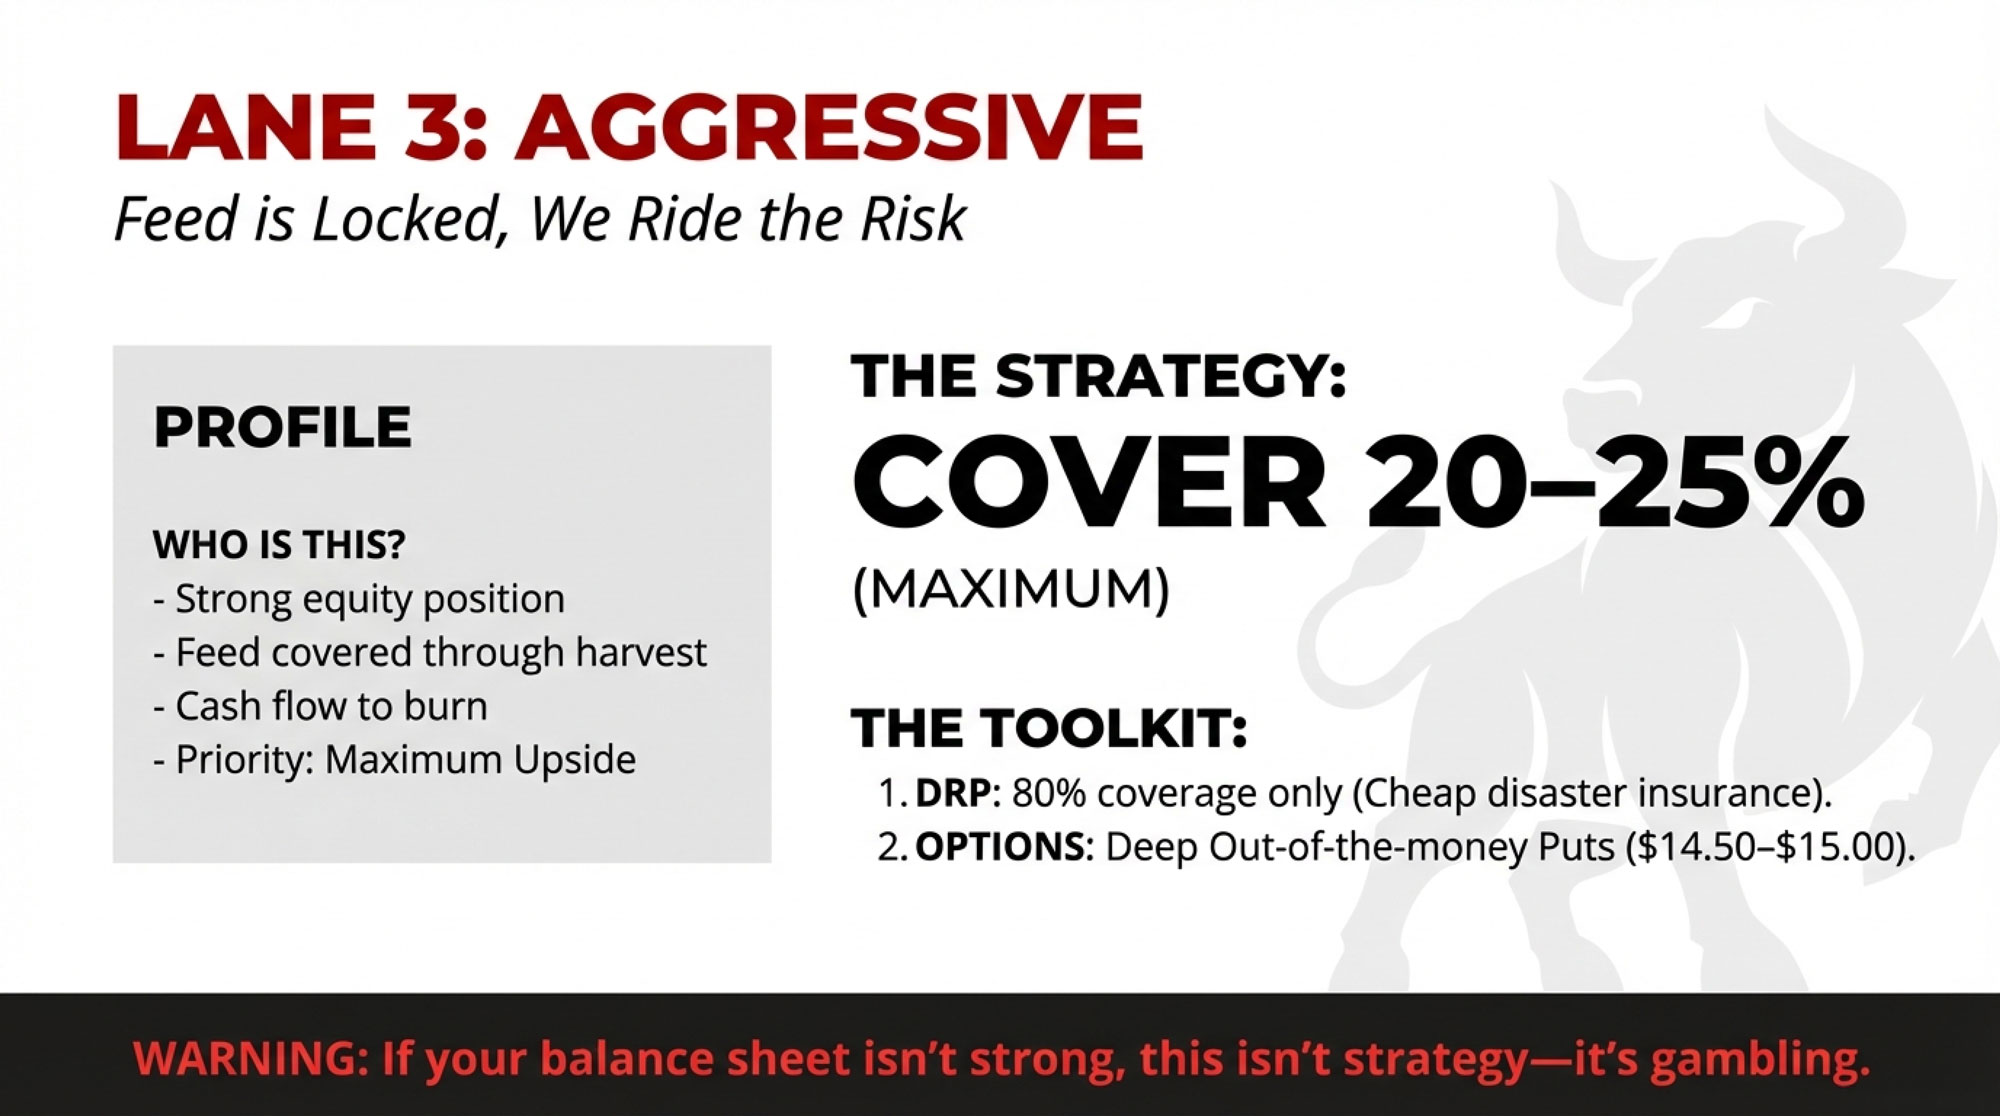
If You’re Aggressive: “Feed’s Locked, We’ll Ride It”
Then there are the herds that have built equity and efficiency over time and are in a position to withstand more volatility. In these dairies, feed is often locked at a decent price, the cows are producing well, and the balance sheet can take a punch without panic.
You’re in this camp if:
- Your equity position is strong, and leverage is modest.
- Feed costs are locked in through the next crop year at levels that still leave a margin.
- You can live through a bad quarter or two without emergency financing, forced cow sales, or putting off critical maintenance.
- You genuinely think the current weakness in cheese and Class III is overdone and want more upside exposure.
In this lane, you’re often only covering about 20–25% of projected production, leaving 75–80% to float with the market. For our 500‑cow example, that’s around 500,000–700,000 pounds covered and 2 million pounds uncovered.
The typical aggressive toolkit:
- A modest DRP policy at 80% coverage on a slice of milk as “disaster insurance.” Because this is the lowest coverage level, it tends to carry a smaller net premium per hundredweight and still gives you something if prices collapse.
- Deep out‑of‑the‑money Class III puts—maybe around 14.50–15.00 dollars per hundredweight—that don’t cost much and only kick in if we get a serious wreck.
The trade‑off is pretty straightforward. You’re spending less on premiums, you’ve got maximum upside, but you’re also accepting that a routine 1‑dollar slide in Class III will hit you harder. That only works if your equity, cash flow, and feed position can legitimately handle that risk.
So it’s worth being blunt here: if your balance sheet isn’t genuinely strong, this lane isn’t a badge of honor, it’s just unnecessary risk. Plenty of good operators have gotten hurt by trying to be aggressive when the books said they should’ve been balanced or defensive.
If you are in a position to ride in this lane, it really pays to write down your “I’m wrong” lines:
- Maybe you decide that if block cheese breaks 1.35 dollars per pound and stays below there for a week, you immediately add 20–25% more coverage.
- Or you say that if front‑month Class III trades under 15.00 dollars per hundredweight, you’ll move yourself back toward a balanced posture and start building floors.
What’s encouraging is that when aggressive herds set those lines in advance and stick to them, they’re not just guessing. They’re managing risk, even if it’s a higher‑octane version.
DRP and Class III Options: Different Tools, Same Job
It’s easy to get stuck in debates about DRP versus futures and options, almost like it’s a philosophical choice. In practice, they’re just two tools in the same box. The real question is which mix fits your risk lane and your comfort level.

Dairy Revenue Protection is a USDA‑backed insurance program that lets you insure quarterly milk revenue. You pick a coverage level—anywhere from 80% to 95%—and choose between Class Pricing and Component Pricing. Under Class Pricing, your guarantee is based on a mix of Class III and Class IV futures, as you choose. Under Component Pricing, it’s based on futures‑derived butterfat and protein values and your declared component levels.
Those guarantees are settled against published quarterly revenue indexes specific to your state or region. And because DRP is a federal program, premiums are partially subsidized. The key thing the program documents and industry overviews agree on is that subsidy percentages are higher at lower coverage levels and smaller at higher coverage levels, which is why an 80% policy usually has a lower net cost per insured hundredweight than a 95% policy.
Class III put options are different. When you buy a put, you’re buying the right (but not the obligation) to sell Class III futures at your chosen strike. There’s no subsidy, and you need a futures/options account, plus some discipline around margin and position management. But the flexibility is hard to beat: you pick the strike, you pick the months, and on that hedged milk you keep all the upside above your floor.
So in many Midwestern dairies, the practical split looks like this:
- Use DRP—particularly at 80–85% coverage—as relatively simple, subsidized, disaster‑style coverage on at least part of your milk.
- Layer in Class III puts for the portion where you want a clear floor but don’t want to give up upside, especially in the balanced and aggressive lanes.
Five Numbers You Really Want in Front of You
Here’s something you probably know already from dealing with lenders and nutritionists: the better your numbers, the better the advice you get. Risk management’s no different. Before you call your DRP agent or broker, having these five numbers written down changes the conversation.

1. Projected Quarterly Production
Look back at the last three to six milk checks and average your monthly pounds shipped. Multiply by three to get a starting point for the next quarter. Then adjust for what’s actually happening on your farm:
- Are you freshening more heifers?
- Did you change your transition period management?
- Are you switching to or from a dry lot system?
- Is a new robotic box coming online?
You don’t need to be exact, but you do need an honest estimate.
2. Butterfat and Protein Averages
Pull your last several milk checks or DHIA tests and take the average butterfat and protein levels. If you’re considering DRP Component Pricing, those declared component levels should reflect the milk you actually ship. DRP resources make it clear that indemnities under Component Pricing are based on futures‑derived component values and your declared quantities, so over‑declaring components can come back to bite you if you don’t hit those numbers in the tank.
High‑component herds that consistently run above the regional average often like Component Pricing because it lets them insure the value they’re producing. Herds with more variable components often lean toward Class Pricing because they’re not betting on precise tests every quarter.
3. Basis to Class III or Class IV
Basis is one of those words that makes people’s eyes glaze over, but it’s just the difference between the futures‑based price (Class III or IV) and your mailbox price.
For each of the last few months:
- Take your net milk pay and divide by pounds shipped, then divide by 100 to get your mailbox price per hundredweight.
- Look up the USDA Class III and Class IV prices for that month.
- Subtract Class III (or IV) from your mailbox price.
If your mailbox price has been running, say, about 0.30 dollars per hundredweight over Class III, and you buy puts with a 16.00‑dollar strike, your “real” floor before premiums and fees is closer to 16.30 dollars. That basis number helps you judge whether the protection you’re buying lines up with your actual risk.
4. Class III/Class IV Utilization Mix
This one’s easy to overlook, but it matters. In the U.S. marketing orders, different plants and co‑ops have different utilization mixes—some are heavily cheese‑weighted, others lean more toward butter‑powder. Federal Order documents and policy briefs on current and proposed marketing order reforms spell out just how different those mixes can be between areas.
A simple call to your co‑op or plant rep with a question like, “Roughly what percentage of our pooled milk ends up in Class III products versus Class IV?” can give you a ballpark figure. And just as important, take a good look at your co‑op’s own monthly statement; that’s often the clearest picture of how your actual milk is being used and paid for, beyond the FMMO averages.
If your herd is effectively 65% Class III‑driven and you structure DRP as if you were a 50/50 Class III/Class IV herd, the policy won’t track your milk check as well as it could.
5. Break‑Even Milk Price
Finally, you need at least a rough survival break‑even and a sustainable break‑even.
- Survival break‑even covers feed, power, essential repairs, and the minimum debt service to keep the doors open.
- Sustainable break‑even adds in full debt service, family living, and enough capital replacement that the operation can keep going long term.
| Herd Scenario | Sustainable Break-Even ($/cwt) | $1.00/cwt Drop = Monthly Loss | $2.00/cwt Drop = Monthly Loss | $3.00/cwt Drop = Monthly Loss |
| 300-cow herd, 36 lbs/cow/day | $16.25 (RED) | $16,200/month | $32,400/month (RED) | $48,600/month |
| 500-cow herd, 60 lbs/cow/day | $15.75 (RED) | $27,000/month | $54,000/month (RED) | $81,000/month |
| 800-cow herd, 68 lbs/cow/day | $15.00 | $36,480/month | $72,960/month | $109,440/month |
| Industry Median Break-Even (2024 USDA ERS) | $15.50 | $25,920/month | $51,840/month | $77,760/month |
A quick back‑of‑the‑envelope calculation is to total your annual cash costs and divide by your annual production (in cwt). It’s not perfect, but if it shows your sustainable break‑even is around 16 dollars per hundredweight, you now know that a 14‑dollar Class III “floor” isn’t really protection. It’s just a more predictable way to lose money.
In DRP and risk management meetings across the Midwest, it’s common to hear agents say that the producers who walk in with these five numbers tend to walk out with coverage structures that fit their lane. The ones who don’t bring numbers usually end up talking about feelings, not risk.
Timing and Triggers: Managing Spring 2026 Without Staring at the Screen All Day
If there’s one thing many of us have learned the hard way, it’s that risk management is as much about timing as it is about tools. You don’t have to watch the market all day. But you do want a few dates and signals written down so you can act on your plan, not your emotions.
How DRP Sales Windows Actually Work
DRP isn’t like corn insurance, where you have one big sales closing date. According to the 2026 DRP Basic Provisions, coverage is sold during specific “sales periods,” and sales are suspended on days when major USDA reports, such as Milk Production and Cold Storage, are released. That means you can buy coverage at multiple points, but not every single day.
Practically speaking:
- Q2 2026 endorsements (April–June milk) will mostly be written in the late‑January to March window, outside of those report days.
- Q3 2026 endorsements (July–September milk) will mostly be written in the April–June window, again avoiding report days.
So instead of waiting for a single “deadline,” you’re better off deciding in January and April what your lane is, how much milk you want covered, and what coverage levels make sense. Then it’s just a matter of working with your agent during an open sales period.
Watching USDA Production and Stocks
It’s worth noting that USDA’s January 2026 WASDE forecast bumped expected 2026 U.S. milk production up to about 234.3 billion pounds, roughly 3.2 billion pounds more than 2025, which works out to about 1.4% growth. On paper, that doesn’t sound huge, but as many of us have seen, an extra 1–2% milk floating around in a flat demand environment can put real pressure on prices.
When you pair that with the monthly Milk Production report and the Cold Storage report—especially for cheese and butter inventories—you get a reasonable sense of whether the market is starting to back up or tighten. That can help you decide when to be more defensive and when you can afford to lighten up.
Simple Price Triggers That Help You Act
Most of the herds I talk to don’t want a complicated market model. They just want a few lines in the sand that tell them when it’s time to add coverage or lock in more upside. Here are three that can work as a starting point:
| Signal / Trigger | Level (Approx.) | Market Condition | DEFENSIVE Lane Action | BALANCED / AGGRESSIVE Lane Action |
| CME Block Cheddar | < $1.30–$1.35/lb for 3+ sessions | Cheese market in real stress | ADD 15–25% coverage immediately via DRP or Class III puts. Do not wait. | Monitor closely; consider 10–15% extra coverage if sustained below $1.33/lb. |
| Front-Month Class III Futures | < $15.00/cwt | Cash market under heavy pressure | SHIFT POSTURE DEFENSIVE on 20–30% of unprotected milk.Add DRP or puts without delay. | Tighten stops; add 15–25% coverage. This is your warning line. |
| Front-Month Class III Futures | > $18.00/cwt for 2+ weeks | Rally is real and sustained | Monitor for profit-taking. Keep current coverage. Let upside run. | Lock in a slice of gains; protect half your upside with tight stops or modest puts. Consider locking 10–15% at high prices. |
| USDA Milk Production Forecast | 1.5%+ YoY growth; cheese stocks rising | Oversupply building | Assume downside risk increases Q2–Q3; add 20–30% coverage now while prices near seasonal highs. | Add 10–15% defensive coverage on forward Q3 milk. Plan for lower Q3 prices. |
These aren’t magic numbers. They’re practical guardrails. The real key is writing down, ahead of time, what each of those triggers will mean for you so you’re not trying to invent a plan on a bad Monday morning.
So What Does This Actually Mean for Your Dairy?
USDA’s current outlook, as summarized in late‑January 2026, is a year with a bit more milk and lower average prices than 2025. At the same time, the official class price series shows that the Class III/Class IV relationship can swing enough within a year to move your milk check by meaningful amounts, especially if your herd is tied heavily to cheese or butter‑powder.
You don’t get to choose whether that spread exists. But you do get to choose how much of your herd’s future you leave riding on it.
If you’re in the defensive lane, your job this spring is to:
- Get those five numbers—production, components, basis, utilization mix, and break‑even—on paper.
- Work with your DRP agent to price 85–90% coverage on 60–70% of your Q2 milk, using Class Pricing that matches your actual exposure.
- Layer in near‑the‑money Class III puts on part of that volume, so your effective floor comes closer to your sustainable break‑even.
If you’re in the balanced lane, your focus is to:
- Use DRP at 80–85% coverage on 20–25% of your production as disaster coverage.
- Use slightly out‑of‑the‑money Class III puts on another 20–30%, so you’ve got a reasonable floor with upside.
- Put your cheese and Class III price triggers in writing and decide, ahead of time, how much extra coverage you’ll add when those lines get crossed.
If you’re in the aggressive lane and your numbers truly support it, you can:
- Keep coverage lighter—say 20–25% of production with DRP at 80% or deep out‑of‑the‑money puts—to guard against a real crash.
- Be honest about your “I’m wrong” lines on cheese and Class III and commit—with your family or business partners—to changing lanes if those lines are crossed.
- And just as important, make sure your balance sheet is strong enough that you’re not turning your livelihood into a bet you can’t afford to lose.
And there’s one more step that’s worth taking this week, no matter which lane you’re in:
- Pull your last six months of milk checks and calculate your basic basis and break‑even.
- Put a ten‑minute weekly price check (cheese, Class III, Class IV) on your calendar.
- Talk through your lane with whoever else has a stake in the dairy—family, partners, key employees—so everyone understands the plan.
In a 2025–26 world where USDA expects higher milk production and lower prices, and where the Class III/Class IV spread can change direction more than once a year, hoping the market behaves isn’t a strategy. Your balance sheet—not your opinion of cheese—is what should pick your lane.
The goal isn’t to guess exactly where Class III will be in June. It’s to decide what you can live with now, set your floors accordingly, and make sure the market doesn’t get the final say on whether your dairy makes it through the next year.

Key Takeaways
- Same cows, big gap: Class III/IV spread and pooling differences alone can put two similar 500‑cow herds $10,000–$15,000 apart in a single month.
- Pick your lane: defensive herds should cover 65–70% of production, balanced herds 40–50%, and aggressive herds 20–25%—based on cash, leverage, and risk tolerance, not feelings.
- DRP at 80–85% coverage offers the best subsidy‑to‑protection trade‑off for most operations; add Class III puts when you want a tighter floor with upside intact.
- Know your numbers: projected production, component averages, basis, utilization mix, and break‑even should be on paper before you call your DRP agent.
- Set triggers, not hopes: decide now what cheese price and Class III levels will make you add protection—so you’re acting on a plan, not reacting to a bad Monday.
Complete references and supporting documentation are available upon request by contacting the editorial team at editor@thebullvine.com.
Learn More
- The Great Dairy Divide: Why Your Feed’s Cheap but Your Milk Check Still Hurts – Reveals how identifying high-protein genetics can capture $4.00/cwt premiums while locking in DRP at 95% coverage shields your income. It delivers the immediate, line-item tactics needed to protect margins when feed costs and milk prices disconnect.
- FMMO Reality Check: Why 2025’s $2.3 Billion Dairy Pricing Revolution Exposes the Fatal Flaw in American Milk Marketing – Breaks down the massive structural shift in Federal Order pricing that favors processors over producers. This strategic deep-dive arms you with the foresight to navigate a system where “higher-of” math and manufacturing allowances dictate long-term regional profitability.
- Genetic Correlations Upended: Why Sticking with Old Breeding Indices Could Cost Your Dairy $486 Per Cow – And What the Data Really Proves – Exposes the $486 lifetime profit gap created by the 2025 genetic base change. It replaces volume-obsessed thinking with component-optimized strategies, ensuring your future herd matches the precision-driven milk pricing models of the next decade.
 The Sunday Read Dairy Professionals Don’t Skip.
 The Sunday Read Dairy Professionals Don’t Skip.
Every week, thousands of producers, breeders, and industry insiders open Bullvine Weekly for genetics insights, market shifts, and profit strategies they won’t find anywhere else. One email. Five minutes. Smarter decisions all week.


