


Fertility collapse, feed efficiency erosion, and the wrong potassium source are where heat stress quietly empties the tank — and none of it shows up in that number.
Executive Summary: Nigel Cook’s $74-per-cow heat stress number was never wrong — it only priced the milk, not the pregnancies, culls, and lost efficiency that push his own updated estimate for Wisconsin closer to $120 per cow. New work on THI shows conception rate damage starting around 60, while most barns still wait until 68–72 to flip fans on, so herds are quietly losing pregnancies while cows look “fine.” On the nutrition side, meta-analyses and field trials now point to summer DCAD targets in the +350 to +400 mEq/kg DM range, with roughly 0.5% sodium and 1.8% potassium if you actually want to protect components rather than change a premix tag. Those same trials make it pretty clear that potassium carbonate and potassium chloride aren’t interchangeable: carbonate drives DCAD and milk fat response, and chloride mostly keeps the spreadsheet and the ingredient bill happy. Put together, the 2026 heat stress question isn’t “Is it costing me $74 or $120?” — it’s whether your real summer ration and cooling triggers are set for THI 60 and +350 DCAD, or still stuck on spring settings.
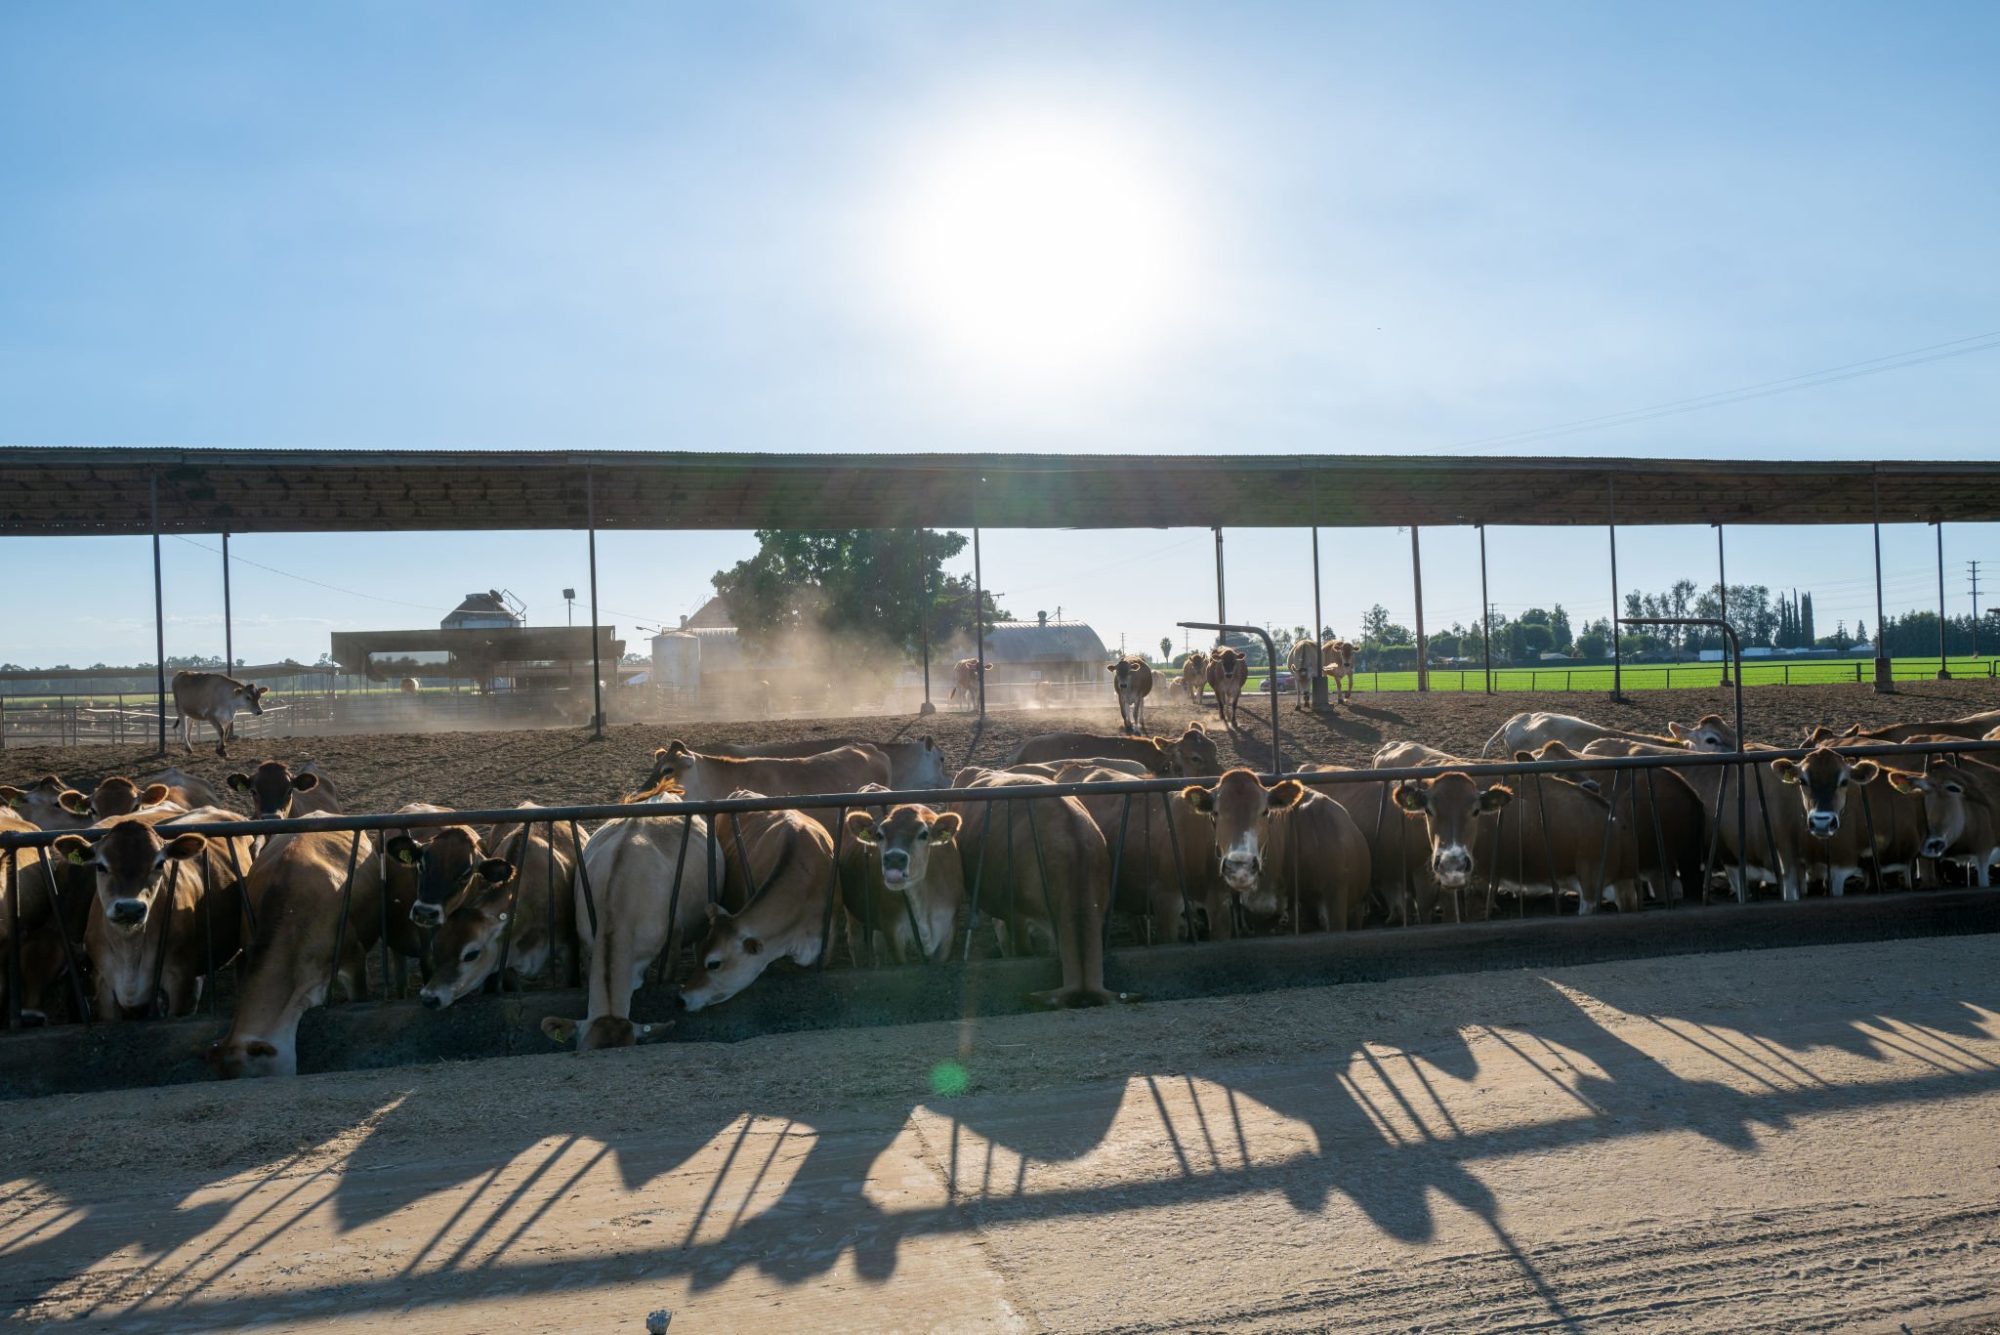
His milk-loss figure was never meant to capture the full extent of the damage. Fertility collapse, feed efficiency erosion, and the wrong potassium source are where heat stress quietly empties the tank.
Nigel Cook’s heat-stress research at UW–Madison gave the dairy industry one of its most-quoted figures: $74 per cow per year in lost milk production. Clean. Quotable. Easy to multiply by herd size, subtract the cost of fans, and feel like you’ve done the math. But Cook always framed that figure as a milk production estimate — not the total economic hit.
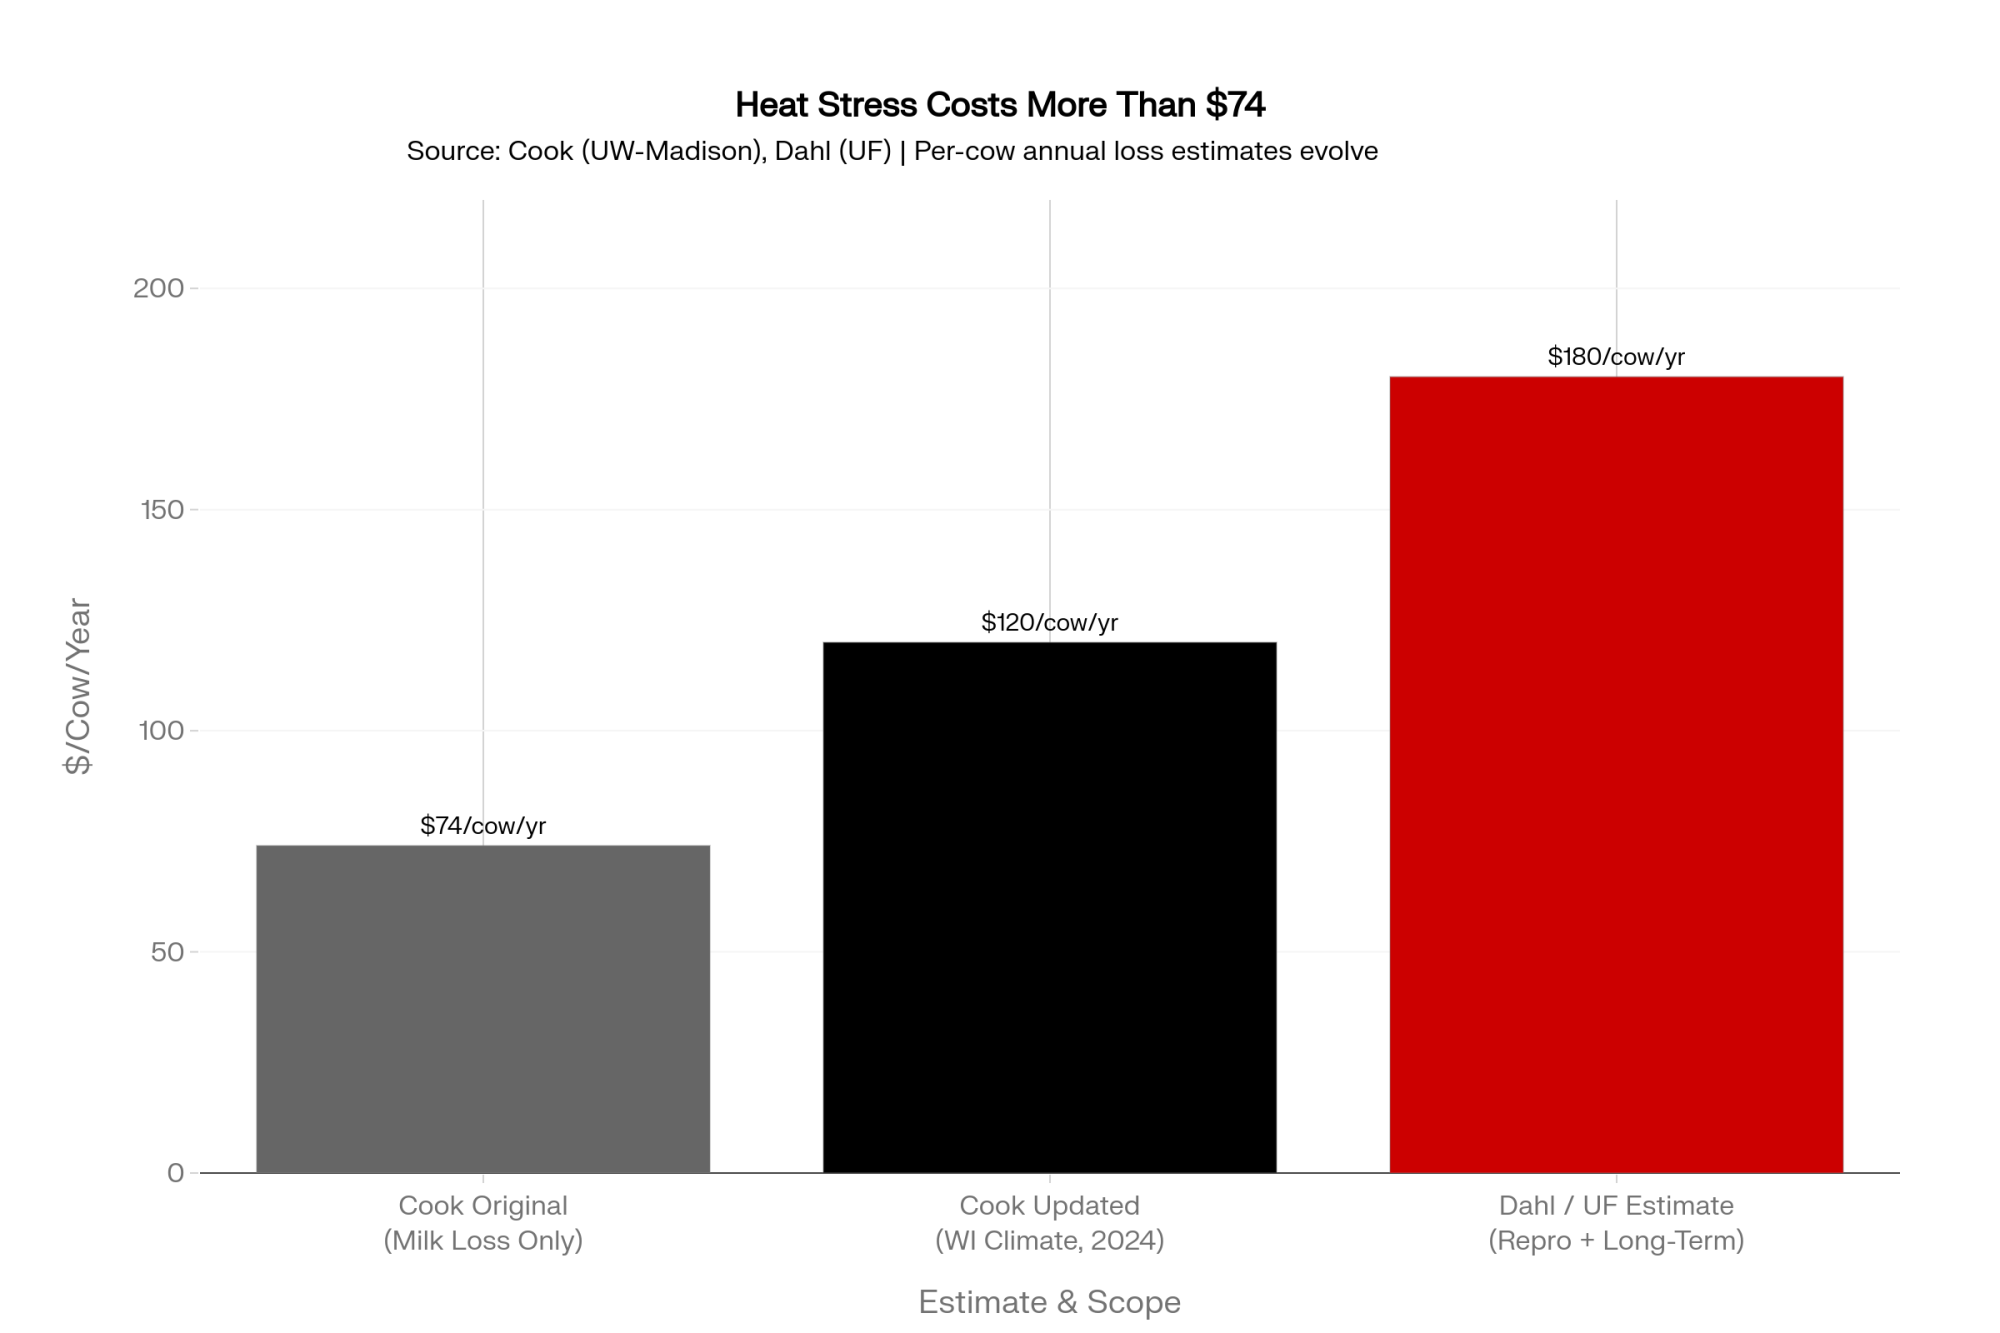
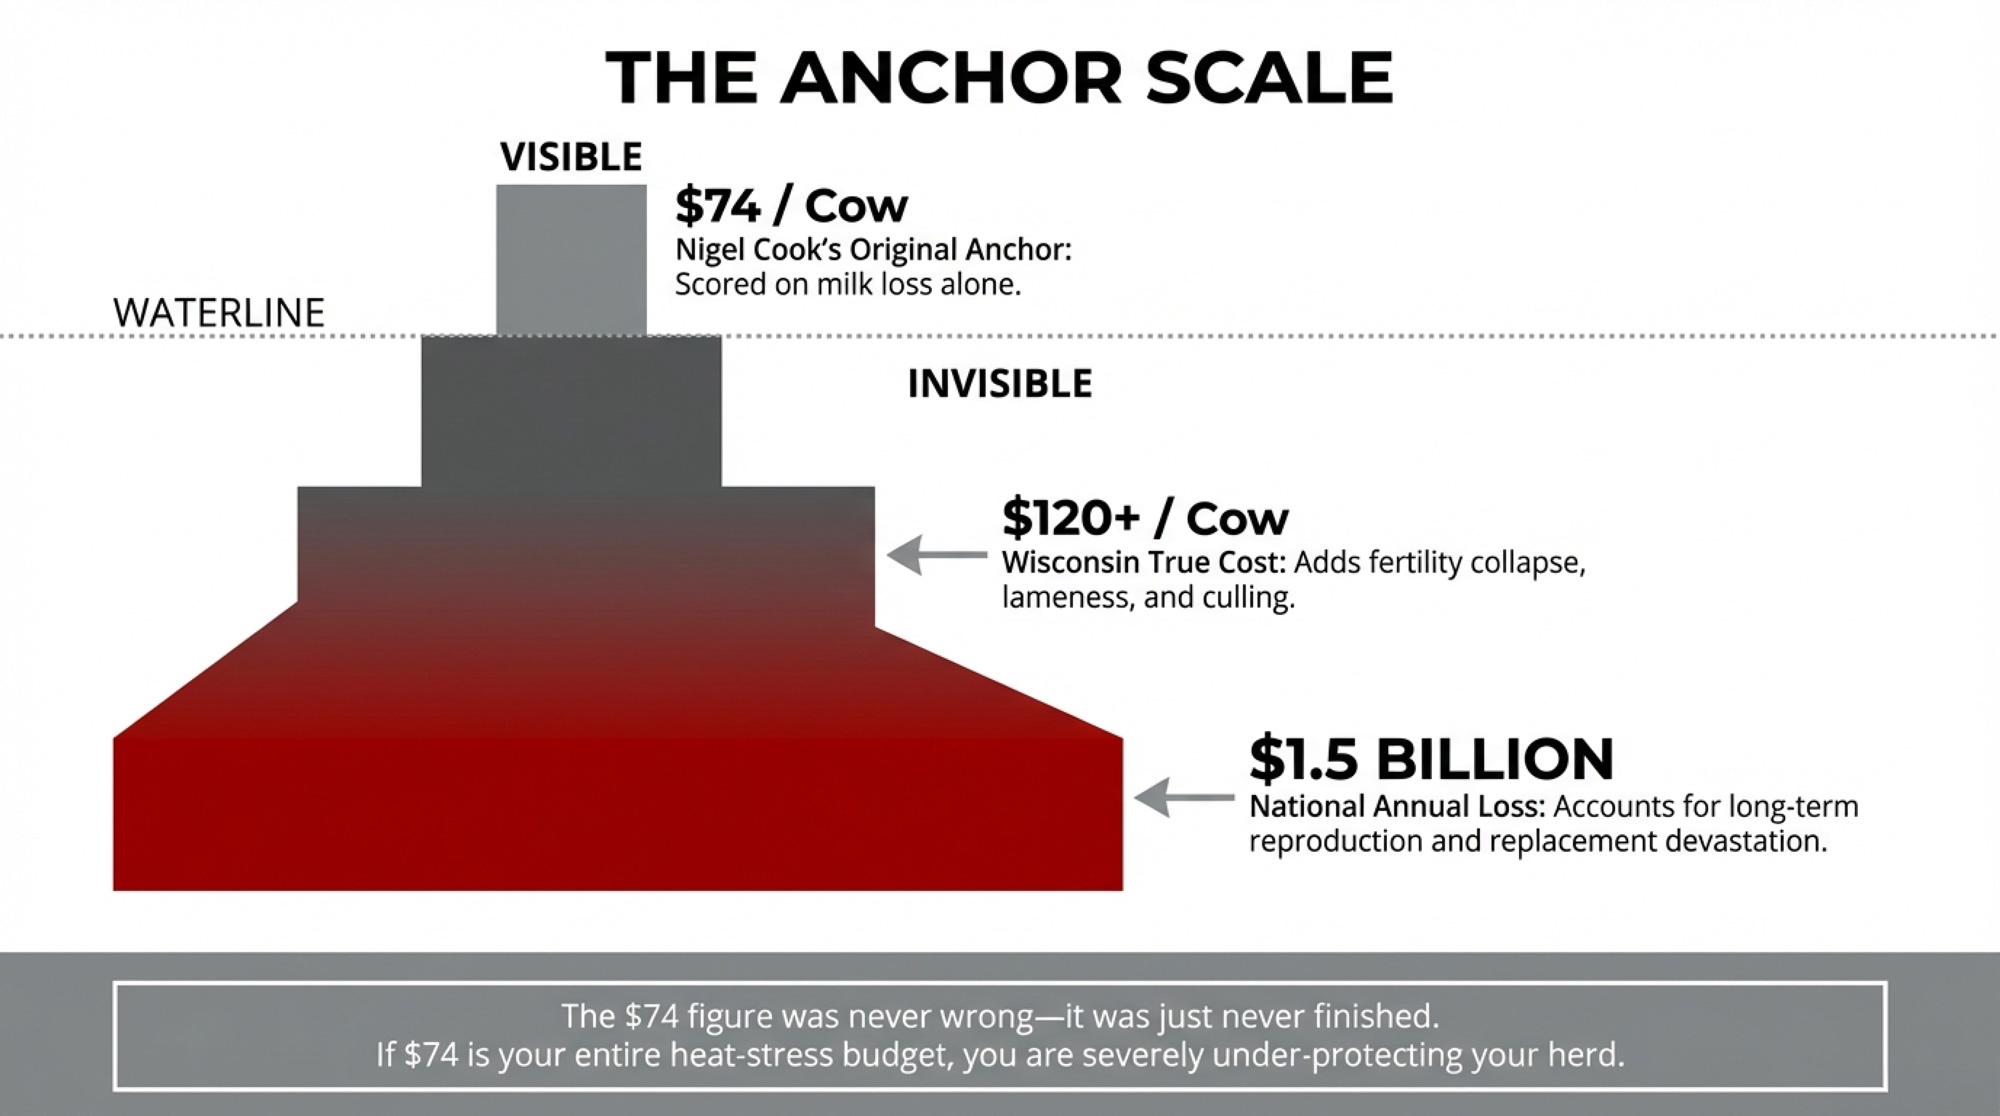
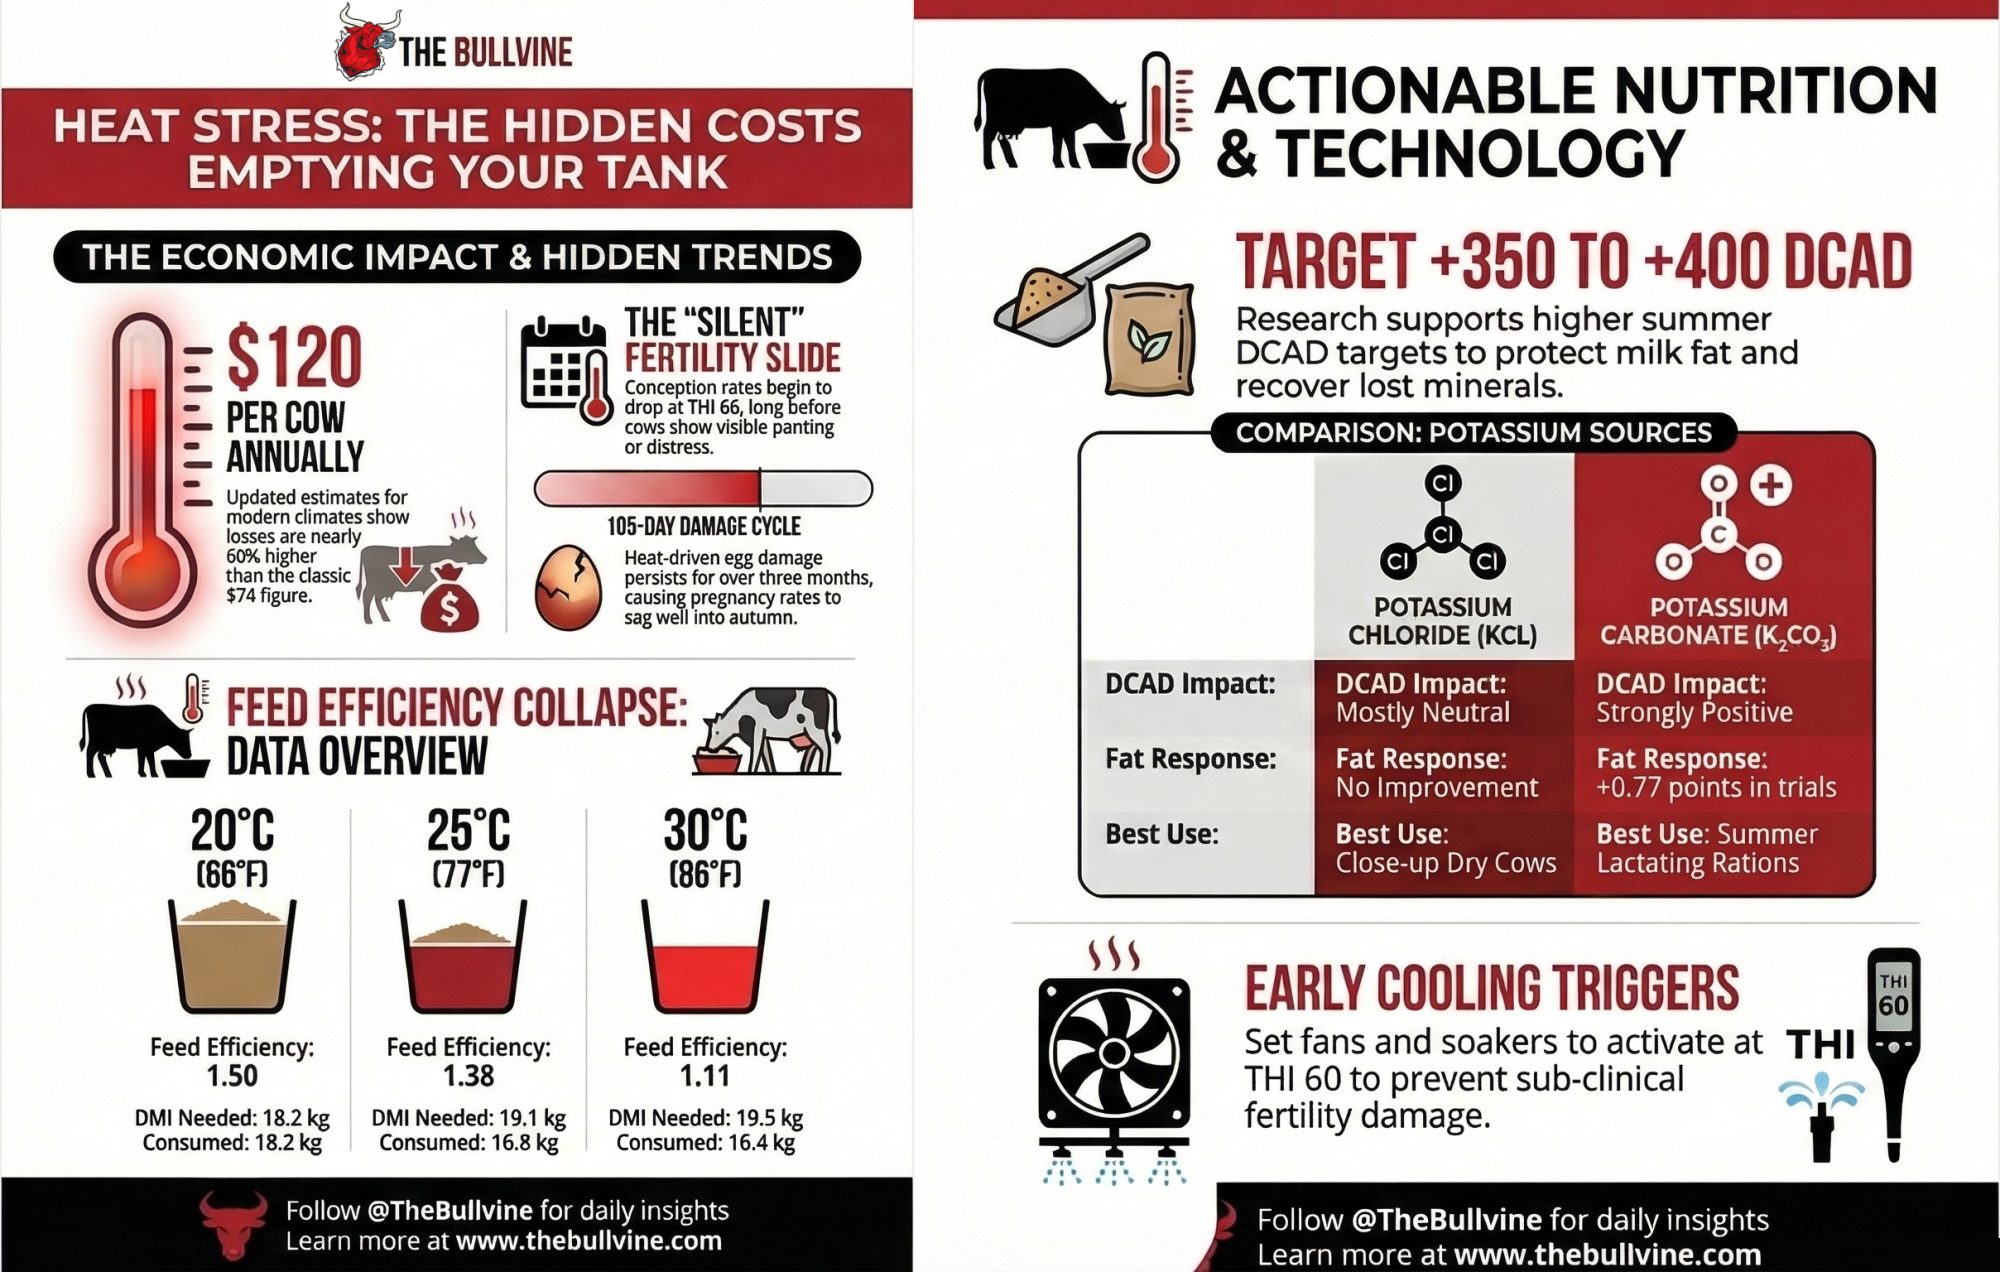
Across the industry, though, $74 quietly became the ceiling on what summer heat was “worth” fixing. Cook himself has since suggested that for the Madison, Wisconsin, climate — roughly 77 days above 20°C, a pattern that looks a lot like southern Ontario — the number is closer to $120 per cow per year. And even that doesn’t touch fertility, lameness, culling, or metabolic costs. Jeff Dahl and colleagues at the University of Florida have estimated total U.S. dairy heat-stress losses at over $1.5 billion annually, once reproduction and long-term effects are factored in. USDA modeling has pegged average per-farm production losses at roughly 183,000 lb of milk in some heat-affected regions.
The $74 was never wrong. It was always scoped to milk loss alone. The problem starts when that number becomes your entire summer budget.
Fertility Starts Sliding Before the Fans Turn On
Most barns flip fans and soakers on around THI 68–72. For visible panting and milk drops, that threshold holds up. Fertility is a different animal.
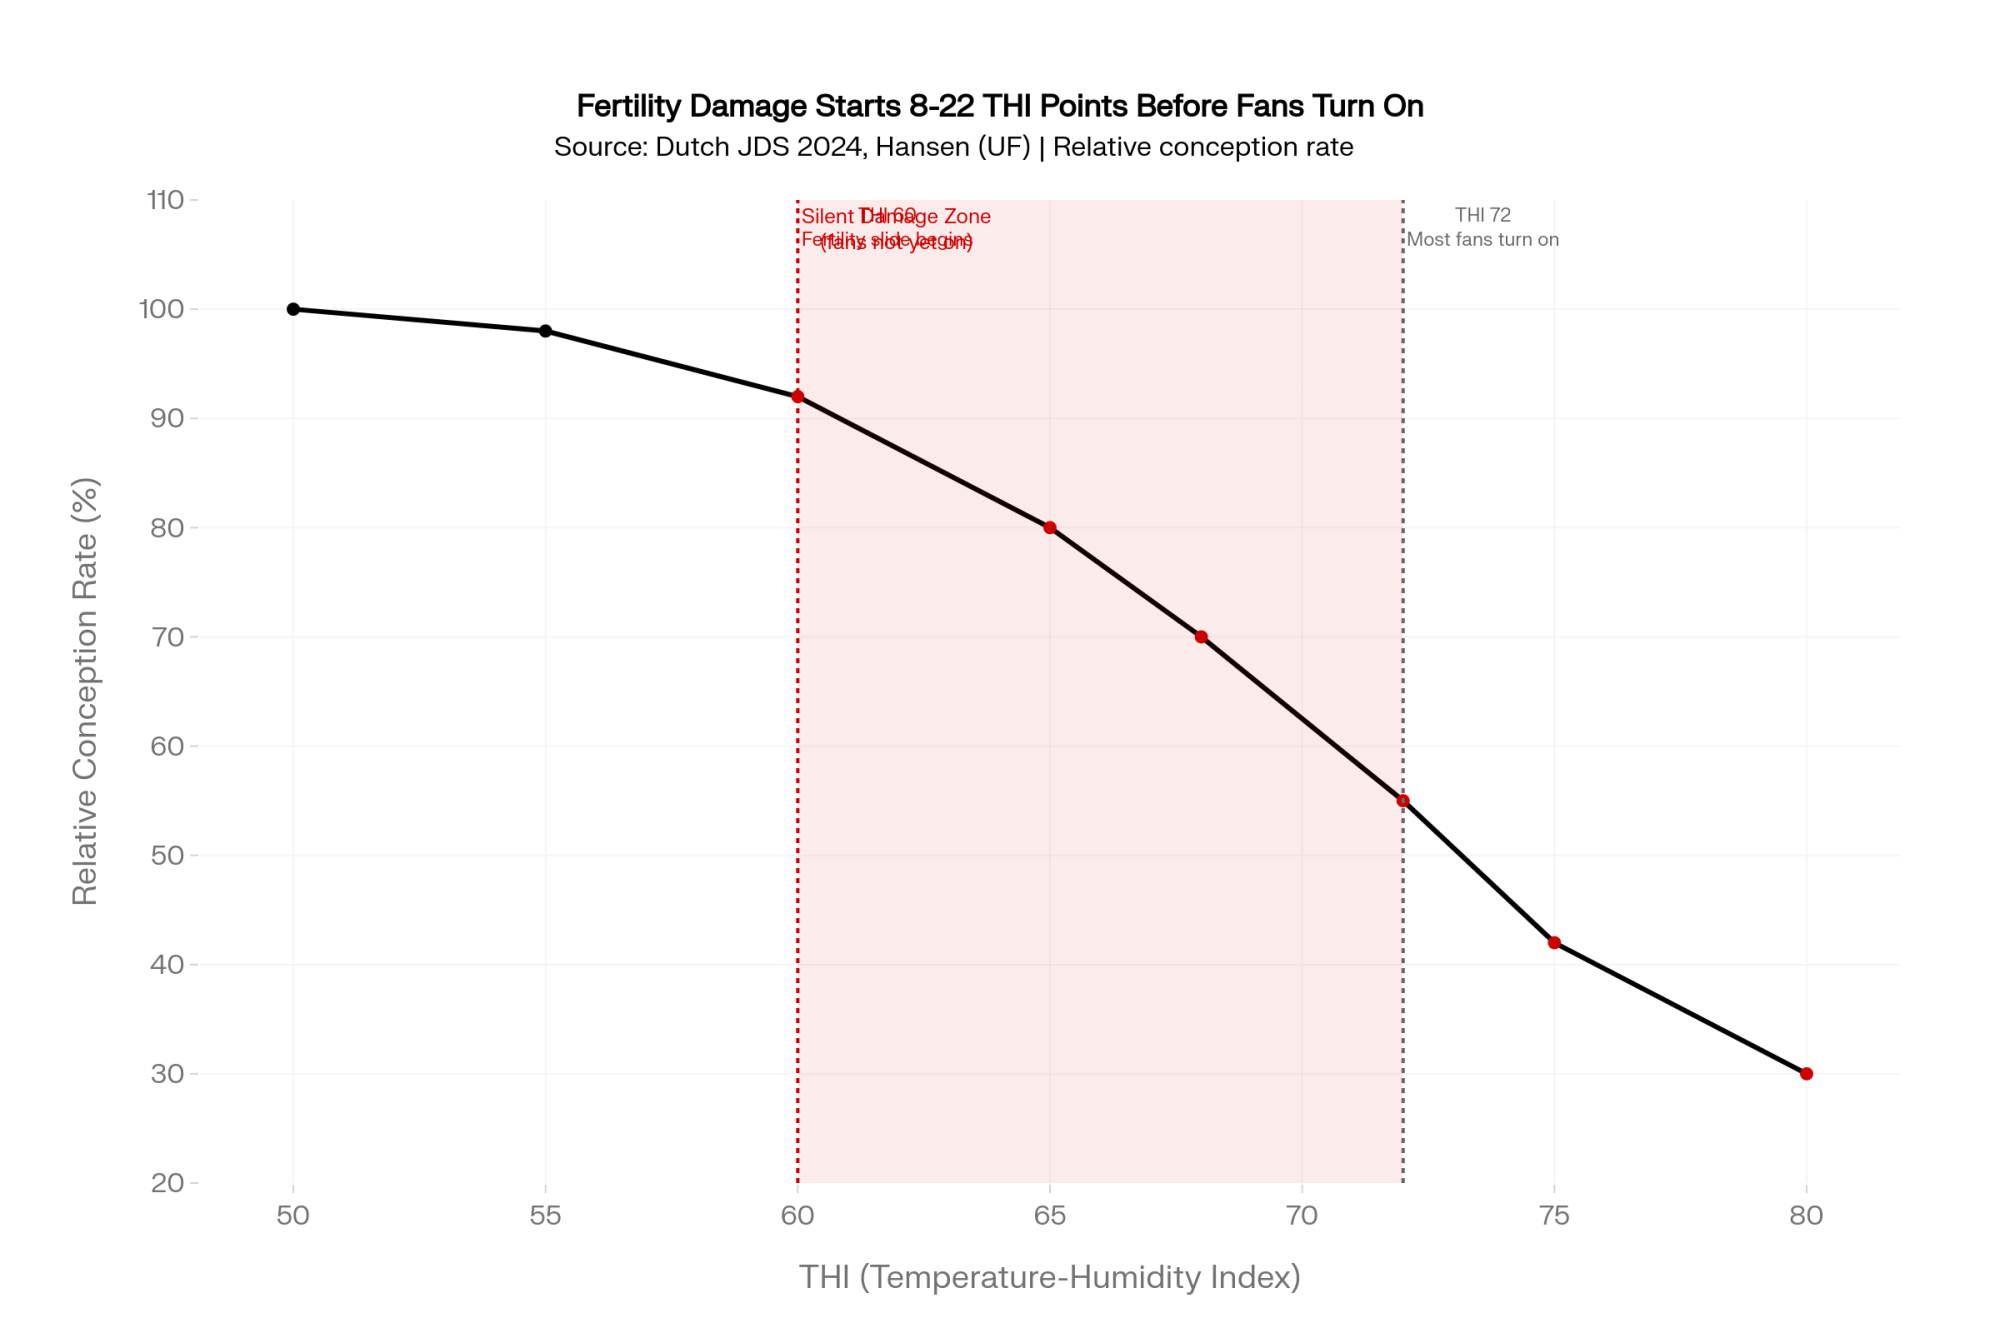
A 2024 Dutch study published in the Journal of Dairy Science matched reproduction records for hundreds of thousands of first-parity Holsteins against daily THI. The calving-to-first-insemination interval and the overall calving interval began to stretch at THI 50. Conception rate and first-to-last-insemination interval started to slide at THI 60 — a full 8 to 22 points before most cooling systems respond.
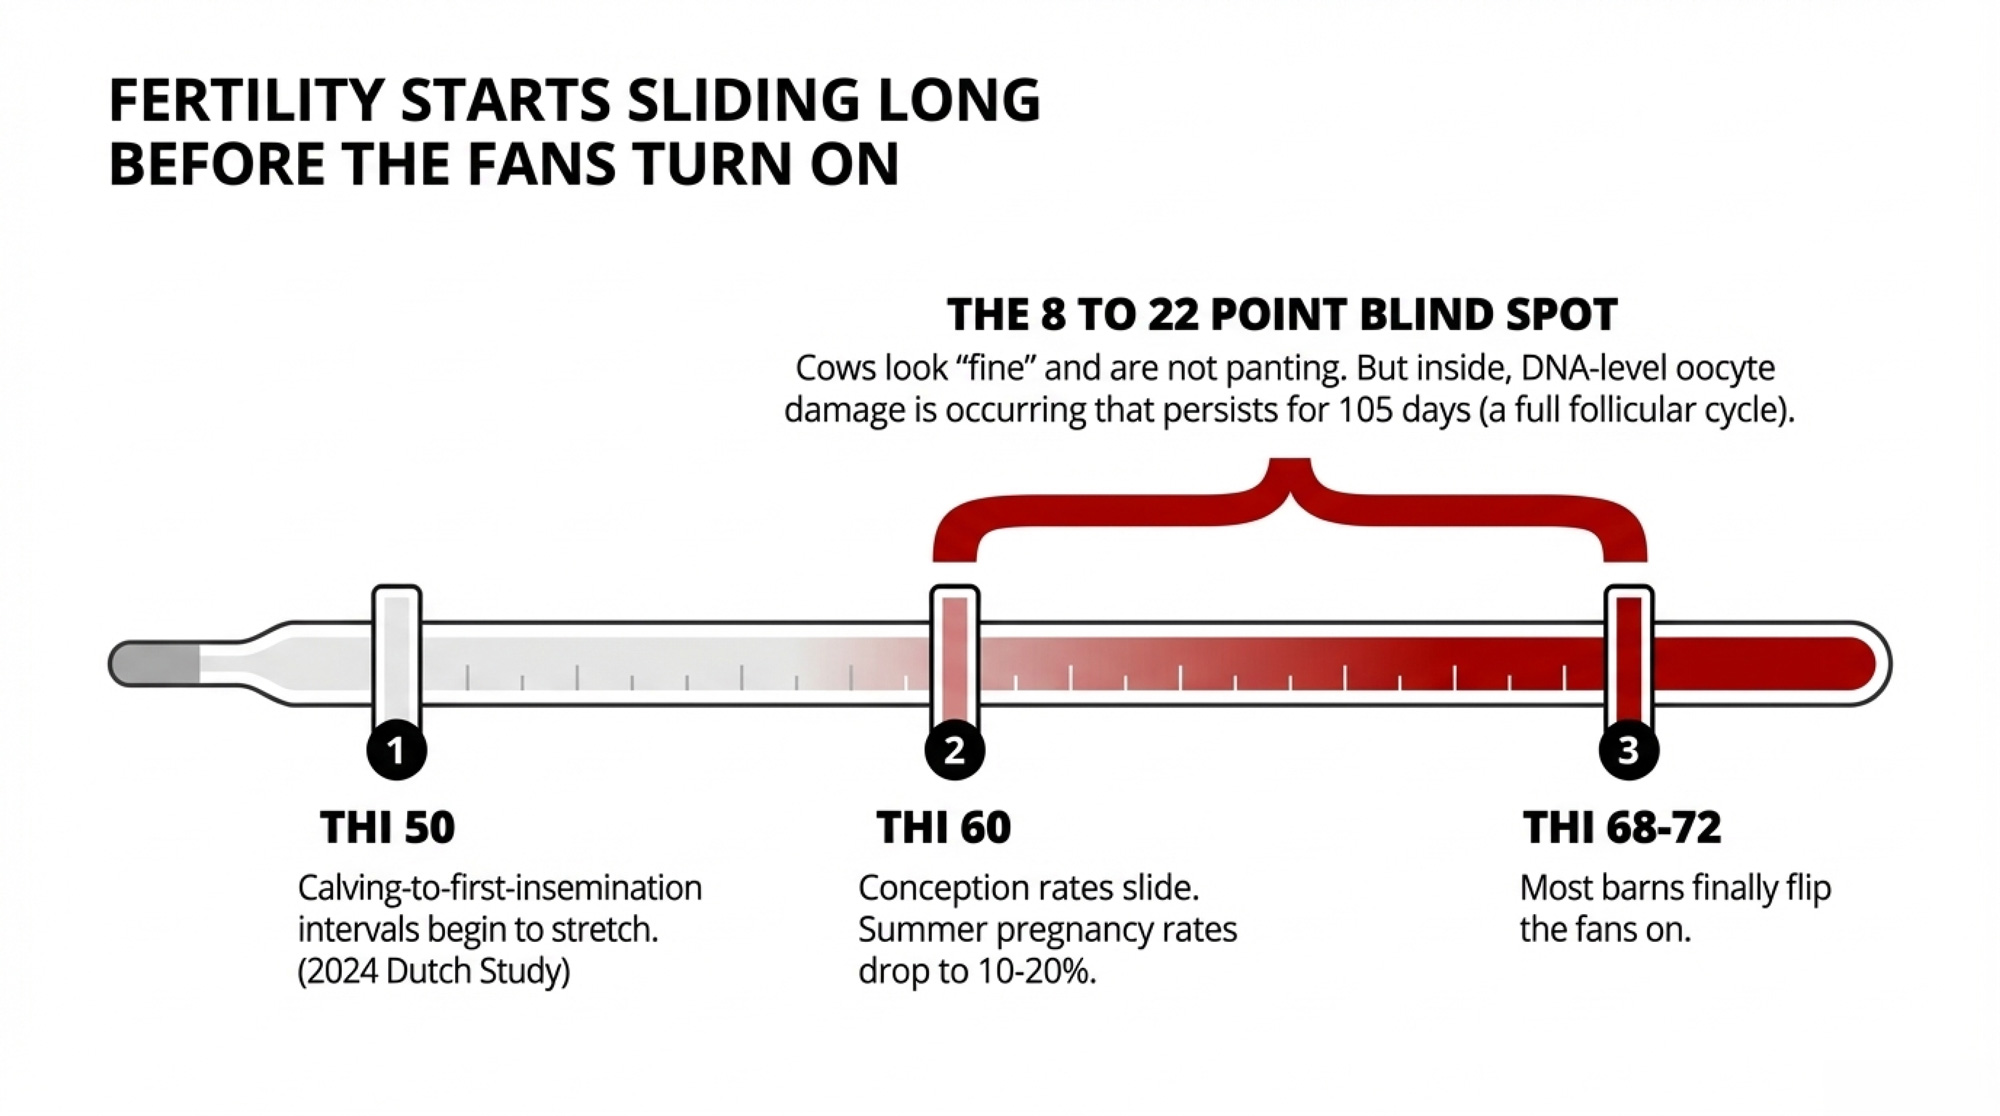
At THI 60, the barn looks fine. No panting. Cows lying down. But inside the cow, the damage is already stacking up. Peter Hansen’s work at the University of Florida explains why: heat disrupts hormonal signaling during follicular growth, damages developing oocytes at the DNA level, and reduces the proportion of embryos that reach the blastocyst stage — the point where implantation becomes possible. In many of Hansen’s experiments, the oocyte still got fertilized. It just couldn’t develop properly afterward.
Hansen and Aréchiga reported that summer pregnancy rates per insemination can drop to 10–20%, roughly half to a third of those in cool weather. And oocyte damage persisted for about 105 days after the heat event ended — a full follicular cycle.
Your July heat isn’t just a July problem. It’s why September pregnancy rates sag, fall synch costs climb, and replacement numbers look thin the following spring. None of that shows up in $74.
The Feed Efficiency Staircase
On the production side, deterioration under heat stress is predictable and stepwise. NRC-based modeling, echoed in extension presentations and on-farm data, maps what you’ll see from the parlor:
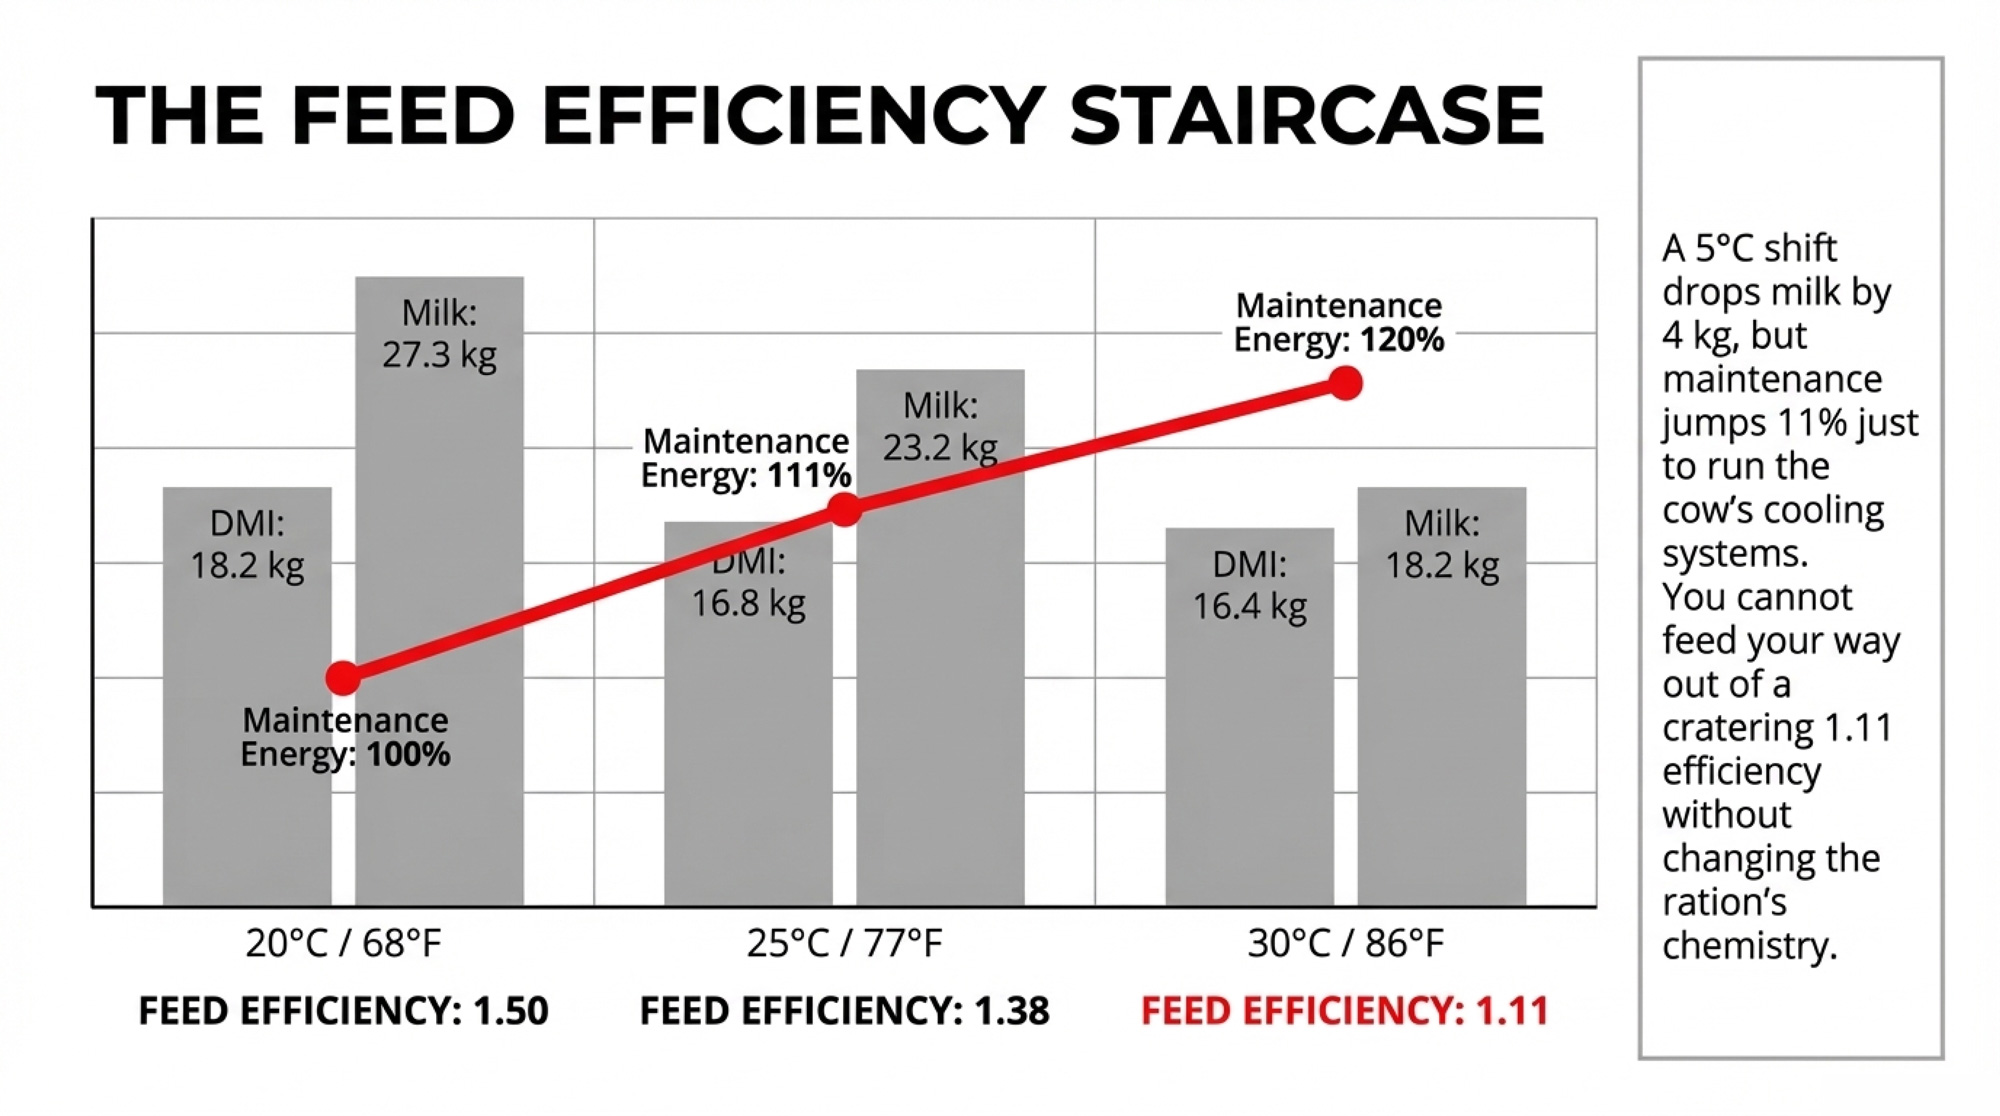
| Barn Temperature | Maintenance Energy | DMI Needed | DMI Consumed | Milk (kg) | Feed Efficiency |
| 20°C (68°F) | 100% | 18.2 kg | 18.2 kg | 27.3 | 1.50 |
| 25°C (77°F) | 111% | 19.1 kg | 16.8 kg | 23.2 | 1.38 |
| 30°C (86°F) | 120% | 19.5 kg | 16.4 kg | 18.2 | 1.11 |
Between 20°C and 25°C — a shift you can get in a single afternoon — the cow drops about 4 kg of milk while eating 1.4 kg less dry matter. She needs more energy, not less, because maintenance jumped 11% just to run her cooling systems. By 30°C, feed efficiency has cratered from 1.50 to 1.11. That’s a completely different economic animal.
But a lower intake only accounts for part of the milk loss. Heat-stressed cows actively repartition nutrients — more glucose gets diverted to survival and heat dissipation, less reaches the udder. You’re fighting on two fronts at once: holding DMI and persuading the cow to send those nutrients back to the bulk tank. Throwing more grain and fat on top of a spring mineral program can raise the feed bill without recovering the milk.
Is Your Summer DCAD Still Running on Spring Settings?
If there’s one number to check before the heat arrives, it’s DCAD.
Most lactating rations sit around +200 to +250 mEq/kg DM. Fine in cool weather. Under heat stress — when cows lose sodium, potassium, and bicarbonate through sweat and faster respiration — that margin gets tight fast.
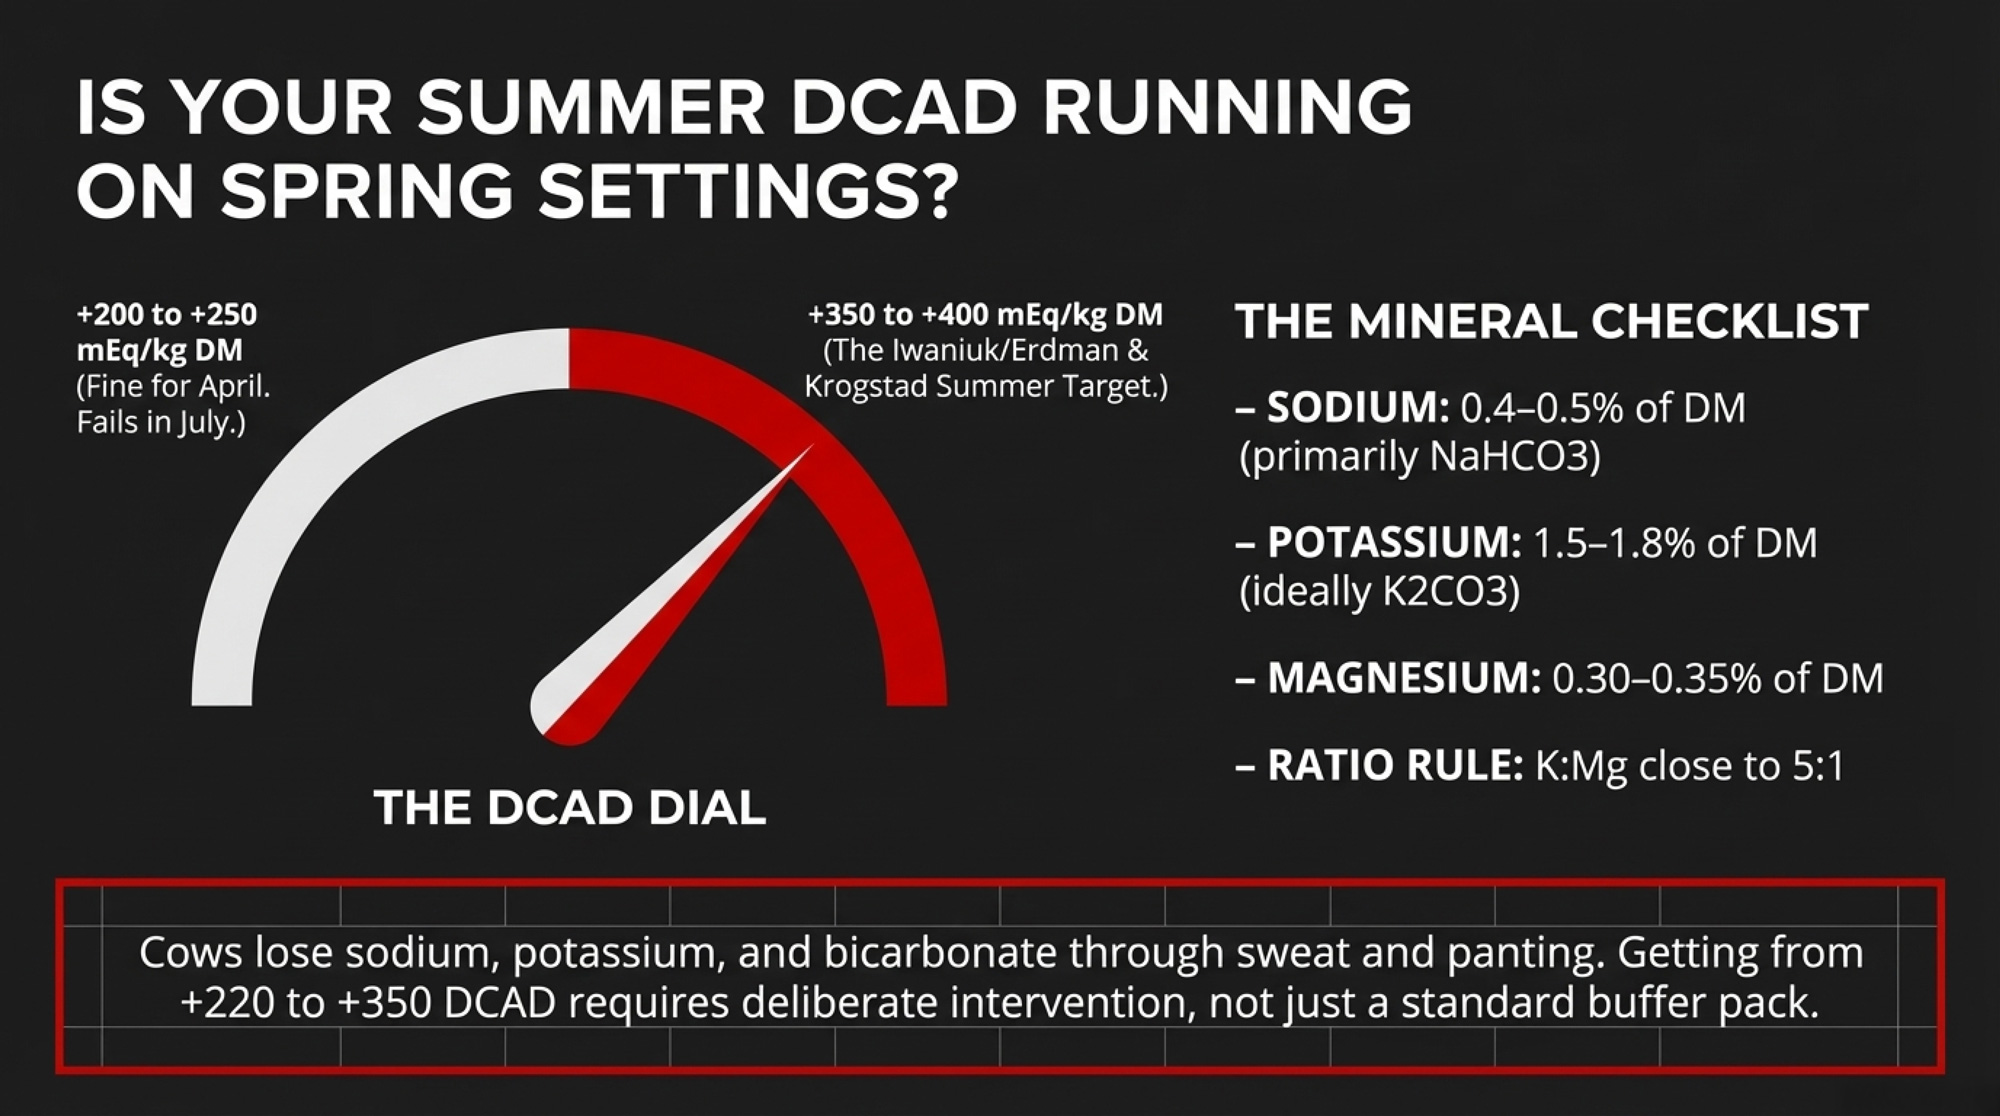
The 2015 Iwaniuk and Erdman meta-analysis in the Journal of Dairy Science found that milk fat yield and concentration continue to increase as DCAD rises, reaching 400–500 mEq/kg DM. DMI and milk yield plateau between 200 and 300. A 2025 review by Kirby Krogstad at Ohio State, summarized in the Buckeye Dairy News, recommends ≥300 mEq/kg DM for milk fat production, with practical heat-stress targets pushing into the mid-300s to 400 mEq/kg DM range.
Summer mineral targets for high cows, drawn from extension guidelines and applied nutritionist recommendations:
- Sodium: 0.4–0.5% of DM, primarily from sodium bicarbonate
- Potassium: 1.5–1.8% of DM, ideally from potassium carbonate
- Magnesium: 0.30–0.35% of DM, with K: Mg close to 5:1
- DCAD: >+350 mEq/kg DM, with some research pointing to a “sweet spot” near 400
Getting from a +220 DCAD spring ration to the +350–+400 band with those mineral levels puts you in the zone the research actually supports. Pull real summer rations across dairy farms, and a lot of them are still April diets with a bit more buffer and whatever potassium was cheapest.
The Potassium Source Question: Does KCl Actually Move Your DCAD?
This is the part of the summer ration that gets the least scrutiny and probably costs the most in unrealized response.
| Mineral | Cool-Season Baseline | Heat-Stress Target | Notes |
|---|---|---|---|
| Sodium | 0.18–0.22% DM | 0.40–0.50% DM | Primarily from NaHCO₃ |
| Potassium | 1.0–1.2% DM | 1.5–1.8% DM | Prefer K₂CO₃ as primary lever |
| Magnesium | 0.20–0.25% DM | 0.30–0.35% DM | K:Mg ratio target ~5:1 |
| DCAD | +200–+250 mEq/kg | +350–+400 mEq/kg | <span style=”color:red”>Gap = where fat pounds disappear</span> |
| Chloride | Managed for DCAD balance | Keep low in lactating | KCl adds Cl without DCAD benefit |
Potassium chloride is familiar and cheaper per unit of K. It checks the box on the ration printout. But chloride salts make no net contribution to positive DCAD — the chloride anion essentially offsets the potassium cation on a milliequivalent basis. You add potassium. Chloride takes it right back. Potassium carbonate, by contrast, delivers roughly 20% more DCAD per kilogram than sodium bicarbonate, and the carbonate anion provides direct rumen buffering.
Classic Clemson work, referenced in several extension programs, demonstrated that KCl doesn’t have the same impact on heat-stressed cattle as K₂CO₃. Tom Jenkins at Clemson tested this directly — first in vitro, then in live cows.
A 2014 Journal of Dairy Science continuous-culture study increased potassium from about 1.2% to 2.0% of DM using K₂CO₃ and tracked rumen biohydrogenation. The shift was clear: more stearic acid and cis-9, trans-11 CLA, fewer trans-10 intermediates — the fatty acid profile associated with higher milk fat.
Then came the cow trial. Jenkins and colleagues (2017, JDS) fed 35 early-lactation Holsteins one of five diets: a high-concentrate control (DCAD ~65 mEq/kg), K₂CO₃ (DCAD ~326), KHCO₃ (DCAD ~324), KCl (DCAD ~64), or Na₂CO₃ (DCAD ~322). Results:
- Milk fat concentration: K₂CO₃ pushed fat to 4.03% versus 3.26% for the control — a 0.77 percentage point lift.
- Total fat yield: Did not significantly improve, partly because milk volume tended to decrease with K₂CO₃ compared to KCl under that extreme diet.
- Biohydrogenation pathway: Trans-10 18:1 was higher with Na₂CO₃ than with K₂CO₃, indicating K₂CO₃ specifically favored the pathway associated with normal milk fat.
Two honest caveats. This trial used a very high-concentrate diet (47% NFC) designed to stress milk fat, and the DCAD jump — from 65 to 326 — is much larger than the jump from a spring ration to a summer formulation. The decrease in milk volume with K₂CO₃ likely reflects those extreme conditions. In a more typical TMR, expect a more moderate response.
The piece that actually matters on-farm: when the same potassium level came from KCl, DCAD remained stuck at ~64 mEq/kg, and the favorable fat shifts didn’t appear. Chloride blunted the effect.
One thing worth being clear about: KCl is still the right product for close-up dry cow programs targeting a negative DCAD, and it can meet potassium requirements in rations where DCAD is already on target from other buffering sources. The problem is specific — using KCl as the primary lever to push DCAD higher in a heat-stress lactating ration.
| Feature | KCl | K₂CO₃ |
| Net DCAD impact | Mostly neutral — Cl⁻ offsets K⁺ | Strongly positive — ~20% more DCAD/kg than NaHCO₃ |
| Rumen buffering | None | Direct buffering effect |
| Fat concentration (Jenkins 2017) | No improvement; DCAD stayed at ~64 mEq/kg | +0.77 points vs. control (4.03% vs. 3.26%) |
| Cost per unit K | Lower | Higher |
| Best use | Close-up dry cows (negative DCAD); meeting K when DCAD already on target | Summer DCAD push + fat support under heat stress |
Why Potassium Reaches the Udder — Not Just the Rumen
This isn’t just a rumen story. It reaches the mammary gland, and that’s why a heat-stressed cow losing potassium through sweat isn’t just depleting a mineral. She’s losing her ability to make milk.
Every cell runs a sodium-potassium pump (Na⁺/K⁺-ATPase) that maintains the electrochemical gradient the cell needs to function. Foundational work by Linzell and Peaker in the 1970s identified this pump on mammary epithelial cell membranes and measured intracellular potassium in mammary tissue at approximately 115 mEq/L in guinea pigs, with similar values later confirmed in ruminant models.
Potassium is the primary cation in bovine sweat. Losses spike in hot weather. As circulating K drops, the Na/K pump can’t hold its gradient as effectively. That matters because glucose is the primary precursor for lactose — the sugar that acts as the udder’s osmotic engine, drawing in water and essentially setting milk volume. Mammary cells take up glucose through GLUT1 transporters and convert it to lactose. That whole chain depends on the Na/K pump keeping the cell environment intact.
Every individual link here is well established in dairy physiology. The full end-to-end pathway — heat depletes K, depleted K weakens the mammary pump, weakened pump reduces glucose uptake and lactose synthesis, lower lactose means less milk — hasn’t been demonstrated in a single published study. But the pieces are solid. And they explain why the form of potassium matters: supplying K as chloride in a heat-stress ration may satisfy the K requirement on paper while doing nothing for DCAD, nothing for rumen buffering, and leaving the cow’s acid-base balance to sort itself out.
How Much Extra Butterfat Can K₂CO₃ and DCAD Actually Buy You?
Take a high group averaging 90 lb of milk at 3.70% fat. That’s about 3.33 lb of fat per cow per day. A K₂CO₃-based DCAD shift that conservatively bumps fat to 3.95% — a 0.25-point lift, well under the 0.77-point trial result in Jenkins’ extreme diet — puts you at roughly 3.56 lb of fat. Extra: 0.23 lb per capra al giorno.
U.S. butterfat pricing context as of early 2026: USDA AMS data showed butterfat around $1.45/lb in January, recovering to $1.78/lb in February, with CME futures pointing to summer 2026 (June–August) butterfat in the $2.29–$2.35/lb range. For barn math heading into the heat season, $2.00–$2.20/lb tracks with where summer futures sit.
At $2.00–$2.20/lb, that extra 0.23 lb is worth roughly $0.46–$0.51 per cow per day in gross component value.
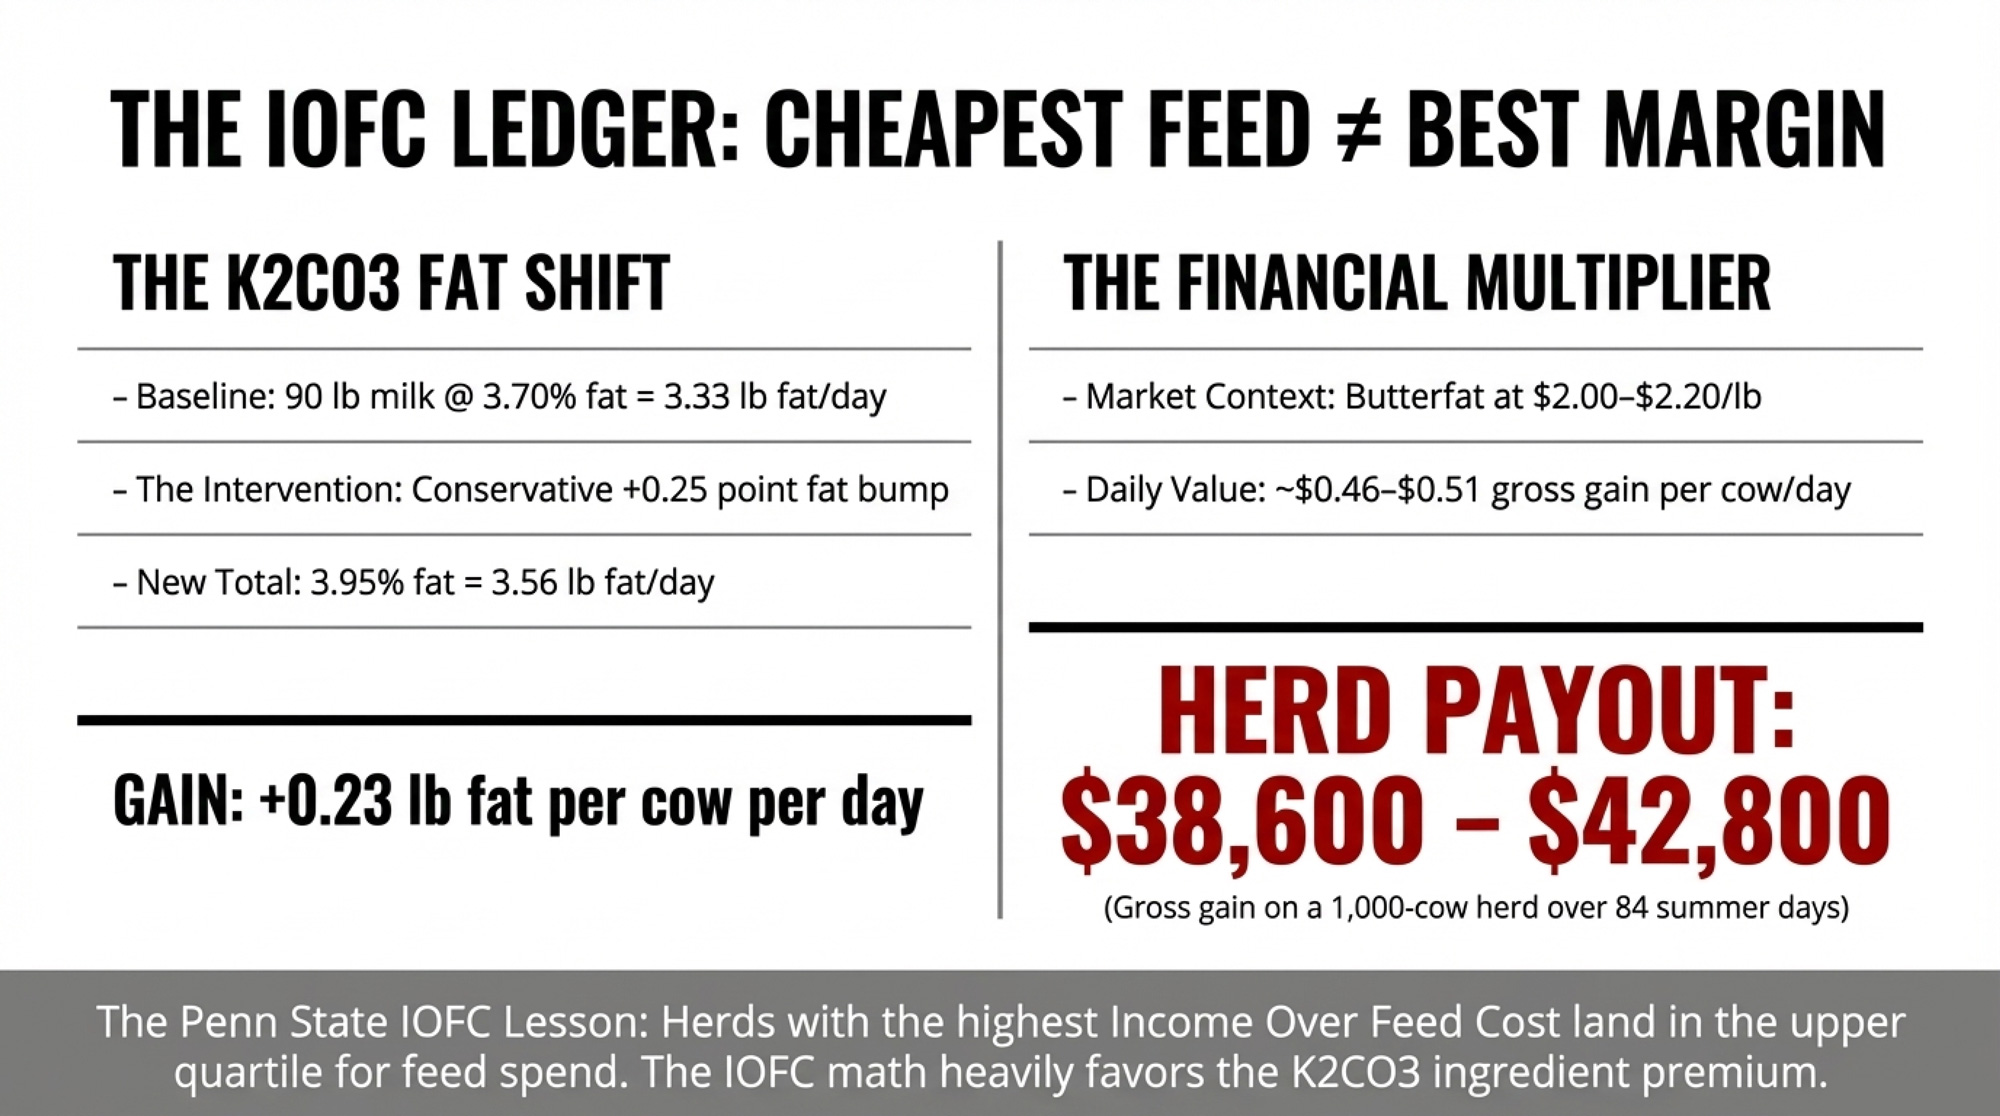
On a 1,000-cow herd over 84 summer days, the gross butterfat gain lands around $38,600–$42,800. Scale that to a 300-cow herd and you’re still looking at roughly $11,600–$12,800 — real money, not rounding error.
The K₂CO₃ ingredient premium is real. Industrial potassium carbonate runs roughly $1,600–$1,800/MT versus $300–$500/MT for feed-grade KCl. Your per-cow-per-day cost depends on inclusion rate and your premix supplier’s margin — get a current quote before you commit. But even after netting out that ingredient premium, the IOFC math favors K₂CO₃ at summer 2026 U.S. butterfat futures. If butter drops back toward January’s $1.45 floor, the math tightens. One more reason to track component pricing alongside the ration cost, not in isolation.
Cheapest Feed ≠ Best Margin: The IOFC Lesson
The potassium decision fits a bigger pattern that keeps showing up in herd economics.
A 2014 Journal of Dairy Science study from Penn State examined IOFC records from 95 Pennsylvania herds between 2009 and 2012. The mean IOFC was about $7.71 per cow per day at that era’s prices. The herds with the highest IOFC weren’t the ones spending the least on feed. They landed in the upper quartile for feed cost — $6.27 or more per cow per day at those 2009–2012 price levels.
In plain terms, the herds that spent more on the right inputs made more money. Squeezing purchased feed cost didn’t maximize margin then, and there’s no reason to think the principle has changed.
Judge potassium on cost per ton, and chloride wins every time. Judge it on IOFC per cow per day under heat stress — factoring in butterfat, rumen function, and the actual DCAD shift — and K₂CO₃ starts looking like the investment the ration model alone won’t show you.
You Still Can’t Out-Ration a Hot Barn
All the DCAD and potassium math assumes the infrastructure basics are covered first.
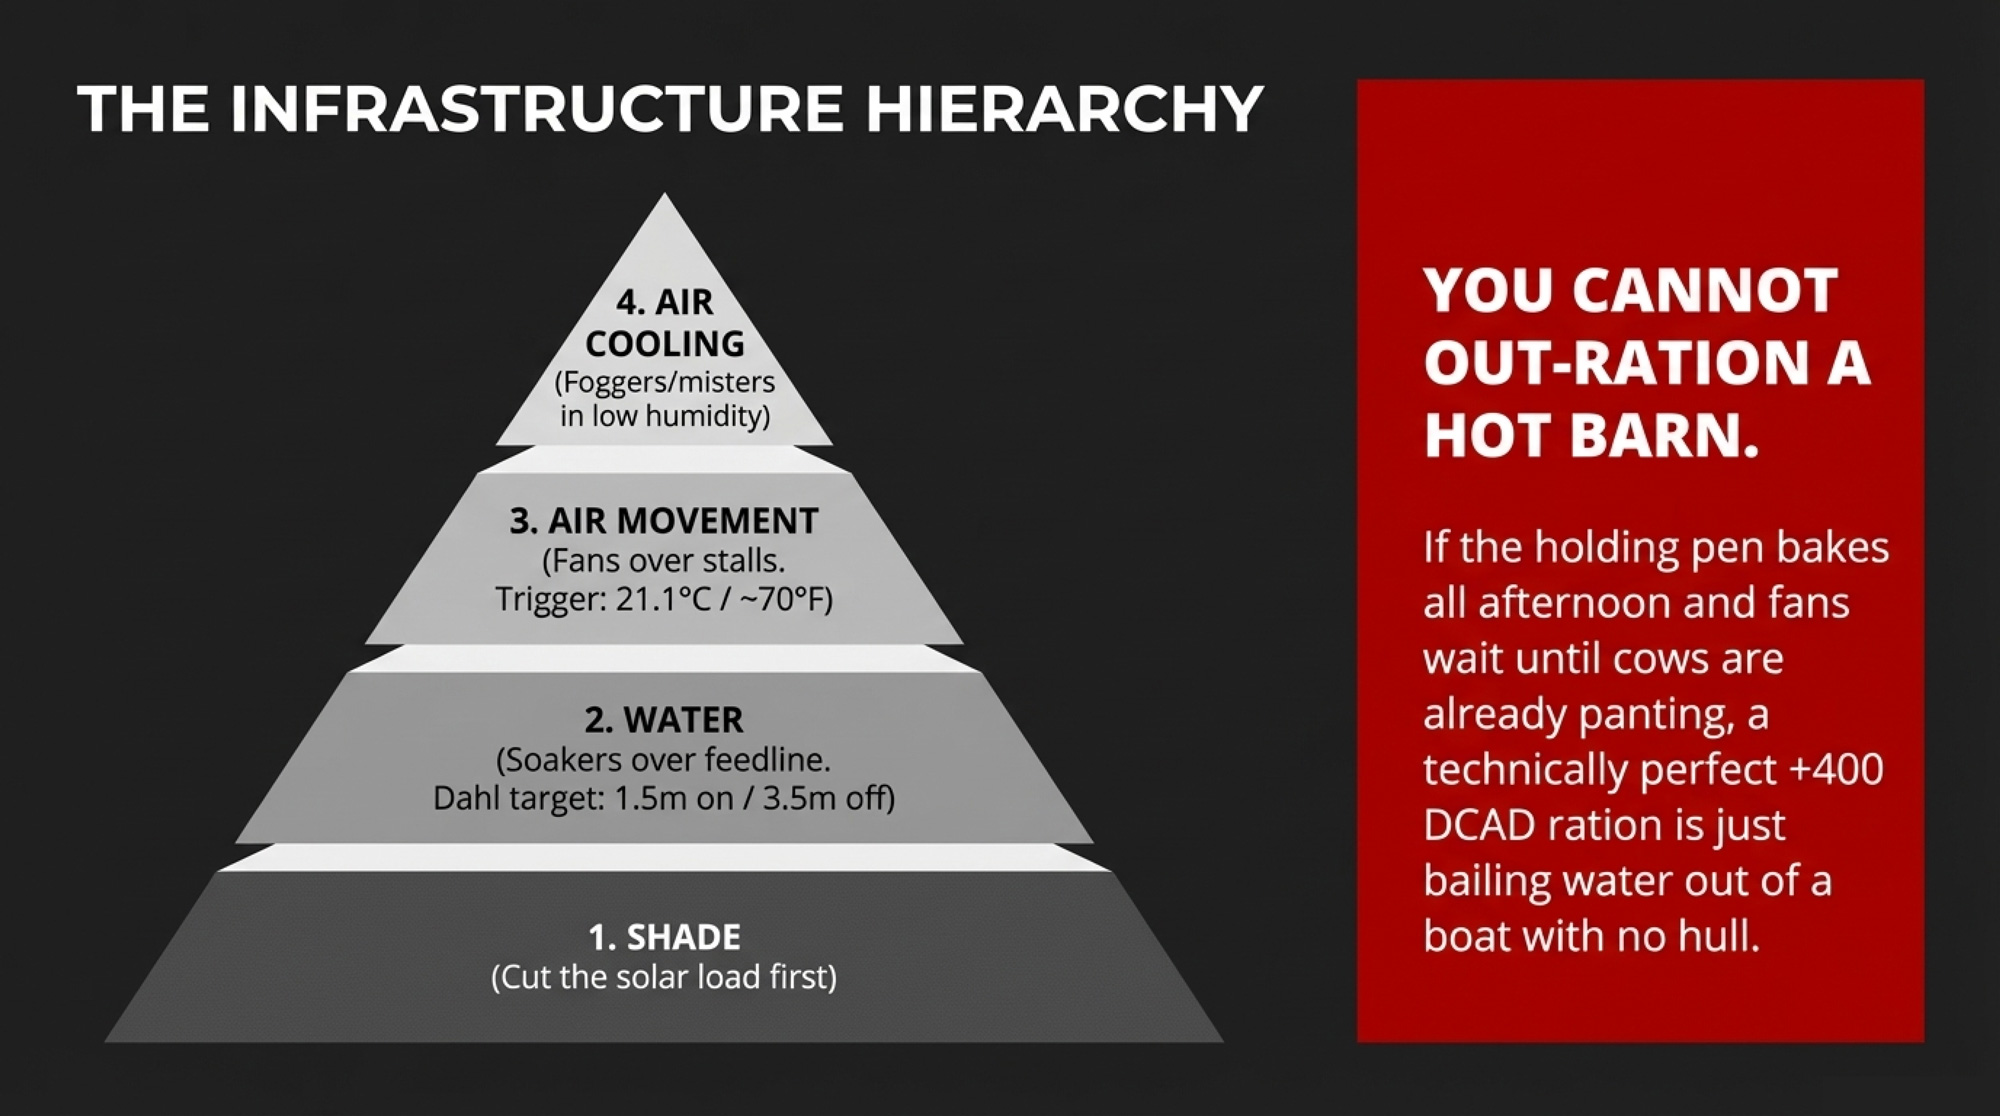
Kansas State’s heat abatement priority list stays simple and right-side-up: shade first to cut solar load, then water on cows via soakers, then air movement from fans, then air cooling (foggers or misters) where humidity is low enough.
Jeff Dahl at the University of Florida has documented a well-managed Gainesville setup: sand-bedded freestalls, fans over stalls, soakers over the feedline. Fans come on at 21.1°C. Soakers cycle 1.5 minutes on, 3.5 minutes off, starting at 22°C. Both activation points are deliberately set before visible cow distress.
Given the Dutch fertility data showing damage at THI 50–60, “early” cooling likely refers to earlier than most operations currently practiced. If the holding pen bakes through the afternoon and fans don’t start until cows are already panting, even a technically perfect ration is bailing water out of a boat with no hull.
What This Means for Your Operation
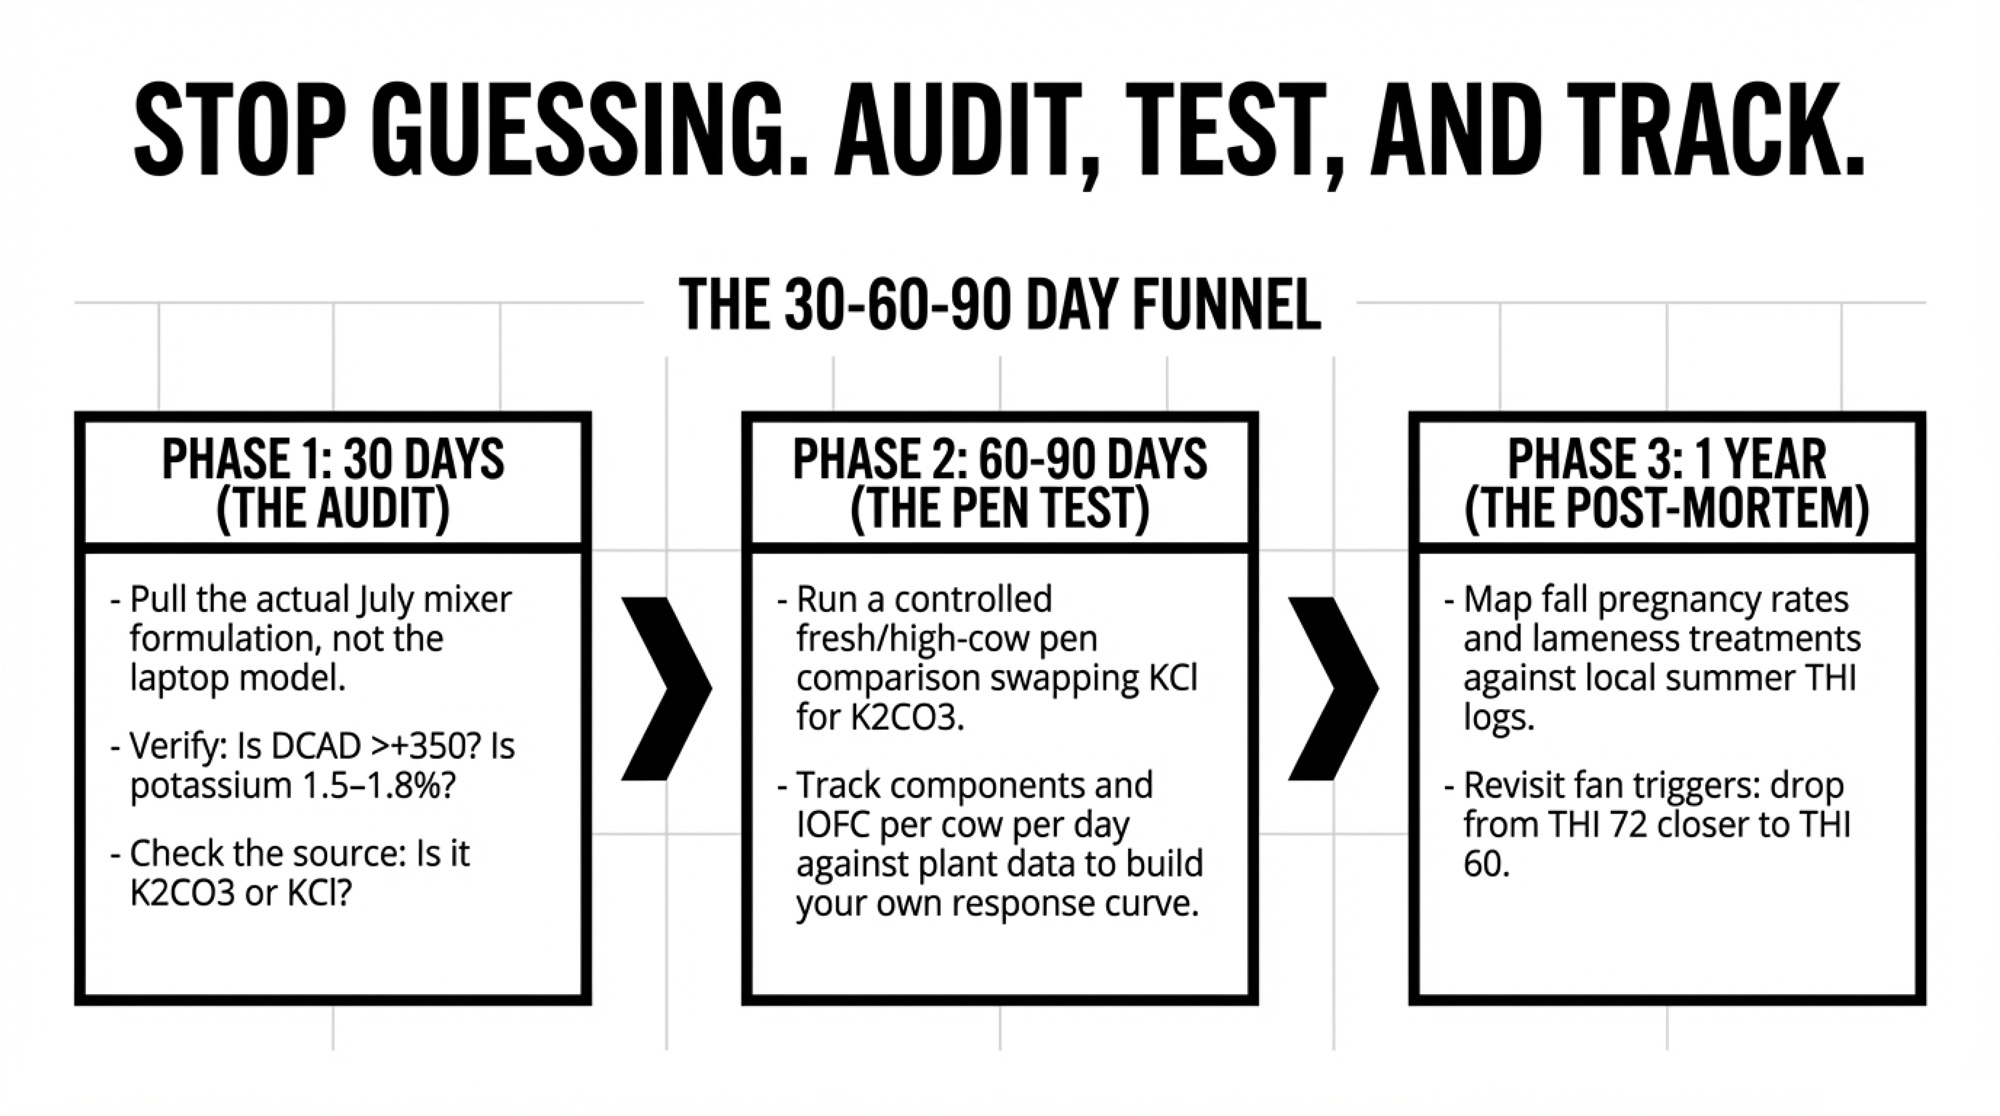
In the next 30 days, pull your actual summer ration and check the DCAD.
Not the model on a laptop — the formulation that matches what’s going on in the mixer come July. Is DCAD at +350 or higher, or still sitting in the +200–+280 band? Is potassium coming from K₂CO₃ or KCl? Are sodium (0.4–0.5%), potassium (1.5–1.8%), and magnesium (0.30–0.35%) in heat-stress ranges, with K: Mg close to 5:1? If those numbers look like April while the barn feels like July, you’ve found a concrete place to move.
Over 60–90 days, run a controlled pen comparison this summer.
If you have the pen structure, take one group — fresh or high-cow — and swap part or all of the KCl for K₂CO₃ while keeping the total potassium similar. Track components and IOFC per cow per day for a full 60–90 days. No signal? You’ve bought clarity relatively cheaply. Signal shows up? Now you’ve built your own response curve instead of relying on trial averages. You’ll need pen-level component data from your plant. If that’s not available, start with the 30-day DCAD audit.
Over the next year, tie your fall reproduction back to summer.
Pull the pregnancy rate by month and the lameness treatments for the past two years. Lay them alongside local THI data, and when your cooling is actually activated. If September and October sag every year, you’re probably looking at the delayed invoice for summer heat — not a run of bad luck.
Revisit your cooling trigger points.
Given the Dutch data showing fertility damage around THI 60, ask whether fans and soakers should kick on well before cows show visible distress. Dropping the activation trigger from THI 72 into the low 60s costs electricity. Losing pregnancies costs a lot more.
Pick the right benchmark when you price heat investments.
When you’re quoting fans, soakers, shade, or a mineral shift, are you measuring the return against $74, $120, or the full picture? Cook’s figures are milk-loss anchors — regional and conservative. Dahl’s UF estimate accounts for reproduction and long-term effects at the national scale. Whatever number you use to say “too expensive” should match what the research actually says heat stress costs you.
Key Takeaways
- If your summer DCAD sits below +300 mEq/kg and your potassium comes from chloride, your ration likely isn’t delivering the DCAD shift the research supports. The Iwaniuk/Erdman meta-analysis and current Ohio State recommendations both point to +350–+400 as the working target under heat stress.
- If your cooling system activates at THI 68–72, the Dutch fertility data on hundreds of thousands of cows suggest you’re missing 8–22 THI points of damage every summer. The conception rate began declining at a THI of 60. That gap is where pregnancies quietly disappear.
- If you’re selecting a potassium source based on price per ton, you may be optimizing the wrong line on the ration sheet. KCl doesn’t move DCAD, doesn’t buffer the rumen, and doesn’t produce the fat concentration response that K₂CO₃ did in Jenkins’ Clemson work. A conservative 0.25-point fat bump on 1,000 cows over 84 summer days is worth roughly $38,600–$42,800 gross at current U.S. butterfat futures — but only if the ingredient actually shifts DCAD.
- If your heat-stress budget is still anchored to a milk-loss-only estimate, you’re accounting for the visible hit but ignoring the rest. Cook’s own updated $120/cow/year for Wisconsin doesn’t include fertility, lameness, or culling. Dahl’s UF group puts the national figure above $1.5 billion. The real number for your operation depends on which costs you’re willing to count.
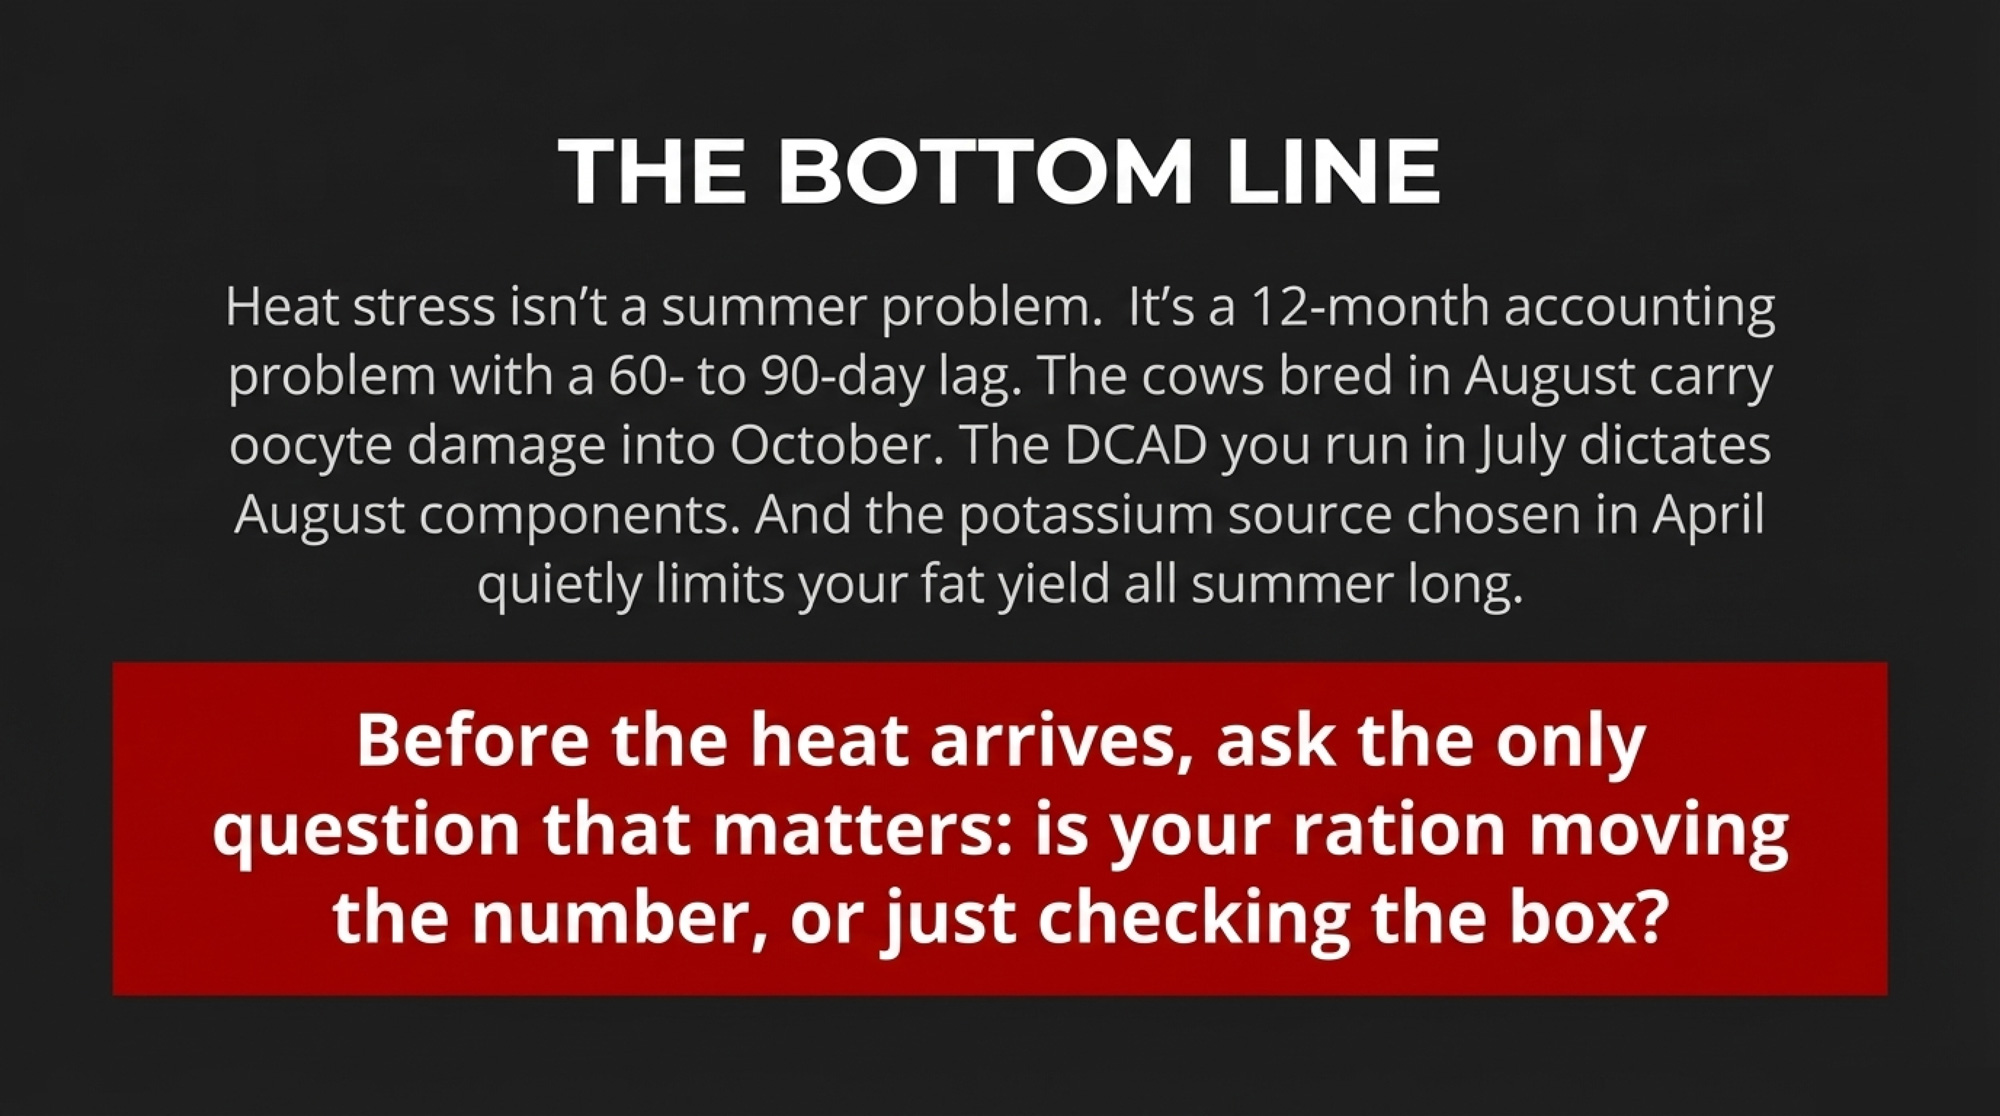
The Bottom Line
Heat stress isn’t a summer problem. It’s a 12-month accounting problem with a 60- to 90-day lag. The cows you breed in August carry that oocyte damage into October pregnancy checks. The DCAD you run in July shows up in the August components. And the potassium source you chose in April — because it was cheaper per ton — quietly costs you fat pounds all summer long. Before the heat arrives, pull the real ration, check the real DCAD, and ask the one question that actually matters: is your potassium moving the number, or just checking the box?
Complete references and supporting documentation are available upon request by contacting the editorial team at editor@thebullvine.com.
Learn More
- The $7200 Lameness Fix That Beats $45000 Technology – Stop hemorrhaging cash on hidden lameness costs with this high-impact “Monday morning” protocol. This breakdown delivers a proven $7,200 prevention bundle that slashes cases by 50%, saving you thousands compared to over-engineered detection systems.
- The $16/CWT Reality: Why Mid-Size Dairies Can’t Out-Work Structural Economics – Secure your operation’s future by bridging the massive margin gap between mid-size herds and mega-dairies. This 2026 strategic roadmap reveals how precision feeding and beef-on-dairy revenue protect your equity against structural economic shifts.
- Slick Genetics Revolution: How One Gene Could Save Dairy Farmers $5,000 Per Cow Lifetime – Why settle for reactive fans when you can breed for permanent heat tolerance? This guide exposes how the SLICK gene mutation delivers a 70% stress reduction, offering a generational advantage infrastructure cannot match.
 The Sunday Read Dairy Professionals Don’t Skip.
 The Sunday Read Dairy Professionals Don’t Skip.
Every week, thousands of producers, breeders, and industry insiders open Bullvine Weekly for genetics insights, market shifts, and profit strategies they won’t find anywhere else. One email. Five minutes. Smarter decisions all week.


