


Holstein USA’s million‑cow study found a $2,678 lifetime gap tied to conformation. The question isn’t if it’s real—it’s how close your herd is to the wrong side of it.
Executive Summary: Holstein USA’s 2022 “Conformation Matters” study, based on nearly a million cows, found a $2,678 lifetime milk revenue gap between top‑ and bottom‑quartile conformation cows at $20/cwt. Follow‑up genomic work in 2022–2024 has reinforced the same message: functional Holstein conformation sits right at the intersection of production, health, fertility, and longevity. The article explains why treating 0.0 STA as “safe” on traits like teat length and rear legs side view can quietly drag your herd toward a breed average that’s already too short, too straight, and too hard to milk in parlors and robots. It ties those structural shifts to real US cost models for lameness and mastitis, where individual cases commonly run $336.91 for lameness, and $120–$444 for clinical mastitis, and simple herd‑level math quickly climbs into the tens of thousands per year. From there, it lays out a practical framework: audit your herd’s linear scores, sort traits into “push harder” vs “stay in the middle,” and decide how much NM$ you’re actually willing to give up to fix genuine structural problems instead of chasing index points alone. For herds looking at robotic milking between now and 2030, it also spells out which udder and leg traits matter most for attachment, box time, and the inevitable “fallout group” that never truly fits the robot.
Holstein Association USA’s 2022 “Conformation Matters” work shows a $2,678 lifetime milk gap between top and bottom type cows. That study is a few proof runs old now, but the big genomic data sets published since 2022 are telling the same story: when you breed for functional Holstein conformation, the milk cheque and the robot both notice.
If you’re picking Holstein sires in 2025–2026, your linear type and STA choices are either pulling your herd toward that top group—or quietly pushing you the other way.
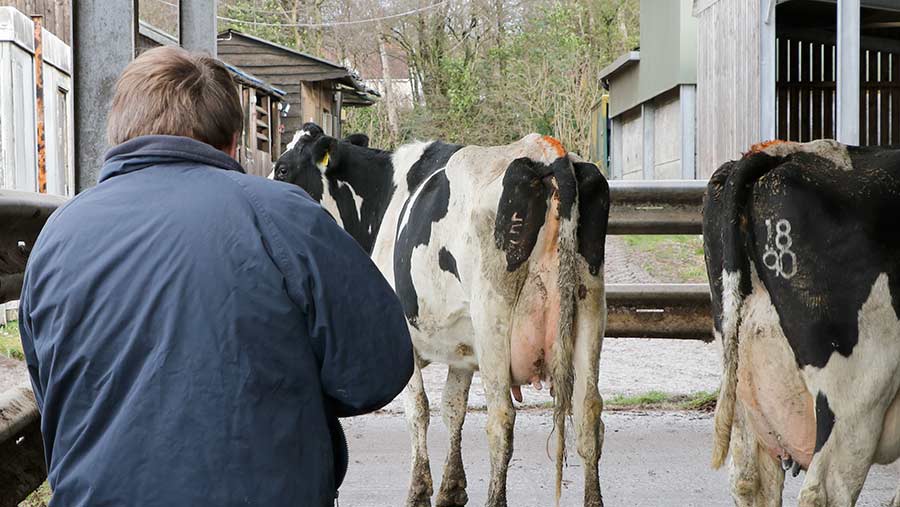
The sire looked fine on paper. Good index, solid components, the kind of proof you’d throw in the tank without much debate. Down in the type box, there was a tidy row of zeros on traits nobody around the table was actively chasing: teat length, rear legs side view, teat placement—0.0 STA across the board. Safe. Or so it seemed.
Fast‑forward to freshening. Liner slips start piling up on the milking log. The robot flags fresh heifers for failed attachments while older cows walk in, milk out, and leave like they always have. Lay the classification sheets beside those sire proofs and the pattern jumps off the page: those daughters are shorter‑teated and straighter‑legged than the cows that built the herd.
If that feels uncomfortably familiar, you’re exactly who this article is for.
When “Average” Already Means Below Functional
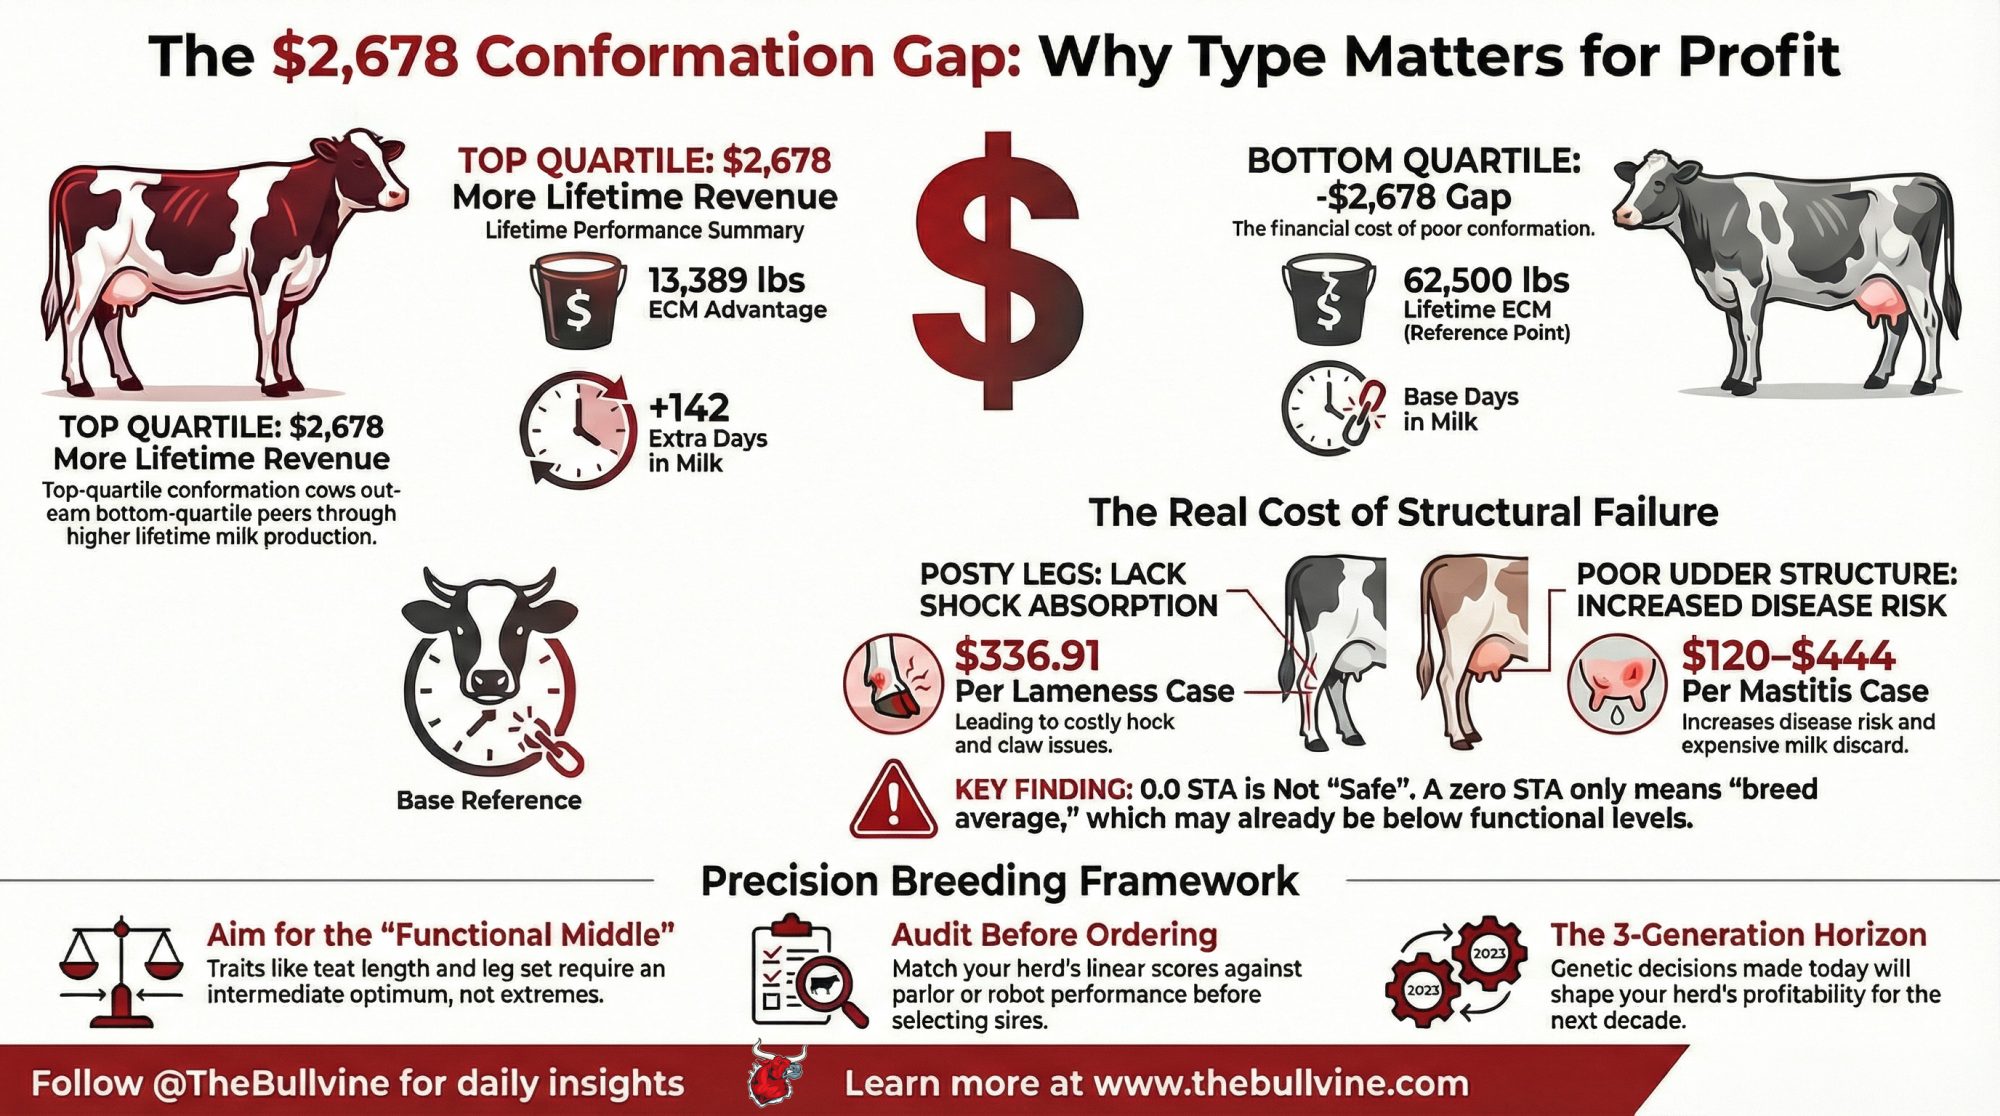
Here’s the hard truth: a zero STA doesn’t mean “ideal.” It only means “average for today’s Holstein population.”
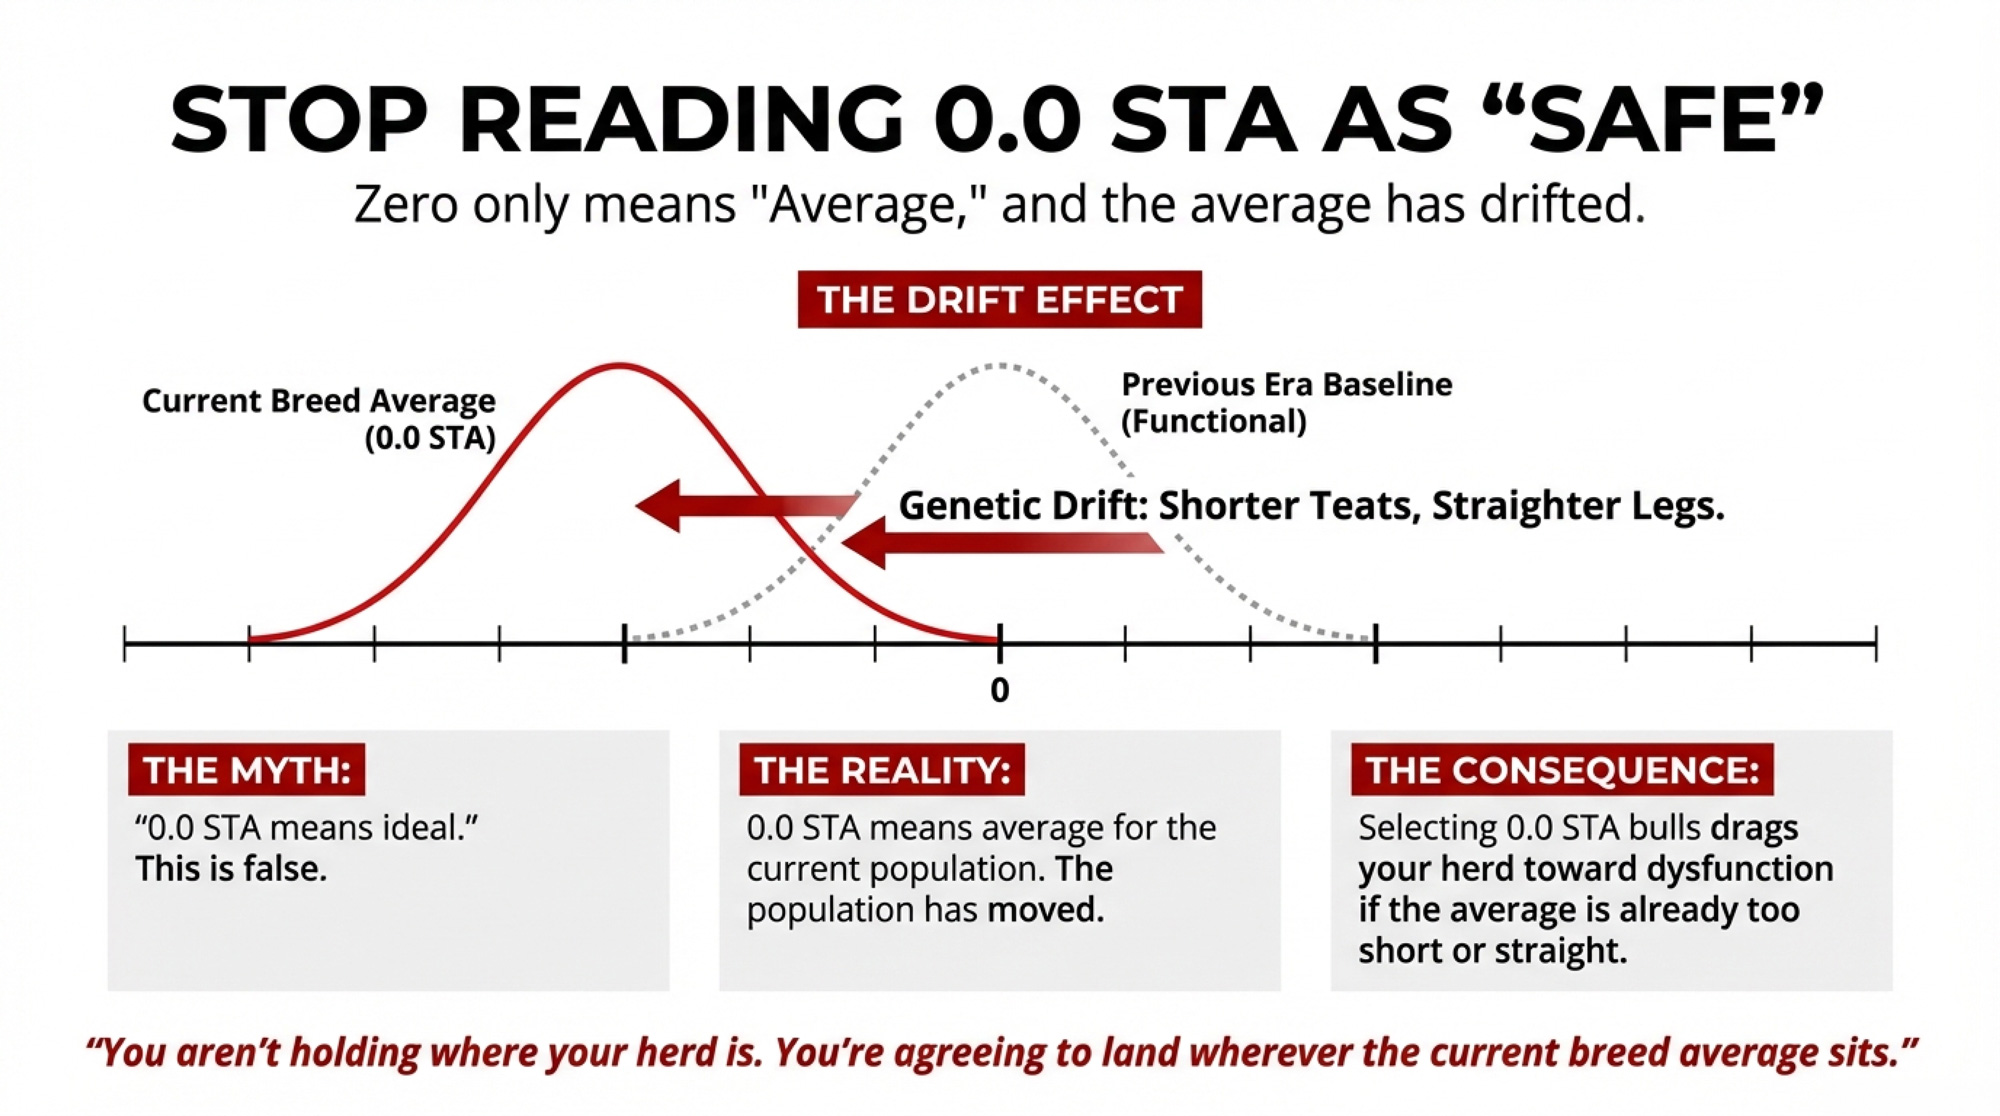
Standardized Transmitting Abilities are centered on the current breed average. Zero is just the midpoint of where Holstein conformation sits right now, after a decade‑plus of heavy use of sires like Mogul, Supersire, and their relatives. Those bulls did a lot of good—production, health, fertility—but they also shifted the baseline on a handful of traits your parlor and robot care about every single milking.
Teat length is a classic example. In many Holstein populations influenced by that sire family, proofs have leaned shorter‑teated and straighter‑legged. When you pick a bull at 0.0 STA for teat length in that context, you’re not “holding” where your herd is. You’re agreeing to land wherever the current breed average sits—even if that average is already below the functional range for your liners and your equipment.

If the population keeps creeping shorter or straighter each generation and you keep chasing zeros, your daughters drift right along with it.
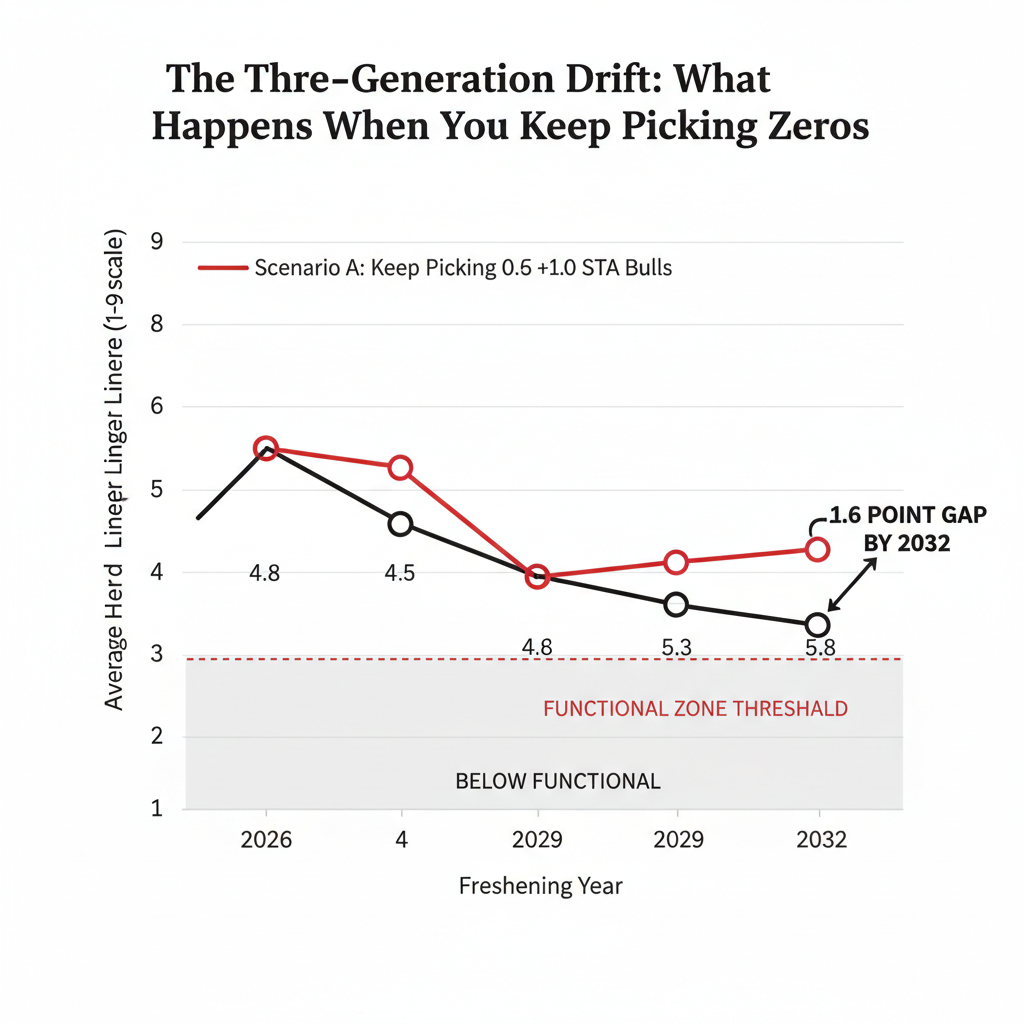
| Scenario | 2026 Herd Average | 2029 Herd Average | 2032 Herd Average |
|---|---|---|---|
| Scenario A: Keep picking 0.0 STA bulls | 4.8 | 4.5 | 4.2 |
| Scenario B: Pick +0.5 to +1.0 STA bulls | 4.8 | 5.3 | 5.8 |
| Functional Zone (reference) | 5.5 | 5.5 | 5.5 |
Where It Hurts First: Parlors and Robots
On a conventional parlor herd, the first signs don’t look like a genetics problem. They look like everyday aggravations.
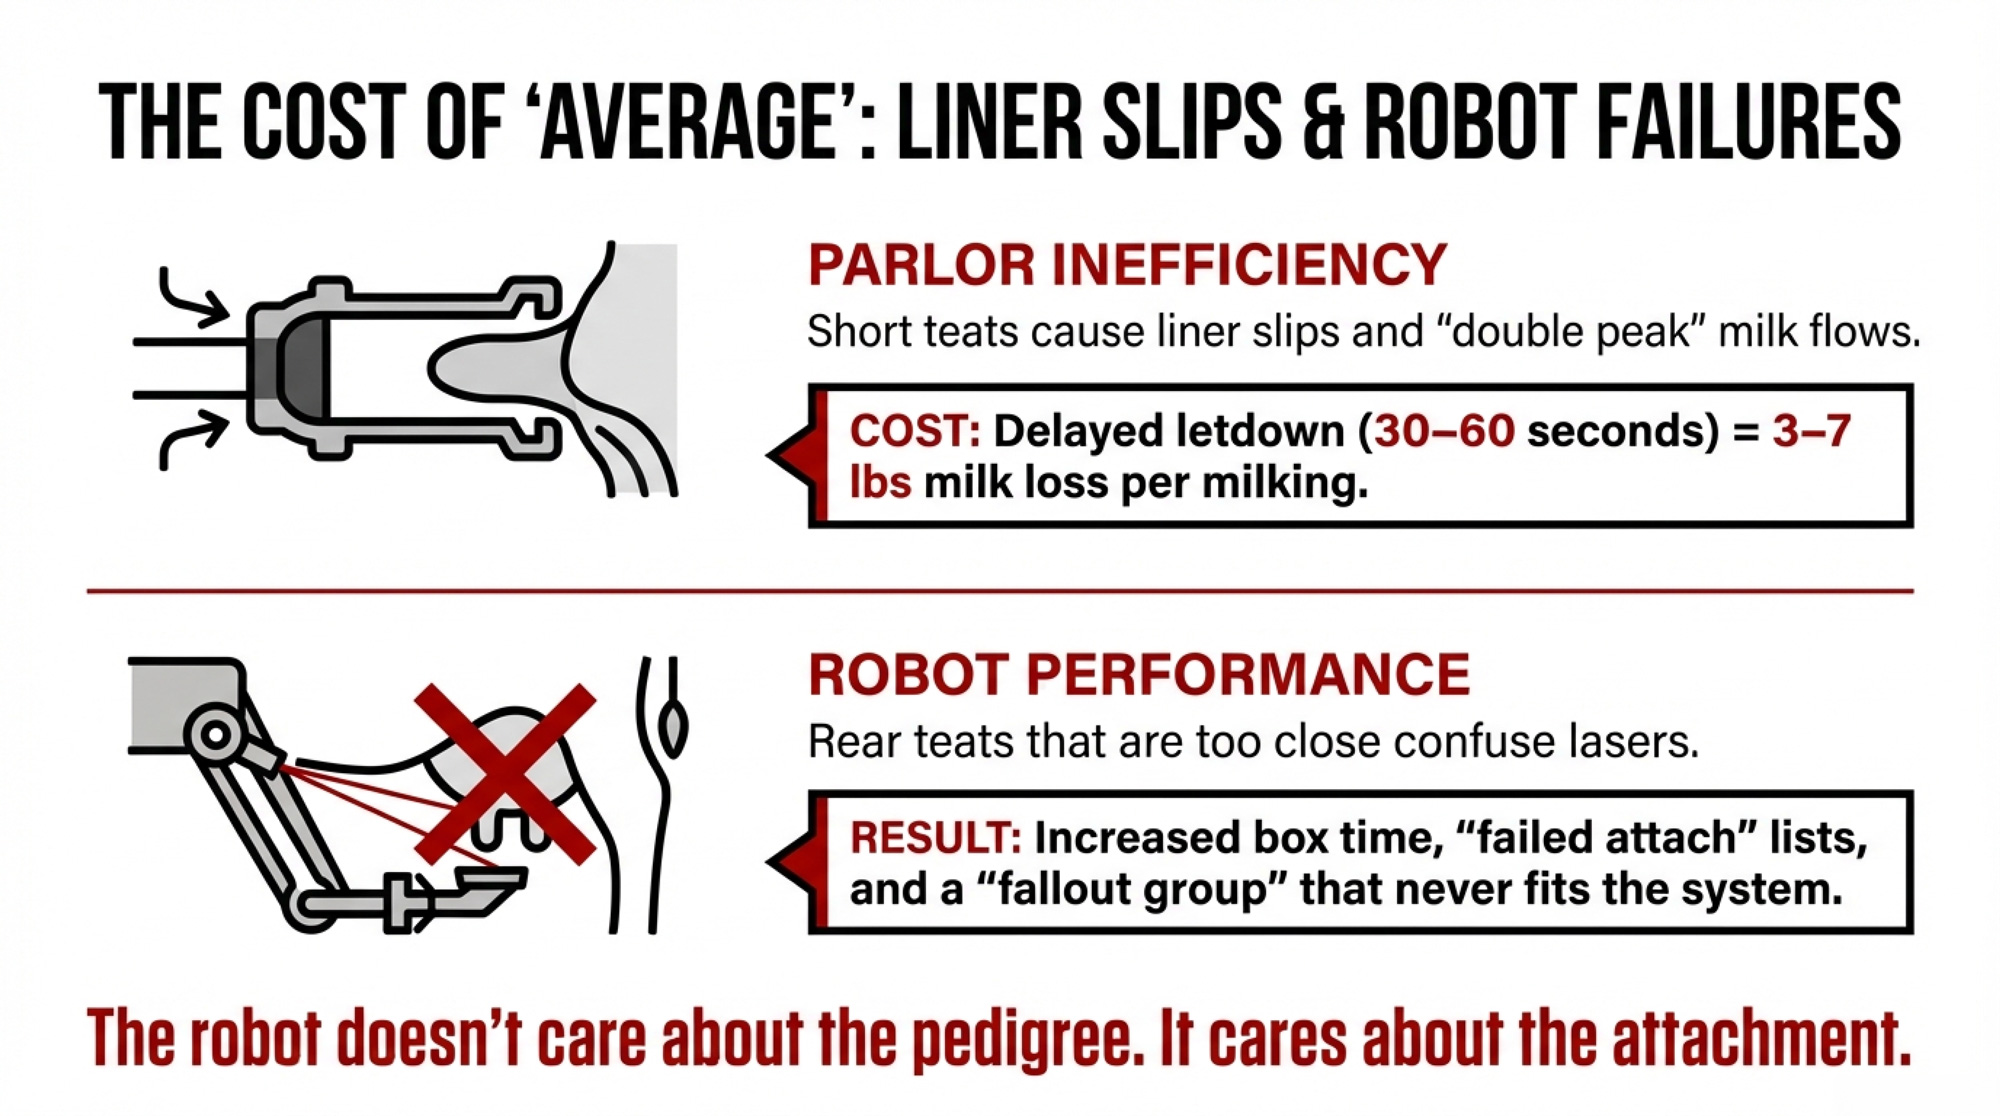
You’re bumping units back into place more often, especially on first‑lactation heifers. The milk graph on your meters shows more double peaks—vacuum on, flow off, then a second rise. Teat ends on your youngest group look rougher, with more “rings” and hyperkeratosis than the older cows that never gave you trouble.
That’s teat‑to‑liner fit. When teats are too short to fill the liner barrel properly, a vacuum is applied before milk begins to flow. During bimodal letdown, teats are exposed to high vacuum with low milk flow for 45–60 seconds or more, which is hard on teat ends and results in milk loss. Hoard’s Dairyman has reported that when letdown is delayed 30–60 seconds, yield at that milking drops about 3 pounds, and if the delay stretches beyond a minute, losses can hit 7 pounds per milking.
Now put that same udder in front of a robot.
The robot doesn’t care what the pedigree looks like. Its job is to find teats, line them up, and attach them, over and over. When rear teats sit too close together or are very short, the laser and camera struggle. You see multiple attach attempts on the same cows. Box time creeps up for those animals, while others are in and out. The same IDs appear on the “frequent fetch” or “failed attach” lists every week.
Robot manufacturers, advisers, and genetics guides consistently warn that cows with very close rear teats or extreme udder shapes are hard to milk robotically. That isn’t just an aesthetic complaint. It’s labor, box capacity, and frustration.
On top of that, AMS advisers in Canada and the US often point to a small but real slice of cows that simply never fit the robot’s “sweet spot” for udder and leg conformation and eventually leave the herd for that reason. Around a lot of robot barns, people talk about a small fallout group—that couple of percent of cows that soak up time on fetch lists and never really click with robotic milking.
Straight Legs, Sore Cows
Rear leg set has its own mythology. A lot of people still quietly believe straighter legs must mean stronger structure and better longevity. The biomechanics don’t back that up.
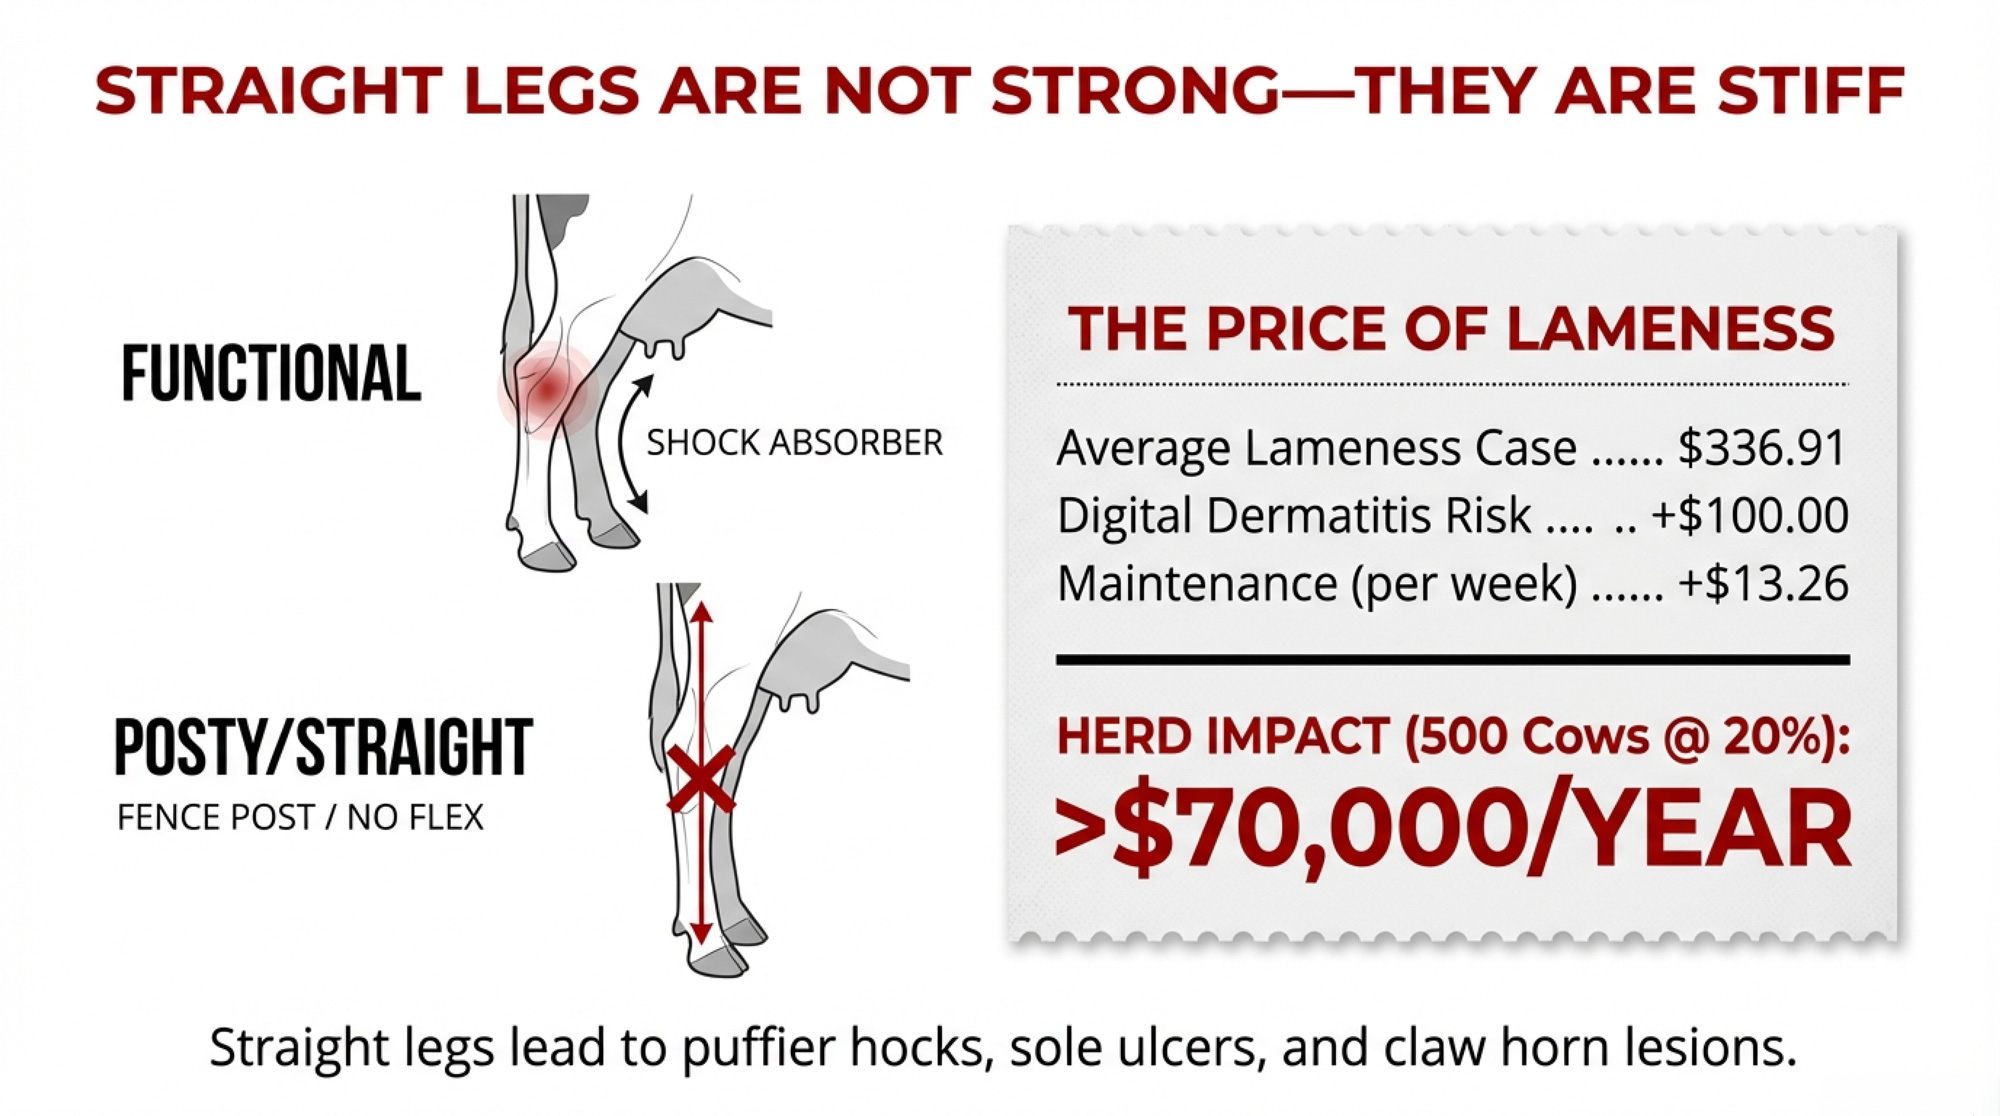
A cow’s rear leg isn’t a fence post. It’s a shock absorber. That moderate angle at the hock—around the middle of the scoring range in most systems—lets the leg flex and spread impact every time she walks on concrete, steps into a stall, or pivots to turn. When you breed too far toward the “posty” end, you take that flex away.
The result? Hocks that stay puffy and sore. More claw horn lesions and sole ulcers, especially in the outer claw. Cows that pass a quick stand‑still look but show a short, choppy stride when you locomotion‑score them.
Recent work on lameness costs makes the financial side of that pretty blunt. A 2023 model based on US data pegged average lameness cases at about $336.91 per cow, with digital dermatitis cases running roughly $100 more than other causes. Each additional week a cow stays lame adds about $13.26 in cost.
The global picture isn’t comforting either. Reviews and field reports put average dairy cow lameness prevalence in the low‑20% range, with herd‑level and regional reports ranging from the low‑teens up to over 50% in some confinement systems. You don’t have to be anywhere near the top of that range for it to chew through your margins.
What lameness really costs
| Item | Typical value (US data) |
| Average cost per lameness case | $336.91 per cow |
| Extra cost for DD vs other causes | ~$100 more per case |
| Added cost per extra lame week | $13.26 per week |
Run that math on your herd. In a 500‑cow setup with 20% lameness prevalence, even at mid‑range cost estimates, you’re easily into tens of thousands of dollars a year. Start adding extended lame periods and extra culls, and simple back‑of‑the‑envelope totals can push past $70,000 a year in some 500‑cow scenarios when you apply those per‑case costs and extra weeks of lameness.
| Cost Item | Per-Case Value (USD) | Annual Herd Impact (500 cows, 20% prevalence) | Notes |
|---|---|---|---|
| Average lameness case | $336.91 | $33,691 | Treatment, lost production, fertility loss |
| Digital dermatitis (DD) premium | +$100 above base | +$10,000 if 100 DD cases | Most common infectious cause |
| Extended lameness (per extra week) | +$13.26/week | +$13,260 if 100 cows lame 1 extra week | Compounding production drag |
| Clinical mastitis case (early lactation) | $120–$444 | $12,000–$44,400 for 100 cases | Treatment + milk discard + culling risk |
| Conservative 500-cow scenario | — | $50,000–$70,000+/year | Lameness + mastitis combined |
| High-prevalence herds (30%+ lame) | — | $75,000–$100,000+/year | Where structural weakness really bites |
That’s before you even talk about the cows that never get the chance to reach their full lifetime production.
What Holstein USA’s Million‑Cow Study Showed
Holstein Association USA went looking for a hard answer to a question breeders have argued about for decades: does functional conformation really pay in the tank?
Their “Conformation Matters” work, released in late 2022, matched almost 20 years of classification data on just under a million Holstein cows with official DHI production records. Then they ranked cows by their first‑lactation final score and watched what happened over their careers.
The numbers weren’t subtle.
- Top‑quartile cows (first‑lactation final scores 82–89 points) averaged 28,037 pounds of energy‑corrected milk (ECM) in first lactation.
- Bottom‑quartile cows (final scores 76 and under) averaged 26,500 pounds ECM.
That’s 1,537 pounds more ECM in just one lactation. At $20/cwt, it’s about $307 more milk revenue right there.
Over a lifetime, the gap got wider:
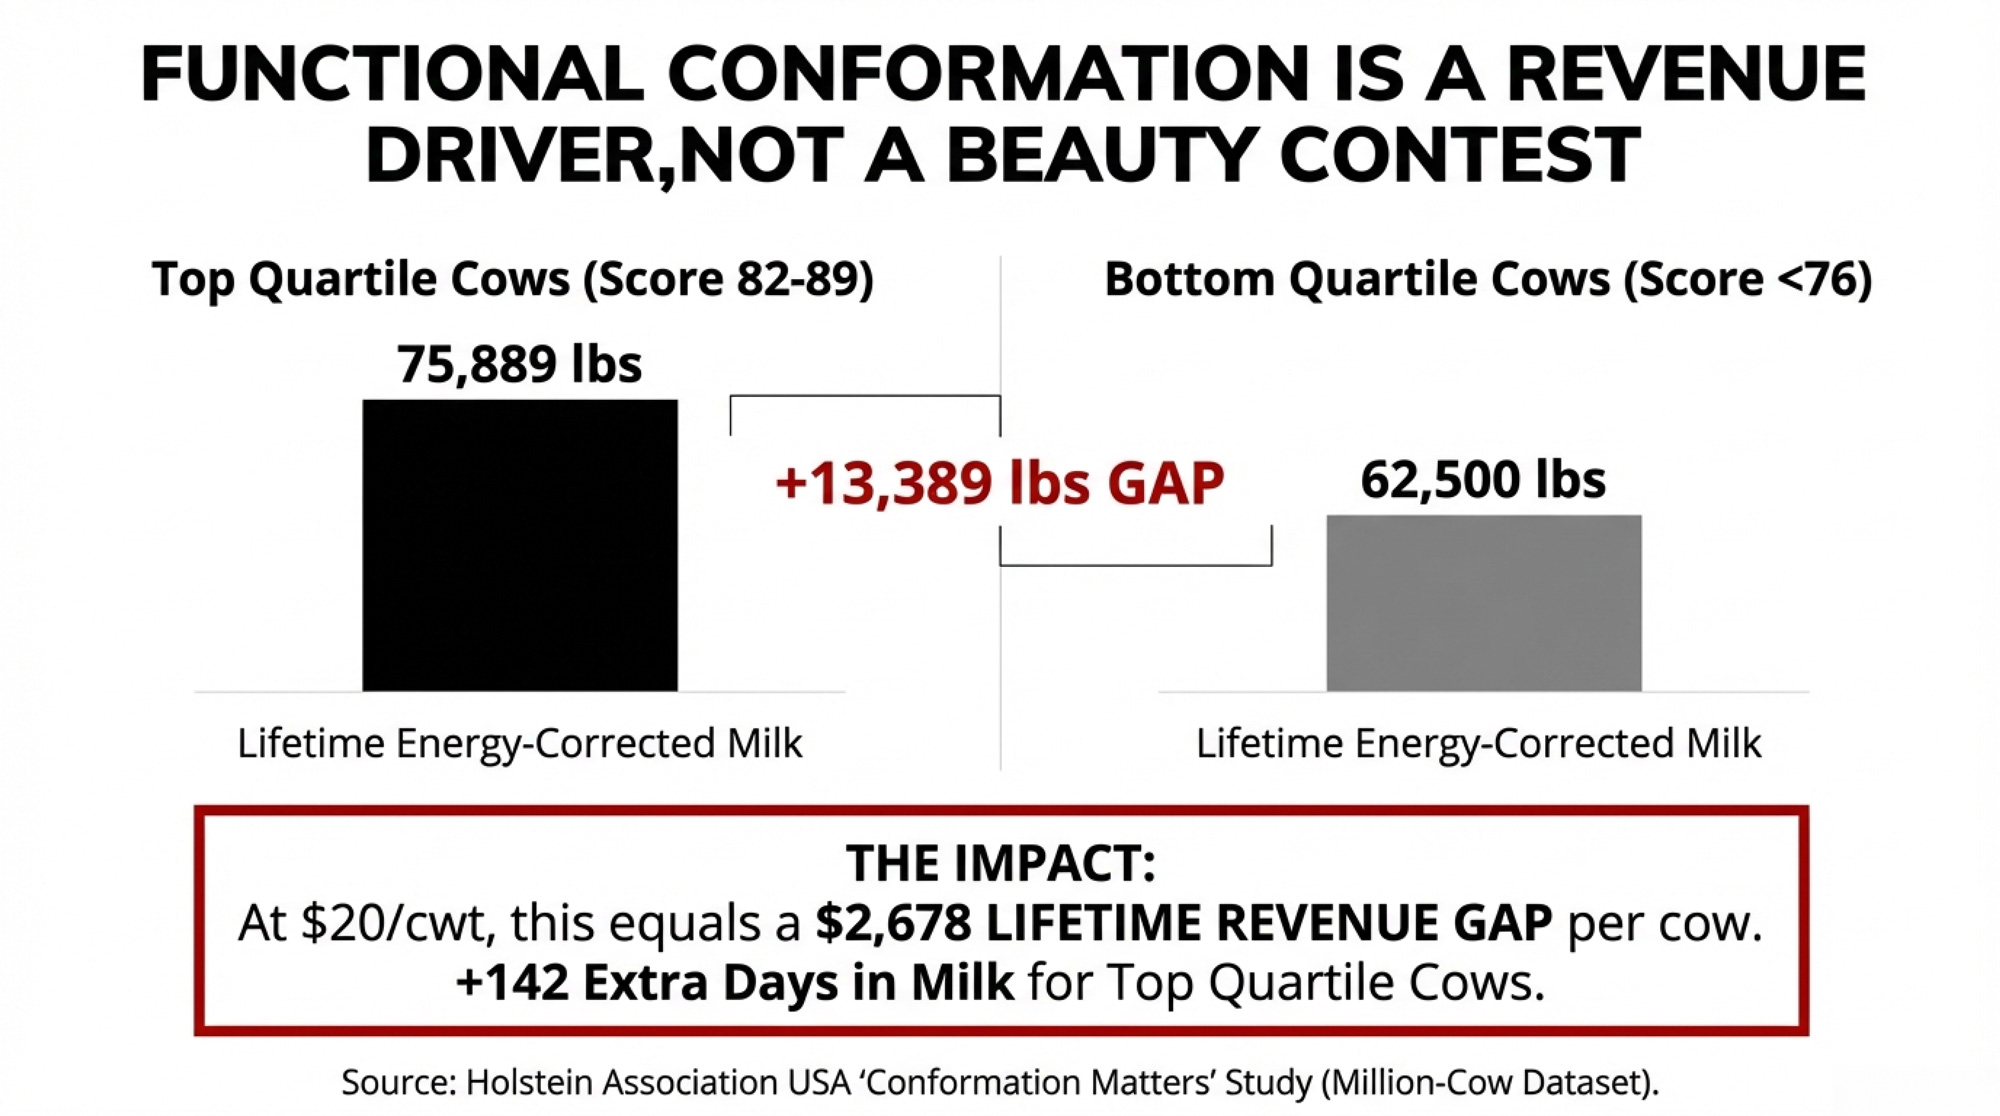
- Top‑quartile cows produced 75,889 pounds of lifetime ECM.
- Bottom‑quartile cows produced 62,500 pounds.
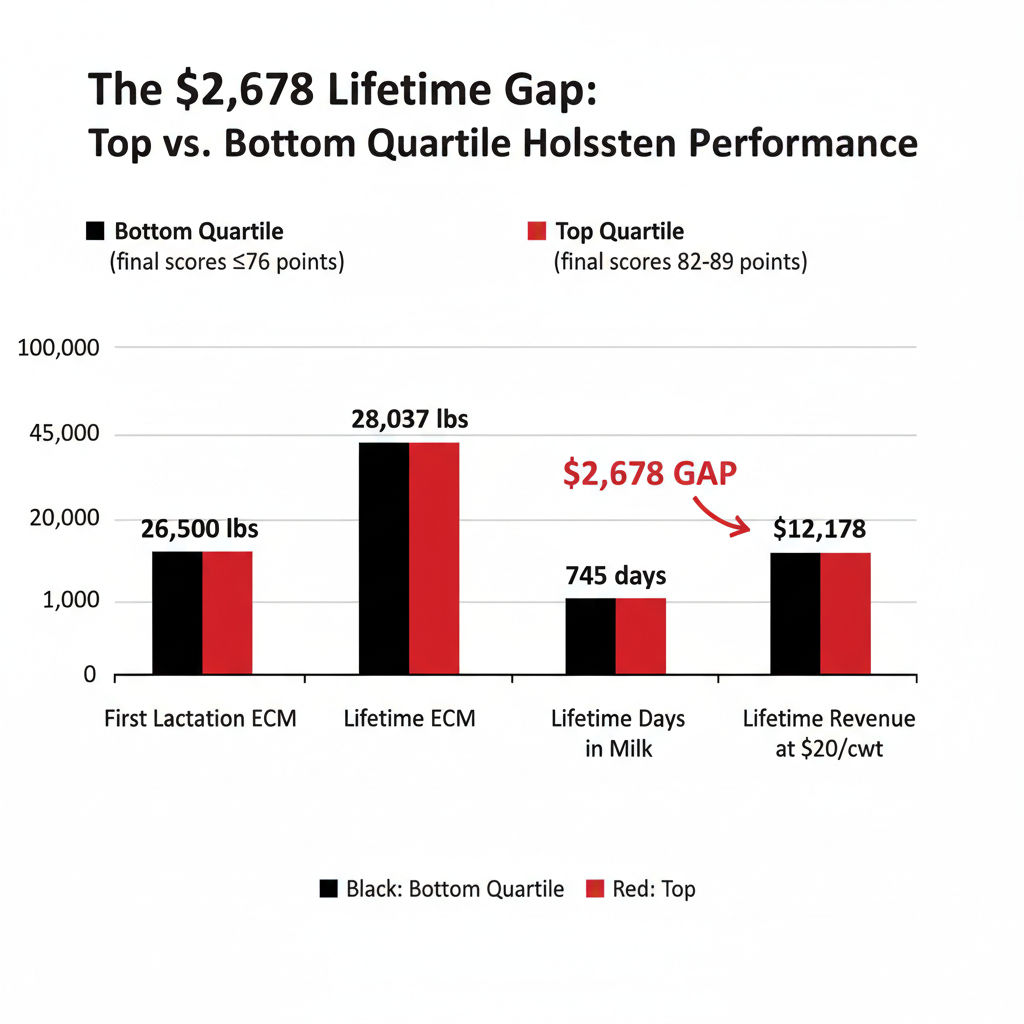
That’s 13,389 pounds more ECM—roughly $2,678 more lifetime milk income per cow at the same $20/cwt milk price.
They also lasted longer:
- Top‑quartile cows delivered 142 more lifetime days in milk than bottom‑quartile cows—nearly five months of extra production.
Large‑sample genomic studies on US Holsteins published since 2022 keep pointing in the same direction: the genomic regions associated with production, fertility, and longevity often overlap with those influencing key conformation traits. The physics and the genomics are lining up.
Put those numbers alongside mastitis costs and the picture sharpens again. A widely cited 2015 study on early‑lactation clinical mastitis cases estimated the total cost at approximately $444 per case, including treatment, milk discard, lost production, fertility losses, and culling. Newer work from Michigan State and industry economic summaries shows many farms seeing $120–$330 per case out‑of‑pocket, with milk discard driving most of that. However you slice it, type decisions that raise or lower disease risk move real money.
If you’re outside the US, plug in your own milk price and cost estimates—the pattern holds even if the exact dollars change.
STA vs. Linear Score: Two Different Tools, One Cow in the Stall
Here’s where a lot of people quietly get tangled: linear scores and STAs are doing different jobs.
Linear scores describe the cow you’re looking at on classification day. On the US 1–50 scale (or the 1–9 scale used in Canada and elsewhere), the midpoint is simply the physical middle between the two extremes. A 25 or 5 is halfway between very short and very long. It doesn’t automatically mean “best.”
STAs describe what a bull tends to transmit. They’re standardized with a mean of 0 and a standard deviation of 1, relative to the current population for that trait. So:
- 0.0 STA = daughters expected to be about average for today’s breed.
- +1.0 STA = one standard deviation above that average.
- ‑1.0 STA = one standard deviation below.
For many type traits, moving from ‑3.0 to +3.0 STA covers most of the genetic variation you’re going to see in the Holstein population. For many traits that span, the difference translates to roughly 10–12 points on the 1–50 linear scale, though the exact mapping varies by trait and country.
That’s enough to make a practical difference at the cow level—but it isn’t an infinite lever. And if the population average has already drifted away from what’s functional in your stalls, chasing zeros won’t pull you back.
Sorting Traits: When “More” Helps and When “Middle” Wins
Before you scroll straight to the index column, it helps to sort your type traits into two basic buckets.
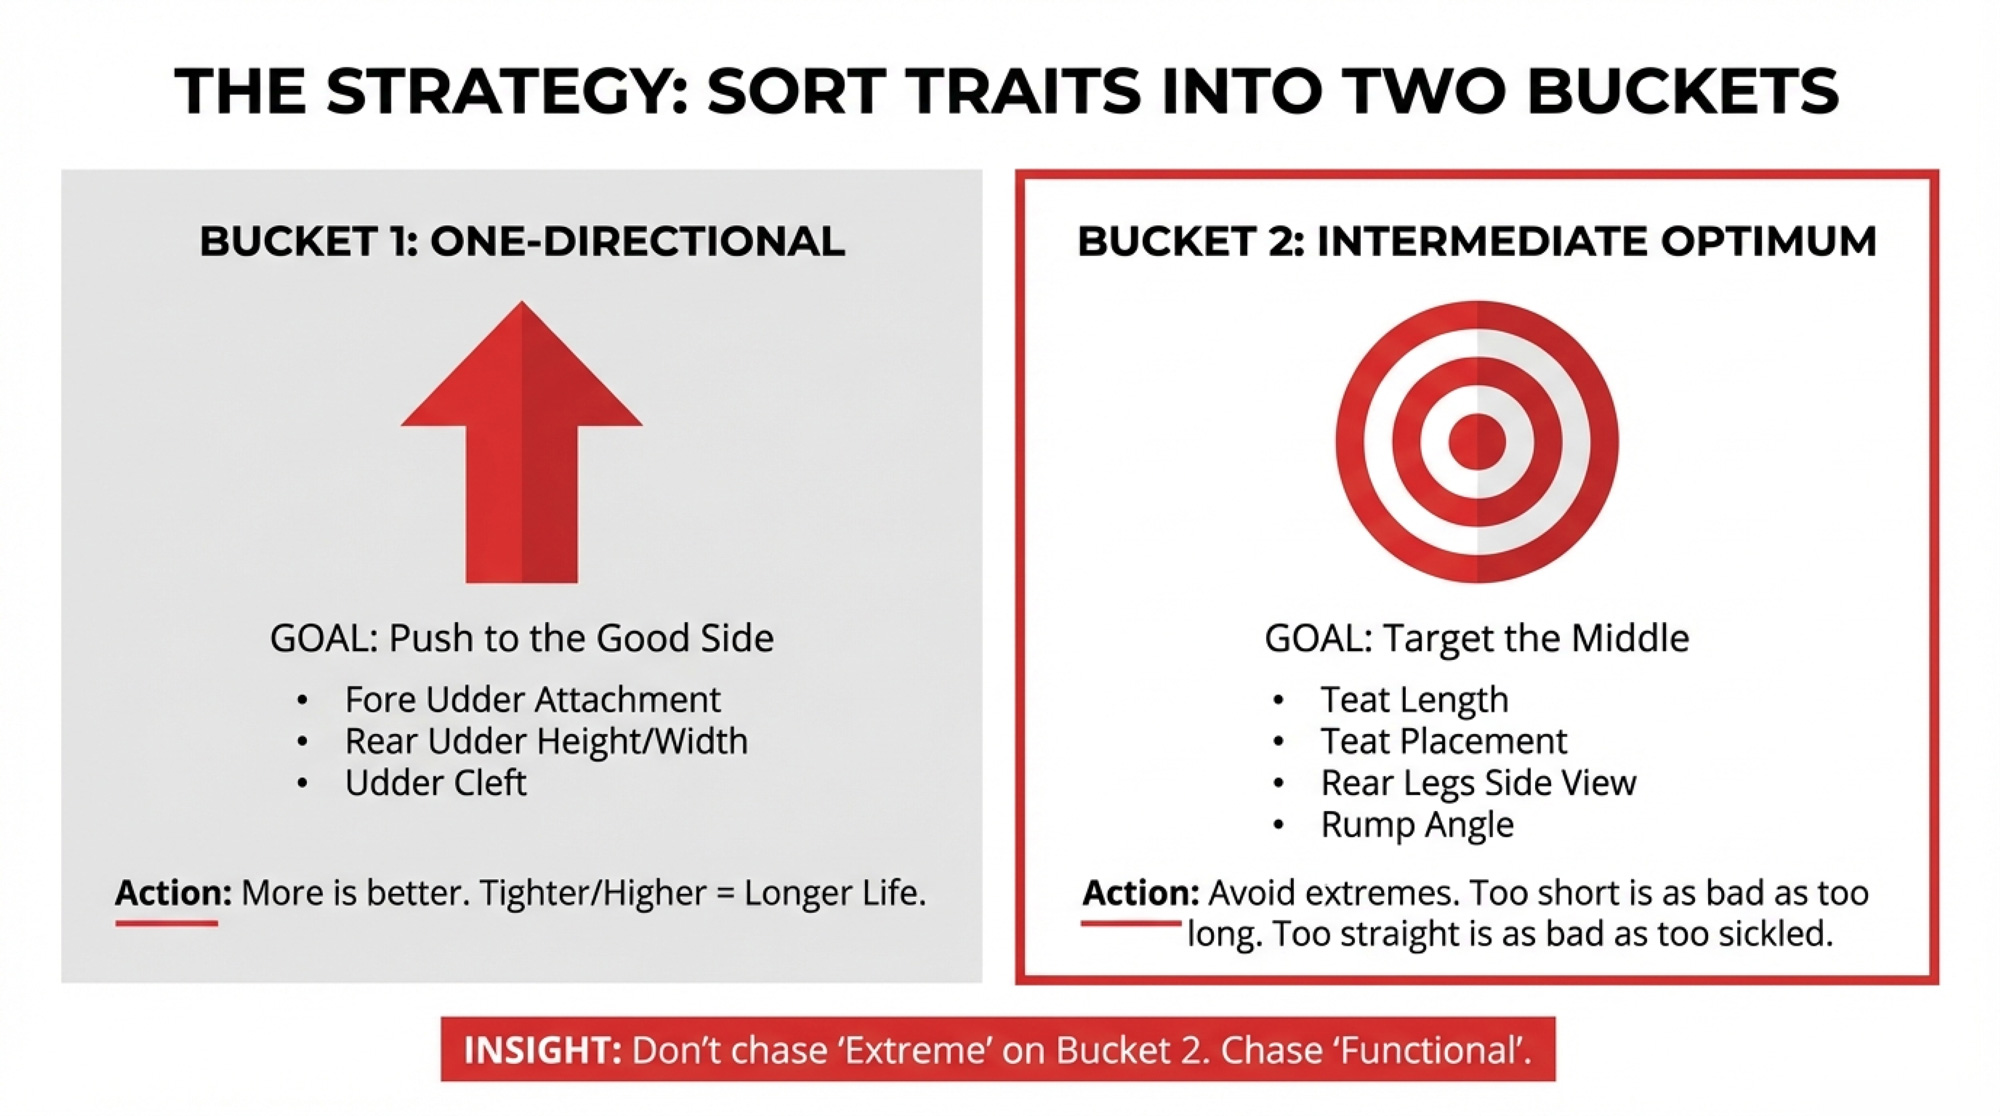
Bucket 1 – One‑directional: push to the good side
For these, more really does mean better, within reason:
- Fore udder attachment
- Rear udder height
- Rear udder width
- Udder cleft/median suspensory
Holstein USA’s own data shows that cows with tighter, higher, stronger udders give more milk, last longer, and pull more dollars through the parlor. On these, you want bulls that move daughters toward the “strong and snug” end.
Bucket 2 – Intermediate optimum: you want the zone, not the edge
These traits punish you at both extremes:
- Teat length
- Front and rear teat placement
- Rear legs side view
- Rump angle
Short teats cause liner fit and robot issues. Very long teats get stepped on and damaged. Teats that are too close together or too wide apart create their own milking problems. Legs that are too sickled or too straight both show up on lameness reports and trimming bills. Rumps that are too level or too steep shift calving ease and fertility the wrong way.
Most experienced classifiers and breeders will tell you the same thing: somewhere in the middle of the linear scale is where cows stay sound and milk‑able. Your job is to know where your herd sits relative to that middle—and pick bulls that move daughters toward the practical zone, not just toward whatever the current population average happens to be.
| Type Trait | Strategy Bucket | Target STA Range | What Wins | What Breaks |
|---|---|---|---|---|
| Fore Udder Attachment | One-directional (PUSH) | +0.5 to +2.0 | Tight, strong, long-lasting udders | Weak attachments → early culling |
| Rear Udder Height | One-directional (PUSH) | +0.5 to +2.0 | High, snug udders = more capacity + longevity | Low udders → mastitis risk, breakdown |
| Rear Udder Width | One-directional (PUSH) | +0.5 to +2.0 | Wide = strong suspensory, more quarters attachment | Narrow → weak suspensory, udder tilt |
| Udder Cleft/Median Suspensory | One-directional (PUSH) | +0.5 to +2.0 | Deep cleft = tight ligament = longevity | Flat udders → early breakdown |
| Teat Length | Intermediate (HOLD ZONE) | -0.5 to +1.0 | Moderate length = liner fit + robot success | Too short → liner slip, failed attachments; Too long → stepped on, damaged |
| Front Teat Placement | Intermediate (HOLD ZONE) | -0.5 to +0.5 | Centered teats = easy milking | Too close → robot struggles; Too wide → milker issues |
| Rear Teat Placement | Intermediate (HOLD ZONE) | -0.5 to +0.5 | Moderate spacing = robot-friendly | Too close → failed attachments; Too wide → poor milk-out |
| Rear Legs Side View | Intermediate (HOLD ZONE) | -0.5 to +0.5 | Moderate angle = shock absorption | Too straight (posty) → hock stress, sole ulcers; Too sickled → structural weakness |
| Rump Angle | Intermediate (HOLD ZONE) | -0.5 to +0.5 | Slight slope = calving ease + fertility | Too level → calving difficulty; Too steep → fertility issues |
| Stature | Intermediate (HOLD ZONE) | -0.5 to +0.5 | Moderate frame = feed efficiency | Too tall → maintenance cost; Too short → capacity limits |
A Selection Framework You Can Actually Use
So how do you turn all this into a semen‑ordering strategy instead of a headache?
Here’s a framework you can run in any Holstein herd on a Monday morning.
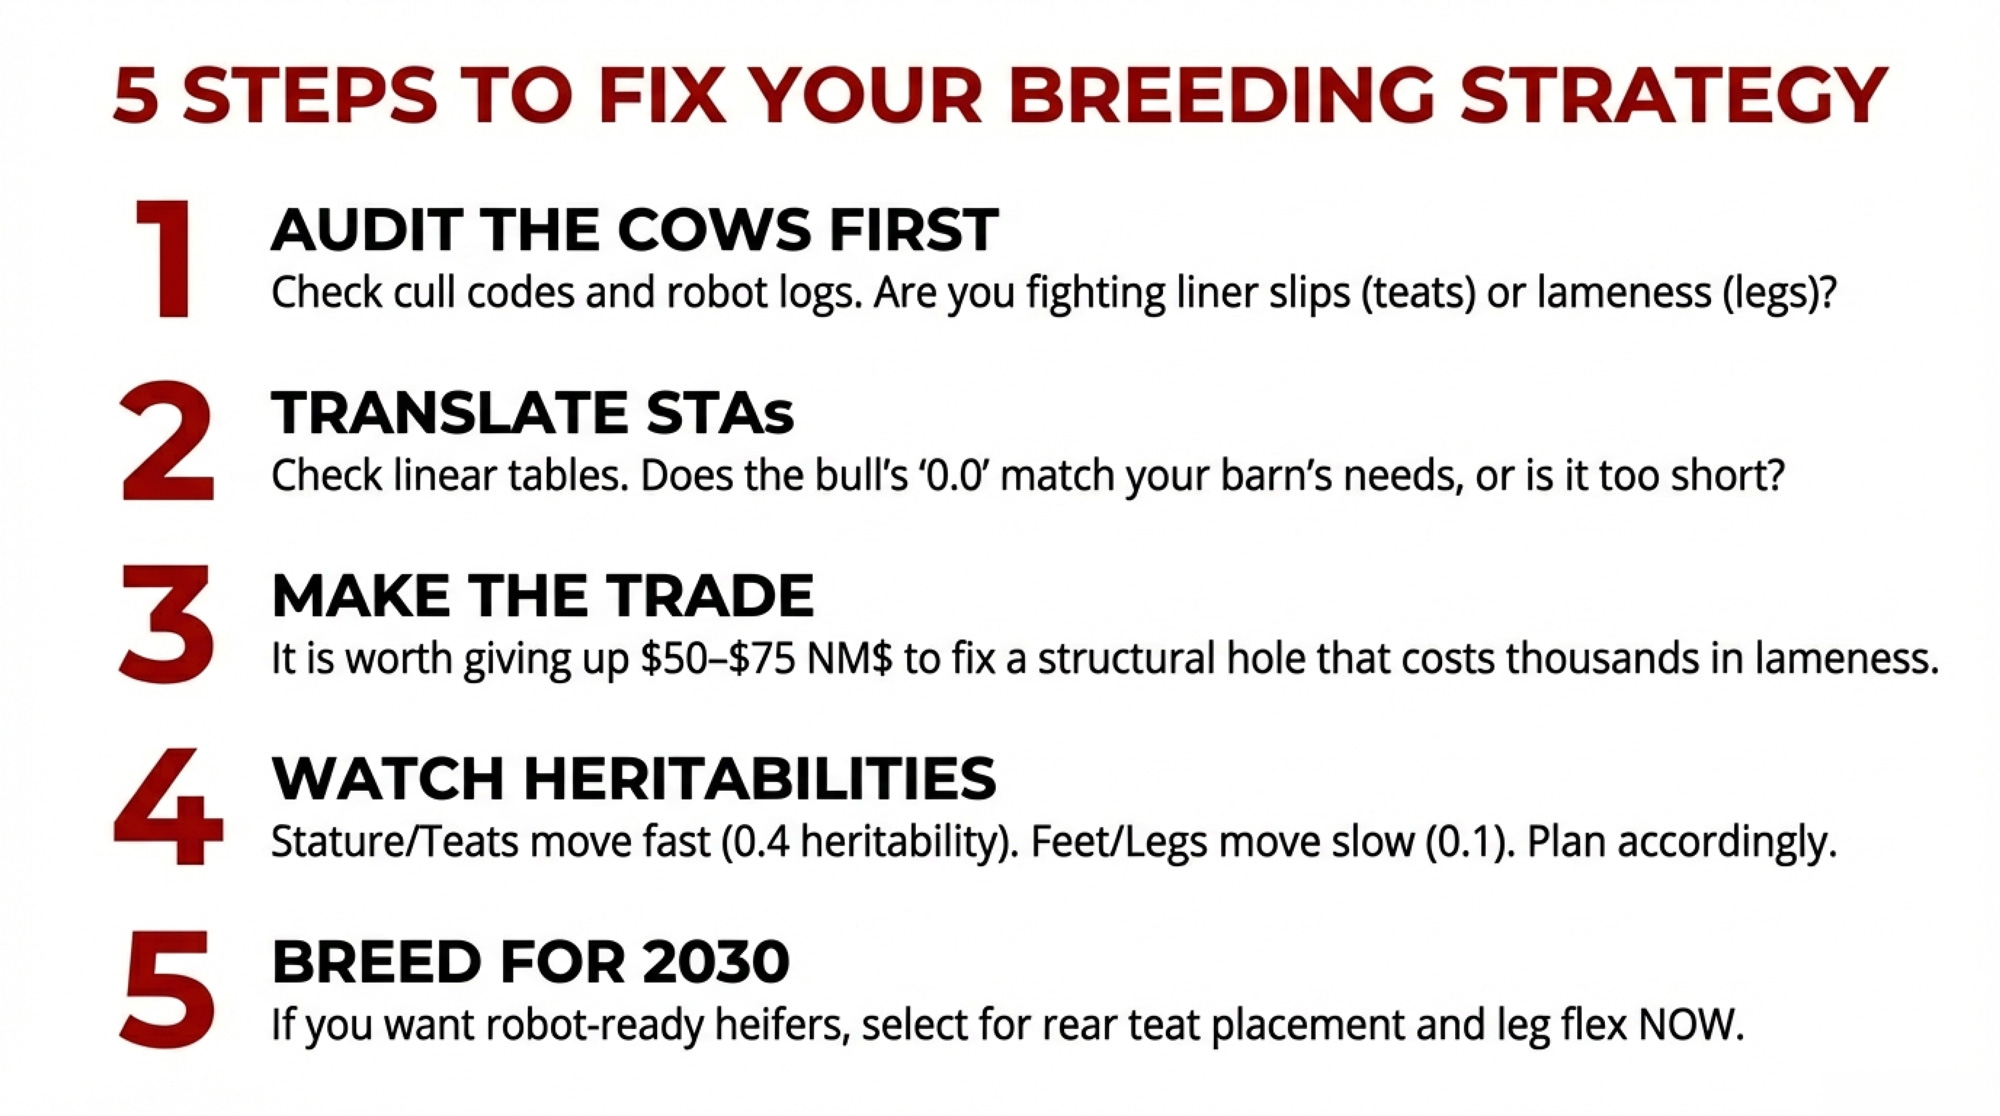
1. Audit your cows before you audit your bulls.
Grab your most recent classification herd summary. Look at:
- Average teat length
- Rear legs side view
- Udder depth
- Fore udder attachment
- Teat placement (front and rear)
Then match that against what you see in the barn. Are you fighting liner slips or robot attachments? Are trimmers seeing the same claw lesions over and over? What do your cull codes say—feet and legs, udder breakdown, mastitis?
Circle the traits where your herd average is weak and the daily reality backs it up.
2. Translate STAs into the cows you’ll be milking five years from now.
Before you call a bull “moderate,” check the linear interpretation tables from Holstein USA, Lactanet, or your national evaluation center. Ask three questions:
- At this STA, where do daughters land on the 1–9 or 1–50 scale?
- Is that better than where my cows are today?
- Or am I just repeating the same pattern?
If your herd already runs short‑teated and the breed average is short‑teated, a 0.0 STA won’t fix that. You’ll need bulls with positive teat‑length STAs just to pull daughters back into a functional range.
3. Decide how hard you need to correct—and what you’ll give up to do it.
If you’re:
- Close to where you want to be (maybe one point off), bulls around ‑0.5 to +0.5 STA can help maintain the status quo.
- Noticeably off‑center (1.5–2 points), bulls from about +0.5 to +1.5 STA will shift the needle.
- In the ditch (more than 2 points off and seeing real cow problems), a stretch of more aggressive correction may be worth it.
This is where economics come in. A bull that fixes your worst type problem might not be the very top of your favorite index. But if you’re giving up, say, $50– to pull your herd out of a structural hole that’s costing you far more than that in lameness, mastitis, and robot drama, that’s not a sacrifice. It’s a trade.
If you’re looking at a bull that would cost you more than about just to correct one trait, it’s time to slow down and ask whether you’re over‑correcting and holding back overall genetic progress.
4. Watch heritabilities and timelines.
Type trait studies and national evaluations consistently show that stature and teat length have moderate‑to‑high heritabilities (around 0.4), while traits like foot angle are closer to 0.1. That means:
- Stature and teat length will move quickly if you select hard.
- Foot angle and some leg traits will move slowly regardless—they need patience and consistent selection, not wild swings.
Plan for a three‑generation horizon to account for the full impact of your choices to show up in the bulk tank and cull list.
5. If robots are in your future, start breeding for them now.
If you’re even talking to robot dealers, it’s time to tighten up on:
- Rear teat placement that gives arms room to find and attach.
- Teat length that works with your chosen liner profile.
- Feet, legs, and locomotion that support voluntary traffic.
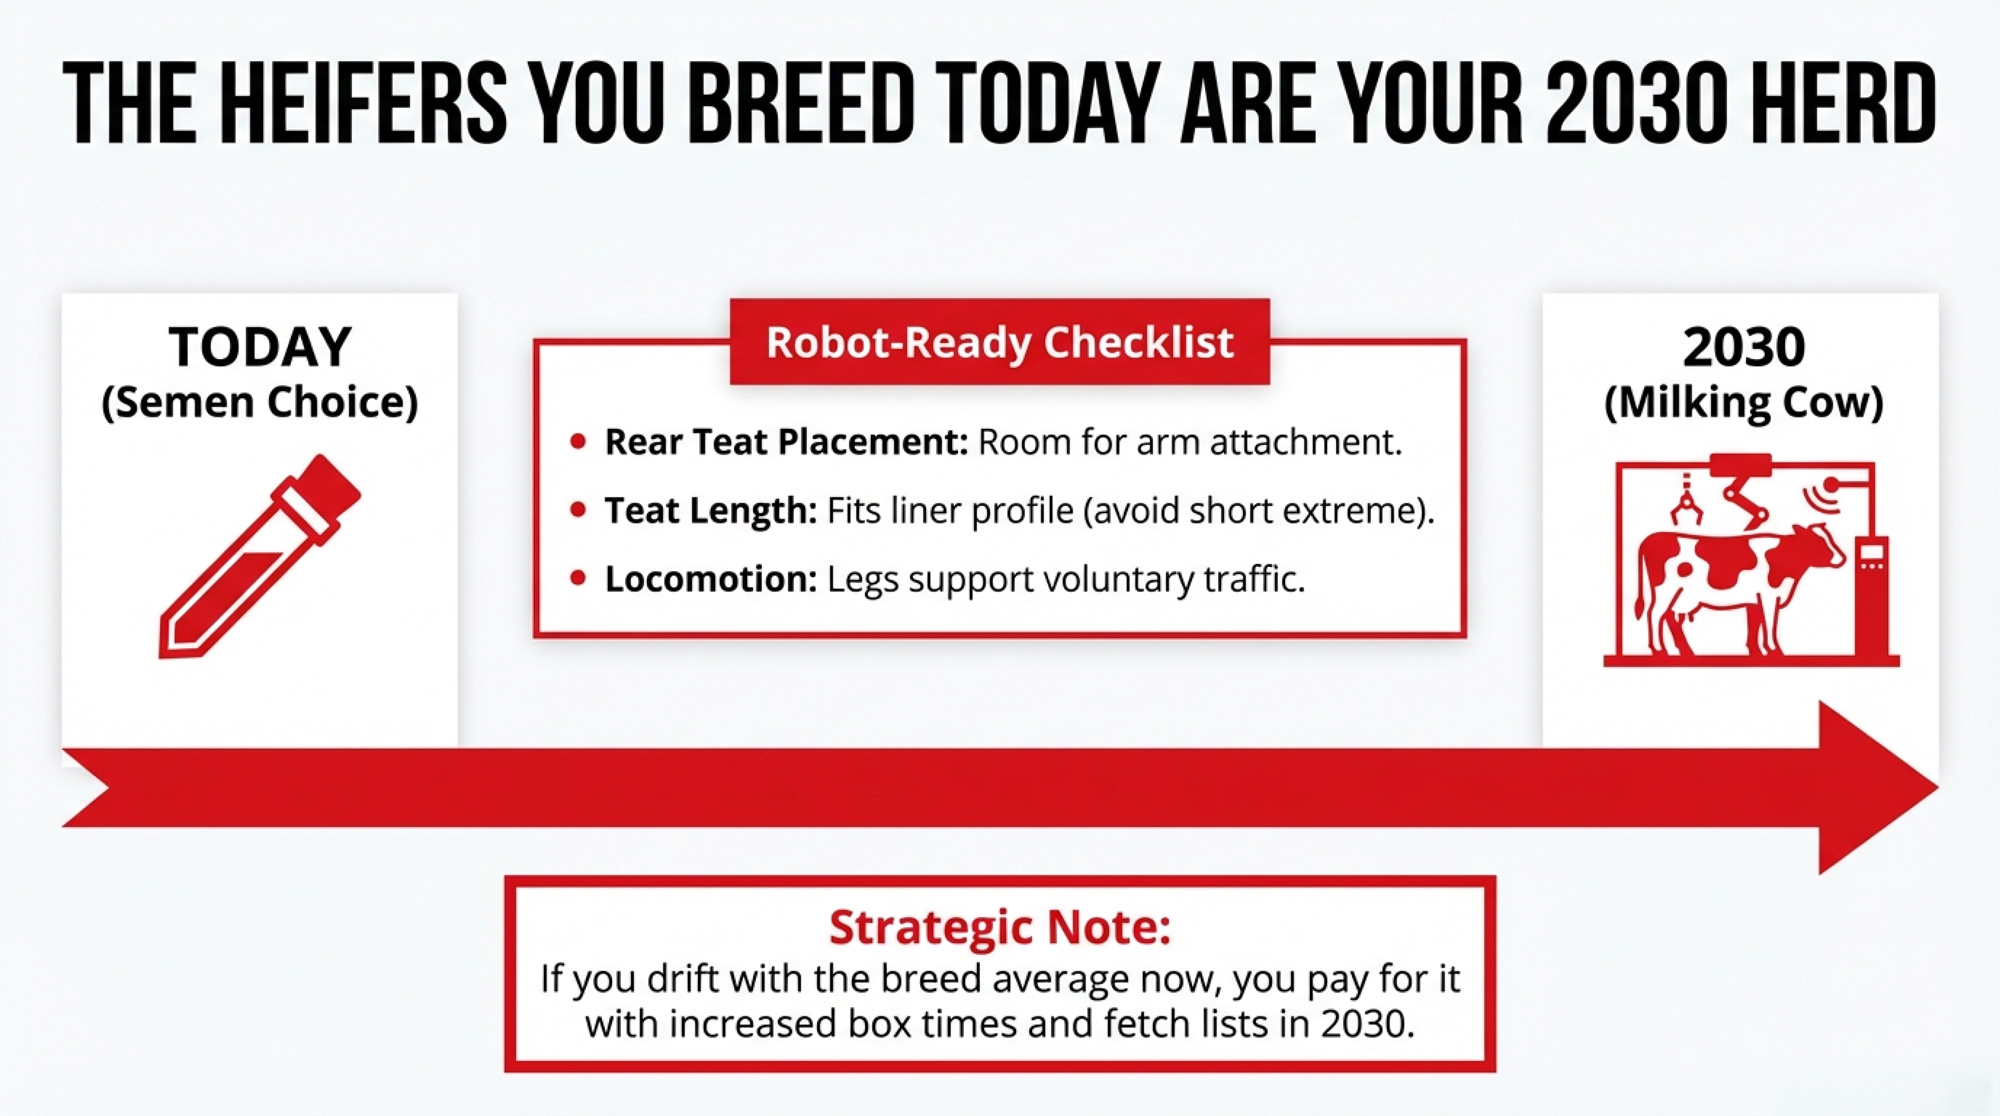
If you want a barn full of “robot‑ready” heifers on day one, start biasing sire selection that way at least two years before the first unit is bolted down. The heifers you’re breeding today are the cows your robots will be trying to milk in 2028–2030.
| Trait | Target Linear Range (1–9 scale) | Target STA for Bulls | Why Robots Care | Priority |
|---|---|---|---|---|
| Rear Teat Placement | 5.0–6.5 (moderate spacing) | +0.3 to +1.0 | Too close → laser/camera can’t distinguish teats, failed attachments | CRITICAL |
| Teat Length | 5.5–7.0 (moderate to slightly long) | +0.5 to +1.5 | Too short → cups slip during attachment cycle; optimal length = secure seal | CRITICAL |
| Front Teat Placement | 4.5–6.0 (centered) | -0.3 to +0.5 | Wide or narrow extremes → arm positioning errors, longer box time | High |
| Udder Depth | 5.0–7.0 (moderate to shallow) | +0.5 to +1.5 | Very deep udders → ground clearance issues, teat height variability | High |
| Rear Legs Side View | 4.5–6.0 (moderate angle) | -0.3 to +0.5 | Posty cows = poor locomotion → reduced voluntary traffic, fetch lists | High |
| Foot Angle | 4.5–6.0 (moderate) | -0.3 to +0.5 | Flat feet + concrete = lameness → cows avoid robot, traffic breaks down | Medium |
| Rear Udder Height | 6.0–8.0 (high) | +0.5 to +2.0 | High attachments = consistent teat position → faster, more reliable cups-on | Medium |
| Locomotion/Mobility | Scored 1–2 (sound) | Select for Feet & Legs composite | Lame cows don’t walk to robot → “fallout group” that never adapts | CRITICAL |
What This Means for Your Operation
- Stop reading 0.0 STA as “safe.”
It only means “average for the current population.” In 2025–2026, that average is already too short, too straight, or too extreme for many parlors and robotic milking systems. - Use Holstein USA’s $2,678 gap as your reality check.
Their 2022 analysis showed that top‑quartile cows for functional conformation delivered 1,537 lbs more ECM in first lactation, 13,389 lbs more over their lifetimes, and 142 extra days in milk compared to bottom-quartile cows, worth about $2,678 per cow at $20/cwt. - Treat intermediate‑optimum traits like guardrails, not goals.
For teat length, teat placement, rump angle, and rear legs side view, your aim is to keep daughters in the functional middle and out of both ditches. - Factor real disease costs into your type decisions.
With recent US work putting average lameness cases at $336.91 per case and clinical mastitis often costing $120–$444, depending on the model, structural weaknesses that drive those numbers up are no longer minor cosmetic issues. They’re cash‑flow problems. If you’re in a quota or high‑component system, run the same math with your actual milk price and premiums. - Think in three‑generation chunks, not one proof run.
The semen in your tank today shapes your 2030 herd. If you’re drifting with the breed on key traits in 2026, you’re going to be paying for it in 2030 and beyond.
Key Takeaways
- Zero STA is a direction, not a destination. When you see a line of zeros, ask where breed average actually is—and whether your robots, your parlor and your cows can live there.
- Holstein USA’s own million‑cow study confirms that cows with stronger, more functional conformation don’t just look good on paper; they bring in more milk, stay in the herd longer, and generate more lifetime revenue.
- The genomic work published since 2022 supports this: large U.S. Holstein data sets show that genomic regions for production, fertility, and longevity often overlap with those for key conformation traits.
- The most profitable herds over the next decade will be the ones that use indexes, STAs, and linear scores together—pushing hard on the right one‑directional traits and holding the line firmly in the functional middle on everything that lives or dies on “optimum,” not “extreme.”
The Bottom Line
At the end of the day, the semen you order this month will decide what kind of cows your kids and grandkids are milking. You can let the breed’s drift pick that cow for you—or you can use the tools we’ve got now to build the kind of Holstein that actually fits your stalls, your robots, and your milk cheque for the long haul.
Complete references and supporting documentation are available upon request by contacting the editorial team at editor@thebullvine.com.
Learn More
- Dairy Tech ROI: The Questions That Separate $50K Wins from $200K Mistakes – Arm yourself with the hard financial thresholds needed to survive the robot transition. This guide breaks down the $27-per-hour labor reality and delivers the management benchmarks that separate profitable automation from expensive equity drains.
- Breeding Into a Moving Market: What Butterfat’s Crash Reveals About Dairy’s Genetic Timing Problem – Expose the dangerous 5-year lag between your sire tank and the processor’s check. This strategy reveals how to insulate your herd from market volatility by balancing component intensity with the structural longevity discussed in our million-cow analysis.
- Revolutionizing Dairy Farming: How AI, Robotics, and Blockchain Are Shaping the Future of Agriculture in 2025 – Gain an unfair advantage by weaponizing AI-optimized breeding programs that boast 99.8% precision. This feature reveals how real-time sensor analytics are replacing guesswork, allowing you to breed for disease resistance and productivity with surgical accuracy.
 Join the Revolution!
 Join the Revolution!
Join over 30,000 successful dairy professionals who rely on Bullvine Weekly for their competitive edge. Delivered directly to your inbox each week, our exclusive industry insights help you make smarter decisions while saving precious hours every week. Never miss critical updates on milk production trends, breakthrough technologies, and profit-boosting strategies that top producers are already implementing. Subscribe now to transform your dairy operation’s efficiency and profitability—your future success is just one click away.


