


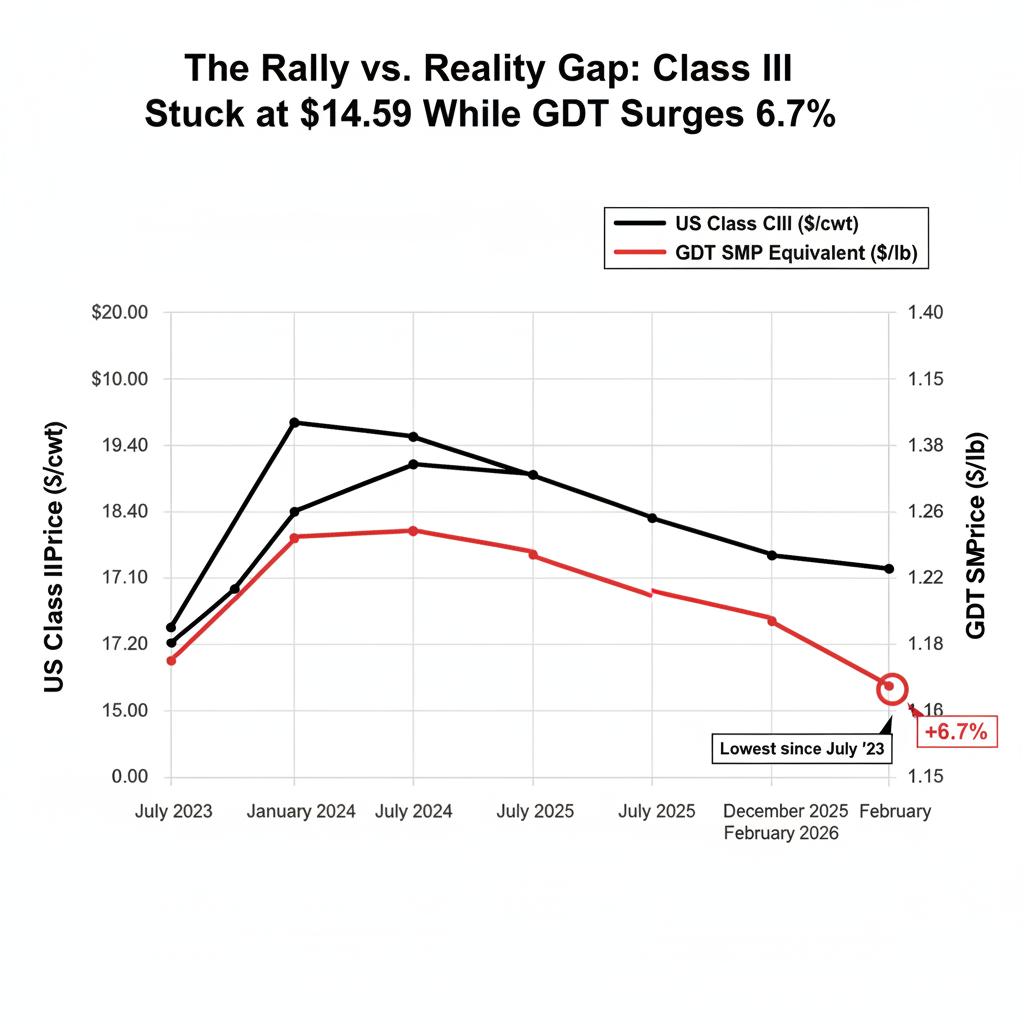
GDT up 6.7%, Class III stuck at $14.59. Is this rally real—or a head-fake you’ll regret chasing before April?
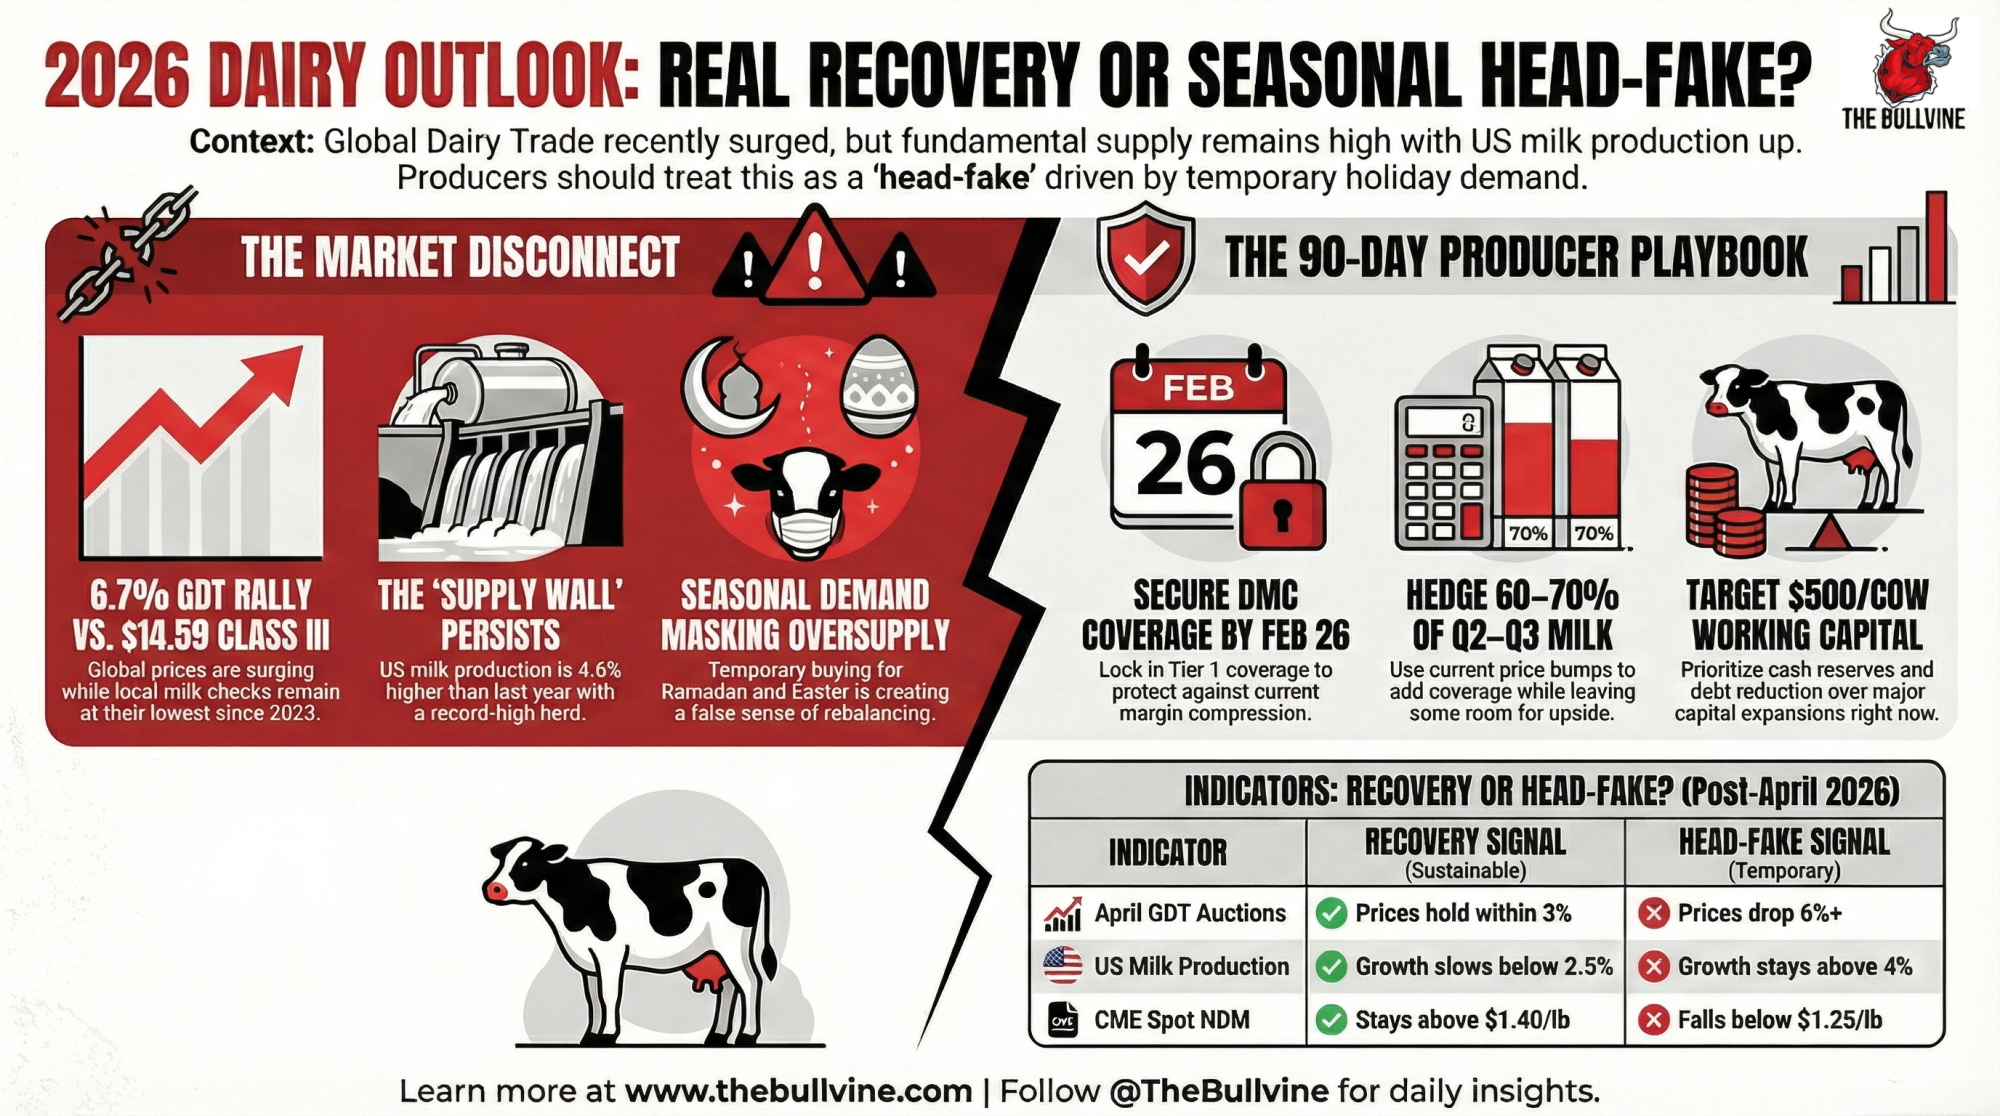
Executive Summary: The early 2026 GDT rally looks impressive—up 6.7% on February 3 with SMP surging 10.6%—but your milk check is still anchored to $14.59 Class III, the lowest since July 2023. At the same time, US milk production is running about 4.6% above a year ago, and New Zealand and EU collections are also climbing, so the supply wall hasn’t gone away. The buying burst from China, the Middle East, and Algeria is largely seasonal, tied to Ramadan and Easter, which means it can mask the underlying imbalance for a few auctions without actually fixing it. Powders look closest to a genuine reset after dropping to value territory late in 2025, while butterfat’s 8.8% bounce is a small blip against a 35–40% price break and a decade of genetically driven fat growth that’s still flooding the system. In this environment, your safest 90‑day play is to treat the rally as a potential head-fake: secure DMC coverage before the February 26 deadline, push Q2–Q3 Class III hedge coverage toward roughly 60–70% if you’re light, and build working capital toward about $500/cow before committing to major capital projects. Any expansion math should be run at $17 Class III, not today’s bounce, and held until the April 7 and 21 GDT auctions show whether prices can hold once holiday demand fades. Those two April sales, along with US milk growth, CME NDM holding above $1.40, and whether Fonterra nudges its forecast higher, are the signals that’ll tell you if this rally has real legs or was just a very expensive head-fake.

Three consecutive Global Dairy Trade gains to open 2026 have producers asking the same question: Is this the recovery we’ve been waiting for, or a seasonal head-fake that punishes anyone who bets on its continuation?
For operations staring at January milk checks based on $14.59 Class III—the lowest since July 2023—the answer shapes every decision over the next 90 days. The February 3 GDT auction delivered a 6.7% index jump, with skim milk powder surging 10.6% to $1.39/lb on an NDM-equivalent basis. CME spot NDM hit $1.5375/lb the same day, its strongest start since 2011, and up 31% year-to-date.
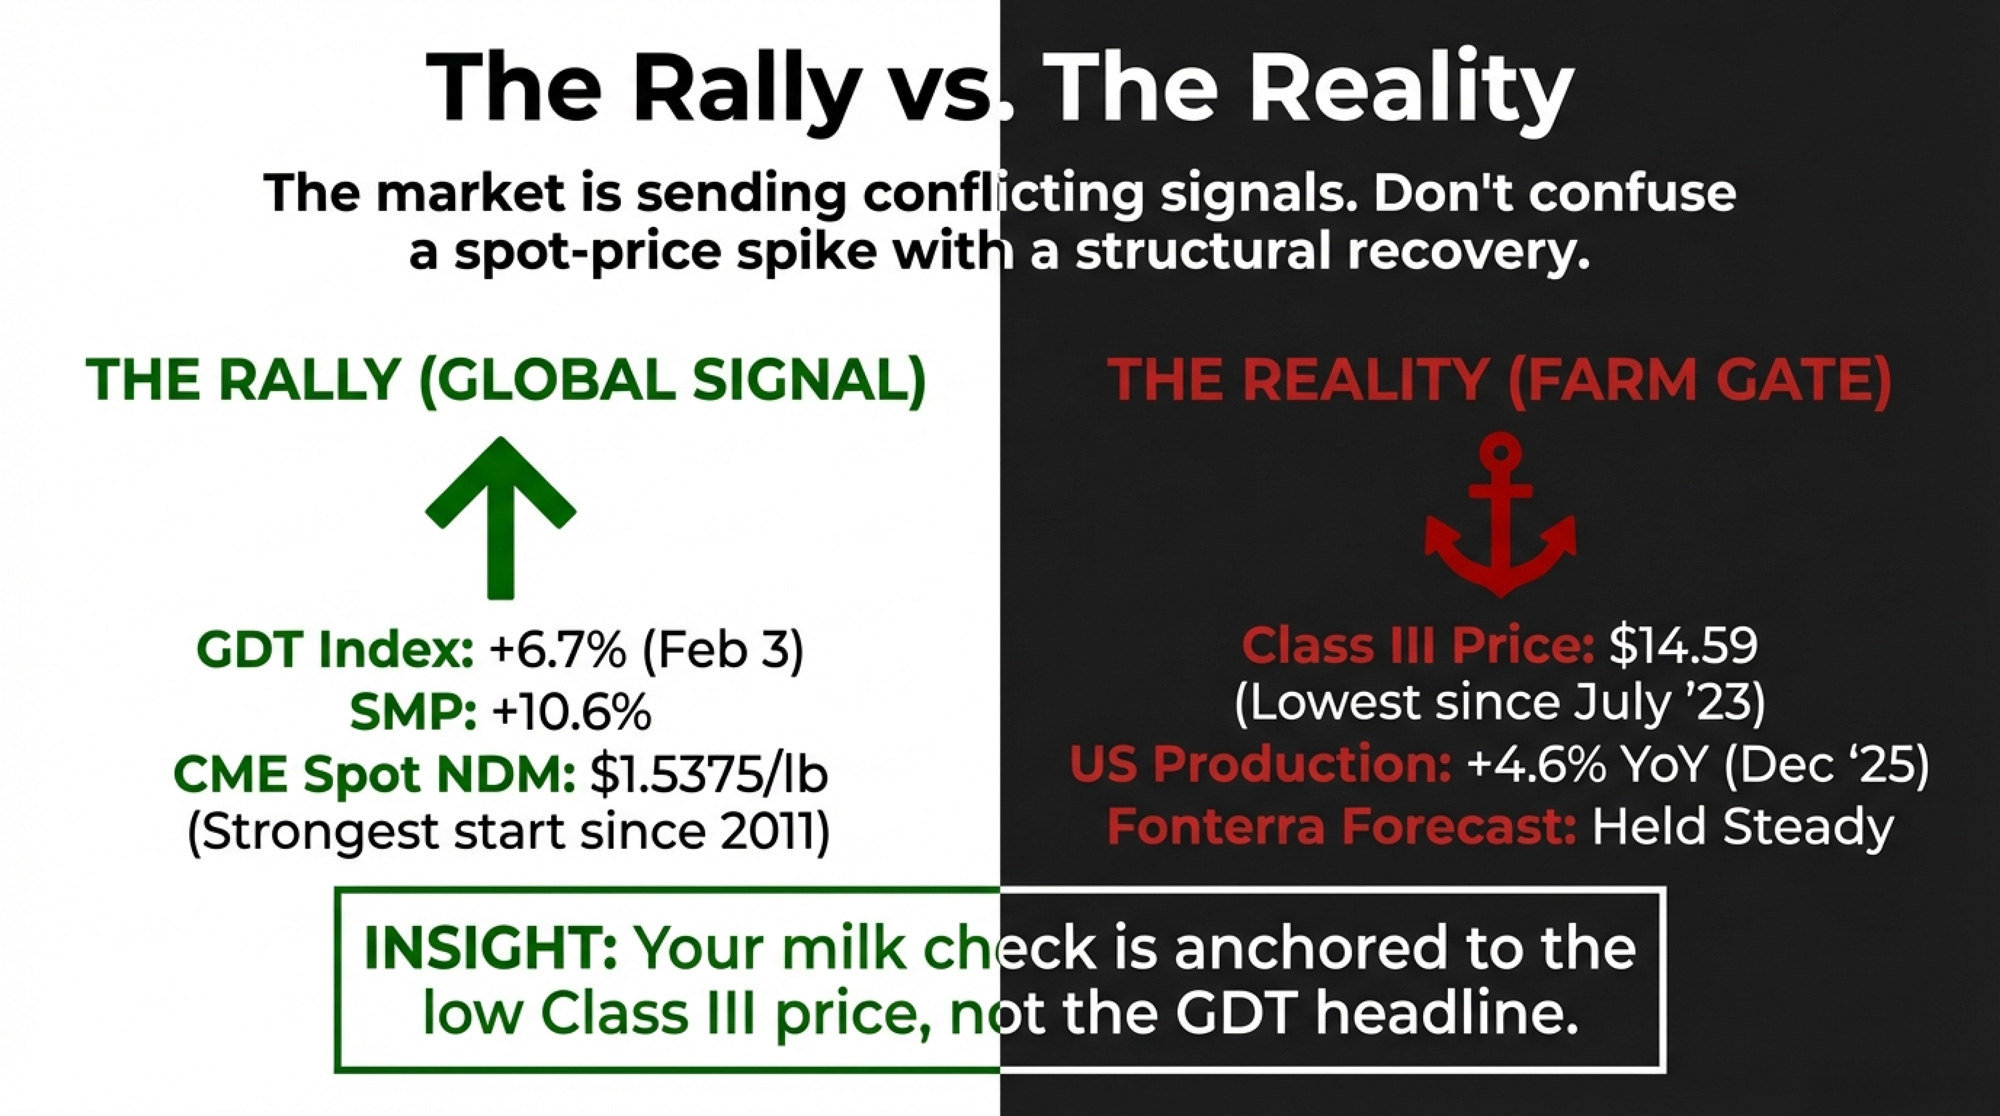
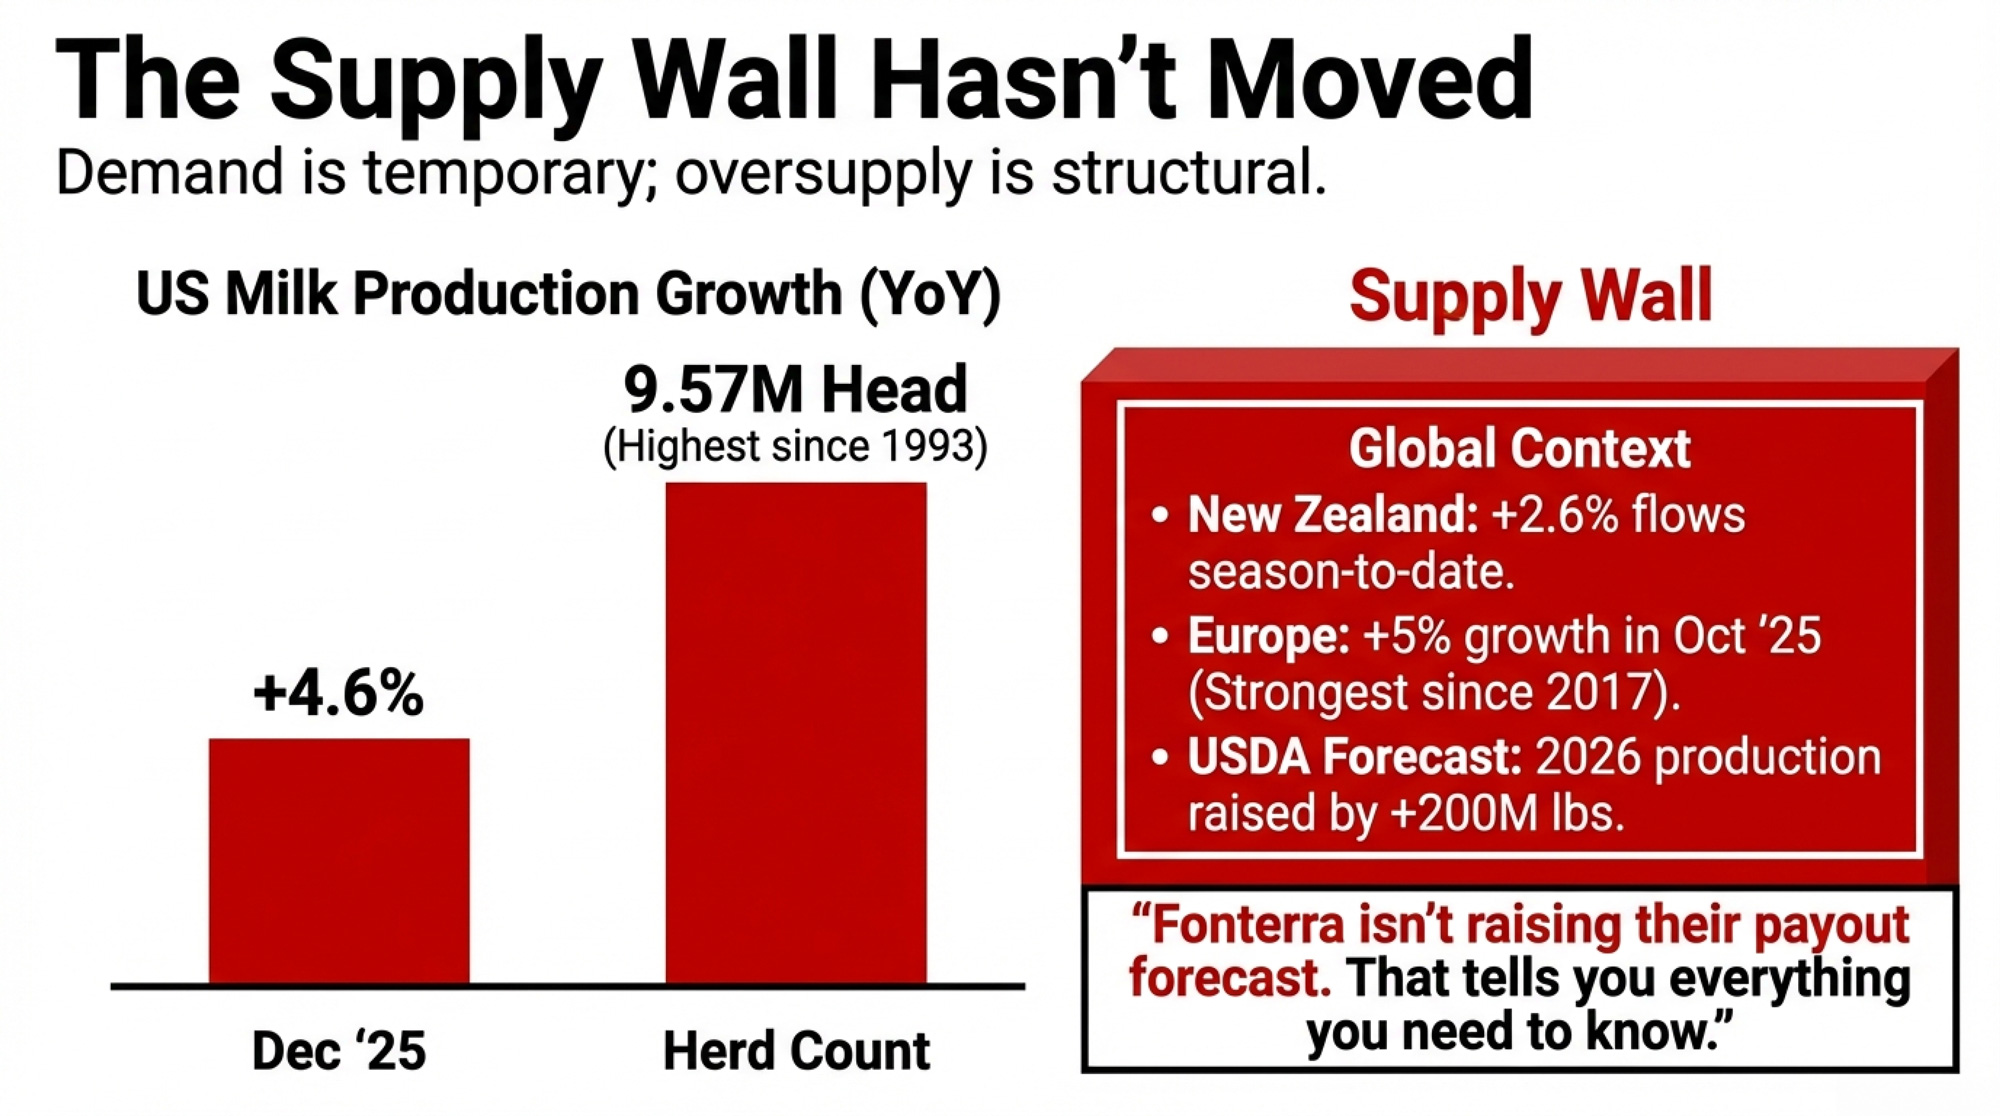
Here’s the tension: US milk production grew 4.6% year-over-year in December, according to USDA; the dairy herd sits at 9.57 million head (the highest since 1993); and Fonterra held its farmgate forecast at NZ$8.50-$9.50/kgMS despite the rally. The supply side isn’t confirming what demand is signaling.
The Head-Fake Setup: Who’s Buying and Why
The demand shift between December and February was dramatic. Three buyer groups drove the surge:
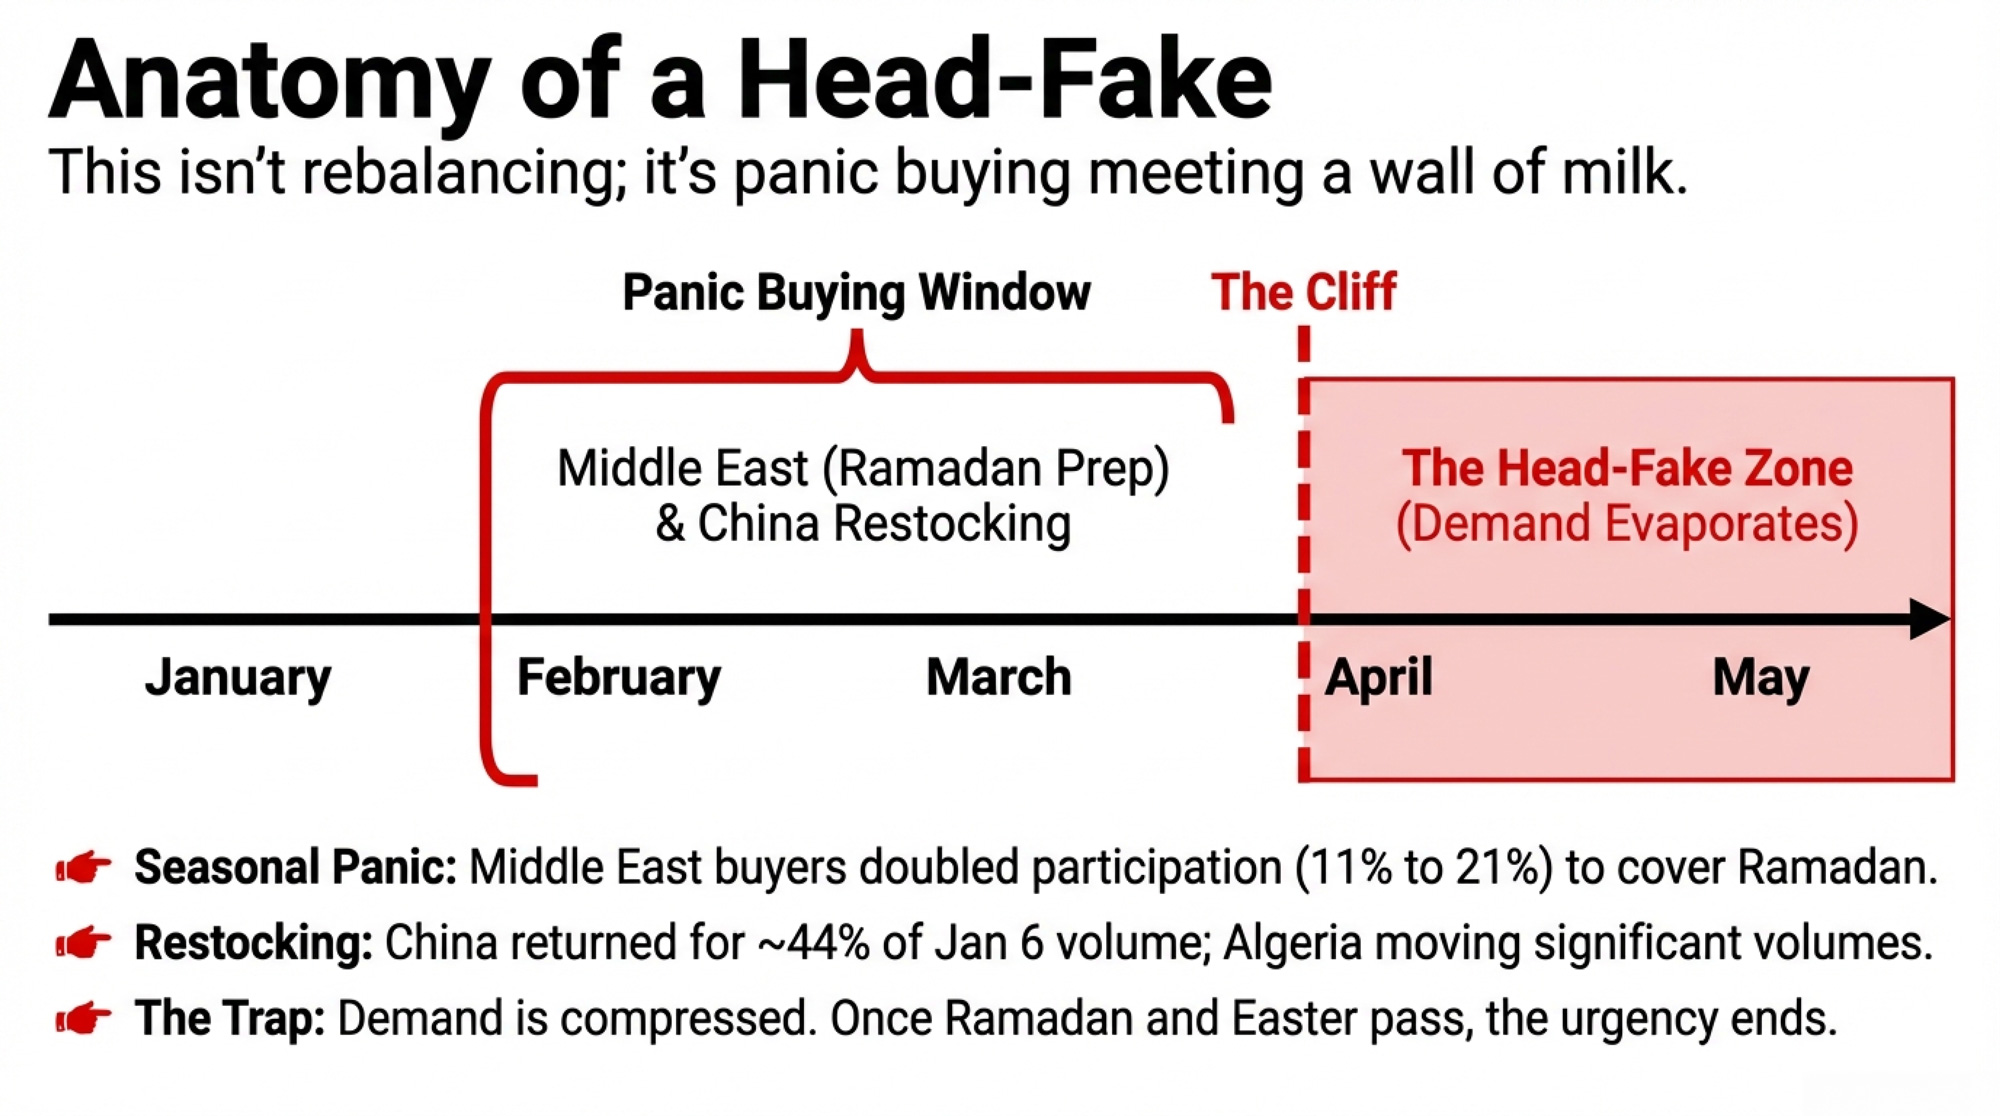
- Middle East: Reportedly doubled GDT participation from approximately 11% to 21%, according to analyst estimates—their highest share in two years—driven by Ramadan preparation beginning late February.
- China: Returned as active purchasers after months of cautious observation, accounting for an estimated 44% of volume sold at the January 6 auction based on analyst tracking.
- Algeria: The ONIL tender in January moved significant volumes of WMP and SMP, re-establishing global price benchmarks after weeks of volatility.
Katie Burgess of Ever.ag captured the core dynamic: global milk powder prices remain “very highly correlated,” so what happens at GDT in New Zealand directly influences US pricing. That correlation is holding. CME spot NDM now trades at roughly a 10% premium to GDT SMP equivalent, suggesting both domestic and export demand are active simultaneously. USDA’s weekly Dairy Market News confirms “tight spot inventories” and “strong international interest.”
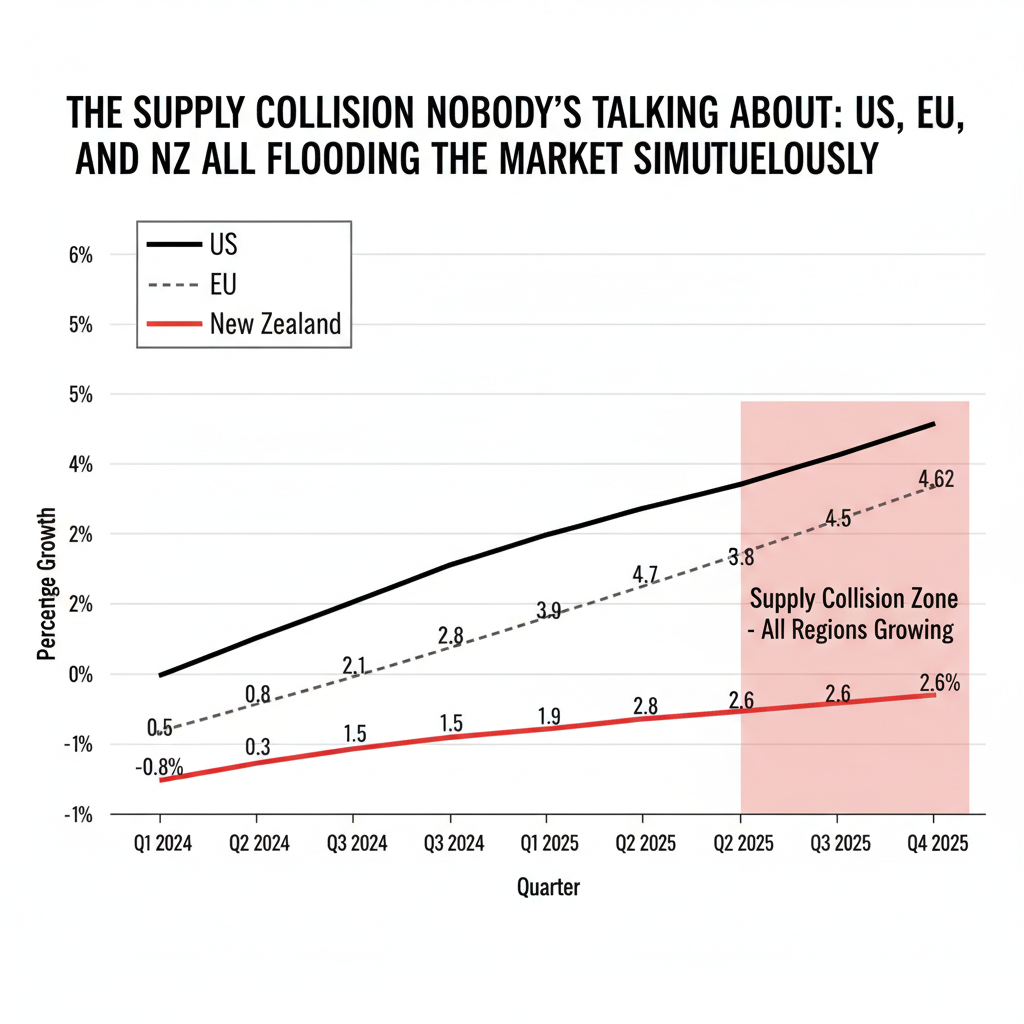
But Fonterra’s decision to hold—not raise—its price forecast tells you what the largest dairy exporter sees in its collection data. New Zealand season-to-date milk flows are running 2.6% above last year, and their full-season forecast was raised to 1,545 million kgMS in November. The supply wall that drove nine consecutive GDT declines through late 2025 hasn’t disappeared. It’s temporarily obscured by compressed seasonal demand.
Why This Head-Fake Looks Different: The Supply Collision
The conventional read on this rally goes something like: “Prices found a floor, buyers returned, the market is rebalancing.”
That assumes supply and demand are moving toward equilibrium. The data says otherwise.
US milk production grew 4.5-4.6% year-over-year in both November and December 2025, per USDA. The January WASDE raised the 2026 production forecast by 200 million pounds to 234.3 billion—up 3.2 billion pounds from 2025. EU milk output posted its strongest growth since 2017 in October 2025, running 5% above year-ago levels according to Eurostat. Rabobank analyst Michael Harvey noted that what made the late-2025 decline unusual wasn’t weak demand—GDT bidder participation stayed above 150—but a “supply collision” where multiple exporting regions flooded the market simultaneously.
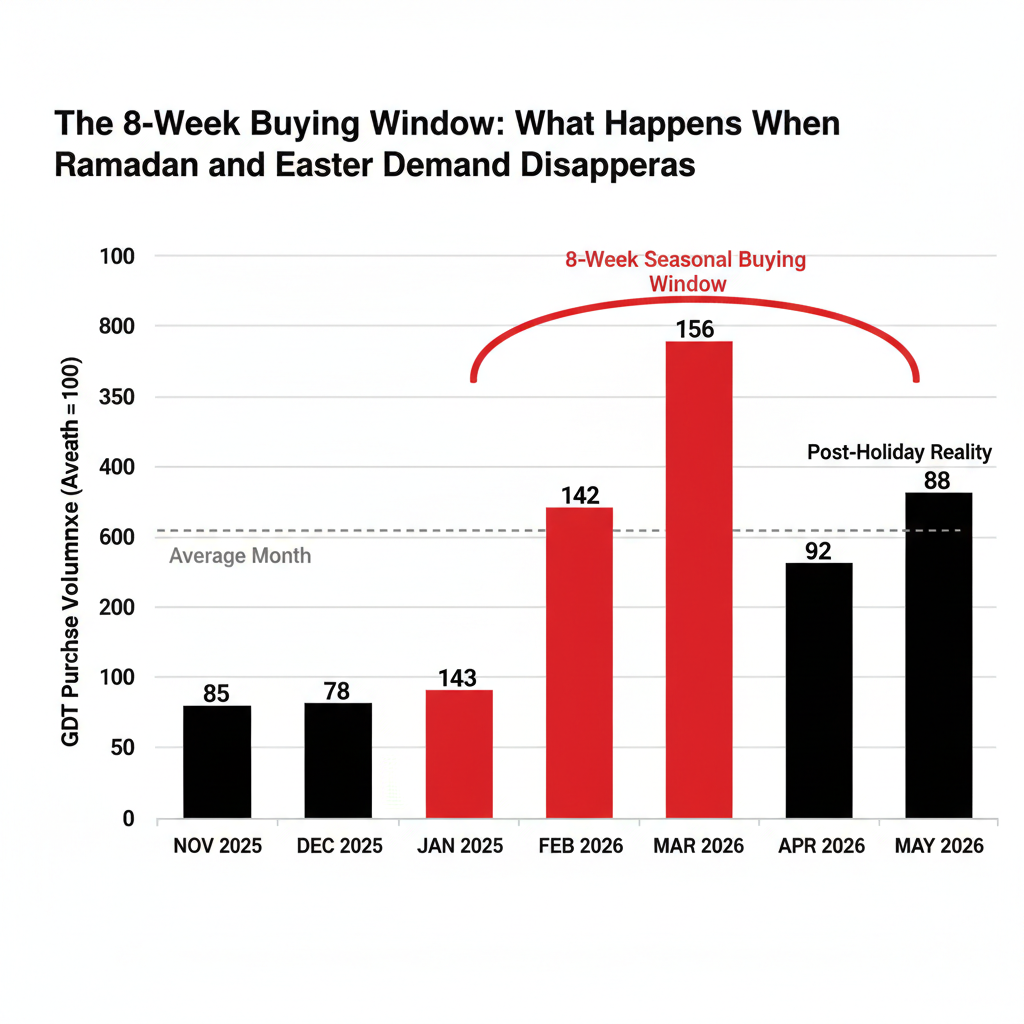
What’s happening now isn’t rebalancing. It’s seasonal demand compression meeting a temporary shift in buyer psychology. Purchasers who depleted inventories waiting for the bottom are scrambling to cover positions before Ramadan and Easter. When that seasonal window closes in April, supply fundamentals reassert themselves.
Head-Fake Math: Margins, Heifers, and Timing Traps
The immediate margin picture remains tough despite the GDT rally. USDA’s December 2025 All-Milk Price came in at $19/cwt, down 70¢ from November. January erodes by another $1/cwt-plus because Class III ($14.59) and Class IV ($13.55) prices are the lowest since July 2023 and February 2021, respectively. For operations in the Upper Midwest and similar regions—where many herds break even in the mid-$16/cwt range based on regional benchmarking data—Q1 2026 milk checks are already underwater.
The futures market sees improvement ahead, with Class III contracts trading in the $17-18/cwt range for Q2-Q3 2026 on CME. But here’s where the timing trap for expansion kicks in.
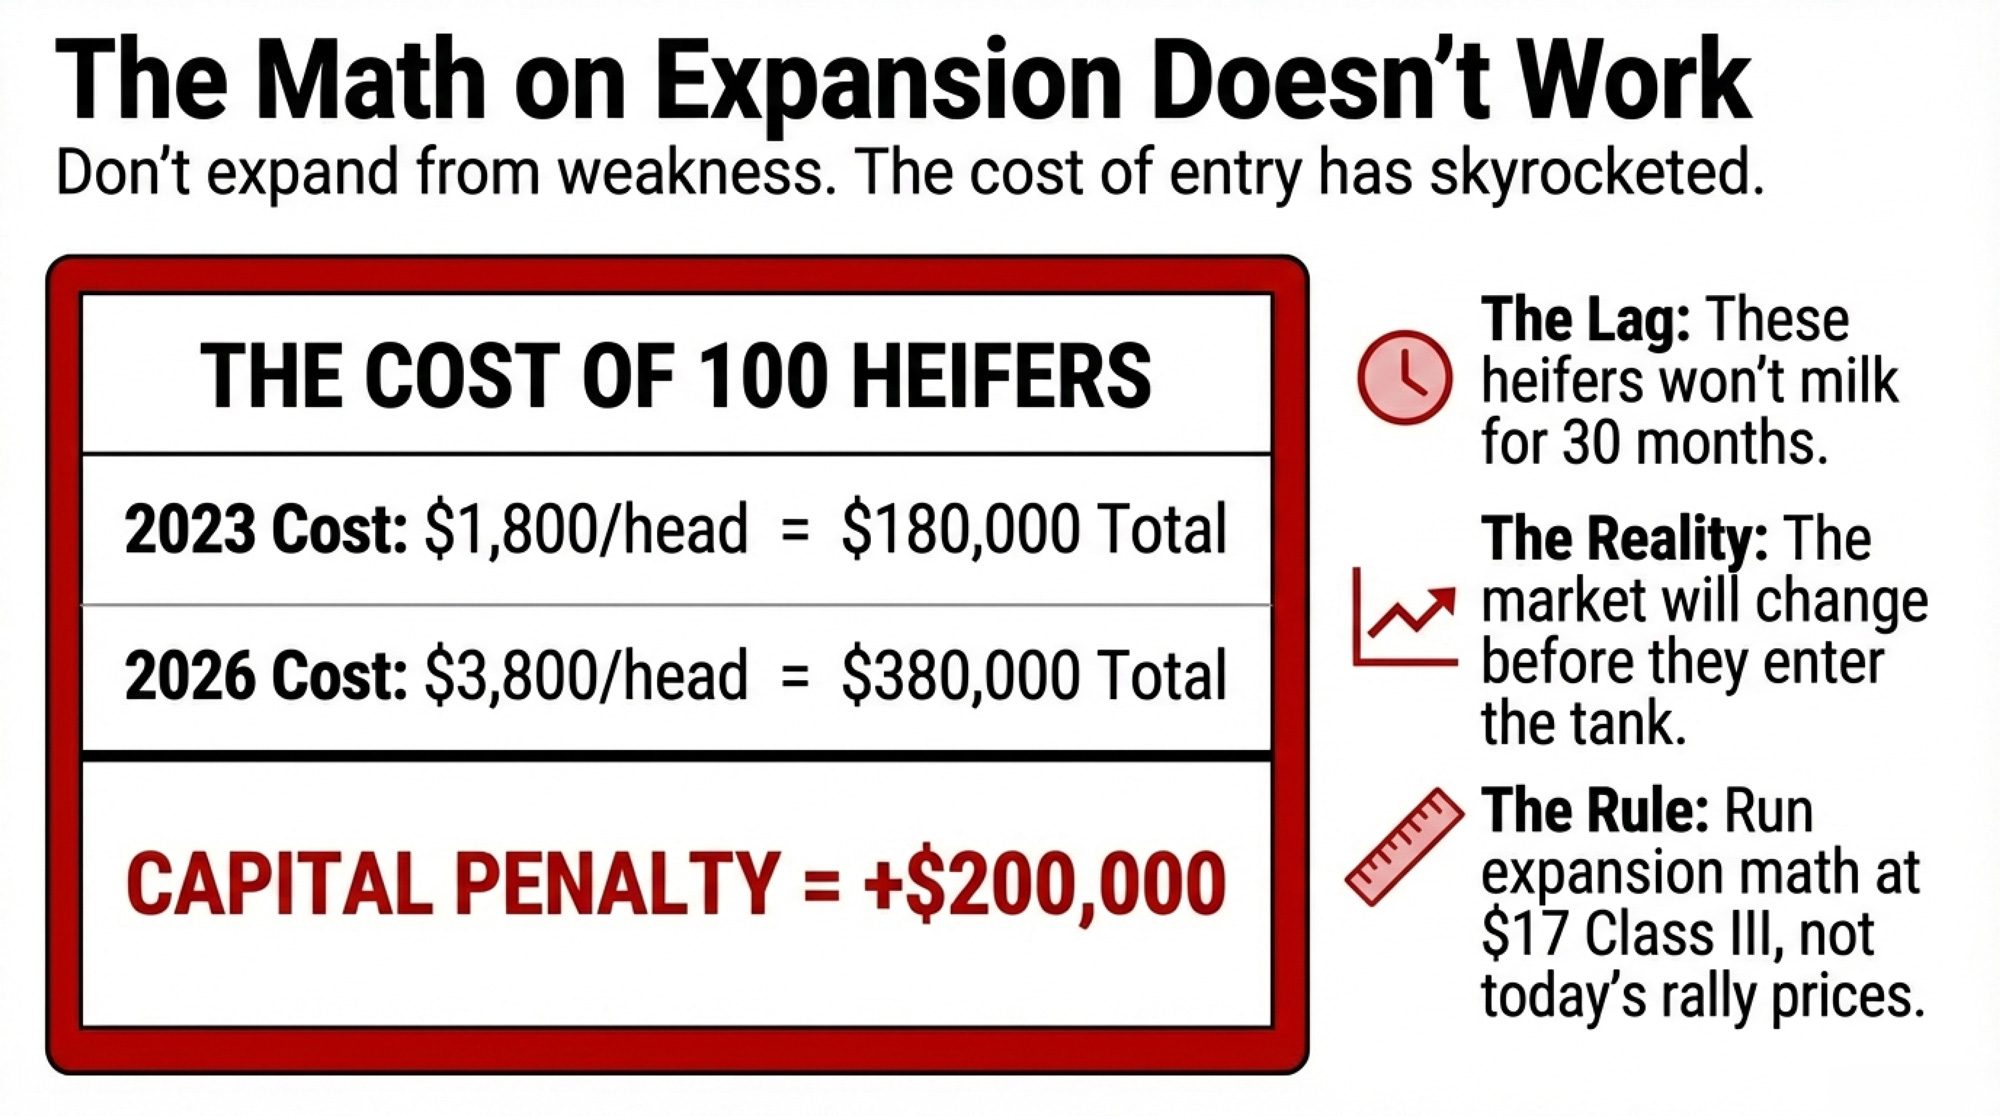
Replacement heifers currently run $3,000-$4,000/head according to USDA livestock data, versus $1,800 in 2023. A 100-heifer expansion now costs $120,000-$220,000 more in heifer costs alone than it would have two years ago—and those heifers won’t hit the milking string for 27-30 months. Market conditions will shift multiple times before the genetics purchased today reach the bulk tank. Producers running that heifer math are finding the rally looks different than it feels.
A December 2025 Bullvine analysis examined the expansion timing gap: operations expanding at 80% barn capacity with intact working capital face dramatically better outcomes than those expanding at 95% capacity with depleted reserves. This rally creates exactly the psychological conditions that lead producers to expand from weakness rather than strength.
| Cost Category | 2023 Cost (100-Head) | 2026 Cost (100-Head) | Cost Increase |
| Replacement Heifers | $180,000 ($1,800/hd) | $350,000 ($3,500/hd) | +$170,000 |
| Feed Costs (27-mo to freshening) | $81,000 ($810/hd) | $95,000 ($950/hd) | +$14,000 |
| Facility/Equipment Allocation | $125,000 | $160,000 | +$35,000 |
| Interest Carry (2-yr avg on capex) | $18,000 (5.5% rate) | $28,000 (7.2% rate) | +$10,000 |
| TOTAL EXPANSION COST | $404,000 | $633,000 | +$229,000 (+57%) |
The Butterfat Head-Fake: Why Components Tell a Different Story
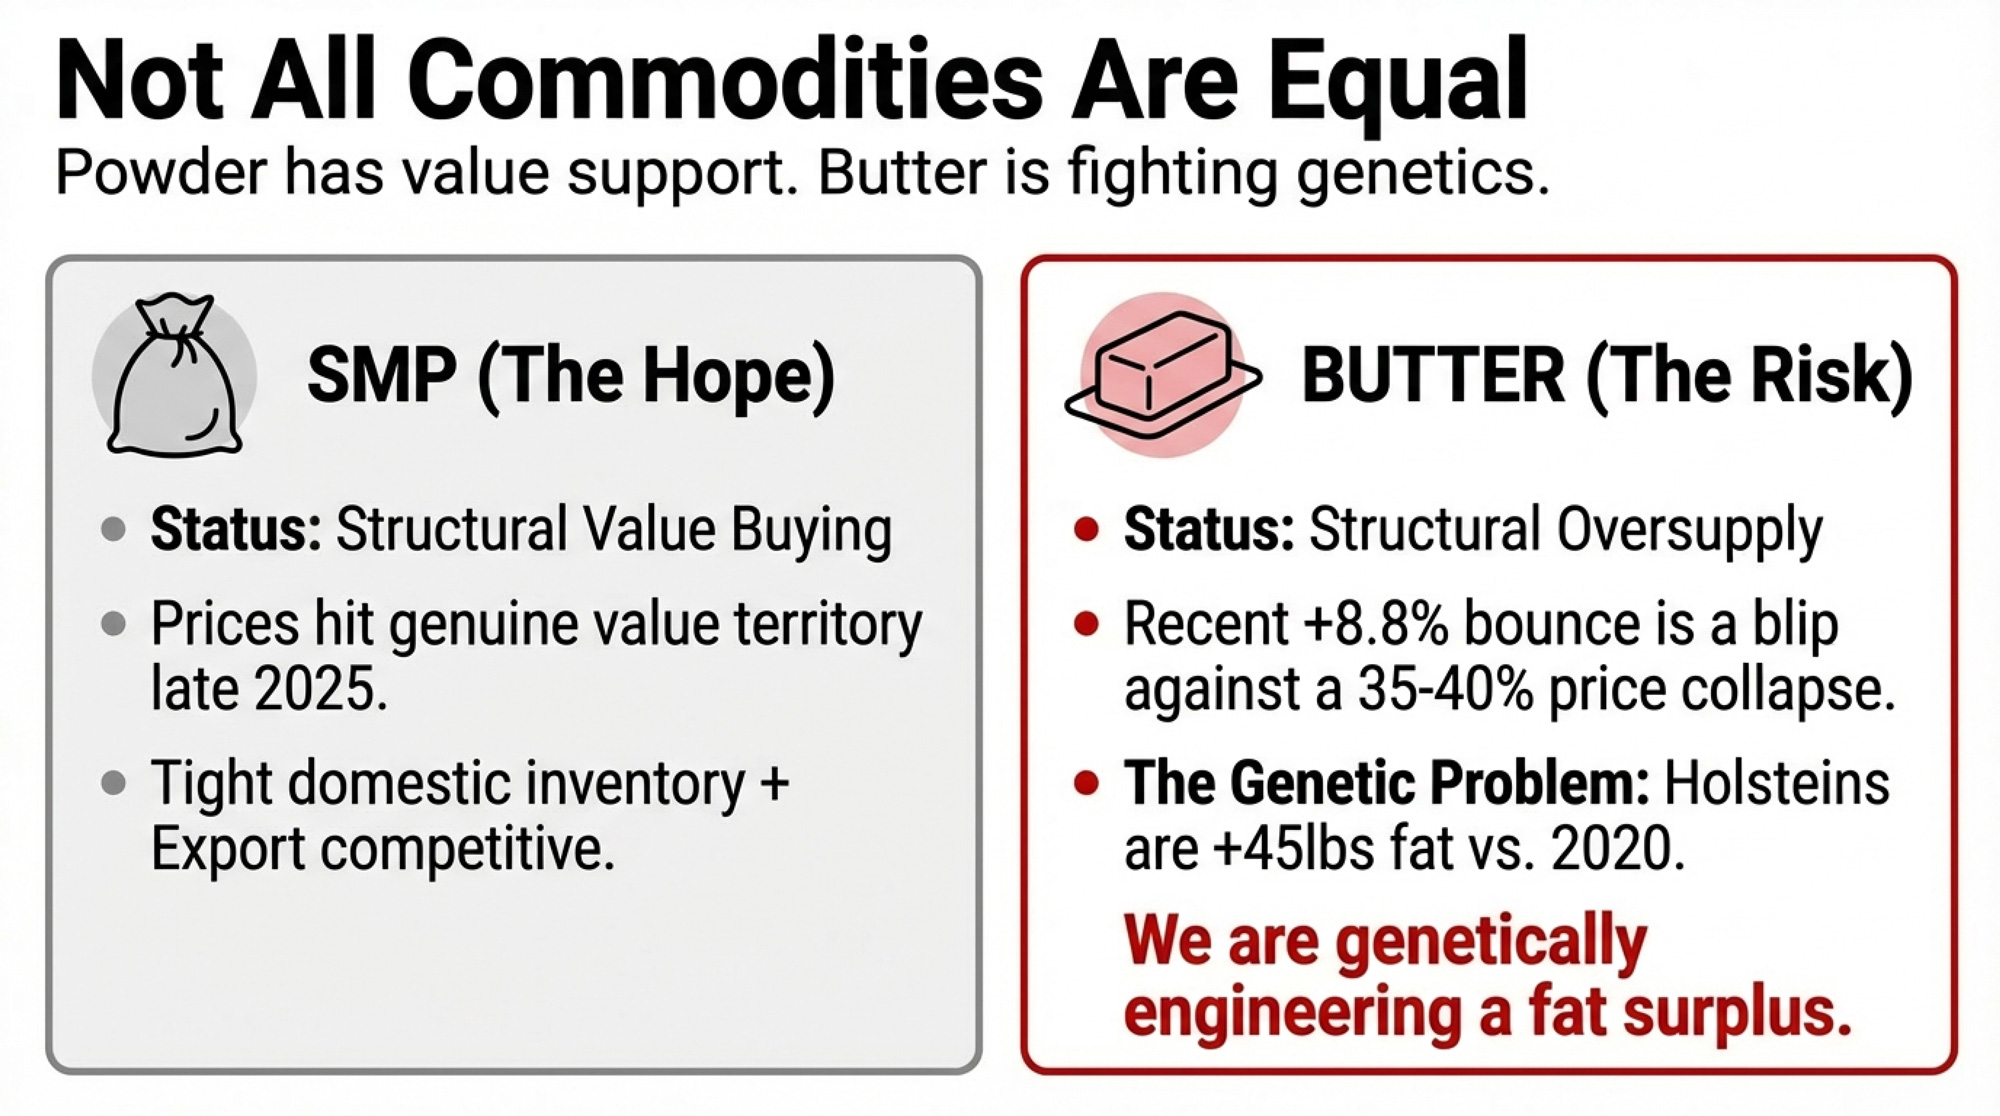
Product category behavior reveals which segments are genuinely rebalancing versus catching temporary bids. At the February 3 GDT auction, SMP led at +10.6% while butter rose 8.8% to $5,773/MT. That might look like broad-based strength. Context says otherwise: butter dropped roughly 35-40% from its May 2025 peak to December’s lows on GDT. The 8.8% bounce doesn’t erase that collapse.
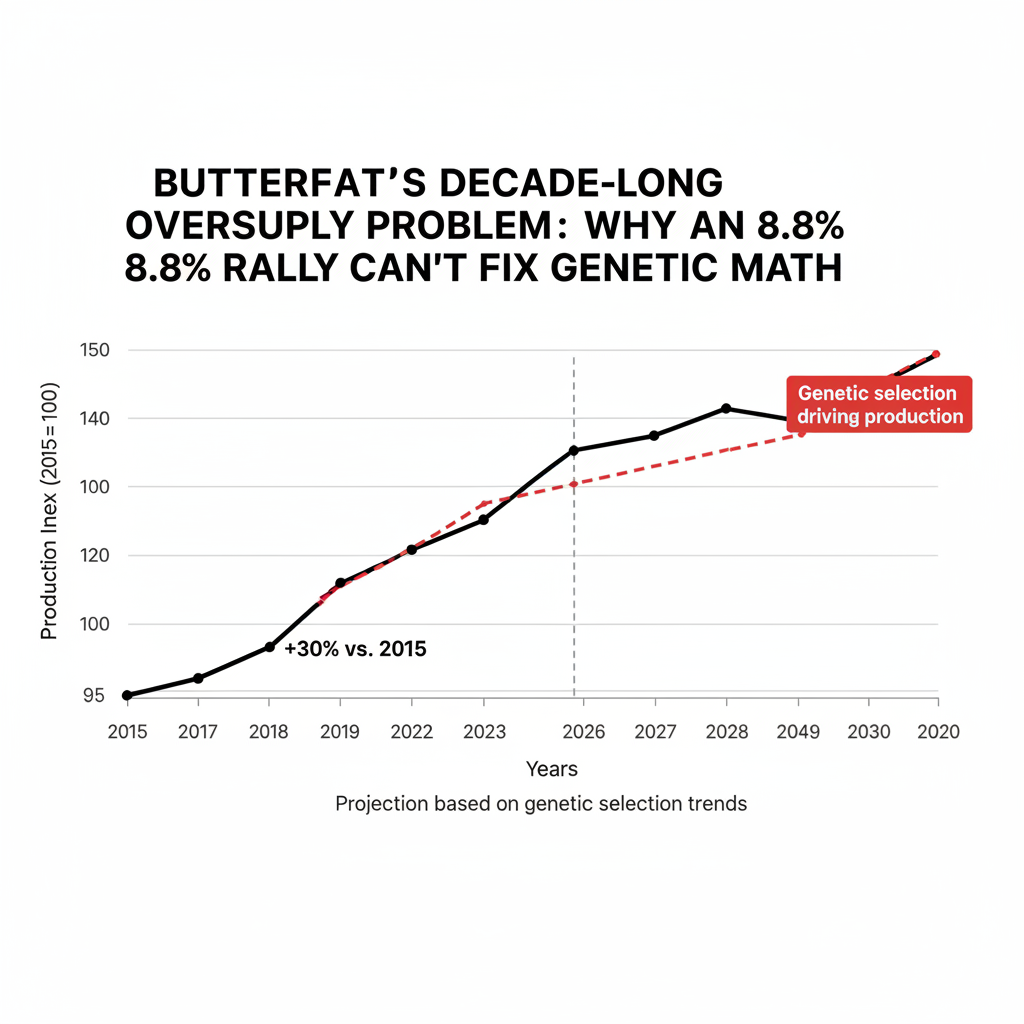
The structural problem for butterfat is genetic. US butterfat production grew approximately 30% from 2011 to 2024, outpacing overall milk production growth. Corey Geiger of CoBank put it directly: “This isn’t a demand issue. It’s clearly a ‘We’re supplying way too much.'” Holsteins averaged a 45-lb butterfat rollback in the April 2025 CDCB evaluation—significantly higher than 2020 levels. The cows producing today’s oversupply are already in herds, and some geneticists project genetic selection could push average butterfat content toward 5% within the decade.
SMP tells a different story. Prices genuinely reached value territory at late-2025 lows ($1.18/lb equivalent on GDT), triggering buying that appears more structural than seasonal. Both CME and GDT powder markets are moving in sync, domestic inventories remain tight, and the US has regained export competitiveness after losing Asia market share to New Zealand in 2023-2024.
For hedging decisions, this divergence matters. Butter exposure carries a higher reversal risk post-Easter; powder positions have better structural support—though still vulnerable to the production surge.
Four Paths If This Is a Head-Fake
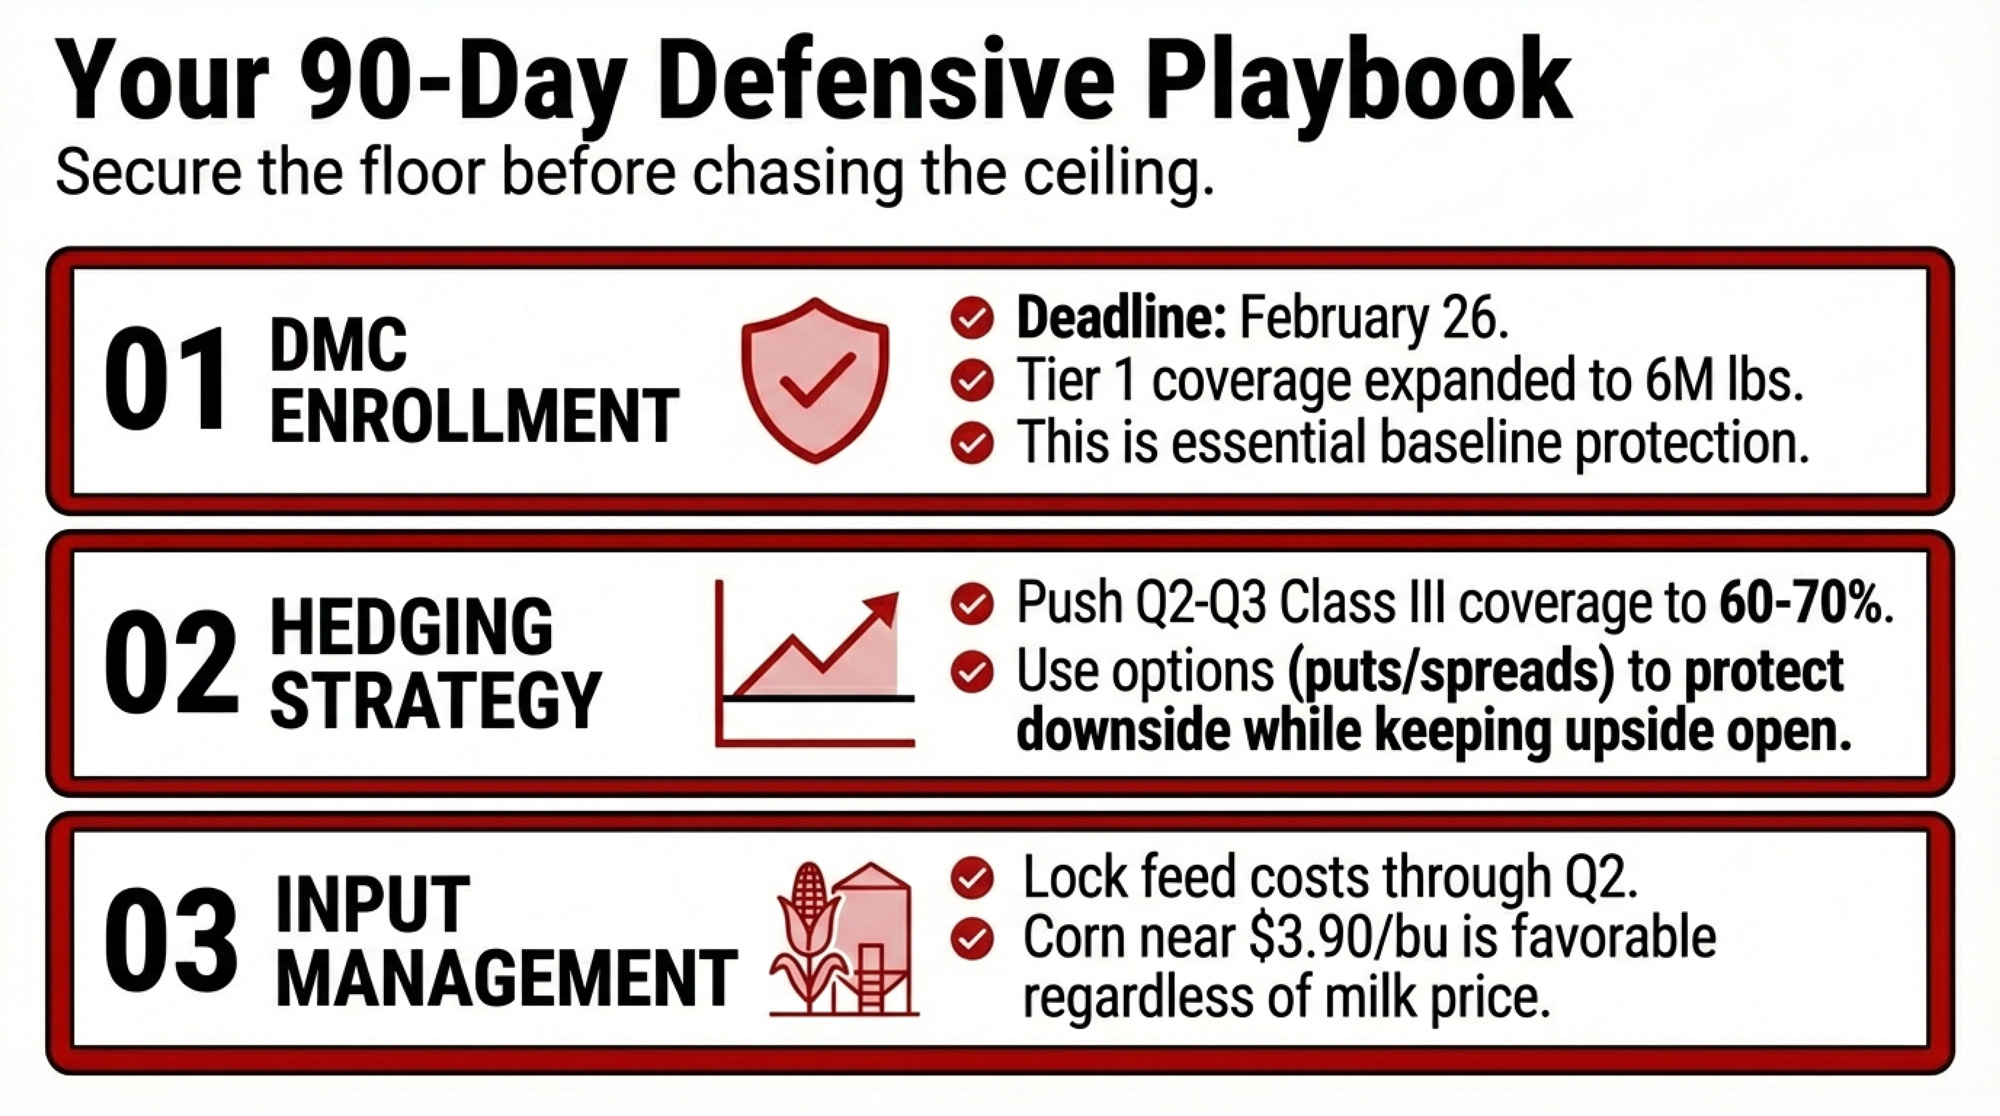
DMC Enrollment (Deadline: February 26, 2026)
USDA’s Tier 1 coverage was expanded to 6 million pounds for 2026, and analysts expect payments early this year amid current margin compression. The multi-year commitment option (2026-2031) locks in a 25% premium discount per FSA program terms.
Trade-off: You’re paying premiums through 2031 even if margins recover strongly. But current signals don’t support betting on a rapid recovery. Use the University of Tennessee DMC calculator to optimize coverage level for your production history.
Hedging Coverage
Risk management advisors often suggest 60-70% coverage at elevated premium levels for Class III, keeping 25-30% open for potential upside. Options (puts/put spreads) preserve participation if the rally extends, versus futures that lock you out of gains. Lock feed costs through Q2—corn near $3.90/bu on CME represents favorable input pricing regardless of milk price direction.
Trade-off: Over-hedging costs you if this rally proves structural; under-hedging hurts if April auctions give back Q1 gains.
Capital Allocation
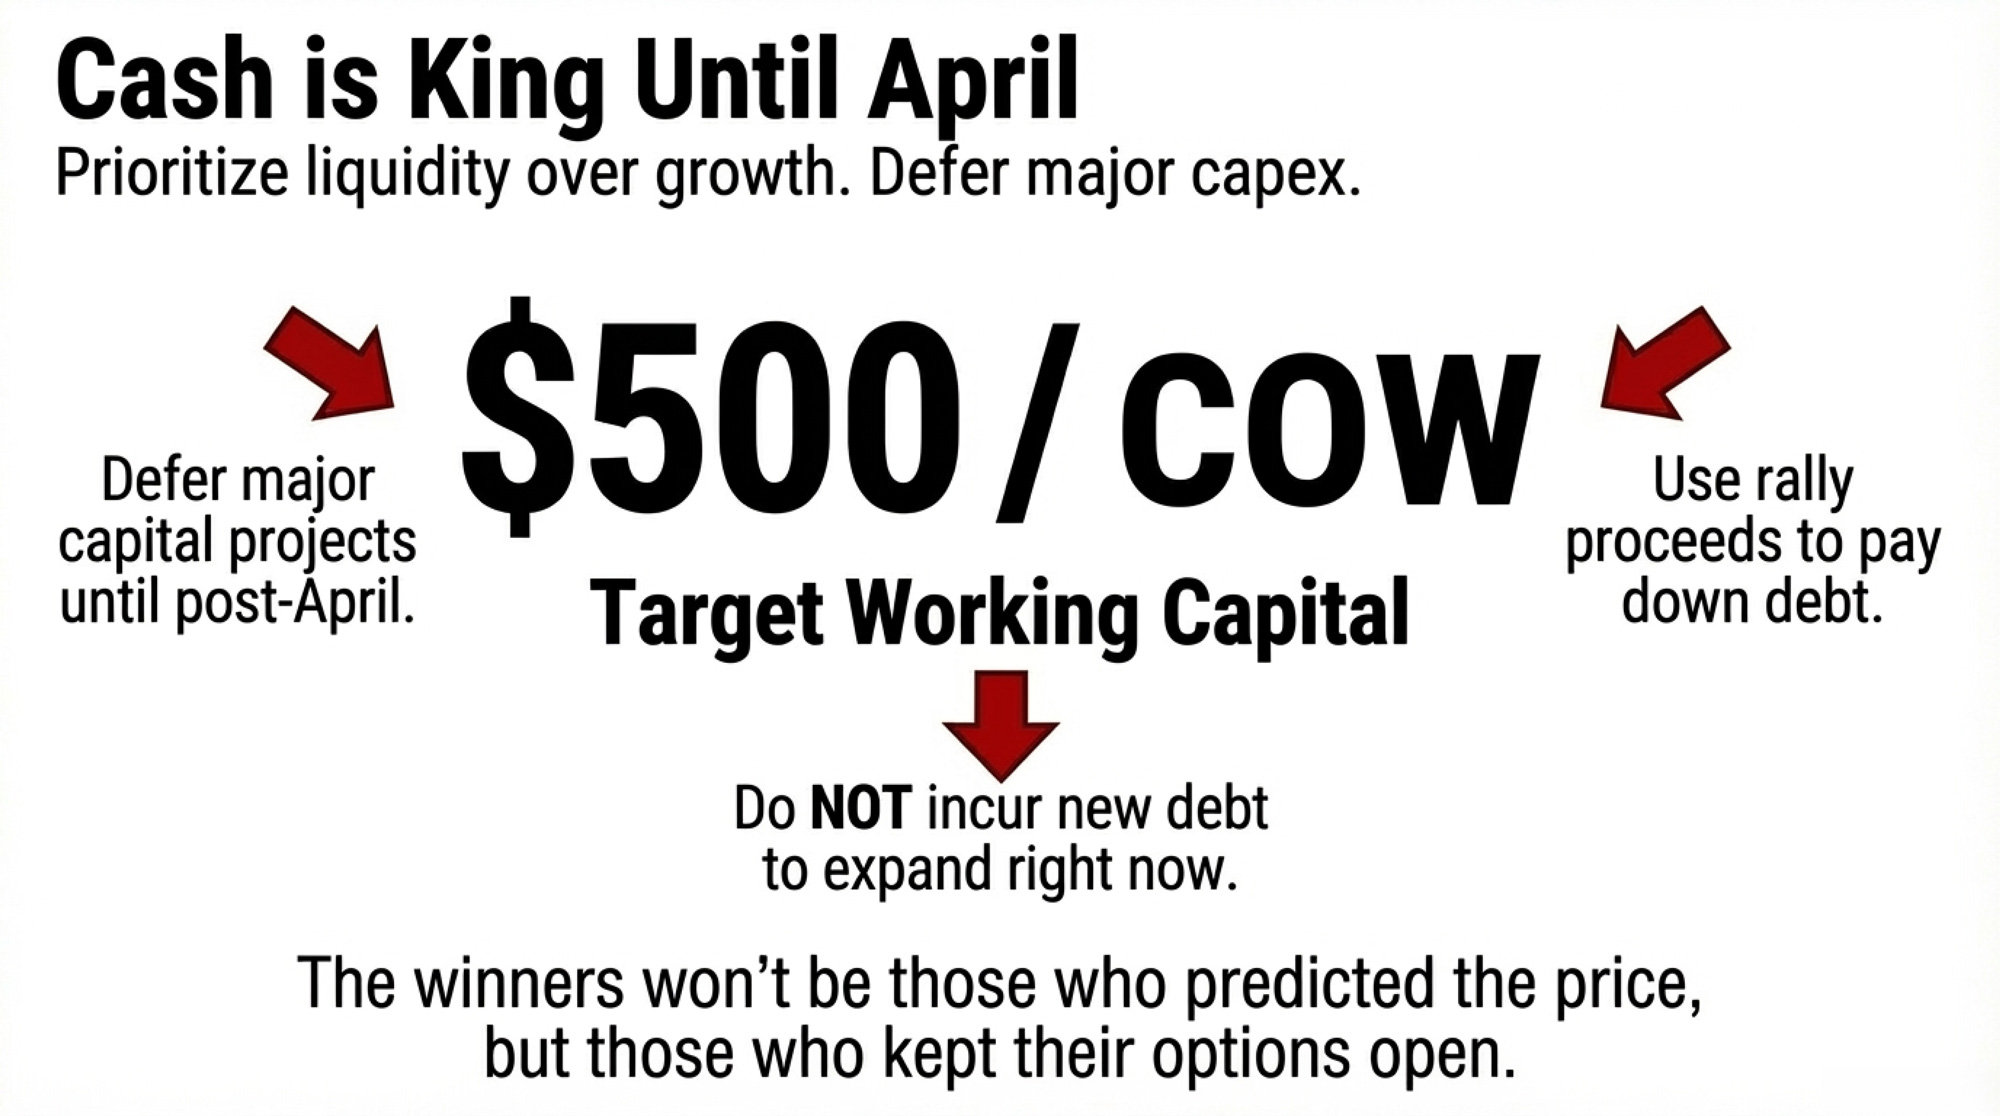
Lender reports indicate many producers are prioritizing paying down loans and building working capital over expansion. That’s the right read for this environment. Many advisors suggest targeting working capital at $500-550/cow before committing to expansion. Defer major capital projects until post-April GDT results confirm whether the rally has structural support.
Expansion Timing
Wait for post-holiday GDT auctions (April 7 and April 21) before committing. Test project economics at $17/cwt Class III, not current rally prices. Don’t expand from a position where depleted reserves require the rally to continue.
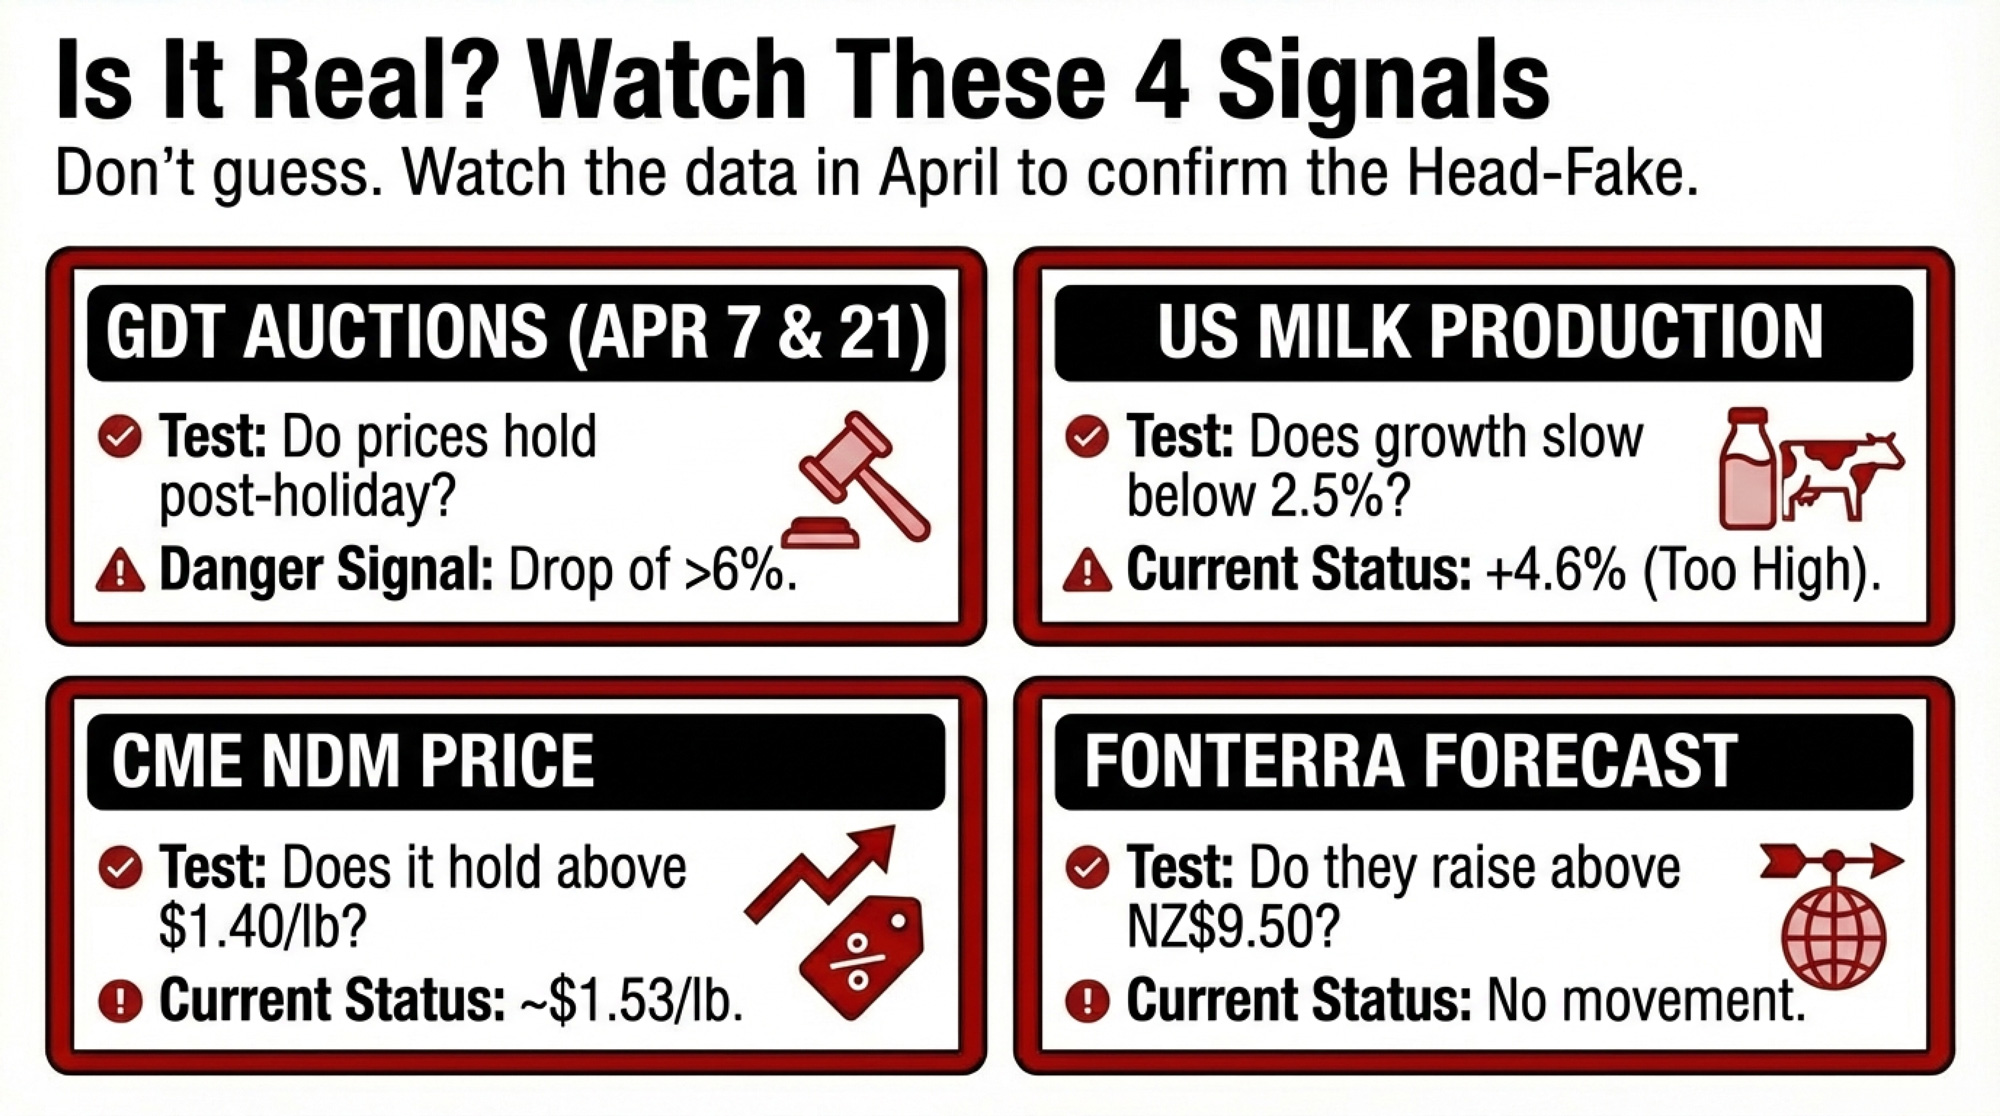
Four Indicators: Head-Fake or Real Recovery?
| Indicator | “Recovery Has Legs” | “Head-Fake Confirmed” |
| GDT Post-Holiday (Apr 7, 21) | Prices hold within 3% of March highs | Drop 6%+ from March levels |
| US Milk Production | Growth moderates to <2.5% YoY by the March report | Continues at 4%+ YoY |
| CME Spot NDM | Holds above $1.40/lb through April | Falls below $1.25/lb |
| Fonterra Forecast | Raises above NZ$9.50 | Holds or cuts below $8.50 |
The April 7 and April 21 auctions are the critical test per GDT’s published calendar. That’s when Ramadan and Easter demand releases. If prices hold, it’s fundamentals. If they crash, the head-fake is confirmed.
What This Means for Your Operation
- Enroll in DMC by February 26. The expanded Tier 1 coverage and current margin compression make this a defensive baseline regardless of rally outlook.
- If you’re hedged below 50% for Q2-Q3, the current rally provides an opportunity to add coverage. Target 60-70% total to balance protection with upside participation.
- If you’re considering expansion, run your economics at $17/cwt Class III—not current futures—and don’t commit until April GDT results confirm or deny structural support.
- The critical threshold: working capital around $500/cow before any major capital deployment. Below this, use the rally to strengthen reserves rather than expand commitments.
- If you’ve been assuming the supply surge would self-correct through lower prices driving exits, check whether your region is actually seeing herd contraction. National USDA data shows the opposite.
- Red flag: Any expansion plan that requires Class III to stay above $18/cwt carries an elevated risk given the current production trajectory.
Key Takeaways
- The rally is real, but likely a seasonal head fake. Three consecutive GDT gains driven by Ramadan/Easter buying and inventory restocking—not structural rebalancing of a 4.6% US production surge.
- April auctions are your decision point. The post-holiday GDT events (April 7 and 21) will reveal whether demand can absorb the supply wall. Don’t make irreversible commitments before then.
- Butterfat and powder are telling different stories. SMP shows signs of genuine value buying; butter’s 8.8% bounce doesn’t offset a 35-40% collapse driven by structural genetic oversupply.
- Use the rally to strengthen the position, not bet on continuation. Build working capital, add hedging coverage, pay down debt. The producers who maintain optionality will outperform those who commit prematurely.
The Bottom Line
The producers who navigate the next 90 days successfully won’t be the ones who correctly called the market’s direction. They’ll be the ones who kept their options open while others locked themselves into bets they couldn’t afford to lose.
Every cycle looks obvious in hindsight. Where does your operation sit on the spectrum between building reserves and betting on continuation?
Complete references and supporting documentation are available upon request by contacting the editorial team at editor@thebullvine.com.
Learn More
- Squeezed Out? A 12-Month Decision Guide for 300-1,000 Cow Dairies – Gain a concrete roadmap for navigating high replacement costs and component shifts. This guide breaks down robotic milking ROI and identifies specific management cuts that protect your cash flow when margins tighten.
- More Milk, Fewer Farms, $250K at Risk: The 2026 Numbers Every Dairy Needs to Run – Secure the strategy needed to outlast the current supply surge and structural market imbalance. This analysis exposes the “biological trap” of beef-on-dairy and prepares your operation for the massive $250,000 annual margin gap.
- Genetic Correlations Upended: Why Sticking with Old Breeding Indices Could Cost Your Dairy $486 Per Cow– Capture a $486-per-cow profit opportunity by leveraging the latest genetic base changes. This piece empowers you to secure higher premiums by aligning your breeding program with the market’s evolving butterfat and protein realities.
 Join the Revolution!
 Join the Revolution!
Join over 30,000 successful dairy professionals who rely on Bullvine Weekly for their competitive edge. Delivered directly to your inbox each week, our exclusive industry insights help you make smarter decisions while saving precious hours every week. Never miss critical updates on milk production trends, breakthrough technologies, and profit-boosting strategies that top producers are already implementing. Subscribe now to transform your dairy operation’s efficiency and profitability—your future success is just one click away.


