


Forty years of feet-and-leg scores barely moved lameness. One Arizona herd did it in two — and now CDCB says the heritability is 0.27. Ready to rethink your sire list?
Executive Summary: CDCB is developing a new mobility trait with h² = 0.27, roughly three times the genetic leverage of the foot angle scores breeders have relied on for four decades. Triple G Dairy in Buckeye, Arizona, went from being its vet’s “worst dairy” for lameness to zero lame cows in a 100‑cow audit after two years of CattleEye cameras, better foot care, and crew training — and its daily camera data now feed CDCB’s research engine. Across six cooperator farms and more than 667,000 hoof‑trimmer records, the project is building mobility PTAs that reflect how cows actually walk, not just how they stand for a classifier. With each clinical lameness case costing about $337, and lame cows in CDCB’s reference set losing 619.2 pounds of milk per lactation — about $117–131 per cow at today’s and 2026’s forecast milk prices — the economic stakes are too big to ignore. The piece lays out three concrete investment paths (simple sire filtering, genomic testing, and full‑blown camera monitoring), with pros, cons, and herd‑size thresholds for each. It closes with a 30/90/365‑day playbook that starts by having you pull your own lameness‑related cull records and ends with revisiting your sire lineup once mobility PTAs go live.
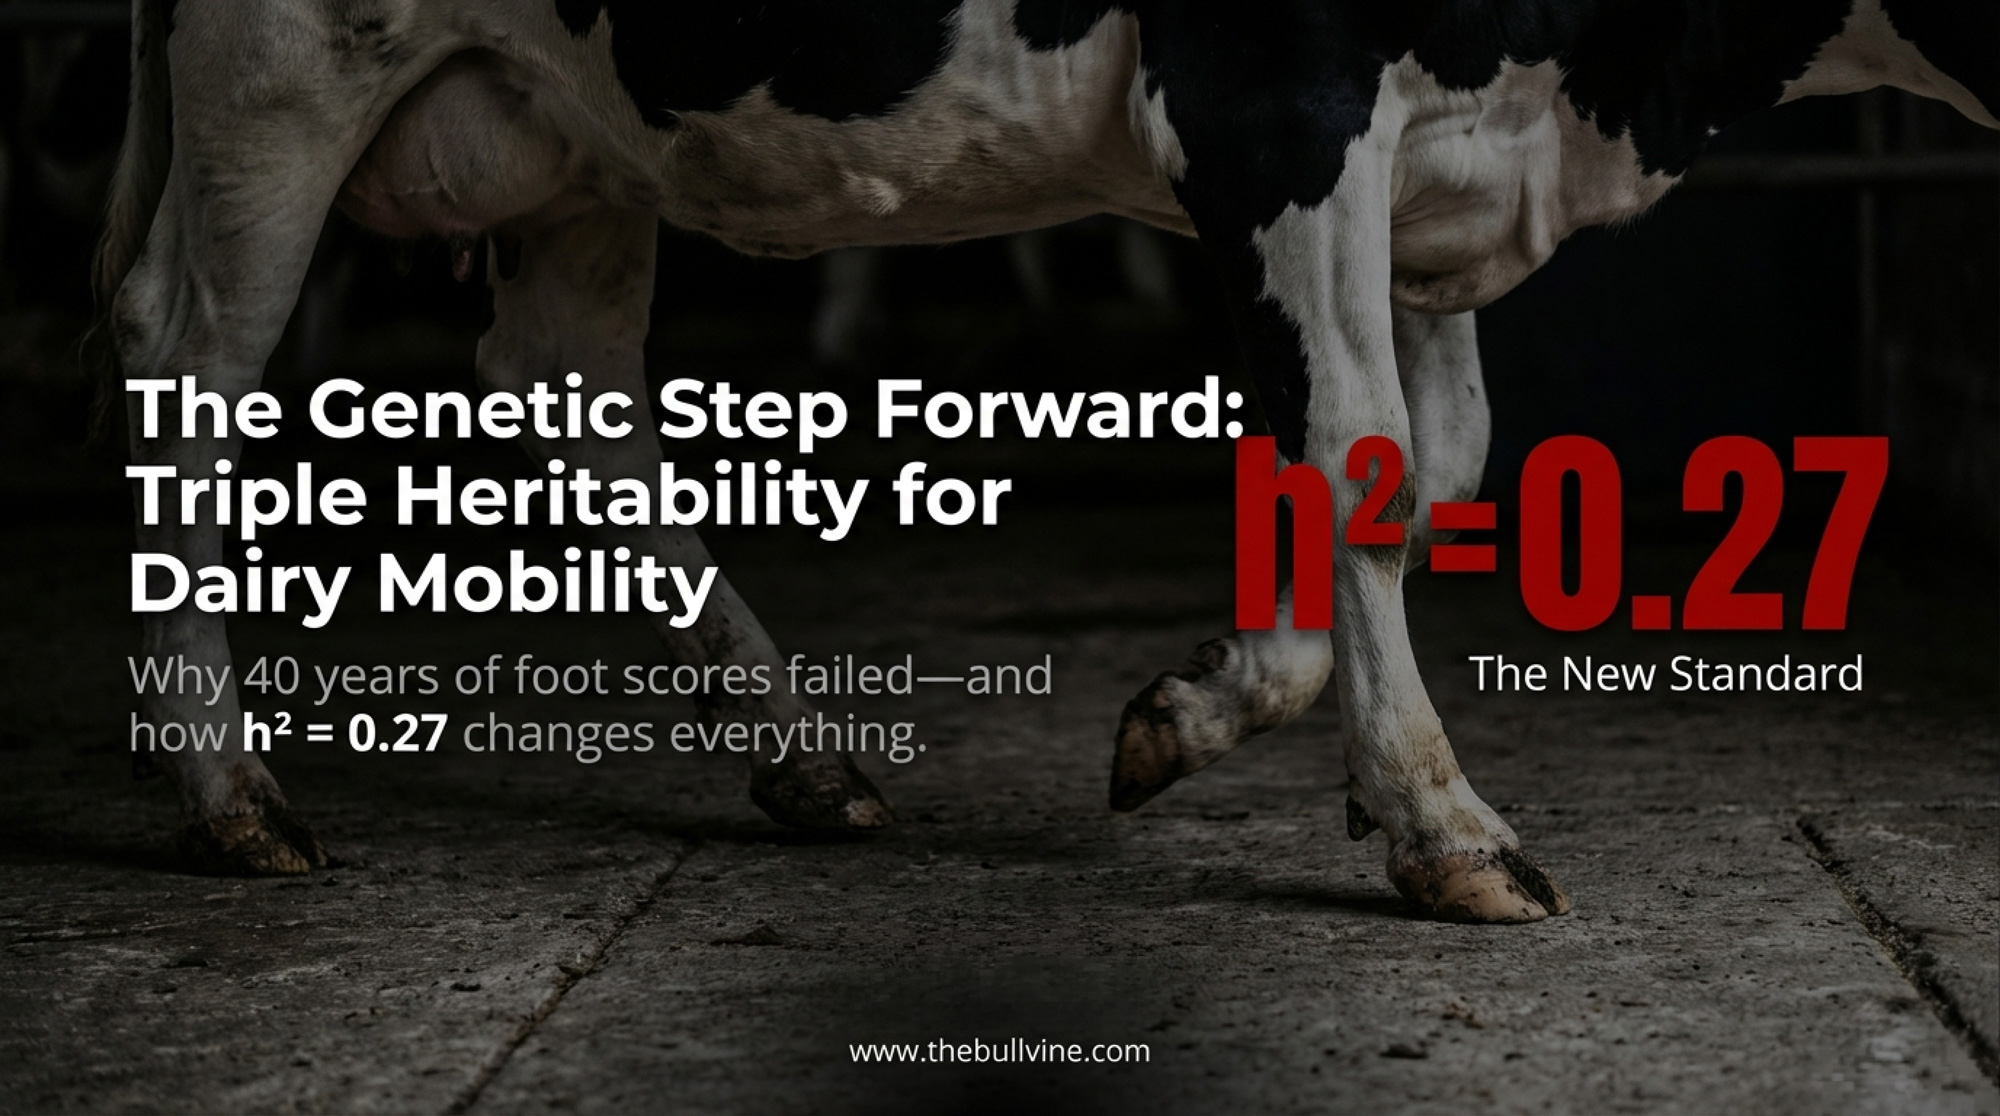
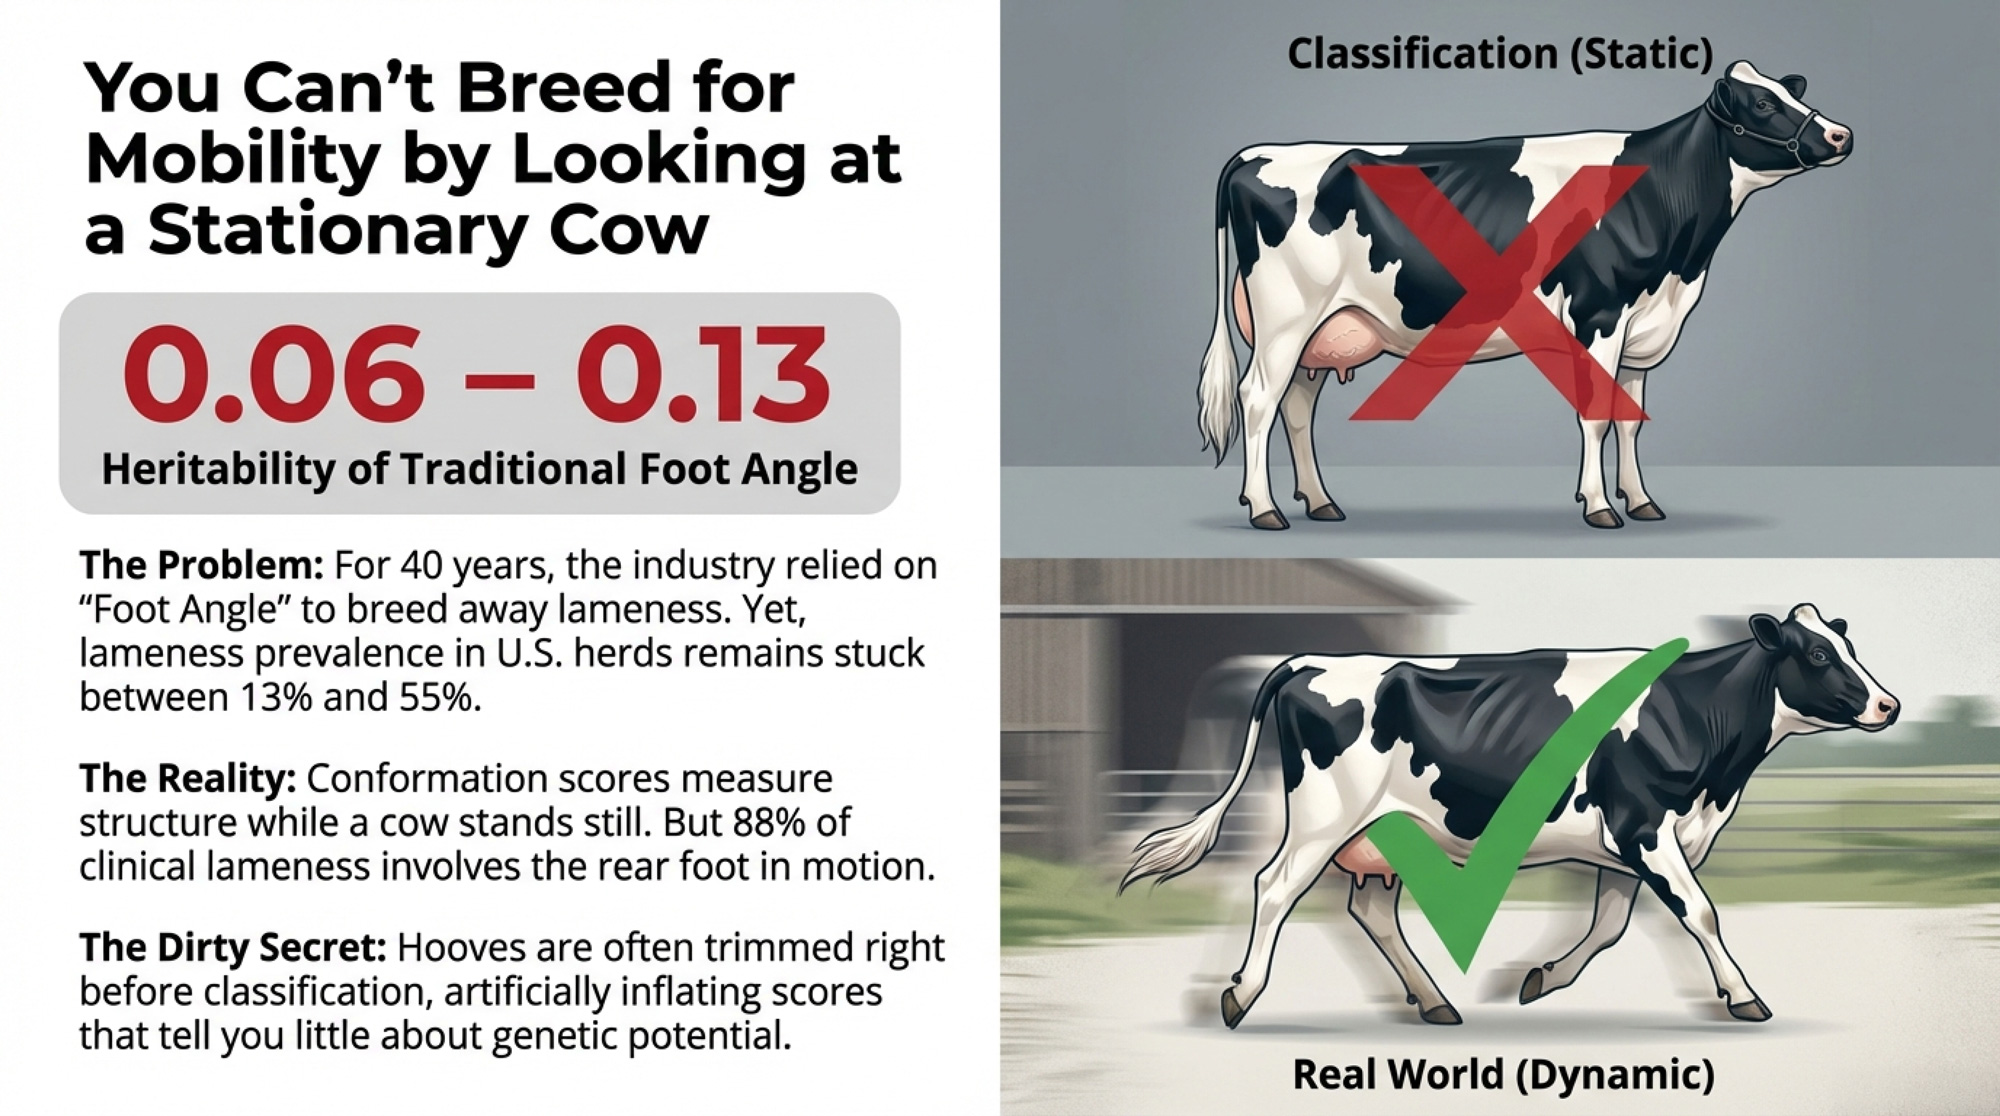
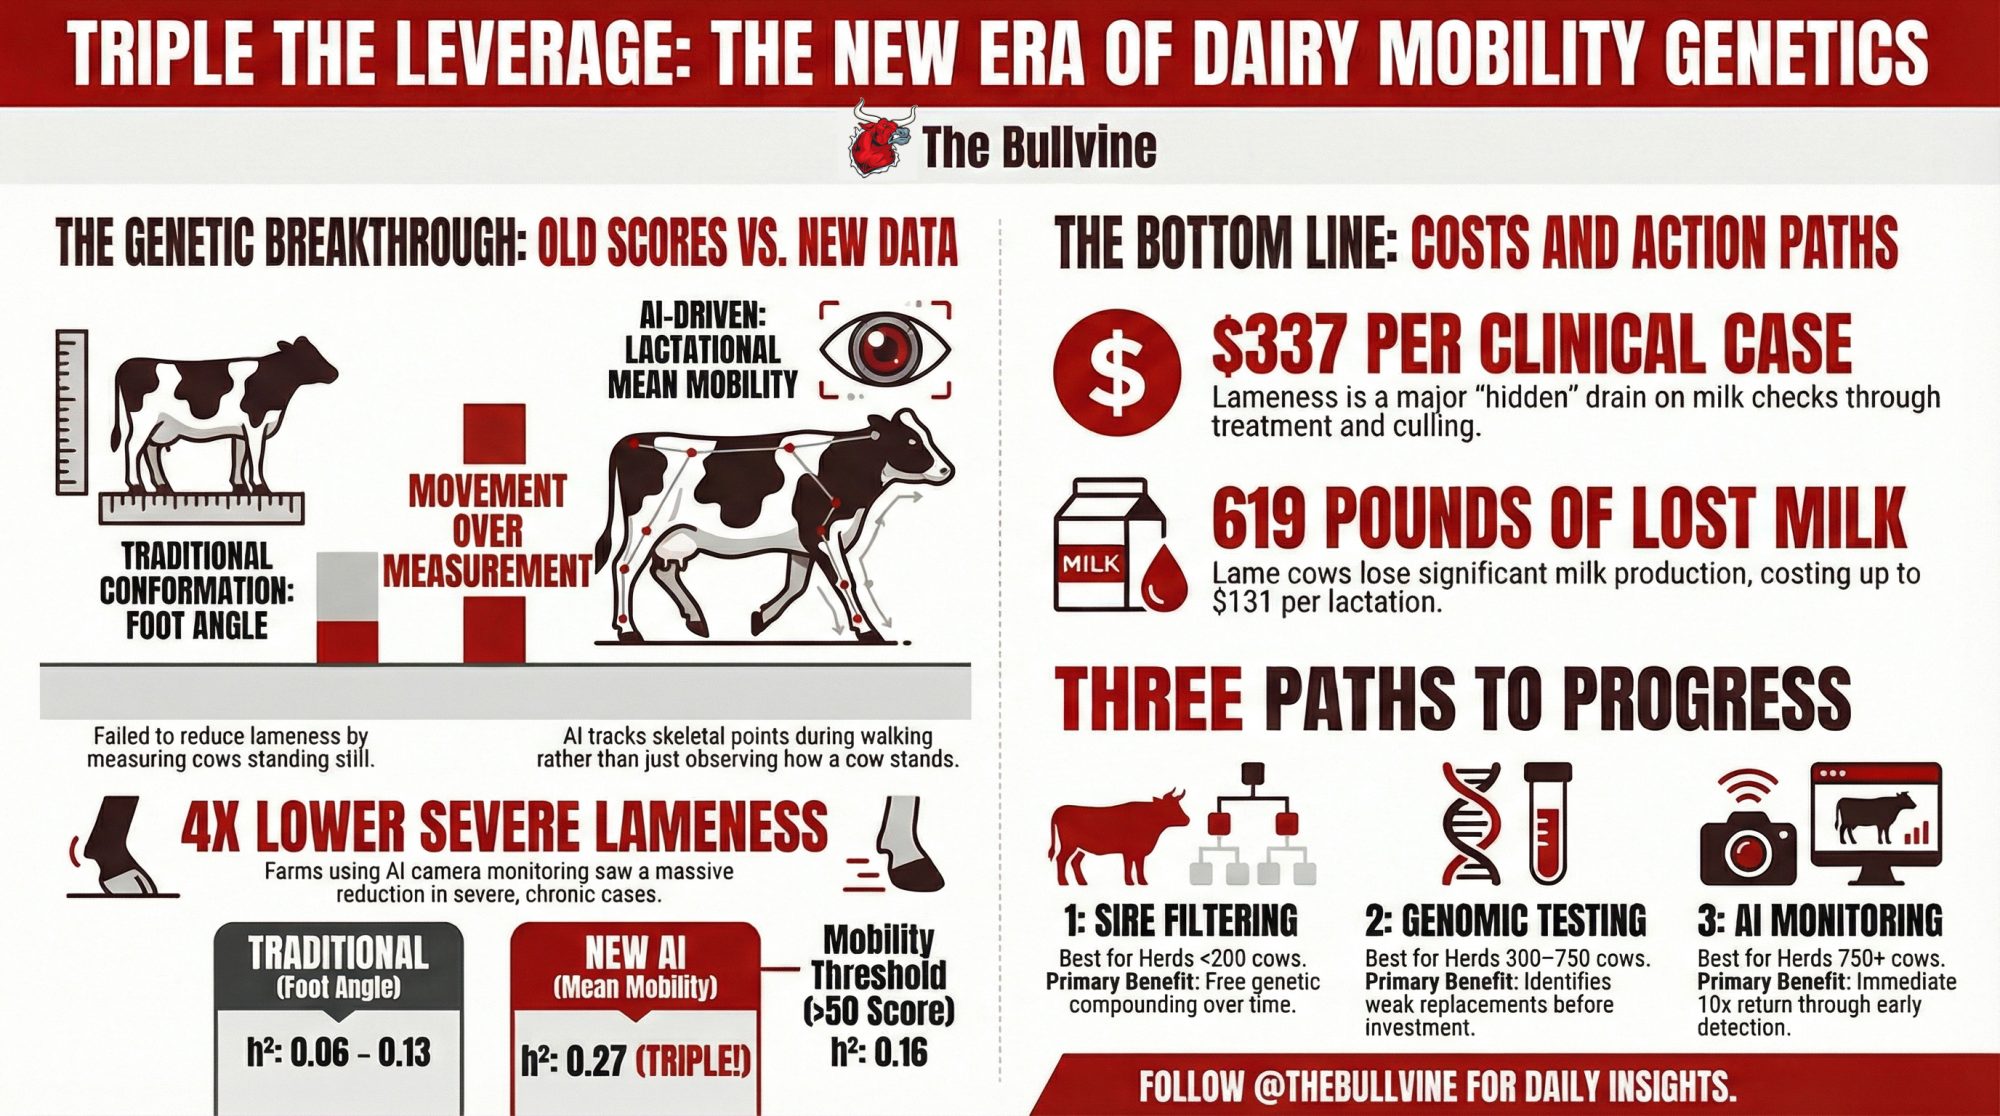
Here’s a number that should bother you: the heritability of foot angle — the trait the dairy industry has leaned on for four decades to breed away lameness — runs between 0.06 and 0.13 depending on the breed. The heritability of a camera-measured mobility score, according to CDCB’s own preliminary data? h² = 0.27. Roughly triple the genetic leverage. And nobody’s using it yet.
That gap — between what we’ve been selecting for and what actually predicts dairy cow lameness genetics — sits at the center of a research project that could reshape how U.S. producers think about soundness, longevity, and involuntary culling. At $336.91 per clinical case (Robcis et al., 2023, Journal of Dairy Science, PMID 36894430), lameness isn’t a welfare footnote. It’s one of the biggest drains on your milk cheque that doesn’t show up as a line item.
And here’s the piece that ties it all together: genetics is the ceiling, but management is the floor. A bull with a top-percentile Mobility PTA can’t save cows walking on cracked concrete with busted grooving and footbaths that run when someone remembers. CDCB’s Chief Innovation Officer, Javier Burchard, put it directly in GEA’s December 2025 announcement: “Genetic solutions are a powerful tool to drive cumulative and permanent improvements in herd health, beyond environmental factors.” Beyond. Not instead of.
Ask Skyler Gericke about that. Two years ago, his vet told him Triple G Dairy in Buckeye, Arizona — a Ging family operation milking 5,000 to 6,000 cows since the mid-1950s — was the worst dairy he had when it came to lameness. Gericke’s response: “In a year from now, you’re not even going to think about lameness.” His team installed CattleEye cameras at the parlour exit, overhauled their foot-care protocol, brought in a trimmer who knew what he was doing, and trained their crew. The turnaround was dramatic. “We’ve gone from being his worst herd to being one of the better herds in Arizona when it comes to lameness,” Gericke told a CDCB industry audience in May 2025. “We just had an audit… and out of 100 cows, he didn’t find a single one that he would have scored as a lame cow.” From worst to zero. And here’s the part that matters most: Triple G is one of CDCB’s cooperator farms, feeding daily camera data directly into the research pipeline that’s building mobility PTAs. What Gericke achieved through management and detection, CDCB wants to make permanent through genetics.
| Metric / Intervention | Before (2023) | After (2025) |
|---|---|---|
| Lameness Reputation (Vet’s Assessment) | “Worst dairy for lameness” | “One of the better herds in Arizona” |
| 100-Cow Audit Result | Not tracked / High prevalence | <span style=”color:#CC0000″>Zero lame cows found</span> |
| Detection System | Manual observation (inconsistent) | CattleEye cameras (daily scoring) |
| Foot Care Protocol | Basic / reactive | Overhauled + trained trimmer + crew training |
| Data Contribution | None | CDCB cooperator farm (feeds mobility PTA research) |
Why Haven’t 40 Years of Feet-and-Leg Scores Reduced Lameness?
Feet-and-leg conformation scores have been part of type classification since the 1980s. Yet lameness prevalence across U.S. herds still ranges from 13% to 55%, according to FFAR’s own grant documentation for the CDCB–University of Minnesota mobility project. Digital dermatitis was the largest driver of cost in the Robcis et al. analysis, running almost $100 more per case than other causes.
The problem was always measurement. Classifiers evaluate structural traits while cows stand still, but roughly 88% of clinical lameness involves the rear foot, not the leg structures that classification emphasizes. A cow can score well on feet and legs while harboring active digital dermatitis that’ll sideline her within weeks. And there’s a wrinkle nobody talks about much: owners often have feet trimmed before classification visits. That artificially improved foot angle score tells you very little about genetic potential.
The Man Who Got Tired of Clipboards
Terry Canning grew up on a dairy farm in County Armagh, Northern Ireland. He studied engineering at Queen’s University Belfast, earned his MEng in 1995, and then spent nine years as a software architect in telecom building systems for BT across Silicon Valley, Canada, and China. In 2004, he came back to agriculture and founded FarmWizard, a cloud-based livestock management system that eventually tracked over 4.2 million animals worldwide. The Duke of Westminster’s Wheatsheaf group acquired a majority stake in 2015, and Canning fully exited in 2018.
But through all of it, one thing kept nagging him: every piece of data about livestock still required a human to enter it. Every mobility score, every body condition assessment, every health observation depended on somebody with a clipboard and enough time.
In January 2019, Canning and co-founder Adam Askew — a software architect who’d spent over a decade using deep-learning image analytics to detect cancerous tumors in digital pathology at Philips/PathXL — launched CattleEye. The concept: a standard 2D camera watching cows walk, powered by AI that scores what it sees. No clipboards. No subjective variation between observers. Consistent, daily mobility data on every cow in the herd. GEA acquired CattleEye in March 2024, and Canning now serves as Senior Director at GEA.
What Do AI Cameras See That Classifiers Miss?
A CattleEye camera mounted over a parlour exit tracks multiple skeletal reference points on each animal — ears, back of head, spine — and measures how those points shift as the cow walks underneath. Each pass generates a mobility score from 0 to 100, where lower scores are better, and scores above 50 flag a problem. The system captures body condition scores in a single pass, on a 1-to-5 scale with 0.25 increments.
The cameras see what your best herdsman sees on his best day. Every day. On every cow.
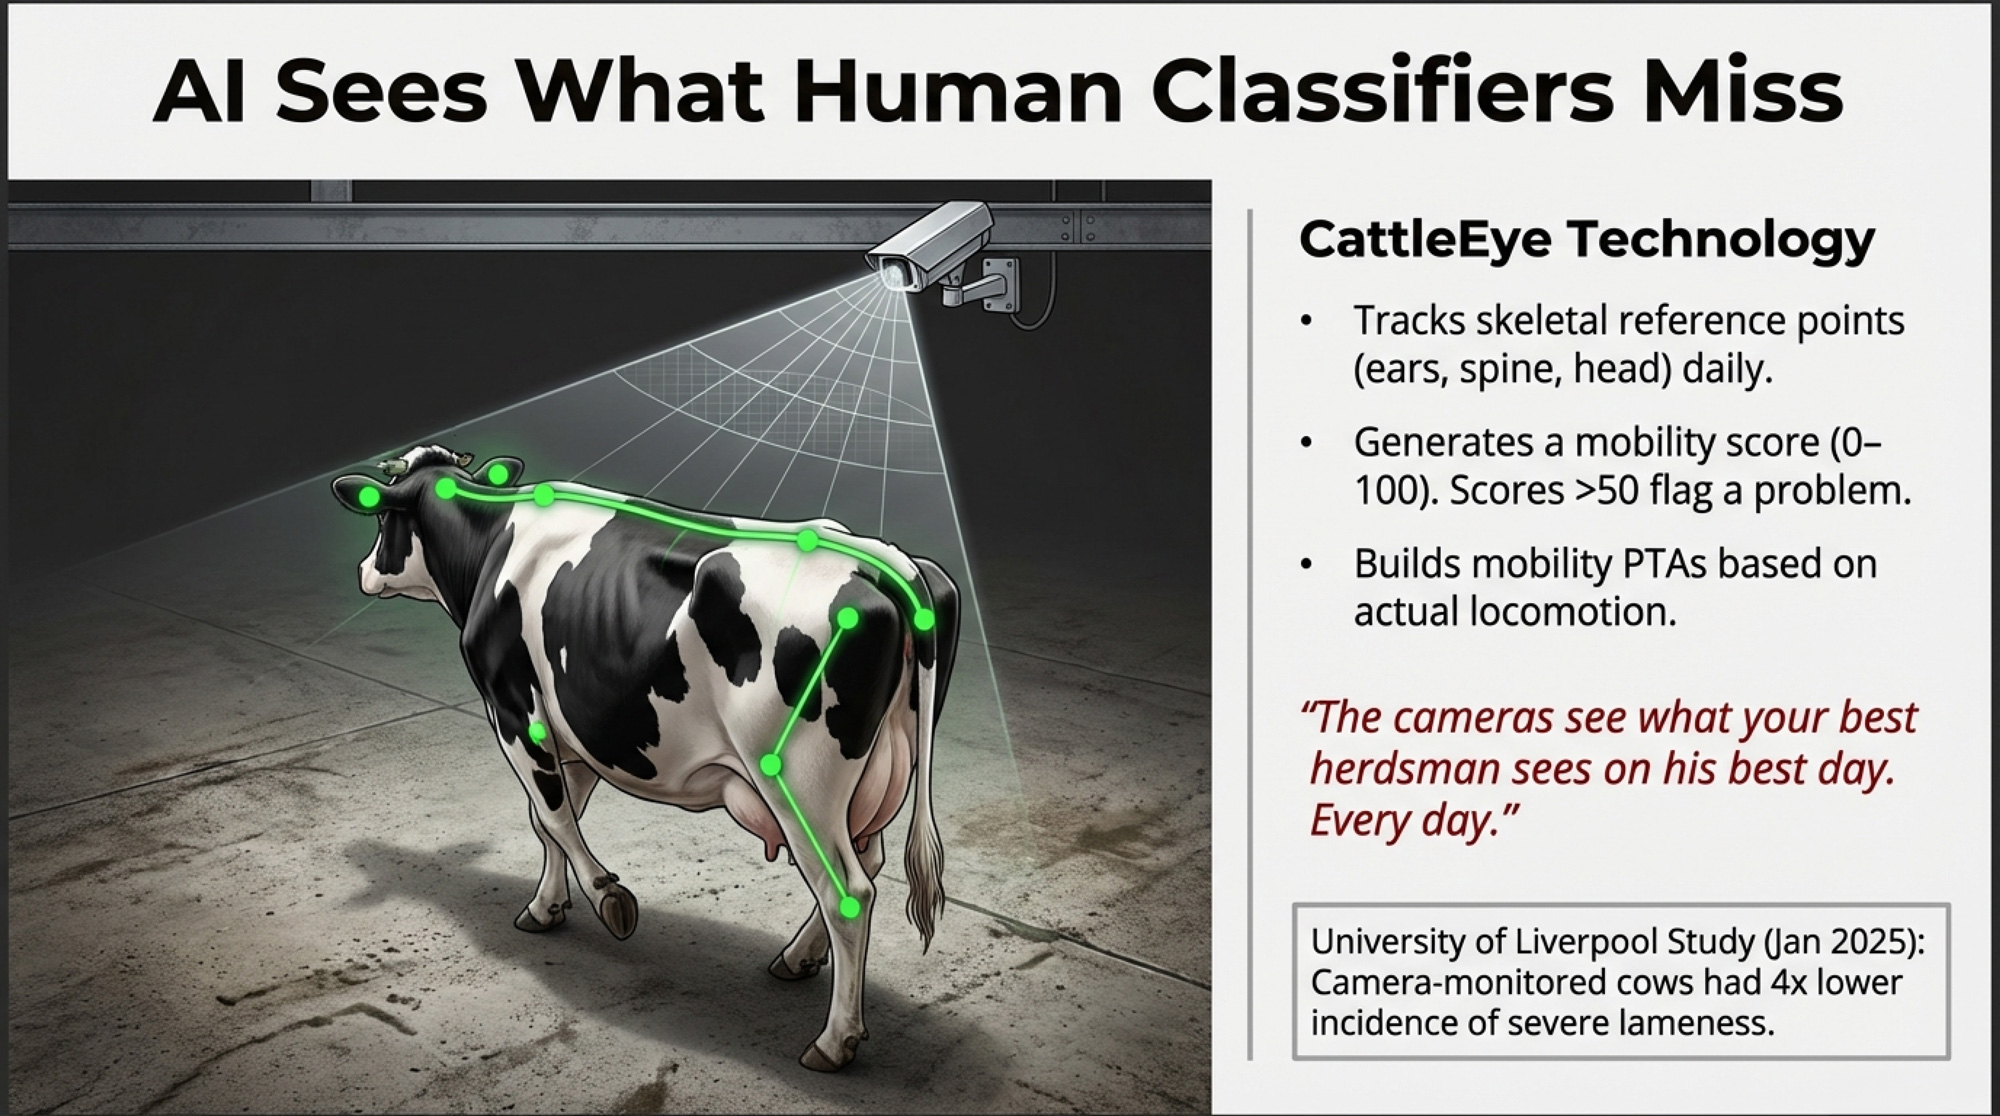
And the independent evidence is catching up to the company’s claims. A University of Liverpool randomized control trial — published January 2025 on a large UK dairy farm — found that cows monitored by CattleEye had 4× lower cumulative incidence of severe lameness compared to those monitored by humans alone, and 2.5× fewer moderate and chronic cases. The researchers stressed the system works best as part of a comprehensive lameness management strategy — foot trimmers remain crucial.
Gericke would agree. He credited the full package when talking about Triple G’s turnaround: “CattleEye, better foot care, a trimmer that knows what he’s doing, and people to train — that all has led to that one achievement.” The camera didn’t replace management. It armed it. Instead of searching for lame cows, his crew could spend their time treating them earlier — a critical labor shift on a 5,000-cow operation where hands-on observation at scale was never realistic.
At roughly $1.45 per cow per month, Canning told Fortune in June 2025 the system delivers “at least a 10x return” through tighter reproduction, fewer losses, and better welfare. That payoff lands immediately — before any genetic improvement kicks in.
But Canning’s ambition now reaches past early detection. “We’re looking at breeding cows that simply don’t get lame as often,” he said in GEA’s February 2026 statement. “This isn’t about treating lameness better or catching it earlier — it’s about creating herds where the problem largely doesn’t occur.”
Dr. Gerard Cramer leads the research side from the University of Minnesota. He earned both a DVM and DVSc from the Ontario Veterinary College at Guelph, ran his own dairy farm, and operated a foot-health-specific veterinary practice before joining UMN’s faculty in 2013. His framing captures the integration: “Autonomous cameras can catch early signs of lameness that often go unnoticed, allowing for faster treatment. But technology alone is not enough. By integrating artificial intelligence with hoof health records, genetics, and on-farm practices, we are creating a more complete picture of lameness.”
Is Triple the Heritability Enough to Move the Needle?
To understand why CDCB is building an entirely new trait definition, stack the heritabilities side by side:
| Trait Type | Specific Trait | Heritability (h²) |
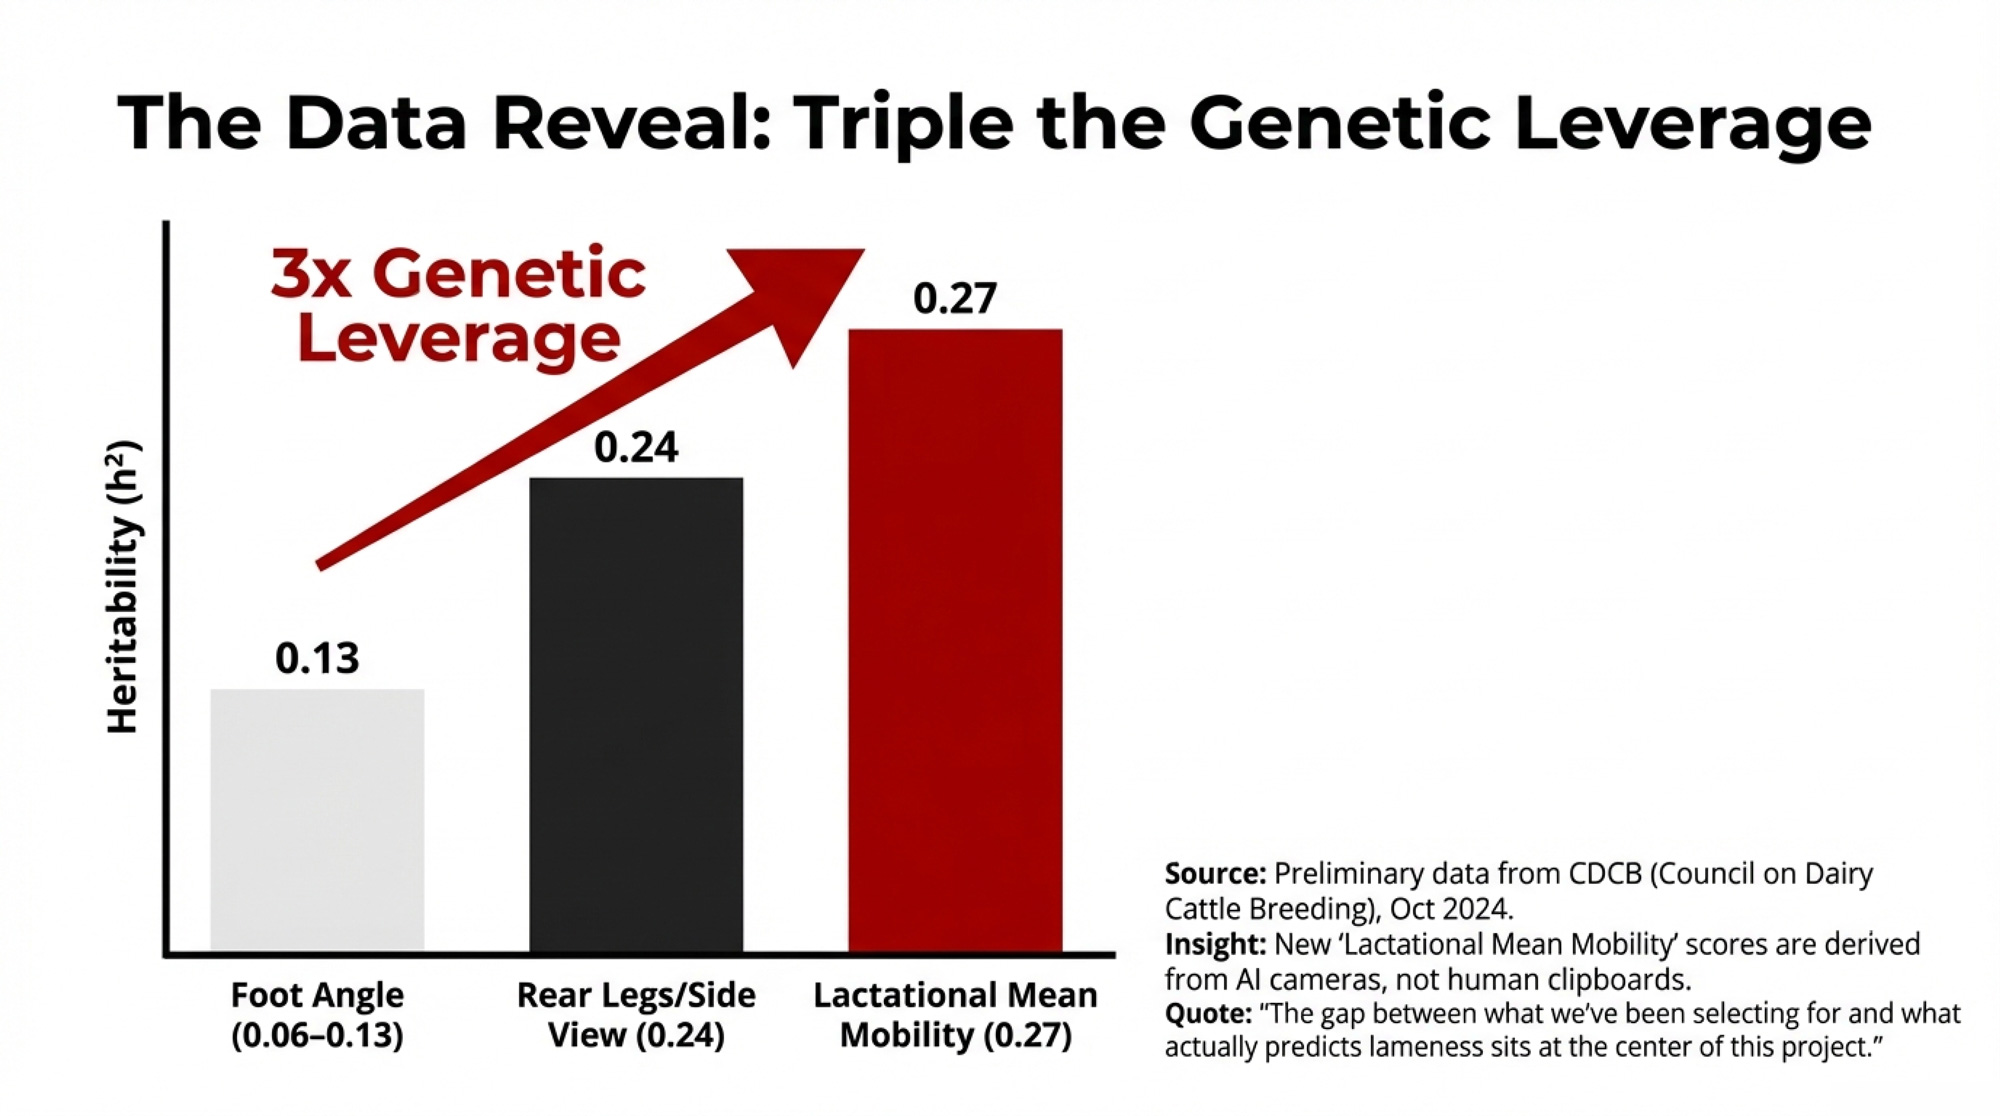
| Traditional conformation | Foot angle | 0.06–0.13 |
| Traditional conformation | Rear legs (side view) | 0.14–0.24 |
| AI-driven (new) | Lactational mean mobility | 0.27 |
| AI-driven (new) | Mobility threshold (ever >50 in lactation) | 0.16 |
| Health event | Infectious lesions (e.g., digital dermatitis) | 0.05–0.06 |
For Holsteins specifically, the gap between rear-legs-side-view (official h² = 0.24 per CDN data) and lactational mean mobility (h² = 0.27) is modest. But against foot angle — the trait most commonly associated with “breeding for feet” — it’s triple the leverage. And it’s measured on a trait definition that actually aligns with the problem: how the cow moves, not how she stands.
GEA’s December 2025 announcement framed the preliminary CDCB range as “heritability between 10 and 30 percent” across different trait definitions. That 10% floor maps to threshold-based measures. The 30% ceiling maps to Cole’s lactational mean mobility. Both are dramatically higher than the foot angle.
What Did CDCB’s First Mobility Data Actually Show?
The DPR story is the template. Before 2003, genetic evaluations for fertility didn’t exist in the U.S. DPR launched that year. In 2009, the first official genomic evaluations were published. The rate of genetic gain for fertility roughly tripled. Measure what matters. Put it in the index. Watch selection pressure do its work.
When John Cole, Ph.D. — CDCB’s Chief Research and Development Officer — put h² = 0.27 on the screen at CDCB’s October 2024 Industry Meeting in Madison, the number carried the weight of 4.5 million records from 20,600 cows across four farms, collected between July 2021 and July 2024. Lactational mean mobility: h² = 0.27 (SE 0.04). Threshold measure: h² = 0.16 (SE 0.03). Infectious lesion incidence, built from 667,381 trimmer records: h² = 0.057on a threshold model.
The project started in July 2021 with two dairy farms in Minnesota and Iowa milking a combined 4,600 cows, boosted by a $2 million FFAR Seeding Solutions grant announced in August 2025. Grant partners include FFAR, CattleEye LTD, CDCB, Kinder Ground, and CATTLEytics. Josh Vander Well of Black Soil Farms was among the original project collaborators, appearing on the CDCB’s 2021 roundtable alongside Canning, Cramer, and CDCB geneticist Kristin Parker Gaddis.
By October 2025, the dataset had grown. CDCB geneticist Ashley Ling, Ph.D., told the World Dairy Expo audience that the project now spanned six participating farms, combining daily camera scores with trimmer lesion data in a two-pronged evaluation model. Ling confirmed that lesion heritability appears “similarly heritable to traits like the fertility measures”—consistent with Cole’s numbers. At the same meeting, Wisconsin producer Eric Grotegut from Grotegut Dairy in Newton told the audience, “Fifteen to 25 years ago, it seemed like I was selling cows every day; lameness, mastitis, and pneumonia… there was something all the time. Now, most cull cows are one day a week.”
Ireland and Canada add international context. Ring and colleagues (2018, Journal of Dairy Science, PMID 30219421) found a 0.64 genetic correlation between mobility scoring and farmer-recorded lameness in Irish herds. Lactanet launched its Hoof Health evaluation for Canadian Holsteins in December 2018, covering eight key lesions with heritabilities ranging from approximately 0.02 to 0.08 — digital dermatitis highest at 0.084 — and a 0.49 correlation with Herd Life. One caution: Irish and Canadian genetic correlations don’t automatically transfer to U.S. conditions. That’s precisely why CDCB is investing in its own data.
GEA’s December 2025 announcement pegged the timeline for mobility PTAs at “within three to five years”—pointing to 2028–2030. The infrastructure has already been proven: CDCB integrated Milking Speed from automated milking system sensor data in its August 2025 evaluation, the organization’s first sensor-derived trait. The pipeline works.
Which Investment Path Fits Your Herd?
When mobility PTAs arrive, what changes depends on where you start.
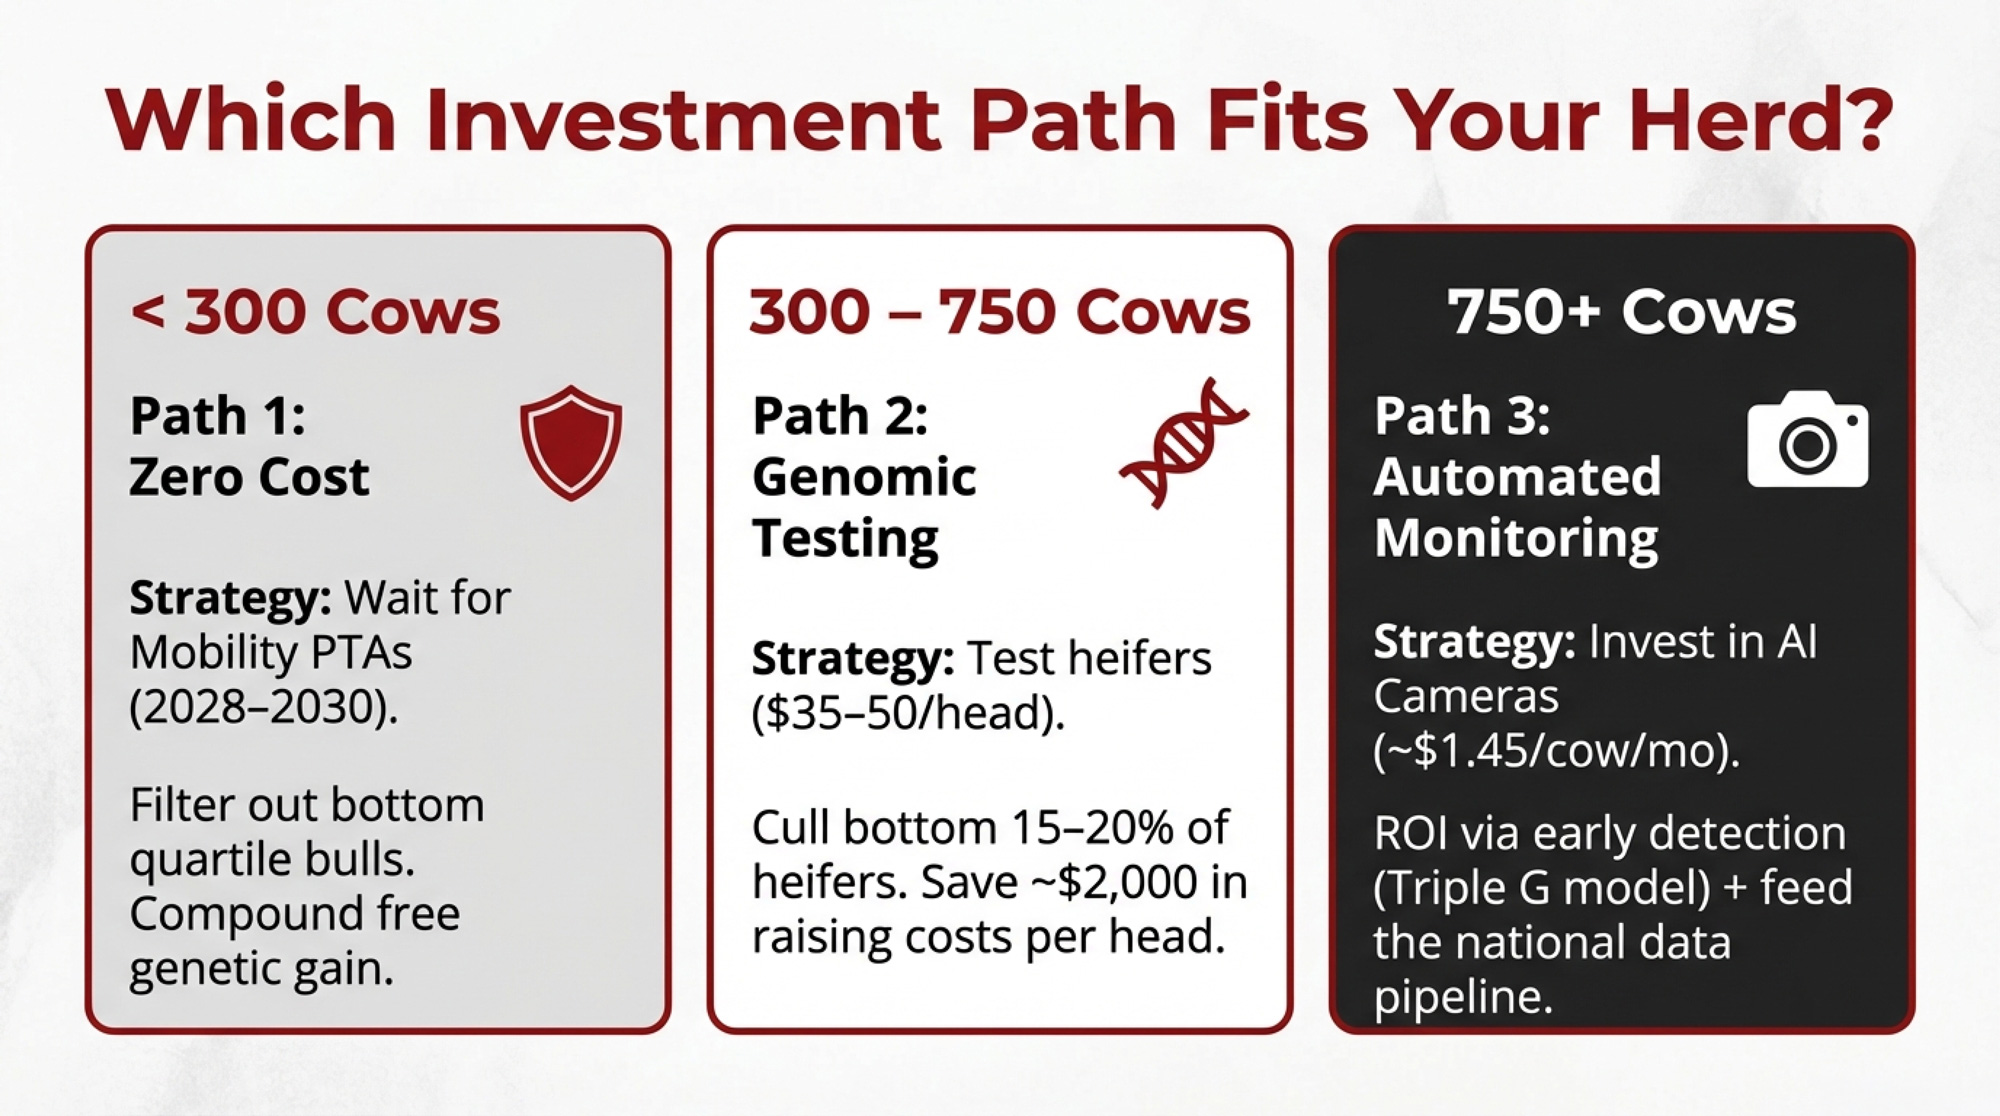
Path 1: Zero Additional Investment. When mobility PTAs publish, review them for bulls you’re already considering. Filter out the bottom quartile. Favor above-average mobility when other traits are comparable. Genetic improvement accumulates slowly, but compounding is free. Best for herds under 200 cows or operations where lameness is already reasonably controlled. The trade-off: it’s the slowest path.
Path 2: Genomic Testing of Heifers ($35–50 per head). Identify genetically weaker replacements early. Cull or sell the bottom 15–20% before investing $2,200–2,600, raising them to first calving — Iowa State University Extension calculated just over $2,600 for 24 months in 2024, while Penn State’s 2016–2021 data averaged $2,034 per head. AHDB’s June 2024 analysis found a £193 gap in average Profitable Lifetime Index between UK herds testing 75–100% of their heifers (£430 PLI) versus those testing just 0–25% (£237 PLI). Actual farm business accounts showed the advantage exceeding £50,000. Marco Winters, AHDB’s head of animal genetics: “There is free money to be had, and all you have to do is choose better genetics.” Best for herds above 300 cows that are already invested in genetic improvement.
Path 3: Automated Mobility Monitoring. CattleEye’s SaaS model runs about $1.45 per cow per month with a standard 2D camera in the right spot. The Liverpool RCT showed a 4× lower incidence of severe lameness, and you contributed phenotypes to the national evaluation. Triple G’s two-year results and Highfields Farm’s 8% lameness reduction in 18 months on a 1,050-cow UK herd show what’s possible at scale. Best for operations milking 750+ cows where lameness prevalence exceeds 20%. The trade-offs: you’re dependent on a single vendor (now GEA-owned) for data continuity, and the best mobility PTA in the world won’t overcome chronic slurry on cow paths and footbaths that haven’t been refreshed since last Tuesday.
What This Means for Your Operation
- Your 30-day action: Pull your lameness-related culling records from the last 12 months. Calculate what percentage of involuntary culls trace back to feet and legs. If you don’t have that number, getting it is the single move that makes everything else in this article useful.
- The barn math — plug your own numbers: Your cow count × your estimated lameness prevalence × $337. Cole’s research data showed lame cows in the CDCB reference population losing 619.2 lbs per 305-day lactation(about –2.03 lbs/day). At the 2025 U.S. all-milk average of $21.17/cwt (USDA WASDE, February 2026), that’s roughly $131 per cow per lactation in milk loss alone — before treatment, reproduction impact, or premature culling. With the 2026 all-milk forecast sitting at $18.95/cwt, the figure drops to about $117. Either direction, multiply across your lame cows, and the number adds up fast.
- Under 300 cows: Start with Path 1 when mobility PTAs publish. Zero cost, real genetic value over time.
- 300–750 cows: Run the genomic-testing numbers against your own raising costs and cull rates. Even before mobility PTAs arrive, you capture value on DPR, SCS, and existing health traits. The AHDB data is clear — herds testing most of their heifers are pulling away from those that don’t, and the gap is widening.
- 750+ cows with prevalence above 20%: Evaluate Path 3 now. At $1.45/cow/month, early detection may pencil independently of future mobility PTAs. Triple G’s audit results — zero lame cows found in a 100-cow sample after two years on the system — show what’s achievable when you pair the cameras with real foot care. But be honest about your flooring, cow flow, and footbath program first — the Liverpool researchers stressed the system works best as part of a comprehensive strategy, not a replacement for one.
- Your 90-day action: Before your next sire order, ask your AI company or genetic supplier which bulls carry international mobility or hoof health proofs. Lactanet’s Canadian Hoof Health evaluation has been available since December 2018. That data exists now, but Canadian genetic correlations may not transfer perfectly to U.S. conditions, so weight it accordingly alongside other health traits.
- Your 365-day horizon: When mobility PTAs launch (projected 2028–2030), revisit your entire sire lineup through a mobility lens. The bulls you’re using today will still be siring daughters when this evaluation arrives.
Key Takeaways
- If lameness-related culls run above 10–15% of involuntary culls, mobility needs to be a priority trait the moment PTAs are available.
- Lactational mean mobility at h² = 0.27 (CDCB, October 2024) gives you roughly triple the genetic leverage of foot angle. A fundamentally different trait definition working on a fundamentally different data source.
- Lame cows in the CDCB reference population lost 619.2 lbs per 305-day lactation. At the 2025 all-milk price, that’s about $131 per cow; at the 2026 forecast, roughly $117. Both matter when multiplied across your herd.
- The University of Liverpool RCT (January 2025) found that CattleEye-monitored cows had 4× fewer severe lameness cases and 2.5× fewer chronic cases than those monitored by humans alone. Detection pays now; genetics pays over the next 10–15 years. Both feed the same data pipeline.
The Bottom Line
At h² = 0.27, genetics gives you a new lever — but it doesn’t replace the floor under your cows’ feet. Gericke got to zero lame cows in a 100-cow audit, and he credited CattleEye, better foot care, a trimmer who knew what he was doing, and trained people—the whole package. The cameras cost money today. The mobility PTAs will change the sire lists for the next generation. What’s different now is that both tools are converging on the same stream of data, and the DPR precedent says that convergence can move the needle faster than anyone expected.
What percentage of your involuntary culls last year were lameness-related? If you can’t answer that question, you’ve just found your first action item.
Learn More
- The Hidden Cost of Lameness: Is AI Exposing Dairy’s Biggest Profit Thief? – Arms you with a concrete ROI breakdown to justify precision tech today. You’ll gain specific action steps to slash feed waste by 20% and stop $40,000 in hidden annual losses from quietly draining your milk check.
- 4.23% Butterfat, $187,000 Gone: The Margin Math That Broke 2025 – And Shapes Your 2028 – Exposes the “biological trap” of chasing single traits and delivers a roadmap for navigating massive margin gaps. You’ll learnto align your 2028 genetics with shifting processor demands and the latest component realities.
- The Next Frontier: What’s Really Coming for Dairy Cattle Breeding (2025-2030) – Reveals the technological and genetic breakthroughs set to upend breeding by 2030. You’ll gain a competitive edge by mastering the implementation of feed efficiency genetics and sensor-driven health traits before the rest of the industry catches up.


