


How Net Merit changes, fairlife’s $7.4 billion success, and the premium pivot are reshaping what your genetics are worth.
Executive Summary: For the first time since 2009, fluid milk sales grew in 2024—up 0.8%, ending a 14-year decline. The turnaround didn’t come from better marketing of commodity milk; it came from building what consumers actually wanted: lactose-free, high-protein, premium products that command real price premiums. fairlife proved the model works spectacularly, generating $7.4 billion in total value for Coca-Cola and reshaping the value of dairy genetics. The April 2025 Net Merit revision tells the story: butterfat emphasis jumps to 31.8% while protein drops to 13.0%—volume-only genetics are losing economic ground. But here’s the hard truth: 40% of U.S. dairy farms exited between 2017 and 2022, and premium market access isn’t equally distributed. The strategic question for every producer is no longer whether this shift is real—it clearly is—but whether your operation’s genetics, scale, and processor relationships position you to capture value from it.

After decades of falling fluid milk sales, the industry posted growth in 2024 for the first time since 2009. The story behind that turnaround holds lessons for every farmer making decisions today.
By the Numbers: Dairy’s Turnaround at a Glance
| Metric | Then | Now |
| Per capita fluid milk consumption | 247 lbs (1975) | 141 lbs (2020) |
| 2024 fluid milk sales vs. 2023 | 14-year decline | +0.8% growth |
| U.S. dairy farms | 39,303 (2017) | 24,082 (2022) |
| Milk from farms with 1,000+ cows | 60% (2017) | 68% (2022) |
| Holstein butterfat average | 3.9% (2019) | 4.23% (2024) |
| fairlife annual retail sales | $90M (2015) | $1B+ (2022) |
| Net Merit protein emphasis | 19.6% (2021) | 13.0% (April 2025) |
| Net Merit butterfat emphasis | 28.6% (2021) | 31.8% (April 2025) |
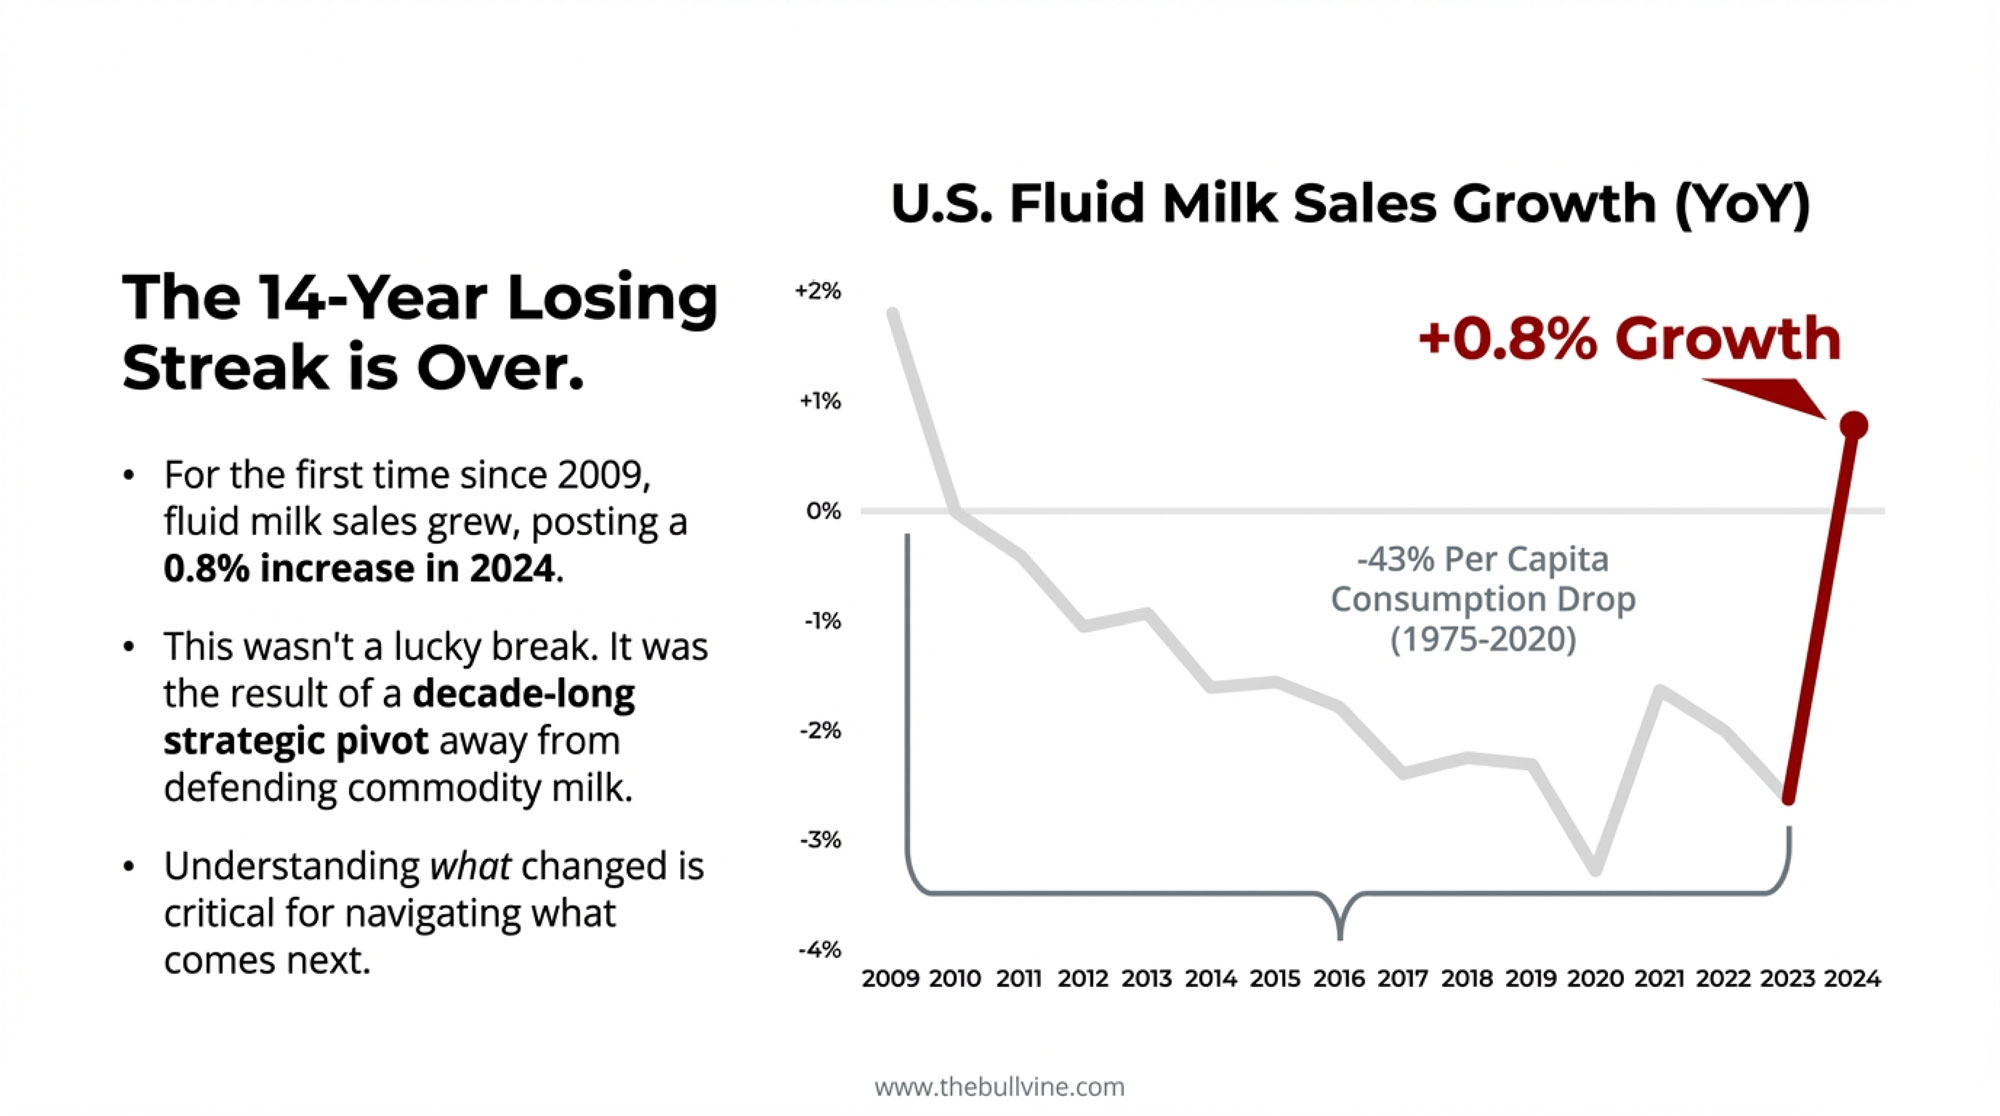
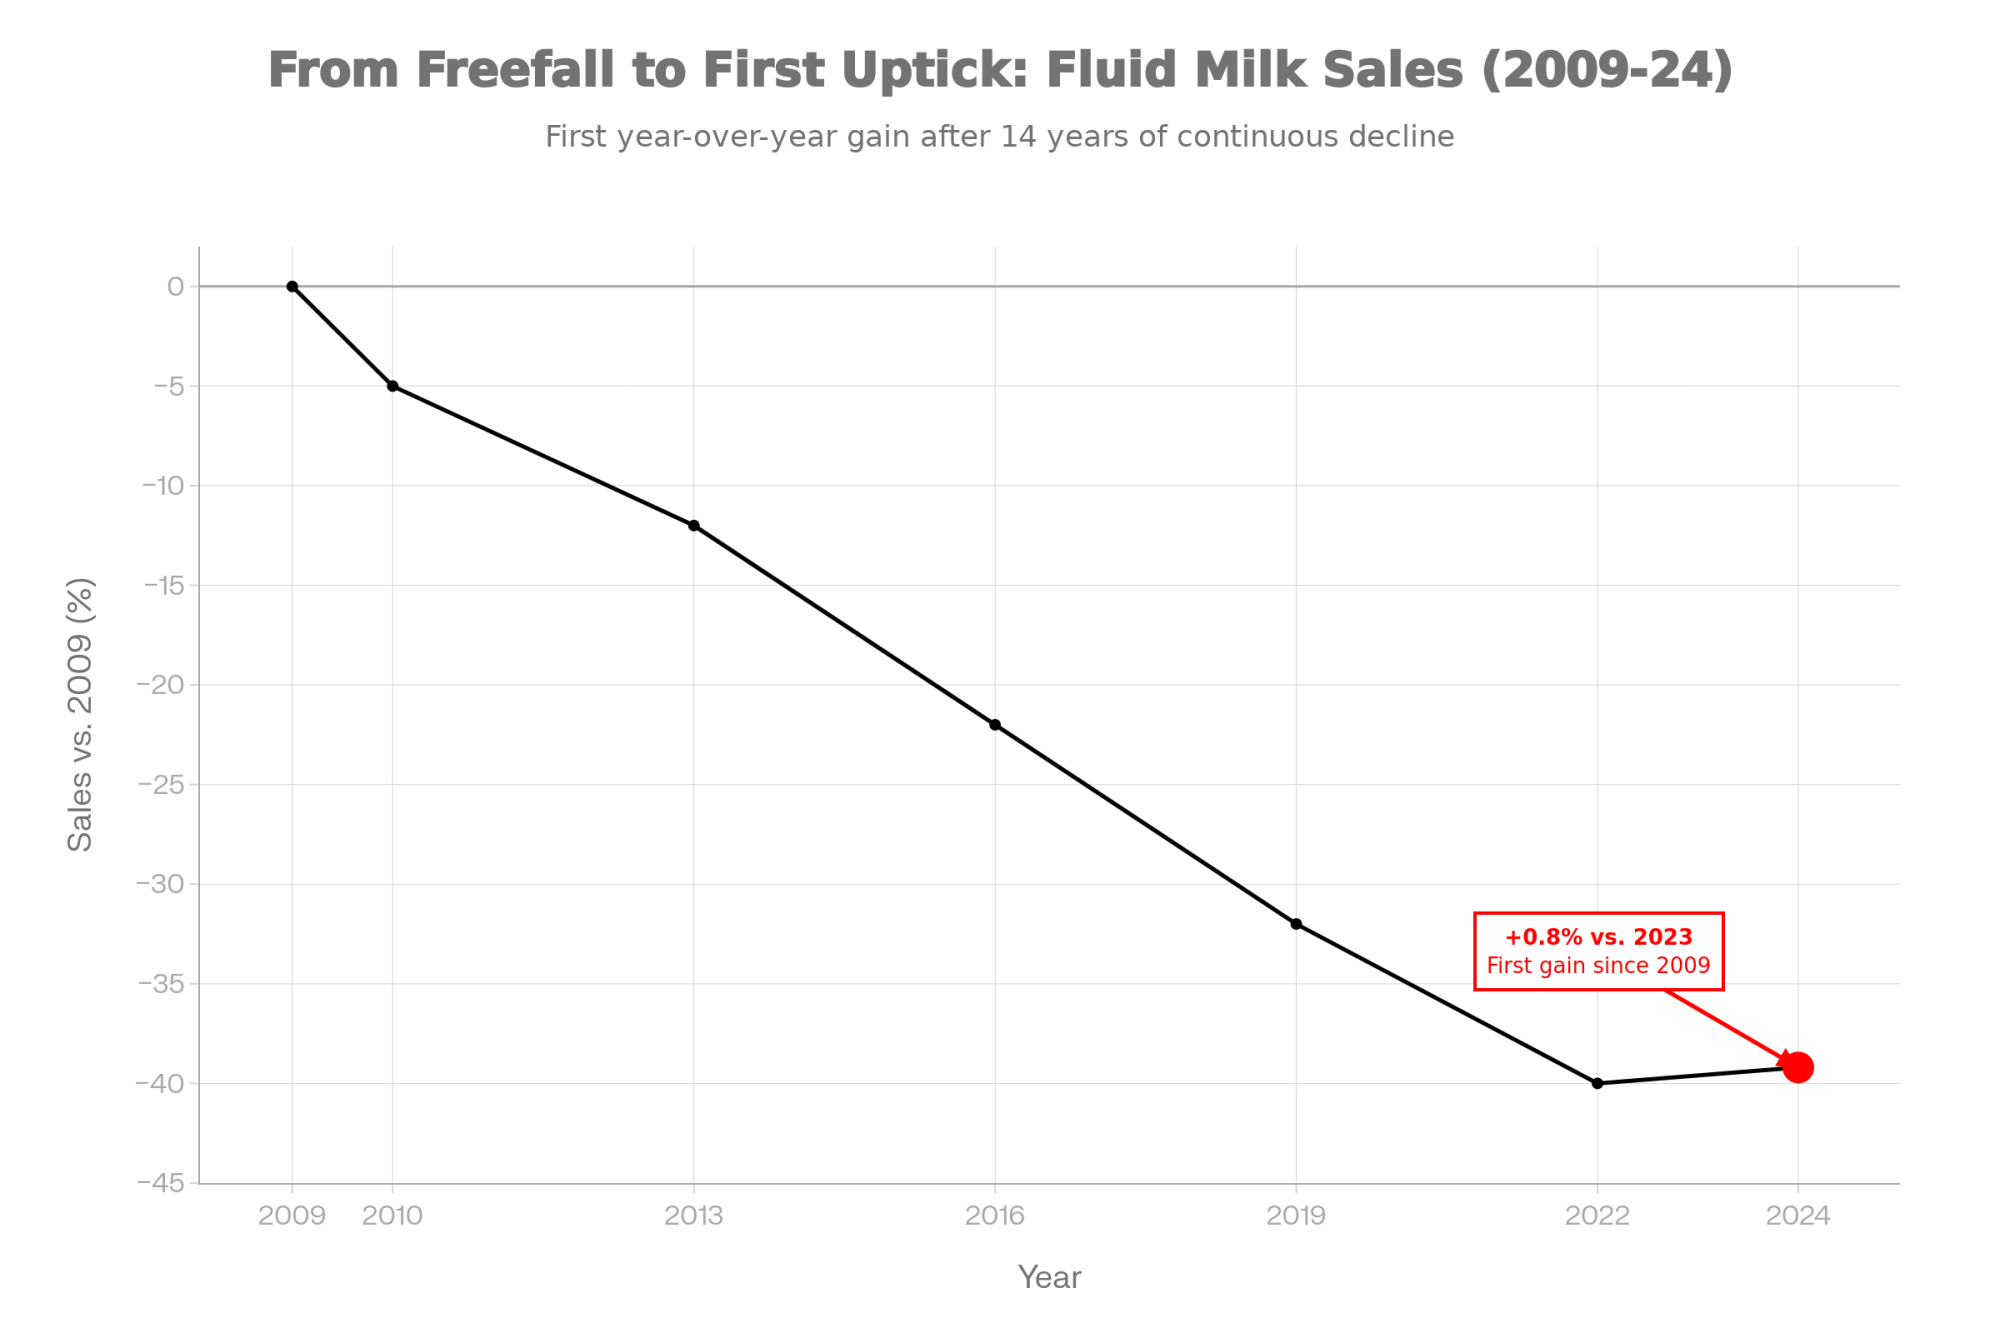
Here’s something that caught a lot of people off guard last year. Fluid milk sales actually grew in 2024—not just stabilized, but genuinely increased. USDA data show total U.S. fluid milk sales were up about 0.8% from 2023, ending a 14-year streak of annual declines. The National Milk Producers Federation called it the first year-over-year gain since 2009.
That’s worth sitting with for a moment.
What’s interesting here isn’t just the number itself. It’s what had to happen to get there. This wasn’t a lucky break or some temporary consumer fad. The growth came after roughly a decade of strategic decisions that ran counter to almost everything the dairy industry had believed about competition and survival.
I’ve been watching this unfold for years now. The more you dig into what actually changed, the more you realize there’s a playbook here that matters to producers navigating what comes next.
Understanding How Deep the Decline Really Was
To make sense of the comeback, you need to understand how challenging things had gotten. Not just the headlines—the structural shift that was reshaping the entire category.
Between 1975 and 2020, per capita fluid milk consumption in the United States dropped by nearly 43%, according to Federal Milk Market Administrator data. We went from around 247 pounds annually down to about 141 pounds per person. Penn State Extension’s dairy trends research shows similar figures—they tracked a decline from 247 pounds in 1975 to 134 pounds by 2021. That’s not a temporary dip. That’s a generational shift away from a product that used to be on every breakfast table in America.
The reasons were accumulating, as many of us observed firsthand. Beverage options multiplied—sports drinks, bottled water, energy drinks, and the expanding coffee culture. Plant-based alternatives began to claim serious shelf space in the mid-2010s. Younger consumers, especially, seemed to be reconsidering whether dairy belonged in their daily routine.
And the financial pressure kept building. Class III prices dropped below $14 per hundredweight multiple times during 2018 and 2019. The Class III average for 2018 was just $14.61, the lowest in years. If you were shipping milk during those months, you remember.
Then came Dean Foods. The largest fluid milk processor in the country filed for Chapter 11 bankruptcy on November 12, 2019, in the Southern District of Texas—USDA’s Agricultural Marketing Service confirmed the filing date in subsequent proceedings. When a company of that size goes down, it sends a signal about industry direction. Or at least, that’s what everyone assumed at the time.
The Strategic Pivot: Asking a Different Question
The turning point, looking back, came when industry leadership started asking a fundamentally different question.
Instead of “How do we convince people to drink more regular milk?”—which promotion campaigns had been attempting for years—they asked: “What do modern consumers actually want that dairy could provide better than alternatives?”
Why does that distinction matter? Because it shifts the entire strategic framework.
Dairy Management Inc., the organization that manages the national dairy checkoff, commissioned extensive consumer research starting around 2014-2015. According to DMI’s published partnership reports, what they found reshaped the entire strategic approach.
Here’s what the research revealed: consumers weren’t rejecting dairy’s core benefits—protein, nutrition, taste. They were rejecting the format and the limitations. The National Institutes of Health estimates that somewhere between 30 and 50 million American adults are lactose intolerant—MedlinePlus and federal health resources have consistently cited this range. Many of those people wanted dairy’s nutritional benefits but couldn’t tolerate conventional milk. Others wanted higher protein for fitness goals, lower sugar for health reasons, or longer shelf life for convenience.

This consumer insight work became the foundation for everything that followed. DMI announced more than $500 million in fluid milk partnerships with seven major companies—Dairy Herd and other industry publications covered the announcement extensively. What’s particularly noteworthy is the leverage structure: most of that investment came from partners putting money into processing plants and infrastructure, while the checkoff’s direct commitment was about $30 million. That ratio—partners investing roughly $15 for every checkoff dollar—represents a fundamental strategic pivot from defending commodity milk to building new categories where dairy had natural advantages.
The fairlife Case Study
No single product illustrates the transformation better than fairlife, which has become Coca-Cola’s fastest-growing brand acquisition. The timeline is worth examining because it shows what patient long-term investment actually looks like in practice.

fairlife launched as a joint venture in 2012 between Select Milk Producers—a Texas-based dairy cooperative with just 99 member farms, as confirmed by multiple industry sources, including the Texas Agricultural Council and the University of Guelph—and Coca-Cola, which took an initial 42.5% ownership stake. The product uses ultrafiltration technology (not new technology exactly, but newly commercialized at scale) to concentrate protein, remove lactose, and reduce sugar while maintaining dairy’s nutritional profile.
National rollout came in late 2014, after test markets in Denver showed something remarkable. Coca-Cola’s Mike Saint John, speaking to industry groups, noted that the Denver test showed fairlife driving a 4% increase in fluid milk sales—not just capturing share from other brands, but actually growing the category. That distinction matters considerably when you’re trying to reverse a multi-decade decline.
The growth trajectory tells the story. By the mid-2010s, fairlife had reached about $90 million in annual sales. Industry estimates put 2019 sales at around $500 million. In January 2020, Coca-Cola acquired the remaining 57.5% stake for $979 million, according to SEC filings.
Here’s where the economics get striking. fairlife surpassed $1 billion in annual retail sales by 2021-2022, as Dairy Reporter and Coca-Cola’s earnings communications confirmed. The company’s SEC filings now show that total payments for fairlife—including the original acquisition plus performance-based earnouts—have reached approximately $7.4 billion. That earnout structure meant Coca-Cola paid more because fairlife exceeded financial targets.
| Year | Retail sales (USD billions) | Cumulative value/investment (USD billions) |
|---|---|---|
| 2015 | 0.09 | 0.50 |
| 2019 | 0.50 | 1.50 |
| 2022 | 1.00 | 5.00 |
| 2024 | 1.20 | 7.40 |
Today, fairlife sells at a clear premium to conventional milk in most retailers. High Ground Dairy’s analysis highlights these strong price premiums, while USDA retail price tracking shows conventional milk averaging about $4.39 per gallon in 2024. Consumers are paying meaningful premiums for a product delivering 50% more protein, 50% less sugar, no lactose, and a longer shelf life.
But Can Other Cooperatives Replicate This?
Here’s the question many producers are asking: Is the fairlife playbook actually replicable, or do you need Coca-Cola’s balance sheet to make it work?
The honest answer is complicated.
fairlife didn’t just have good milk—it had a partner with essentially unlimited capital, global distribution networks, and decades of beverage marketing expertise. Select Milk Producers brought the supply chain and dairy knowledge; Coca-Cola brought everything else. That’s not a model most regional cooperatives can simply copy.
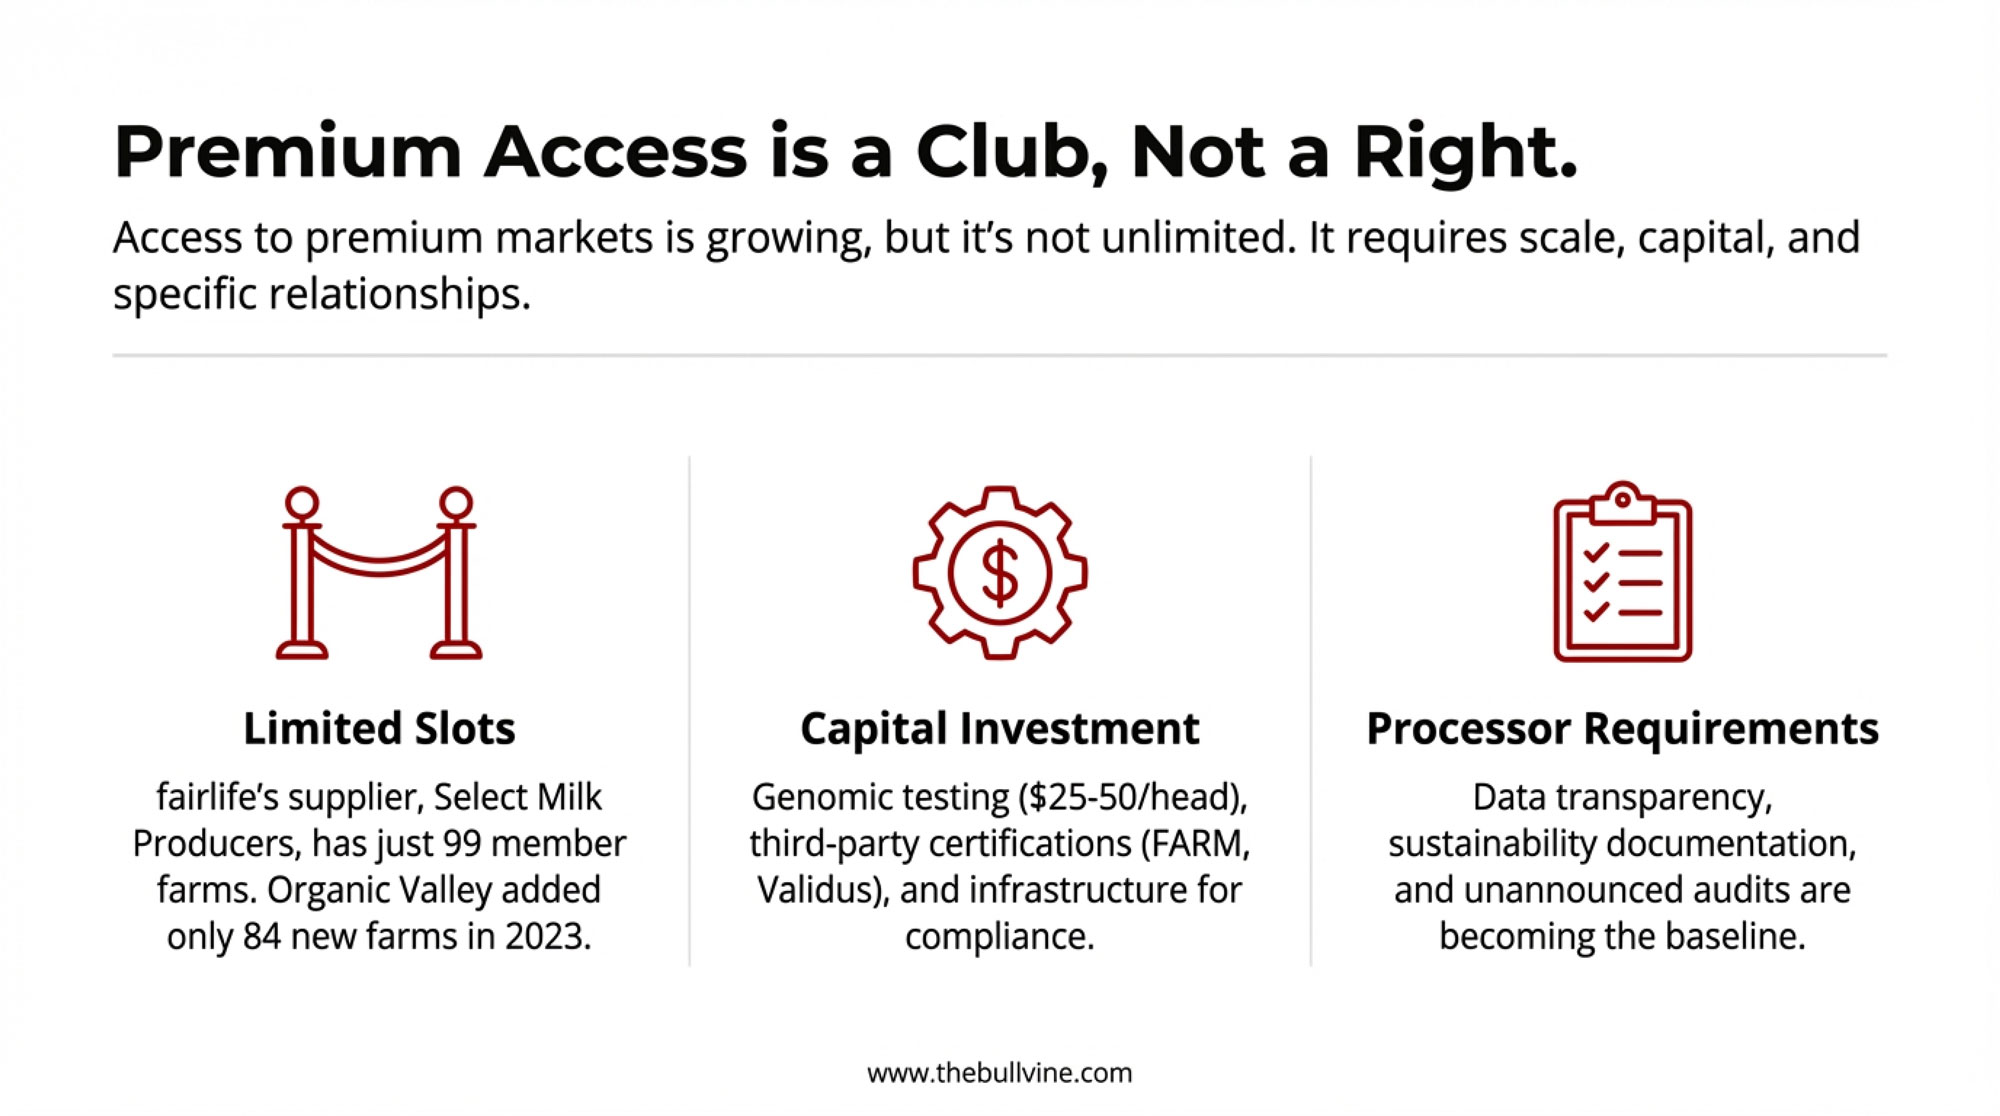
fairlife’s own FAQ clarifies the supply structure: “As a milk processor, fairlife does not own farms or cows. We partner with dairy co-ops in geographies where we have plant locations to source milk.” All supplying farms must meet fairlife’s specific animal care requirements and maintain both FARM and Validus third-party certifications. That creates a meaningful barrier for farms not already connected to fairlife’s supply network.
Consider this: Select Milk Producers has just 99 member farms. That’s a deliberately small, carefully managed supplier base—not an open door for any operation wanting premium market access. And when Organic Valley, the largest organic dairy cooperative in the country, added new farms in 2023, they brought on just 84 operations, according to Dairy Herd reporting. Premium market access is growing, but it’s not unlimited.
For mid-sized cooperatives exploring this space, the entry barriers are substantial: processing infrastructure for ultrafiltration runs into the tens of millions; third-party certification programs require ongoing investment; and finding a retail or foodservice partner willing to commit long-term distribution adds another layer of complexity.
That said, some regional cooperatives are finding their own paths. Cobblestone Milk Cooperative in Virginia built its model around exceptionally high-quality standards—bacteria and somatic cell counts far below industry norms, as Dairy Herd has documented—creating differentiation without the use of ultrafiltration technology. The approach requires different capabilities than the fairlife model, but it shows there’s more than one route to premium positioning.
The key insight: fairlife’s success proves the premium fluid milk market exists and can grow. Replicating it requires either a massive corporate partnership or finding alternative differentiation strategies appropriate to your cooperative’s scale and capabilities.

The Genetics Angle: Why “Volume-Only” Selection Is Losing Ground
For Bullvine readers, here’s where the story gets especially relevant. The shift toward premium, composition-focused products isn’t just changing processor strategies—it’s fundamentally reshaping what genetics are worth money.
The April 2025 Net Merit revision from CDCB clearly tells the story. According to the official USDA-AGIL research document “Net merit as a measure of lifetime profit: 2025 revision,” the updated NM$ formula shifts emphasis significantly:
| Trait | 2021 NM$ Weight | April 2025 NM$ Weight | Direction |
| Protein | 19.6% | 13.0% | ↓ Decreased |
| Fat | 28.6% | 31.8% | ↑ Increased |
| Feed Saved | 12.0% | 17.8% | ↑ Increased |
| Productive Life | 11.0% | 8.0% | ↓ Decreased |
Why the shift? Dr. Paul VanRaden, Research Geneticist at USDA and lead author of the Net Merit revision, describes NM$ 2025 as “a strategic response to the evolving dairy industry,” integrating recent economic data and market signals. Butterfat emphasis increased because consumer demand for butter and high-fat dairy products has strengthened. Protein emphasis decreased partly because the cheese market has matured, and premium fluid products like fairlife actually remove some protein during ultrafiltration.
The real-world expression of these genetic shifts is already visible. Corey Geiger with CoBank told Brownfield Ag News that Holstein butterfat levels reached a record 4.23% in 2024, while protein levels were 3.29%. The April 2025 genetic base change reflects this: Holsteins saw a 45-pound rollback on butterfat—that’s 87.5% higher than the 24-pound adjustment in 2020, and the largest base change in the breed’s genetic history. Protein rolled back 30 pounds.
Geiger’s projection is striking: he told Brownfield he believes butterfat levels “could pass five percent in the next decade” based on current consumer demand and genetic momentum.
What this means practically: bulls selected purely for milk volume without strong component percentages are becoming less valuable relative to high-component, high-health-trait sires. TPI formula adjustments reflect similar trends—Holstein Association USA has been increasing emphasis on fat and protein pounds while rebalancing type traits.
For breeding decisions today, the implications are clear:
- Component percentages matter more than ever. A sire with +0.10% Protein and +0.35% Fat commands attention in ways volume-only genetics don’t.
- Feed efficiency is gaining weight. The Feed Saved emphasis increase from 12% to 17.8% in NM$ reflects tighter margins and environmental pressure.
- Health and longevity traits remain important but are being rebalanced against productivity gains.
The premium pivot isn’t just about finding a processor who’ll pay more for your milk. It’s about recognizing that the entire genetic selection framework is shifting toward what those premium products require.
The Two-Tiered Reality: Who Actually Benefits?
This brings us to what might be the most uncomfortable part of the story. The premium pivot and genetic evolution I’ve been describing don’t affect all operations equally. In fact, there’s a reasonable argument that these trends are accelerating the exit of smaller producers who can’t afford the entry costs.

The numbers are sobering. The 2022 USDA Census of Agriculture found just 24,082 U.S. dairy farms—down from 39,303 in 2017. That’s nearly a 40% decline in five years, as Brownfield Ag News and Dairy Reporter both reported. Lucas Fuess, senior dairy analyst at Rabobank, points out that 68% of U.S. milk now comes from farms with 1,000 or more cows—operations that represent only 8% of total farms.
| Category | 2017 | 2022 |
| Number of U.S. dairy farms | 39,303 | 24,082 |
| Share of milk from farms with 1,000+ cows | 60% | 68% |
| Estimated share of farms with 1,000+ cows | 6% | 8% |
| Cost advantage of >2,000-cow farms vs. 100–199 | $8/cwt cheaper | $10/cwt cheaper |
The cost dynamics are stark. USDA data show farms milking more than 2,000 cows can operate roughly $10 per hundredweight cheaper than farms with 100-199 cows. That’s not a small gap—it’s the difference between profitability and struggling to break even.
Meanwhile, the 50-99 cow category—traditionally the heart of family dairy—has seen dramatic declines according to USDA census data, with the segment nearly halving between 2017 and 2022. Dr. Frank Mitloehner at UC Davis has noted that one of the main reasons smaller dairy farms are disappearing is “ever-tightening profit margins,”—and larger farms’ cost advantages enable them to “achieve much higher net returns,” as Dairy Global reported.
Peter Vitaliano, economist for the National Milk Producers Federation, told Brownfield that 2023 saw nearly 6% of licensed dairy farms exit, and he expected “an even higher rate of dairy farm closures” in 2024. Industry analysts project that this consolidation trend will continue, with production increasingly concentrated on the largest operations.
So when we talk about genomic testing at $25-50 per head, third-party certification programs, and processor relationships that require data transparency and infrastructure investment—who can actually afford that?
For a 2,000-cow California operation, genomic testing the replacement heifer crop might run $50,000-100,000 annually—a meaningful but manageable investment against a multi-million dollar revenue base. The same testing for a 150-cow Vermont farm costs $3,750-7,500—proportionally similar, but coming out of a much tighter margin with far less negotiating leverage on the premium side.
The infrastructure requirements for premium programs add another layer. FARM certification, video monitoring at handling points, sustainability documentation, and unannounced audit preparation—these require administrative capacity that larger operations can absorb more easily than smaller ones running lean.
Does “Collaborative Competition” Help the Small Producer?
The DMI partnership model—where checkoff dollars leverage private investment—has clearly grown the premium category. But does that growth help the 150-cow operation, or does it primarily benefit the large farms and cooperatives already positioned to capture that value?
The evidence is mixed.
On one hand, composition-based pricing tiers are expanding across cooperatives of various sizes. FarmFirst, Foremost Farms, and DFA all have programs that, in theory, reward any member farm that ships high-component milk. Genetic improvement is available to everyone who chooses to pursue it.
On the other hand, premium market access often requires scale. fairlife’s supplier base is deliberately limited to 99 member farms in Select Milk Producers. Organic Valley added just 84 farms in 2023 despite significant producer interest. The infrastructure investments driving premium product growth—like fairlife’s $650 million Webster, New York facility—create jobs and markets, but they don’t automatically open doors for every nearby farm.
The most honest assessment: the premium pivot has created new opportunities, but those opportunities aren’t equally accessible. Farms with existing cooperative relationships, geographic proximity to premium processors, capital for certification and genetic investment, and administrative capacity for compliance requirements are better positioned than those without. The “collaborative competition” model has grown the pie, but the slices aren’t being distributed equally.
For smaller operations, the strategic question becomes: what premium pathways are actually accessible given your scale, location, and cooperative membership? Direct-to-consumer sales, farmstead processing, local food networks, and quality-differentiated regional cooperatives like Cobblestone may offer more realistic paths than trying to break into fairlife’s supply chain.
Navigating the Fair Oaks Crisis
Every turnaround has a moment where the whole thing nearly falls apart. For dairy’s innovation strategy, that moment came in June 2019.
The Animal Recovery Mission, an animal welfare organization, released undercover footage from Fair Oaks Farms—one of fairlife’s primary milk suppliers in Indiana. The footage showed systematic mistreatment of calves, and Dairy Reporter, along with other trade publications, covered the story extensively.
The response from retailers was immediate. Industry reporting confirmed that major chains, including Jewel-Osco, Tony’s Fresh Market, and several others, pulled fairlife from shelves within days. Consumer boycotts gained momentum. Class action lawsuits were filed alleging deceptive marketing around animal welfare claims.
What happened next offers lessons for crisis management across the industry.
Rather than minimize the situation or deflect blame, fairlife and Coca-Cola chose transparency. They immediately suspended all milk deliveries from Fair Oaks Farms. Dairy Reporter confirmed they increased unannounced audits at supplier farms from once annually to 24 times per year—a dramatic escalation in oversight. They installed video monitoring systems at animal handling points and commissioned independent investigations of all supplying farms.
fairlife’s 2024 Animal Stewardship Report, as covered by Food Dive, notes the company has invested, along with its suppliers, nearly $30 million in its animal welfare program since the crisis. The company eventually paid $21 million to settle related litigation—Food Dive called it one of the largest settlements ever in an animal welfare labeling case.
It was expensive. It was risky—admitting failure often accelerates brand damage in the short term. But the approach preserved something more valuable: trust in the brand and in the category. By 2020-2021, fairlife had returned to most retail shelves. By 2022, it reached $1 billion in sales.
Practical Implications for Producers
So that’s the industry-level narrative. But what does it mean for someone actually running a dairy operation? That’s the question that matters most.
The shift affecting producers most directly is the changing economics around milk composition. The traditional model rewarded volume—more pounds shipped meant more revenue. The emerging model increasingly rewards components and quality characteristics that premium products require.
I’ve talked with several Upper Midwest producers who are seeing this play out in real time. Farms focusing on protein percentage and butterfat rather than volume alone are reporting meaningful improvements in their milk checks—even when shipping slightly less total volume. It requires a different way of thinking about what you’re actually producing.
Here’s the practical reality. Current Class III prices have been running in the mid-to-upper teens per hundredweight according to USDA milk pricing data, with month-to-month variation. Farms meeting premium composition targets through preferred supplier programs can access additional premiums, though specific rates vary considerably by processor and region.
| Metric | Herd A – Volume Focus | Herd B – Premium Components |
| Avg. milk shipped/cow/day | 90 lb | 82 lb |
| Butterfat / Protein test | 3.7% F / 3.05% P | 4.2% F / 3.25% P |
| Base milk price | $18.00/cwt | $18.00/cwt |
| Component & quality premiums | $0.40/cwt | $1.30/cwt |
| Net mailbox price | $18.40/cwt | $19.30/cwt |
Regional dynamics matter here. Upper Midwest cooperatives like FarmFirst and Foremost Farms have been building out composition-based pricing tiers, according to their published producer communications. California’s larger operations often negotiate directly with processors. Southeastern producers working through DFA have seen new preferred supplier programs emerge over the past couple of years. Pacific Northwest operations shipping to Darigold have their own regional dynamics. The opportunity exists, but access varies.

What many producers are discovering is that capturing these premiums requires intentional decisions rather than hoping the bulk tank tests well:
Genomic testing is typically the starting point. Testing replacement heifers for protein traits, A2 beta-casein status, and kappa-casein genotype generally runs in the $25-50 range per animal through commercial services, though prices vary by service level and volume. University extension dairy genetics research confirms these trait associations translate to real composition differences in the bulk tank over time. For a 100-heifer crop, you’re looking at a few thousand dollars—an investment that can return value within the first year of improved milk checks if you’re making culling and breeding decisions based on the results.
Sire selection follows from testing—and this is where the Net Merit shifts become directly actionable. Bulls ranking high on protein percentage, fat percentage, A2A2 genetics, and kappa-casein BB genotypes are increasingly valuable. A2A2 milk commands premiums in some markets because consumers perceive it as easier to digest. Research published in the Journal of Dairy Science confirms that kappa-casein BB genetics improve the processing characteristics of milk for ultra-filtered products.
Given the April 2025 NM$ revision, which emphasizes butterfat (+31.8% weight) and feed efficiency (+17.8% weight) while de-emphasizing protein pounds, sire selection strategies should reflect these economic realities. Volume-only genetics—high milk pounds without strong component percentages—are losing ground in the index and in the marketplace.
It’s worth noting that these genetic shifts take time. We’re talking about a 3-5 year timeline before you see the full expression in your herd. Decisions made today won’t show up meaningfully in bulk tank averages until 2028-2030. That’s the reality of cattle genetics—no shortcuts available.
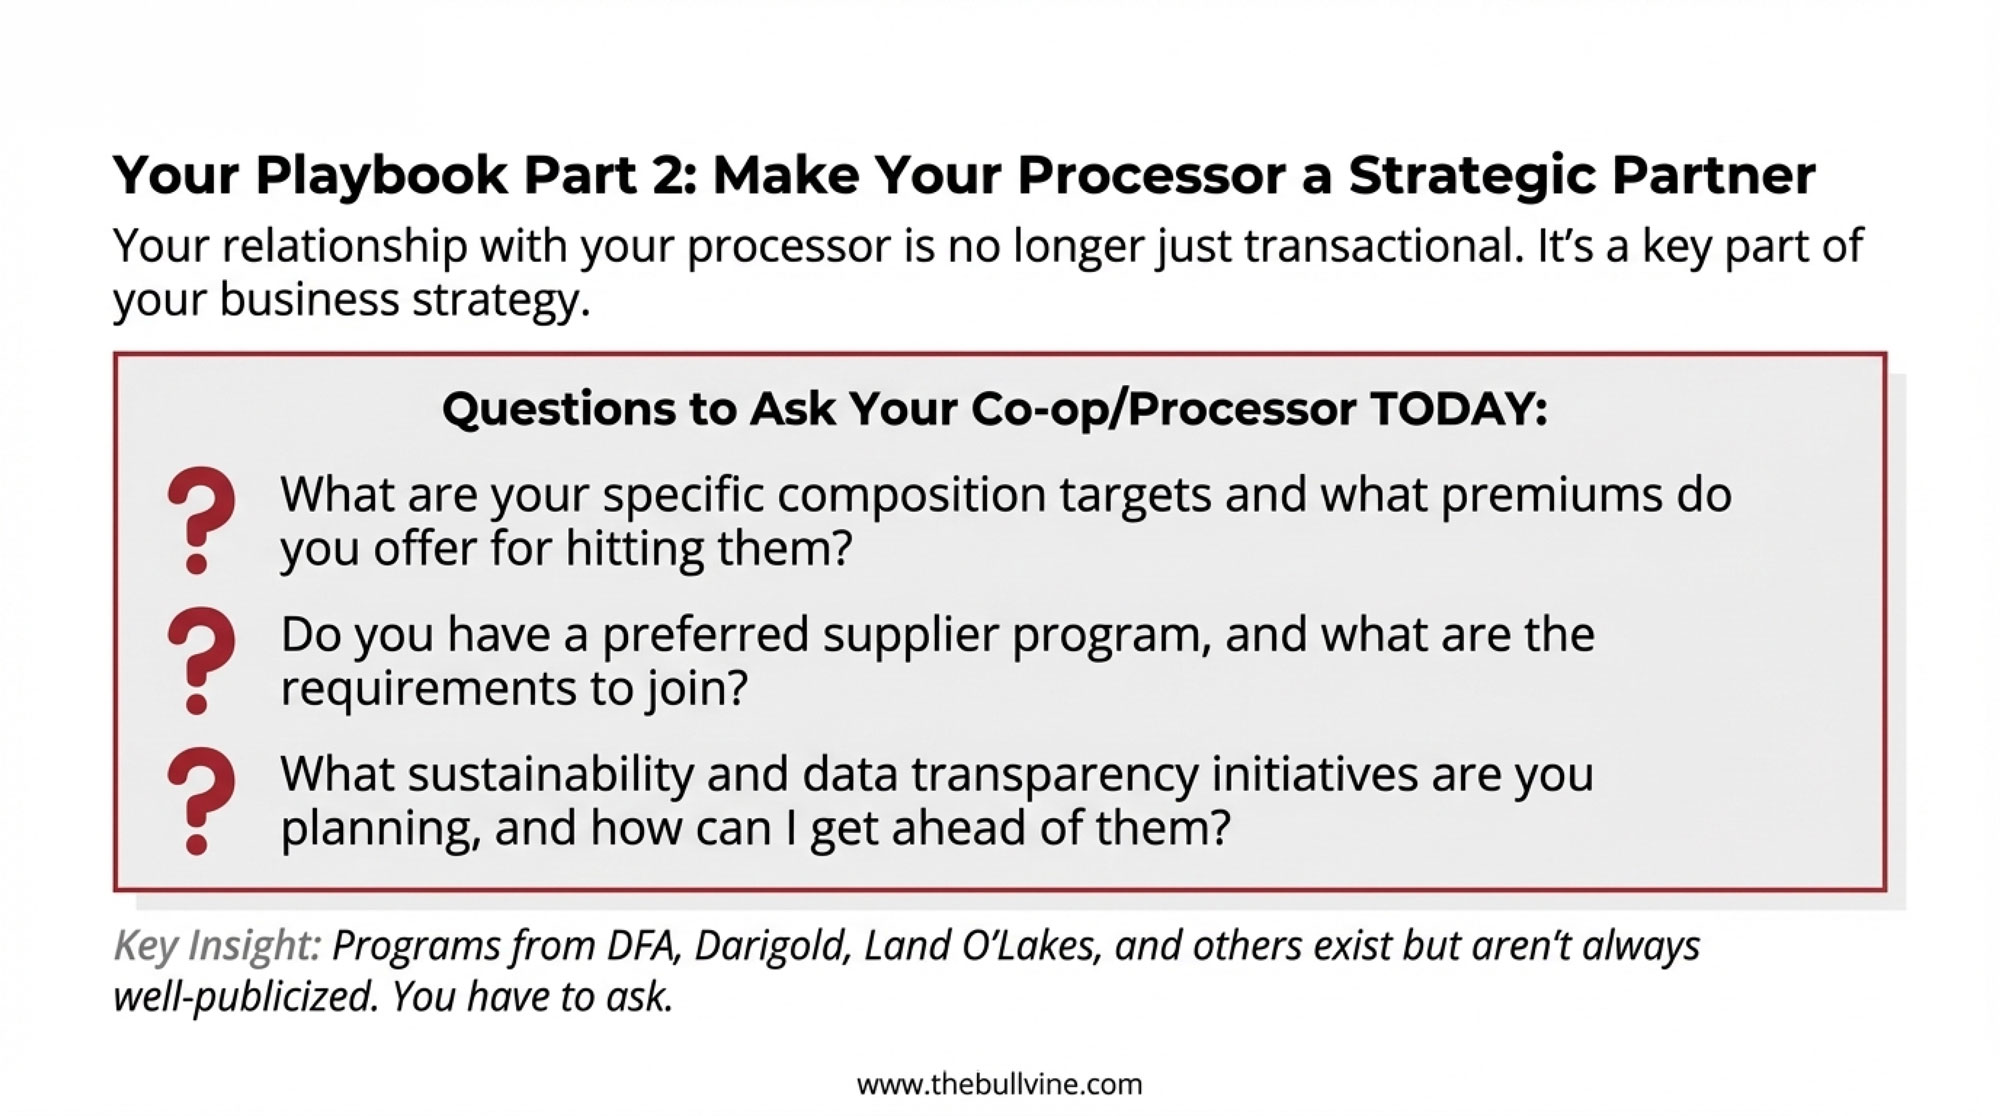
Processor relationships are becoming strategic rather than purely transactional. I’d encourage any producer reading this to contact your processor’s sourcing or sustainability department and ask directly: What composition targets are you looking for? What premiums do you offer for hitting them? Do you have a preferred supplier program?
Some processors—DFA, Darigold, Land O’Lakes, and others—have formal programs that offer price premiums, contract stability, and technical support to farms that commit to composition targets and data transparency. These programs aren’t always well-publicized, but they exist.
Certification requirements are expanding as well. fairlife, Horizon Organic, and other premium brands increasingly require third-party sustainability verification from their suppliers. FARM certification, DHI participation, and documented environmental practices are becoming baseline expectations rather than differentiators.
Challenges and Uncertainties Ahead
It would be incomplete to discuss this turnaround without acknowledging the challenges that remain. Success creates its own vulnerabilities.
- Capacity constraints are affecting the market right now. fairlife is production-limited, according to Coca-Cola’s Q3 2024 earnings commentary. CEO James Quincey explicitly stated they couldn’t meet demand until new capacity comes online. Cowsmo reported on a 745,000-square-foot, $650 million facility under construction in Webster, New York, that should help, but it’s been a bottleneck.
- Policy changes create uncertainty. The Federal Milk Marketing Order reform, taking effect in 2025, is expected to affect milk pricing in various ways. The exact impact depends on your region and class utilization, so it’s worth checking with your cooperative or university extension for current projections specific to your situation.
- Plant-based competition continues. The category keeps growing, with various market research firms projecting continued expansion through the early 2030s. Growth has moderated from the rapid 2018-2020 period, but oat milk in particular continues gaining ground with younger consumers.
- Consolidation pressure isn’t easing. The trajectory from the 2022 census—40% fewer farms in five years—continues to pressure mid-size operations caught between the flexibility of small farms and the cost advantages of large ones.
- Complacency may be the biggest risk. The discipline that built the turnaround—long-term research investment, consumer-centric product development, collaborative strategy—is exactly what successful industries tend to abandon once growth returns. If checkoff boards redirect funding from innovation to short-term promotion, or if processors reduce R&D as margins improve, the momentum could stall.
The Underlying Lesson
Looking at this entire arc, there’s a counterintuitive insight that applies beyond dairy.
The instinct when an industry faces decline is to work harder at the existing business. Cut costs. Improve efficiency. Fight for market share. Promote more aggressively.
Dairy tried all of that for years. It wasn’t sufficient—because when the market itself is shifting away from your core product, being better at the old thing only delays the inevitable.
What changed around 2014-2015 was a fundamental acceptance that commodity fluid milk, as traditionally sold, was unlikely to return to growth. Instead of fighting that reality, industry leaders asked what they could build that consumers actually wanted, using the infrastructure and supply chain already in place.
Same farms. Same cows. Same processing facilities. But instead of trying to sell more commodity milk at mid-teens per hundredweight, the focus shifted to creating categories where dairy had genuine advantages: ultra-filtered, lactose-free, high-protein, composition-specific products commanding meaningful premiums.
Volume is flat or slightly declining. Revenue per farm is higher. Margin per cow improved. Farm sustainability is better—for those who can access the premium markets.
That last qualifier matters. The turnaround is real, but its benefits aren’t flowing equally to all producers. The strategic question for any individual operation isn’t whether the premium pivot worked at the industry level—it clearly did—but whether and how you can position to capture some of that value given your specific scale, location, genetics, and cooperative relationships.
The Bottom Line
The dairy industry in late 2025 sits at an interesting inflection point. The turnaround appears real—2024’s growth wasn’t an anomaly, and analysis suggests the trajectory is continuing. Premium categories are expanding. Consumer perceptions of dairy are improving among key demographics. Genetic selection is evolving to support composition-focused production.
But the foundational work isn’t complete. New processing capacity is still coming online. Composition-focused genetics will take another 3-5 years to express in herds that are now fully selecting. Policy and trade uncertainty could affect even well-planned operations. And the consolidation pressure that’s eliminated 40% of U.S. dairy farms since 2017 shows no sign of reversing.
For producers, the practical implications come down to several key considerations:
- Assess your herd’s genetic profile if you haven’t already. The information shapes every breeding decision going forward. With NM$ now emphasizing butterfat and feed efficiency more heavily, your selection criteria may need updating.
- Initiate conversations with your processor about composition premiums. Programs exist but aren’t always well-publicized. Ask specifically what they’re seeking and what they offer for hitting targets.
- Be realistic about premium market access. Not every farm can break into fairlife’s supply chain or join Organic Valley. Understand which premium pathways are actually accessible given your scale and cooperative membership—and consider alternatives, such as quality-focused regional cooperatives or direct marketing—if the major premium programs aren’t realistic options.
- Plan for the 2028-2030 timeframe, not just next year’s milk check. Genetic decisions compound over time. Processor relationships require time to develop. The farms positioned well three years from now are making those decisions today.
- Watch the consolidation dynamics. If you’re a mid-size operation, clearly understand whether your cost structure and market access can remain competitive as larger operations continue to gain share.
The turnaround didn’t happen because someone discovered a compelling marketing message that made consumers embrace commodity milk again. It happened because the industry stopped trying to preserve something consumers had moved past and started building what they actually wanted.
That’s perhaps the most transferable insight here. Not the specific technology or product. The willingness to accept that what worked for 50 years may not work for the next 20—and to build something new while there’s still time.
Key Takeaways
- The 15-year decline is over. Fluid milk sales grew 0.8% in 2024—driven by premium products like fairlife, not commodity milk marketing.
- Your genetics are being repriced. April 2025 Net Merit boosts butterfat to 31.8% and cuts protein to 13.0%. Volume-only bulls are losing economic ground.
- $7.4 billion proves the premium model. Coca-Cola’s total fairlife investment shows the upside is real—but capturing it requires scale, certifications, and cooperative positioning most farms don’t have.
- 40% of U.S. dairy farms are already gone. Operations dropped from 39,303 (2017) to 24,082 (2022). Premium market benefits are concentrating in larger herds.
- The question has changed. It’s no longer whether this shift is real—it’s whether your operation’s genetics, processor relationships, and market access position you to benefit from it. The farms winning in 2028 are making those decisions now.
Complete references and supporting documentation are available upon request by contacting the editorial team at editor@thebullvine.com.
Learn More:
- Bred for $3 Butterfat, Selling at $2.50: Inside the 5-Year Gap That’s Reshaping Genetic Strategy – Explores the critical “timing gap” between breeding decisions and bulk tank reality. It provides actionable strategies for using economic indices to hedge against market volatility and ensures your genetic investment aligns with future pricing.
- The $4/cwt Your Milk Check Is Missing – And What’s Actually Working to Get It Back – Reveals the structural factors missing from modern milk checks—from make allowances to regional spreads. This guide demonstrates how to deploy risk management tools and beef-on-dairy programs to recover and protect your margins.
- This Dairy Innovation Just Made Gatorade Look Like Sugar Water – And It’s Now at Costco – Demonstrates how ultrafiltration technology is opening massive new retail categories beyond fluid milk. Learn how “waste” permeate is being transformed into high-value sports nutrition products, creating significant revenue opportunities for progressive operations.
 The Sunday Read Dairy Professionals Don’t Skip.
 The Sunday Read Dairy Professionals Don’t Skip.
Every week, thousands of producers, breeders, and industry insiders open Bullvine Weekly for genetics insights, market shifts, and profit strategies they won’t find anywhere else. One email. Five minutes. Smarter decisions all week.


