


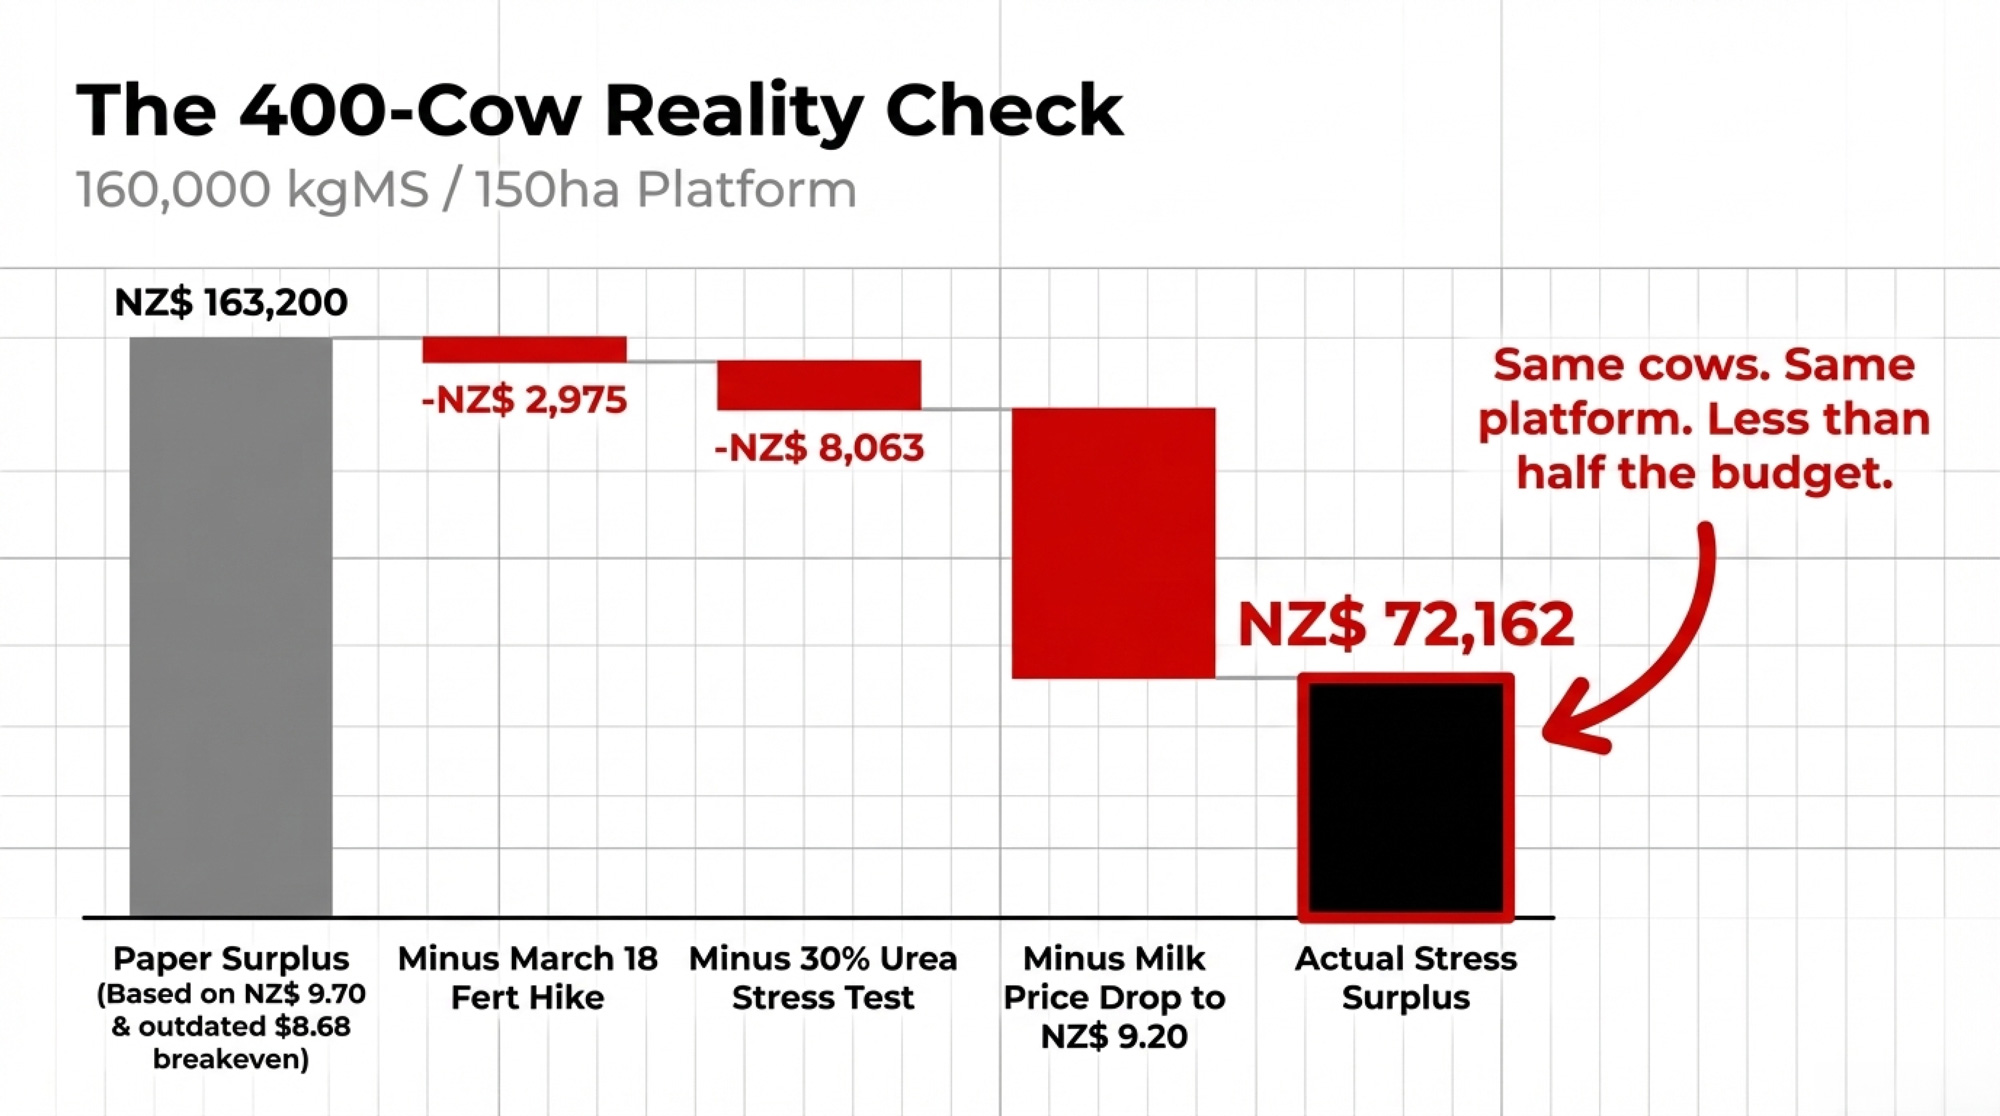
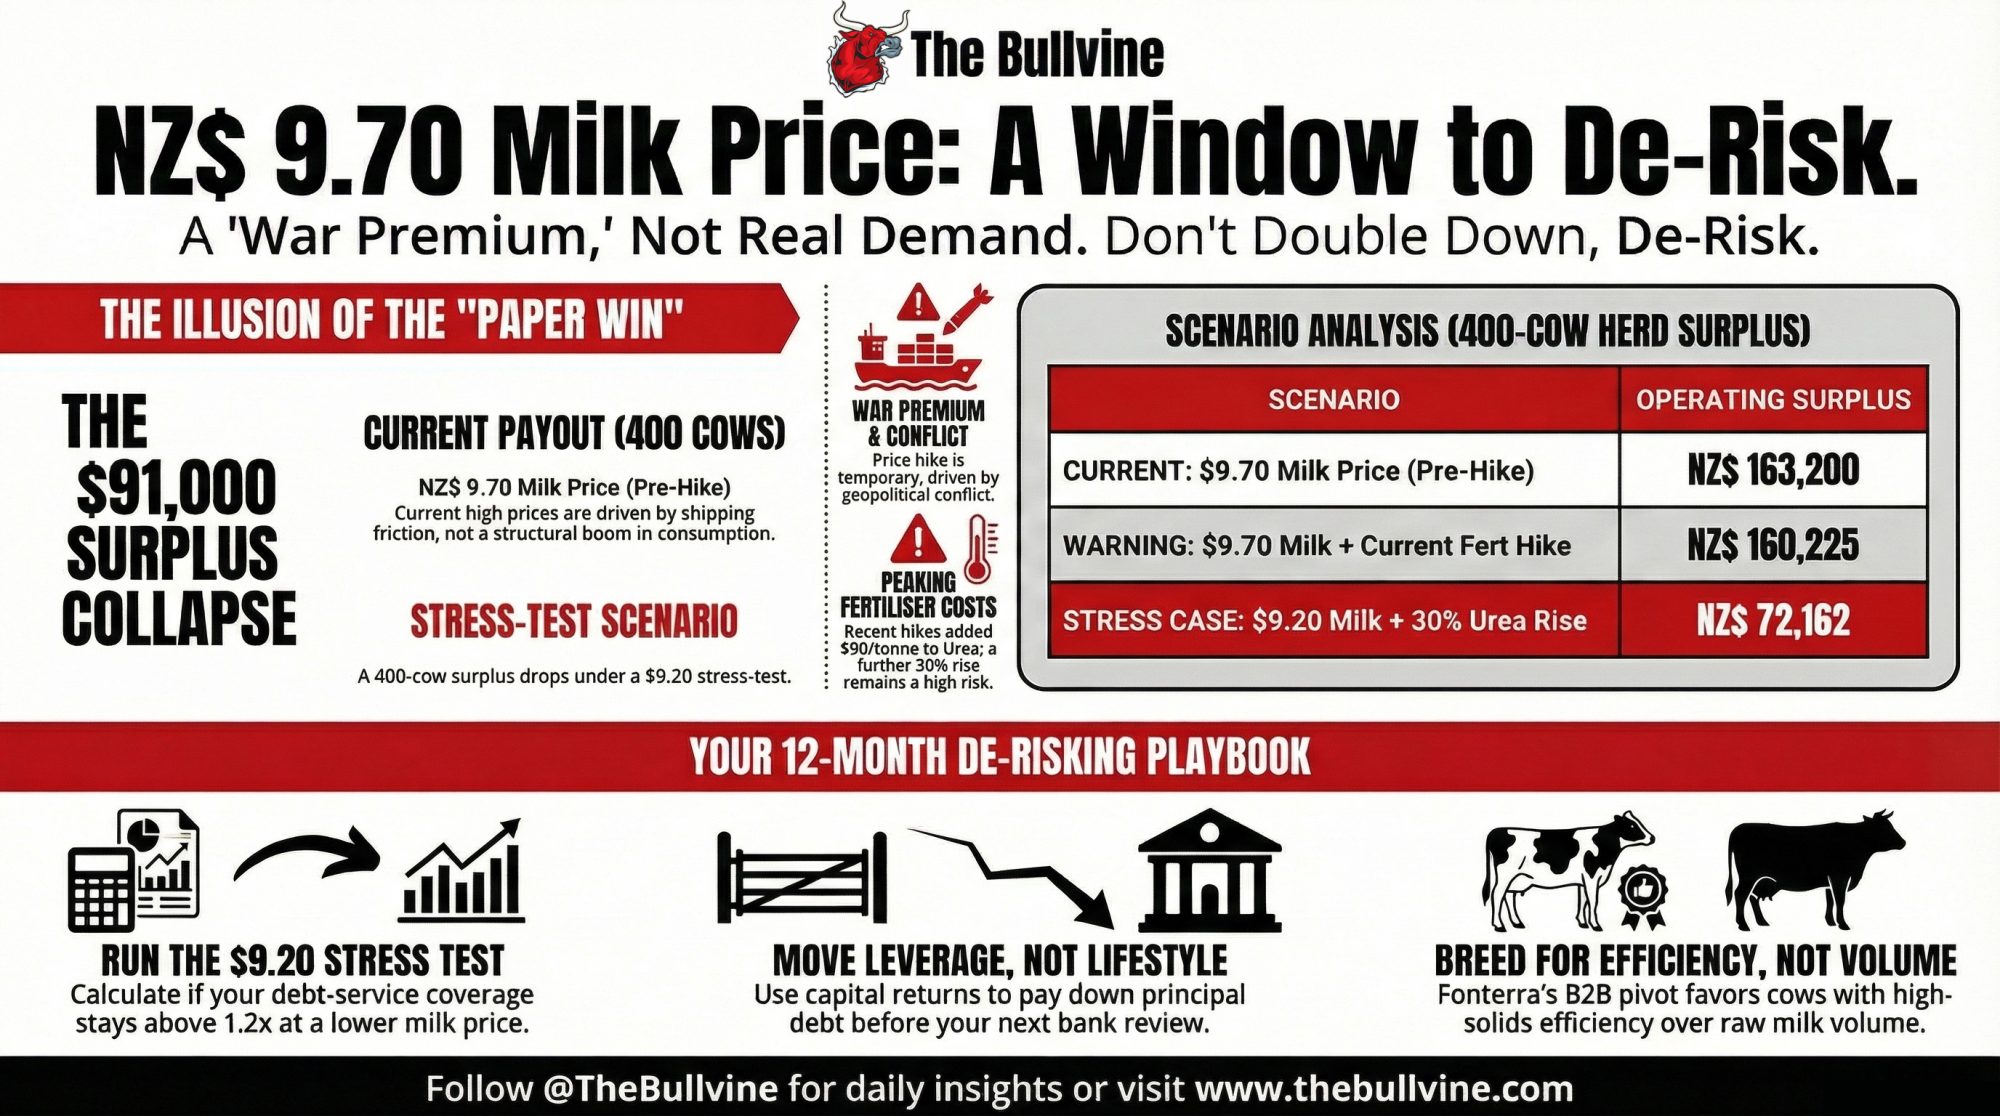
At NZ$9.70, a 400‑cow herd clears NZ$163,200. At NZ$9.20 with post‑March fert costs, it’s NZ$72,162. Same cows. Same platform. Different budget.
Executive Summary: Fonterra’s NZ$9.70/kgMS midpoint looks like a win, but ANZ already pegs 2026/27 closer to NZ$8.70, and Ballance just added NZ$90/t to urea. A 400‑cow herd that appears to clear NZ$163,200 at NZ$9.70 and DairyNZ’s NZ$8.68 breakeven can see that surplus collapse to about NZ$72,000 if milk slips to NZ$9.20 and nitrogen climbs another 30%. The co‑op has hedged itself with a 10‑year raw milk deal, a 3‑year ingredients agreement, and roughly NZ$3.9B in returns, but none of that changes your breakeven, leverage, or debt‑service coverage. This piece walks through the barn math step‑by‑step so you can plug in your own kgMS, fert tonnes, and debt schedule. It shows why herds in the 60–65% debt‑to‑asset band are in a “use this payout to de‑risk or double down” 12‑month window. And it lays out a practical playbook: how to stress‑test at NZ$9.20 plus higher fert, what to take to your next bank review, and how to decide whether to lock in nitrogen or ride the market.

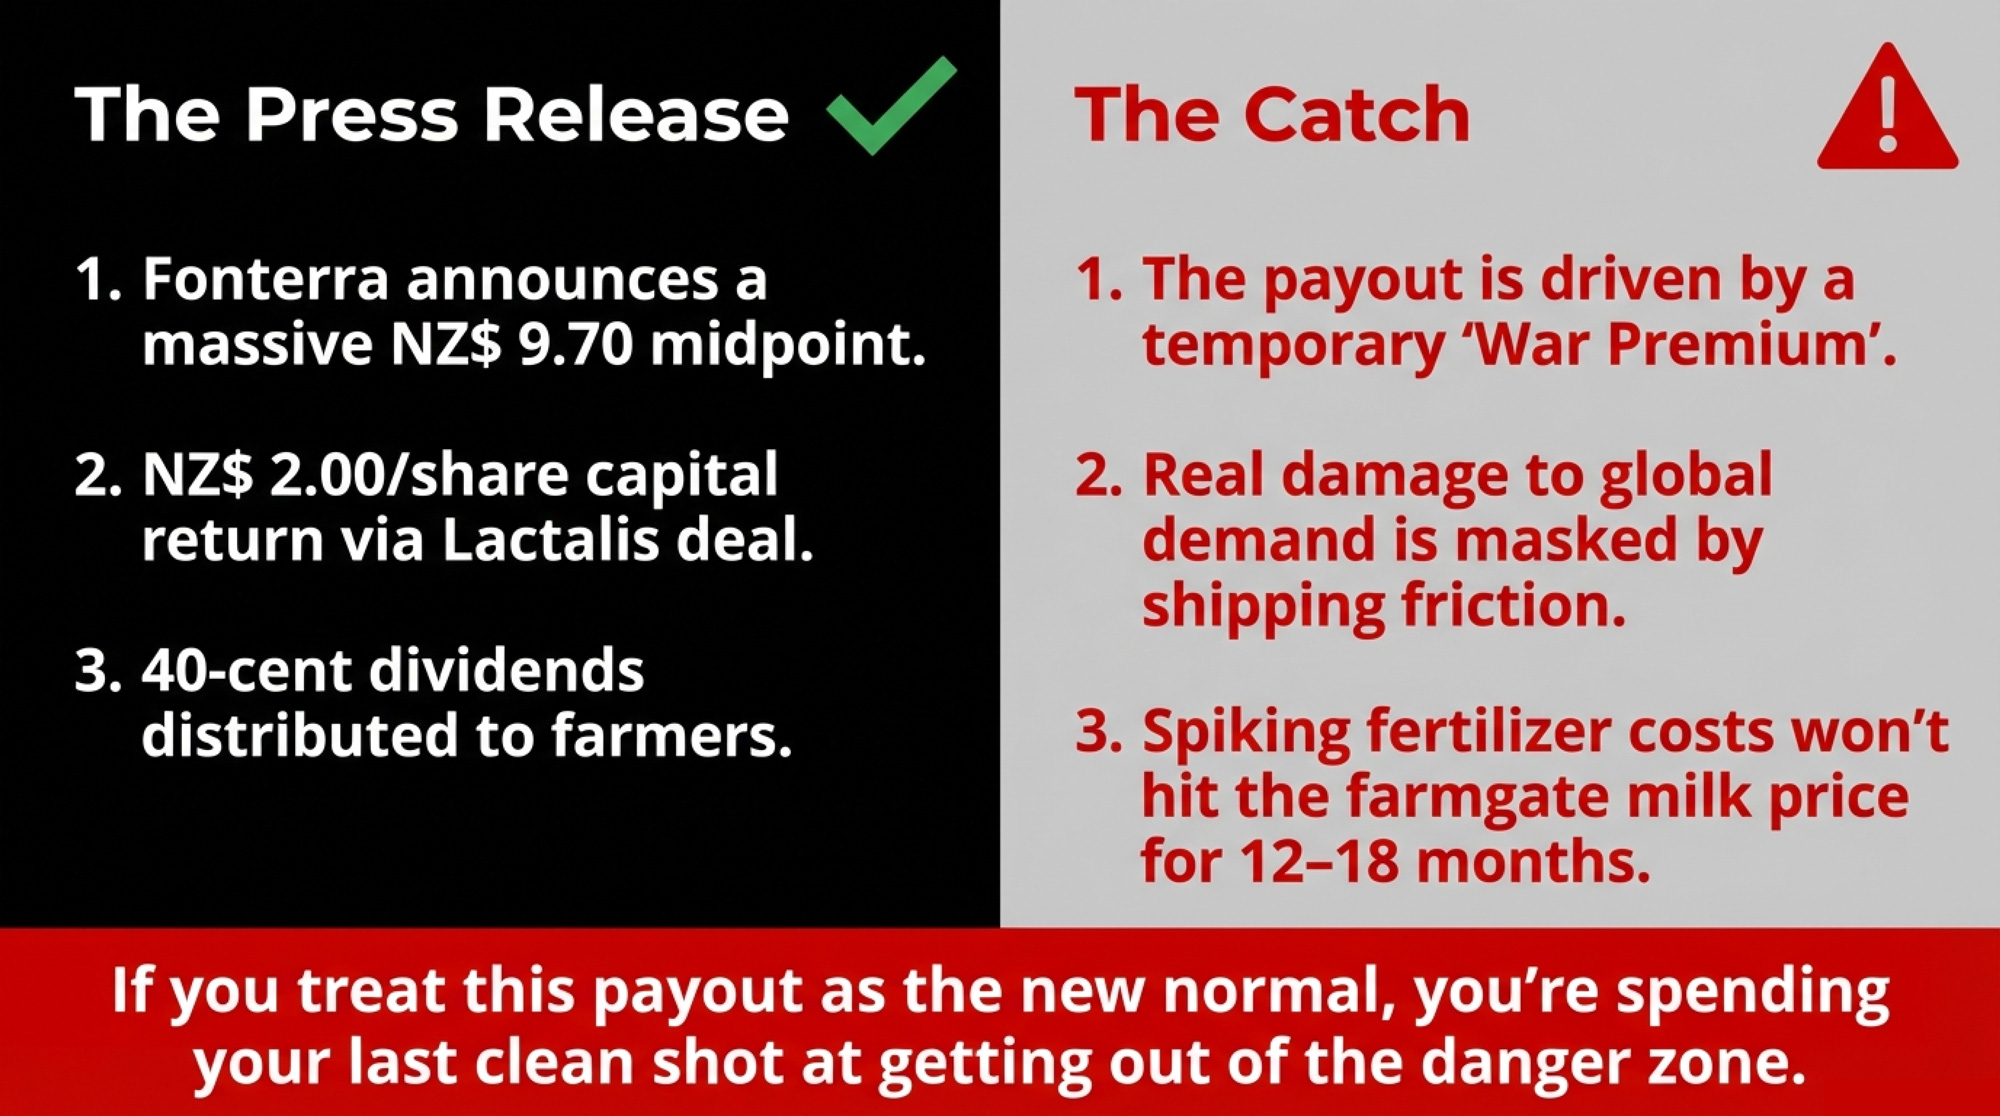
For a 400‑cow North Island dairy sitting at about 65% debt‑to‑asset, Fonterra’s NZ$9.70 per kgMS midpoint, NZ$2.00 per share capital return, and 40 cents in dividends feel like a long‑overdue rescue package. On paper, it’s the first season in two years where the milk cheque looks big enough to fix fences, upgrade gear, and finally get the bank manager off your back.
The catch is simple and uncomfortable: those record numbers are boosted by short‑term conflict and shipping friction, while the real damage to demand and fertiliser costs won’t show up in the farmgate milk price for another 12–18 months. If you treat this payout as the new normal, you may be spending what should’ve been your last clean shot at moving out of the danger band — not because the numbers are wrong, but because the conditions behind them may not last.
A 400‑Cow “Win” That’s Not as Fat as It Looks.
Let’s stay with that 400‑cow example, because that’s exactly where a lot of New Zealand herds sit. Call him Mark — 400 cows on about 150 hectares of milking platform in the North Island, running an intensive pasture system and carrying roughly 65% debt‑to‑asset after the last few tough seasons.
| Scenario | 400 cows (160k kgMS) | 800 cows (336k kgMS) | 1,500 cows (660k kgMS) |
|---|---|---|---|
| NZ$9.70 FMP, pre-hike costs | NZ$163,200 | NZ$342,720 | NZ$673,200 |
| NZ$9.70 + Ballance March hike | NZ$160,225 | NZ$339,672 | NZ$670,105 |
| NZ$9.70 + 30% urea stress | NZ$152,162 | NZ$319,544 | NZ$628,843 |
| NZ$9.20 + 30% urea stress | 🔴 NZ$72,162 | 🔴 NZ$152,644 | 🔴 NZ$301,991 |
On March 22, 2026, Fonterra reported half‑year FY26 numbers: NZ$13.9 billion in revenue and NZ$750 million net profit after tax for the six months to January 31, 2026. On the back of that, the co‑op lifted its forecast Farmgate Milk Price range to NZ$9.40–NZ$10.00 per kgMS, with a midpoint of NZ$9.70 — up from a previous midpoint of NZ$9.50. It also confirmed an interim dividend of 24 cents per share and a special 16‑cent Mainland dividend, and signalled a planned NZ$2.00 per share capital return tied to completion of its Lactalis transactions.
DairyNZ’s Econ Tracker, updated June 26, 2025, put the national average breakeven milk price at NZ$8.68 per kgMS for the 2025/26 season, up from NZ$8.41 the year before. Head of economics Mark Storey linked that increase to higher tax obligations and rising farm working expenses, especially feed, fertiliser, and energy.
If Mark’s breakeven matched that national average, his margin at NZ$9.70 looks like this:
- 9.70 − 8.68 = NZ$1.02/kgMS margin.
- At 160,000 kgMS from 400 cows, that’s NZ$163,200 in operating surplus for the season.
That’s before the capital return and dividends even hit his account. It’s the kind of number that makes you think about new iron, extra land, maybe finally getting ahead of the bank.
But DairyNZ’s NZ$8.68 breakeven was calculated before March 18, 2026.
The Fertiliser Hit You Didn’t Budget For
Four days before Fonterra released those HY26 numbers, Ballance Agri‑Nutrients told farmers it was raising fertiliser prices again. In a March 18 update, Ballance said sulphur‑based and Yara‑branded products would increase immediately, with other products following on March 26, citing “rapidly changing circumstances” in global markets and conflict in the Middle East.
The new Ballance schedule landed like this for New Zealand farmers:
- Urea: up NZ$90/tonne, to about NZ$1,075/t.
- SustaiN: up NZ$90/t, to around NZ$1,124/t.
- DAP: up NZ$75/t, to roughly NZ$1,603/t.
- Superphosphate: up NZ$35/t, to about NZ$549/t.
On Mark’s 150‑hectare platform, let’s assume a fairly intensive fertility program — around 25 tonnes of urea, 5 tonnes of DAP, and 10 tonnes of super in a season. Plug your own rates in here, but watch what happens with these numbers:
- Urea: 25 t × NZ$90/t = NZ$2,250.
- DAP: 5 t × NZ$75/t = NZ$375.
- Super: 10 t × NZ$35/t = NZ$350.
That’s an extra NZ$2,975 in fertiliser costs purely from the March increase. Spread over 160,000 kgMS, it’s about 1.9 cents/kgMS off his margin.
So Mark’s “paper” margin drops from NZ$1.02/kgMS to roughly NZ$1.00/kgMS after just one pricing email. Doesn’t sound like much. Not yet. But it’s already trimming a margin most operators are still mentally pencilling at NZ$1.02/kgMS.
The 30% Urea Stress Test: How Fast the Cushion Shrinks
Ballance’s head of procurement, Shane Crean, has been warning since early 2026 that volatility is now the norm rather than the exception: India’s tender timing, China’s DAP export settings, and instability around the Strait of Hormuz are all pushing nitrogen prices higher and making supply less predictable.
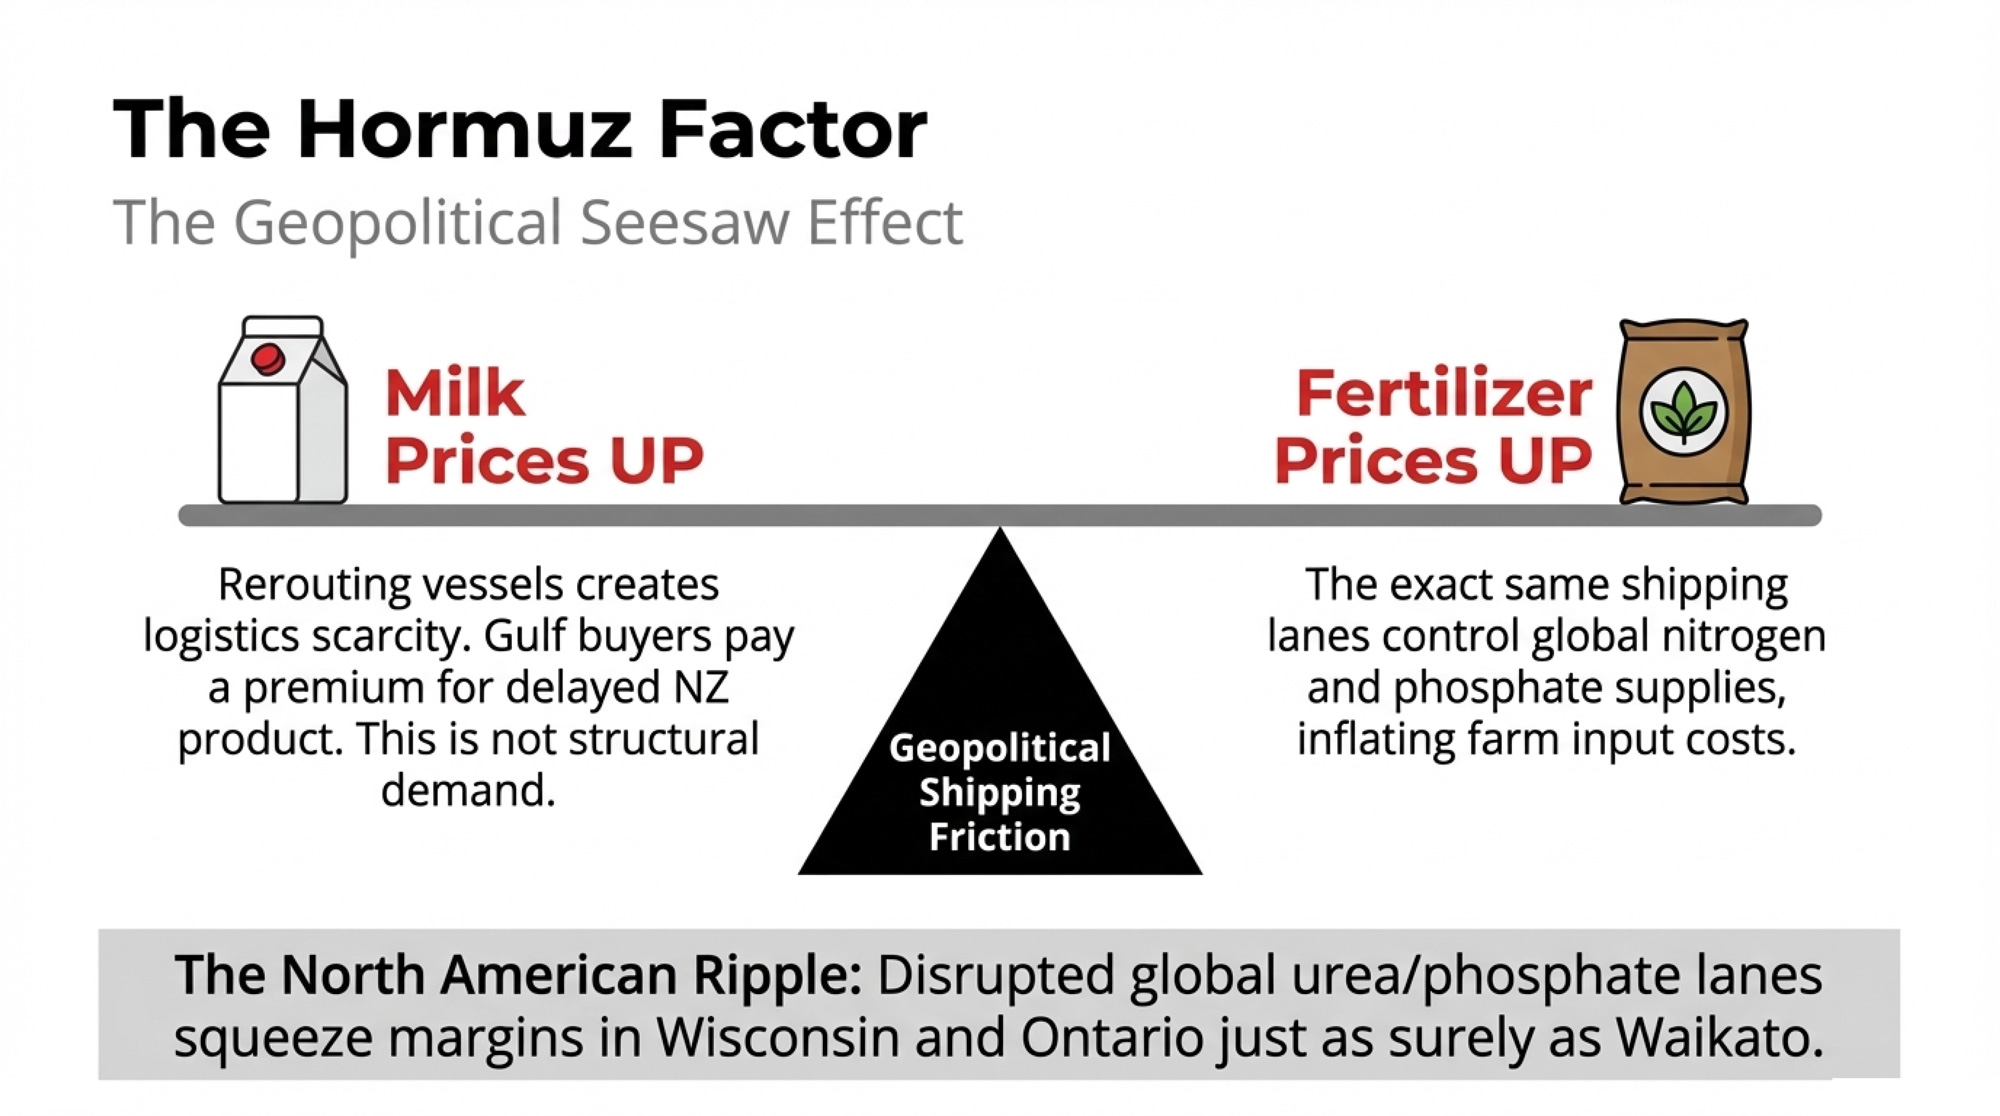
The Hormuz corridor carries an outsized share of the global fertiliser trade. Gulf producers supply a significant share of the global trade in nitrogen and phosphate, and New Zealand is directly exposed through imports of urea and other products.
There’s a recent precedent. When Russia invaded Ukraine in early 2022, putting a noticeable share of global urea exports at risk, NZ‑dollar nitrogen prices jumped sharply over a short period. Early commentary around the 2026 Hormuz disruption already highlights quick, double‑digit percentage gains in urea benchmarks as cargos are rerouted and insurers reprice risk.
So take a conservative stress case on top of what’s already happened: another 30% rise in urea from today’s NZ$1,075/t level.
In our example, 25 tonnes of urea, 30% of NZ$1,075 is about NZ$322.50/t.
- Extra cost from that move: 25 t × NZ$322.50/t ≈ NZ$8,063.
- Add the NZ$2,975 he’s already absorbed from the March hike.
Total incremental fertiliser cost versus pre‑March pricing: roughly NZ$11,038 for the season.
Mark’s apparent NZ$163,200 surplus becomes about NZ$152,162 before any other cost shifts. It’s still money. It’s just less room for error than the milk cheque suggests.
Here’s how that scales for three herd sizes, assuming similar kgMS per cow and the same per‑kg margin changes:
| Scenario | 400 cows (160k kgMS) | 800 cows (336k kgMS) | 1,500 cows (660k kgMS) |
| NZ$9.70 FMP, pre‑hike costs | NZ$163,200 | NZ$342,720 | NZ$673,200 |
| NZ$9.70 + Ballance hike | NZ$160,225 | NZ$339,672 | NZ$670,105 |
| NZ$9.70 + 30% urea stress | NZ$152,162 | NZ$319,544 | NZ$628,843 |
| NZ$9.20 + 30% urea stress | NZ$72,162 | NZ$152,644 | NZ$301,991 |
That last row is the uncomfortable one. It combines a NZ$9.20/kgMS milk price — the lower half of Fonterra’s own NZ$9.40–NZ$10.00 forecast range for 2025/26 — with the kind of fertiliser stress we’ve just walked through.
And NZ$9.20 isn’t even the bear case. ANZ’s February 10, 2026, forecast update for the 2026/27 season opened at NZ$8.70/kgMS, on the assumption that the current price surge would lose momentum and global supply pressures would reassert themselves. That was before the March Hormuz escalation pushed freight costs higher and spooked more Gulf buyers.
This isn’t about proving you’re doomed. It’s about making sure your budget matches the risk, not the press release.
The Global Ripple: Why North American Producers Should Care
It’s easy to look at NZ$9.70 and think, “That’s their problem. Different market.” It isn’t.
When New Zealand buyers and their customers start testing alternatives — shifting some skim and whole milk powder demand toward EU or U.S. suppliers — it doesn’t just reshuffle who wins a tender. It creates a temporary floorunder global dairy prices that’s built more on logistics friction and risk premiums than on a genuine jump in consumption.
Right now, that floor is propped up by longer shipping routes around the Cape of Good Hope, higher war‑risk insurance, and a premium for any supplier who can deliver reliably into the Middle East and North Africa. If shipping normalises or Gulf buyers complete their pivot toward alternative origins, that floor can drop fast — leaving anyone who budgeted off today’s “war premium” exposed.
The same goes for fertiliser. Analysts point out that a meaningful share of globally traded nitrogen‑rich urea and phosphates depends on Gulf producers and shipping lanes. U.S. agriculture has some buffer because it produces most of its ammonia domestically, but imported urea and phosphates still leave crop and dairy margins exposed to disruptions in the Strait of Hormuz corridor.
That’s the real “Hormuz Factor.” It’s not just an NZ shipping problem — it’s a global nitrogen and energy problem that puts pressure on Midwestern and Canadian fertiliser and feed costs in a different but still serious way. If fertiliser prices grind higher while crop prices don’t move in step — a risk several analysts are flagging under a prolonged Hormuz disruption — margins get squeezed in Wisconsin and Ontario just as surely as they do in Waikato, even if the exact numbers differ.
If you’re thinking ahead on dairy farm debt management 2026, this isn’t background noise. It’s one of the main reasons your 12‑month plan needs a stress test baked in.
Is GDT’s 2026 Rally Real Demand or Just a War Premium?
The whole NZ$9.70 story depends on what’s really driving commodity prices right now.
At the March 4, 2026 Global Dairy Trade event, the overall price index rose 5.7% — the fifth consecutive increase since January. Whole milk powder traded around US$3,863/t, skim milk powder rose by roughly 9%, and butter rose by just over 6%. Commentators called it evidence of “resilient demand,” pointing to buyers in the Middle East and Asia still bidding aggressively despite freight headaches.
That’s accurate at the surface level. Buyers are there. But a meaningful chunk of that price strength is better described as a friction premium than a demand boom.
With vessels being rerouted around the Cape of Good Hope and insurance costs rising, it’s simply harder and more expensive to move product from New Zealand to key buyers, including those in the Gulf. The buyers who still want NZ products are paying up to secure them. That’s scarcity in logistics, not a structural jump in how much dairy the world wants to consume.
ANZ’s February 2026 forecast update made a similar point. Agri economist Susan Dilly noted that while the GDT bounce was “great news for dairy farmers,” prices remained “a lot closer to the bottom than the top,” and that buyers “perhaps spooked by geopolitical tensions in the Middle East and elsewhere” were helping to drive the rebound after the late‑2025 sell‑off overshot on the downside.
At the same time, some large importers in the Middle East and North Africa are testing alternatives. EU skim milk powder has become increasingly price‑competitive in MENA markets, and commentary around a larger‑than‑expected ONIL milk powder tender in early 2024 highlighted EU suppliers covering most SMP volumes, even as New Zealand, Europe, and South America shared the WMP business. The pattern isn’t universal, but it’s a clear signal: when NZ gets more expensive or harder to ship, EU offers get a closer look.
Put those pieces together, and you get a two‑stage story:
- Short‑term: GDT prices are being pulled up by higher shipping friction and supply risk. That’s what supports NZ$9.70 today.
- Medium‑term: As Gulf and MENA buyers adjust their tendering and contract patterns, some volumes that historically defaulted to NZ may shift more permanently toward competing origins. That risk doesn’t show up in this season’s milk price. It shows up in next season’s starting point.
As Dilly told Rural News Group in December 2025, “nearly half of the current season’s production has already been contracted, so GDT results over the rest of the season will have a bigger impact on next year’s starting point than this year’s endpoint.”
That’s the transmission lag that matters here. Mark doesn’t feel it yet. His cheque says NZ$9.70. The tender rooms and freight lanes are determining what his 2026/27 milk price will look like — and they’re doing so long before Fonterra updates its range on the website.
Fonterra Hedged the Co‑op. It Didn’t Automatically Hedge the Farm.
One thing is clear: Fonterra’s board and management haven’t been blind to any of this.
In its HY26 commentary, the co‑op explicitly noted that rising geopolitical risk in the Middle East, especially around the Strait of Hormuz, could disrupt shipping routes, force rerouting, increase inventory levels, and add volatility to global commodity prices. It also warned that some exports could face delivery delays or require re-routing, potentially increasing inventory and costs.
New Zealand’s official trade data underscores how important these markets are. USDA’s 2025 semi‑annual report shows Algeria taking about 10% of New Zealand’s whole milk powder exports in 2024, with the United Arab Emirates taking roughly 6.6%. For butter and AMF, key destinations included Saudi Arabia at about 7% of volume, alongside China, Australia, and the U.S. Add in other Gulf states, and you’re talking about a meaningful slice of NZ’s WMP and butter trade tied to a region now sitting behind a higher‑risk shipping corridor.
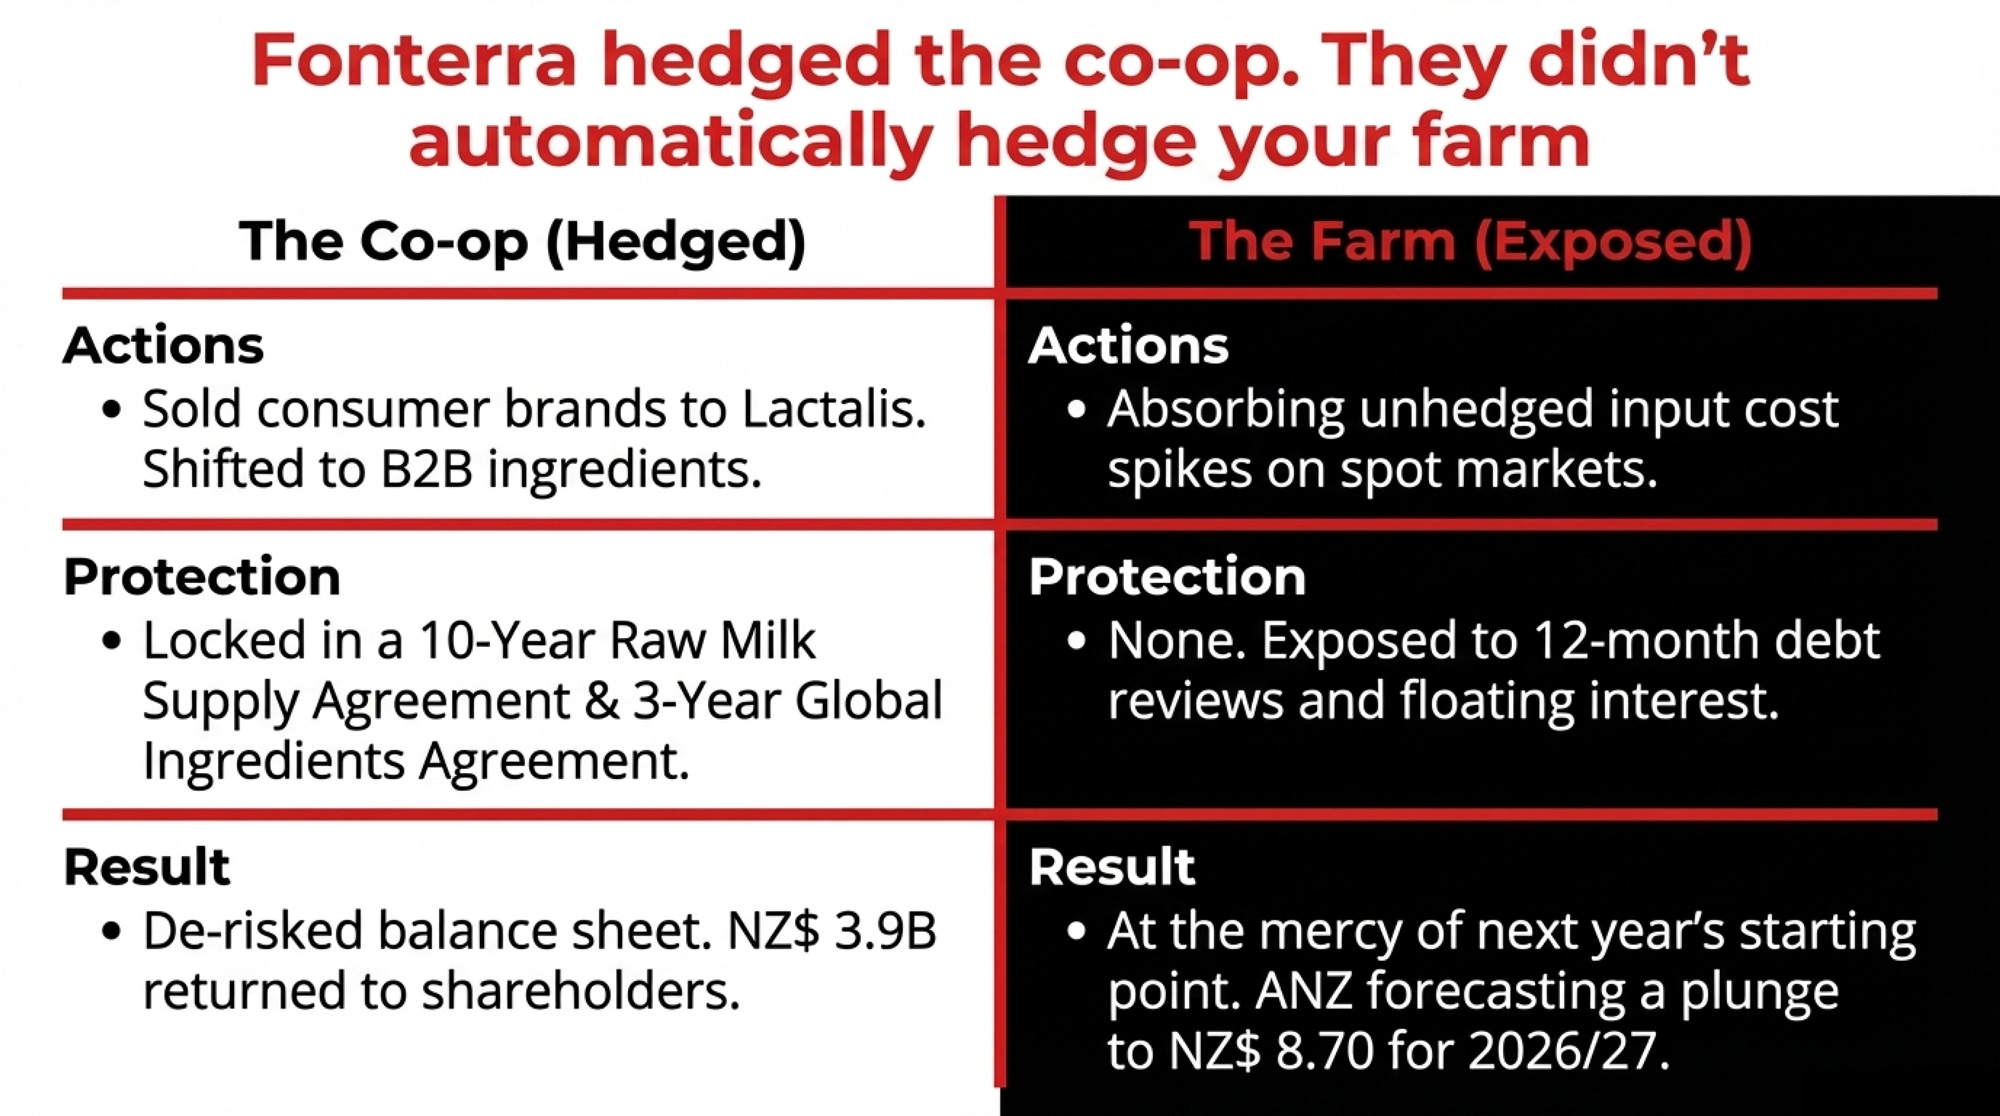
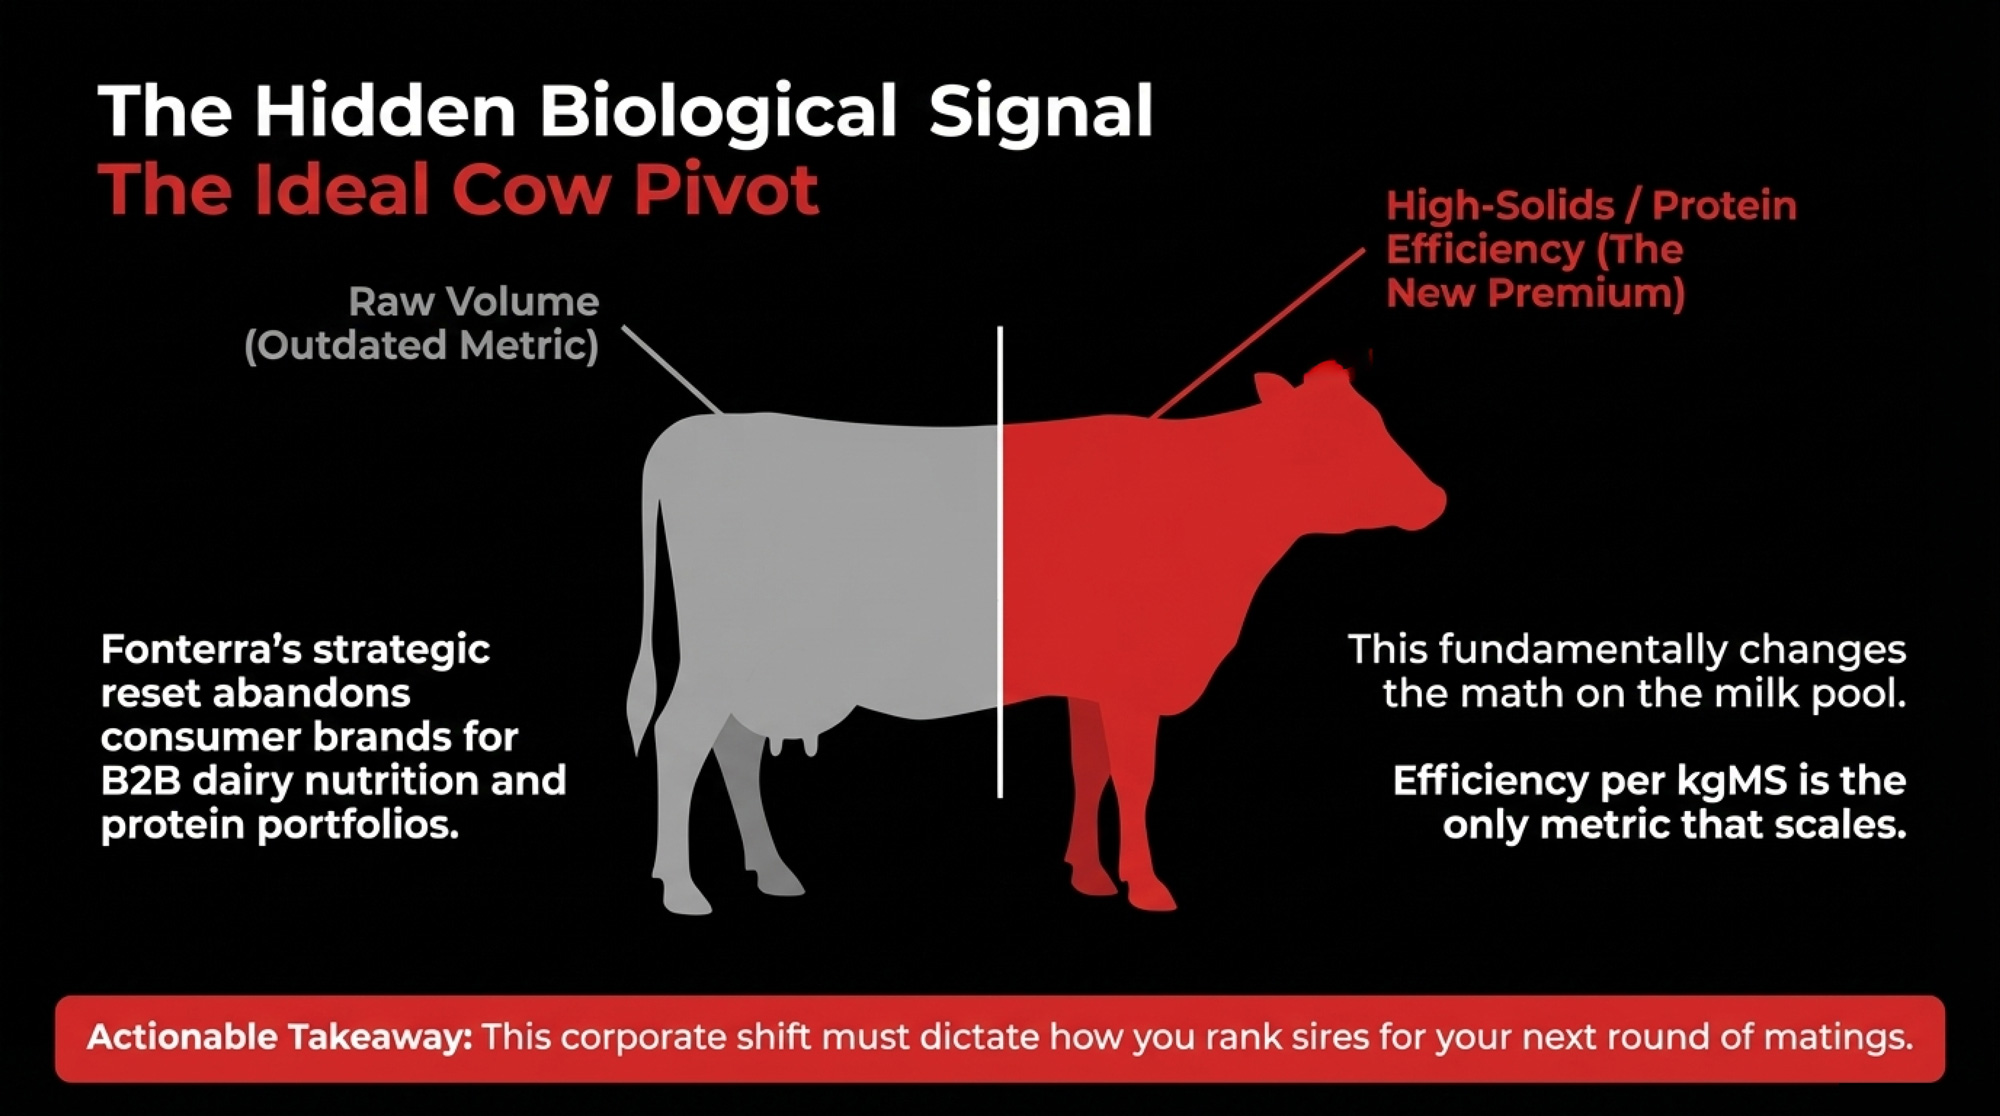
At the same time, Fonterra is in the middle of a major strategic pivot. The sale of its Mainland and other consumer brands to Lactalis is designed to turn the co‑op into a more focused B2B dairy nutrition processor, a shift Fonterra has described as “completing its strategic reset.” Regulatory approvals were progressing through early 2026, with completion expected to enable planned capital returns. The deal includes two key supply agreements that will keep the relationship between the co‑op and its former brands alive:
- A Raw Milk Supply Agreement with an initial term of ten years, automatically renewing unless either party terminates with 36 months’ notice.
- A Global Ingredients Supply Agreement with an initial term of three years, also auto‑renewing with 36 months’ notice to terminate.
From Fonterra’s vantage point, the logic is coherent. The co‑op:
- De‑risks its own balance sheet by exiting volatile consumer brands.
- Simplifies its business model to focus on B2B ingredients and dairy nutrition.
- Locks in demand for its milk pool through the RMSA and GSA.
- Delivers a significant cash distribution to farmer‑shareholders — external coverage pegs total cash returns around NZ$3.9 billion once dividends and capital returns are combined.
- Reports a return on capital for continuing operations that sits within its 10–12% target band.
If you think in terms of genetics rather than just cheques, this pivot matters. Fonterra’s growth talk now leans heavily into “higher‑value ingredients and nutrition solutions,” with strong earnings contributions from its protein portfolio and Foodservice channels. That naturally pushes the ideal New Zealand cow further toward high solids and efficiency per kgMS, not just raw volume — which is how many genetics‑focused suppliers are reading the signal as they rank sires for the Fonterra milk pool.
From Mark’s vantage point, it looks different.
The short‑term upside — NZ$9.70, dividends, capital return — is very real. It hits his bank account this season. The medium‑term downside — structural Gulf diversification, GDT prices normalising once the war premium fades, and sticky higher fertiliser costs — will land primarily on individual farm P&Ls.
Fonterra’s strategic moves have effectively hedged the co‑op’s position. They haven’t automatically hedged individual farms. The RMSA keeps NZ plants running. The three‑year GSA keeps ingredients flowing. Neither one changes Mark’s breakeven per kgMS, his debt‑to‑asset ratio, or how his lender reads the risk.
The co‑op has used a strong earnings run and a timely asset sale to lock in its own risk position and reward shareholders. The question is whether farms like Mark’s use this same window to de‑risk themselves — or to lean harder into a milk price whose supporting conditions may not hold into 2026/27.
What to Do Before Your Next Bank Review
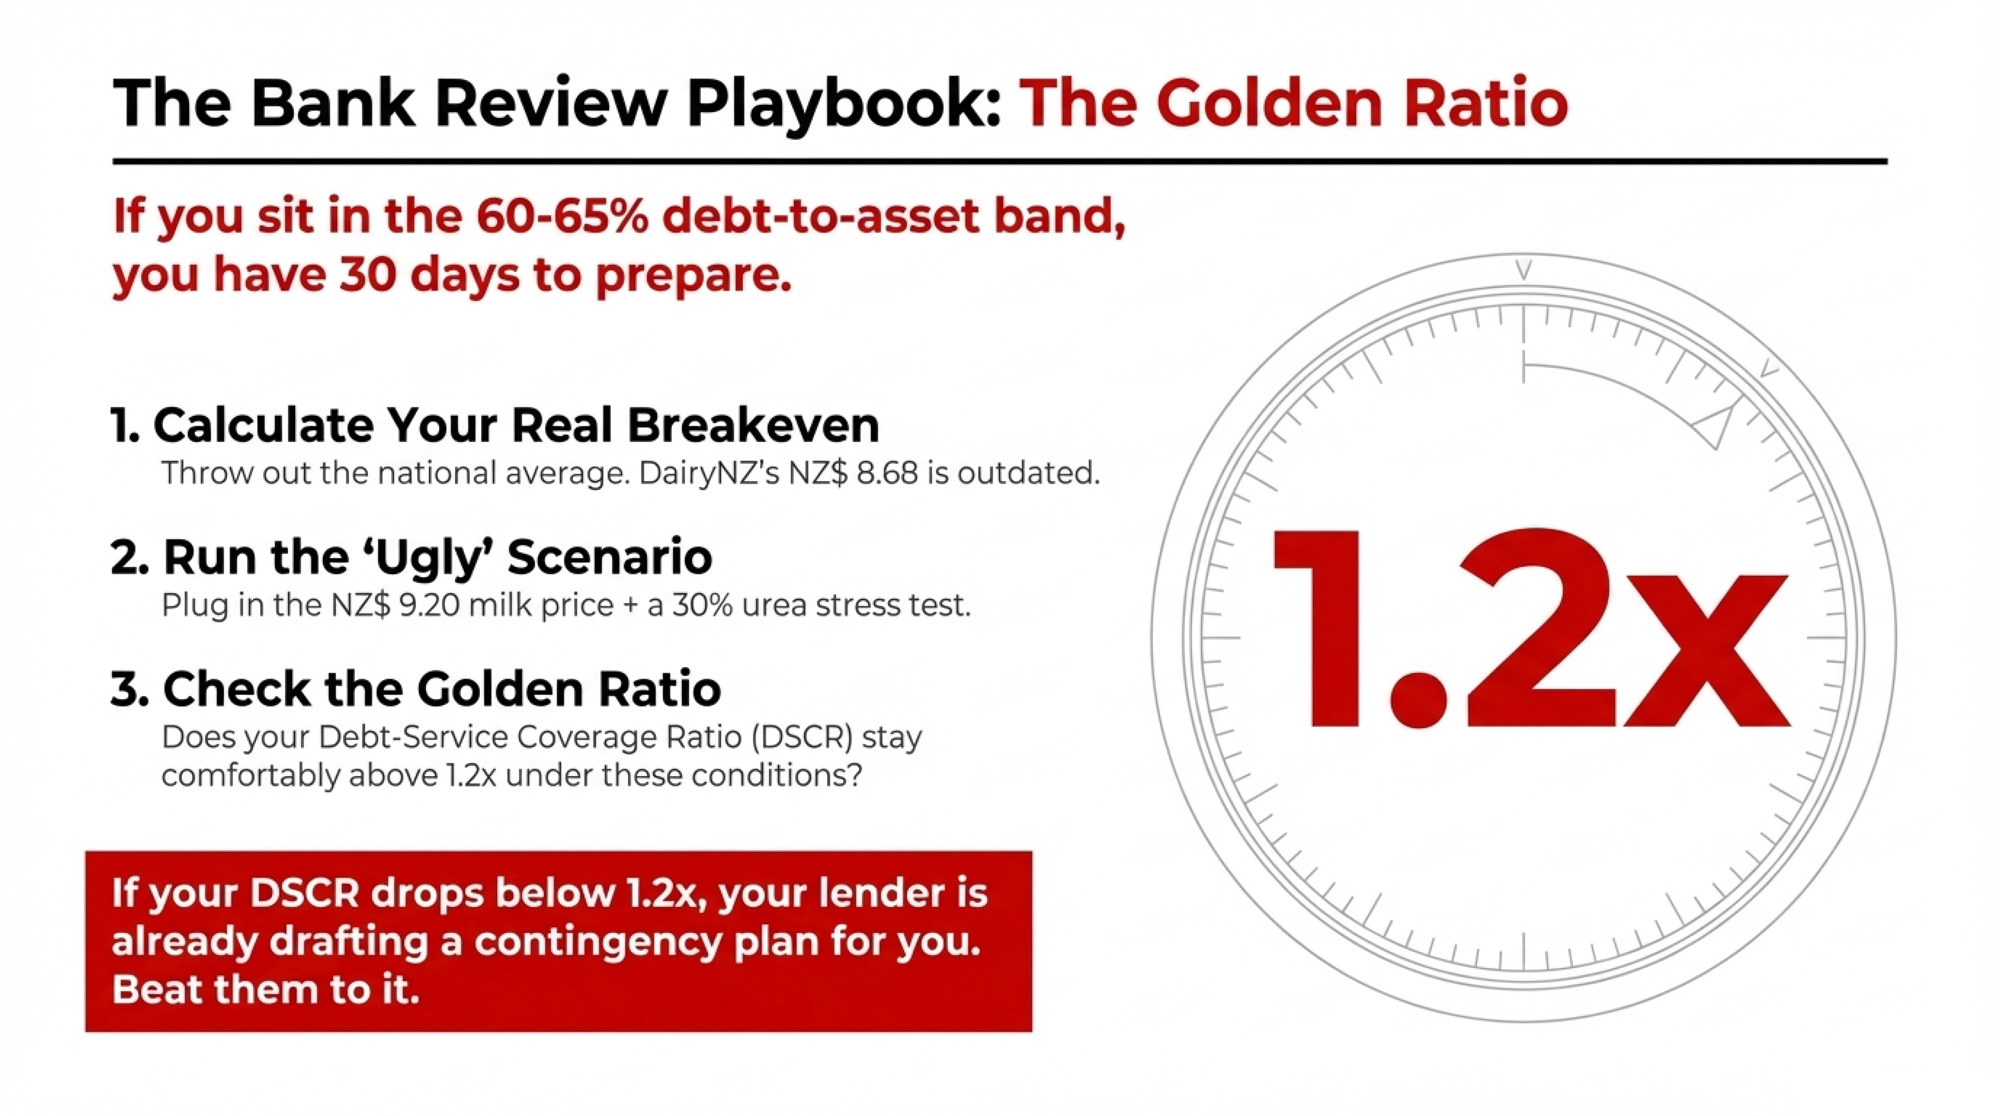
If you’re sitting somewhere around 60–65% debt‑to‑asset like Mark, you’re not unique. You’re also in the band, many lenders quietly file under “we’ll work with you, but we’re watching.”
The single most important move in the next 30 days isn’t a new tractor, more cows, or a tidy new shed. It’s what you do with this season’s Fonterra cash before your relationship manager walks through the door.
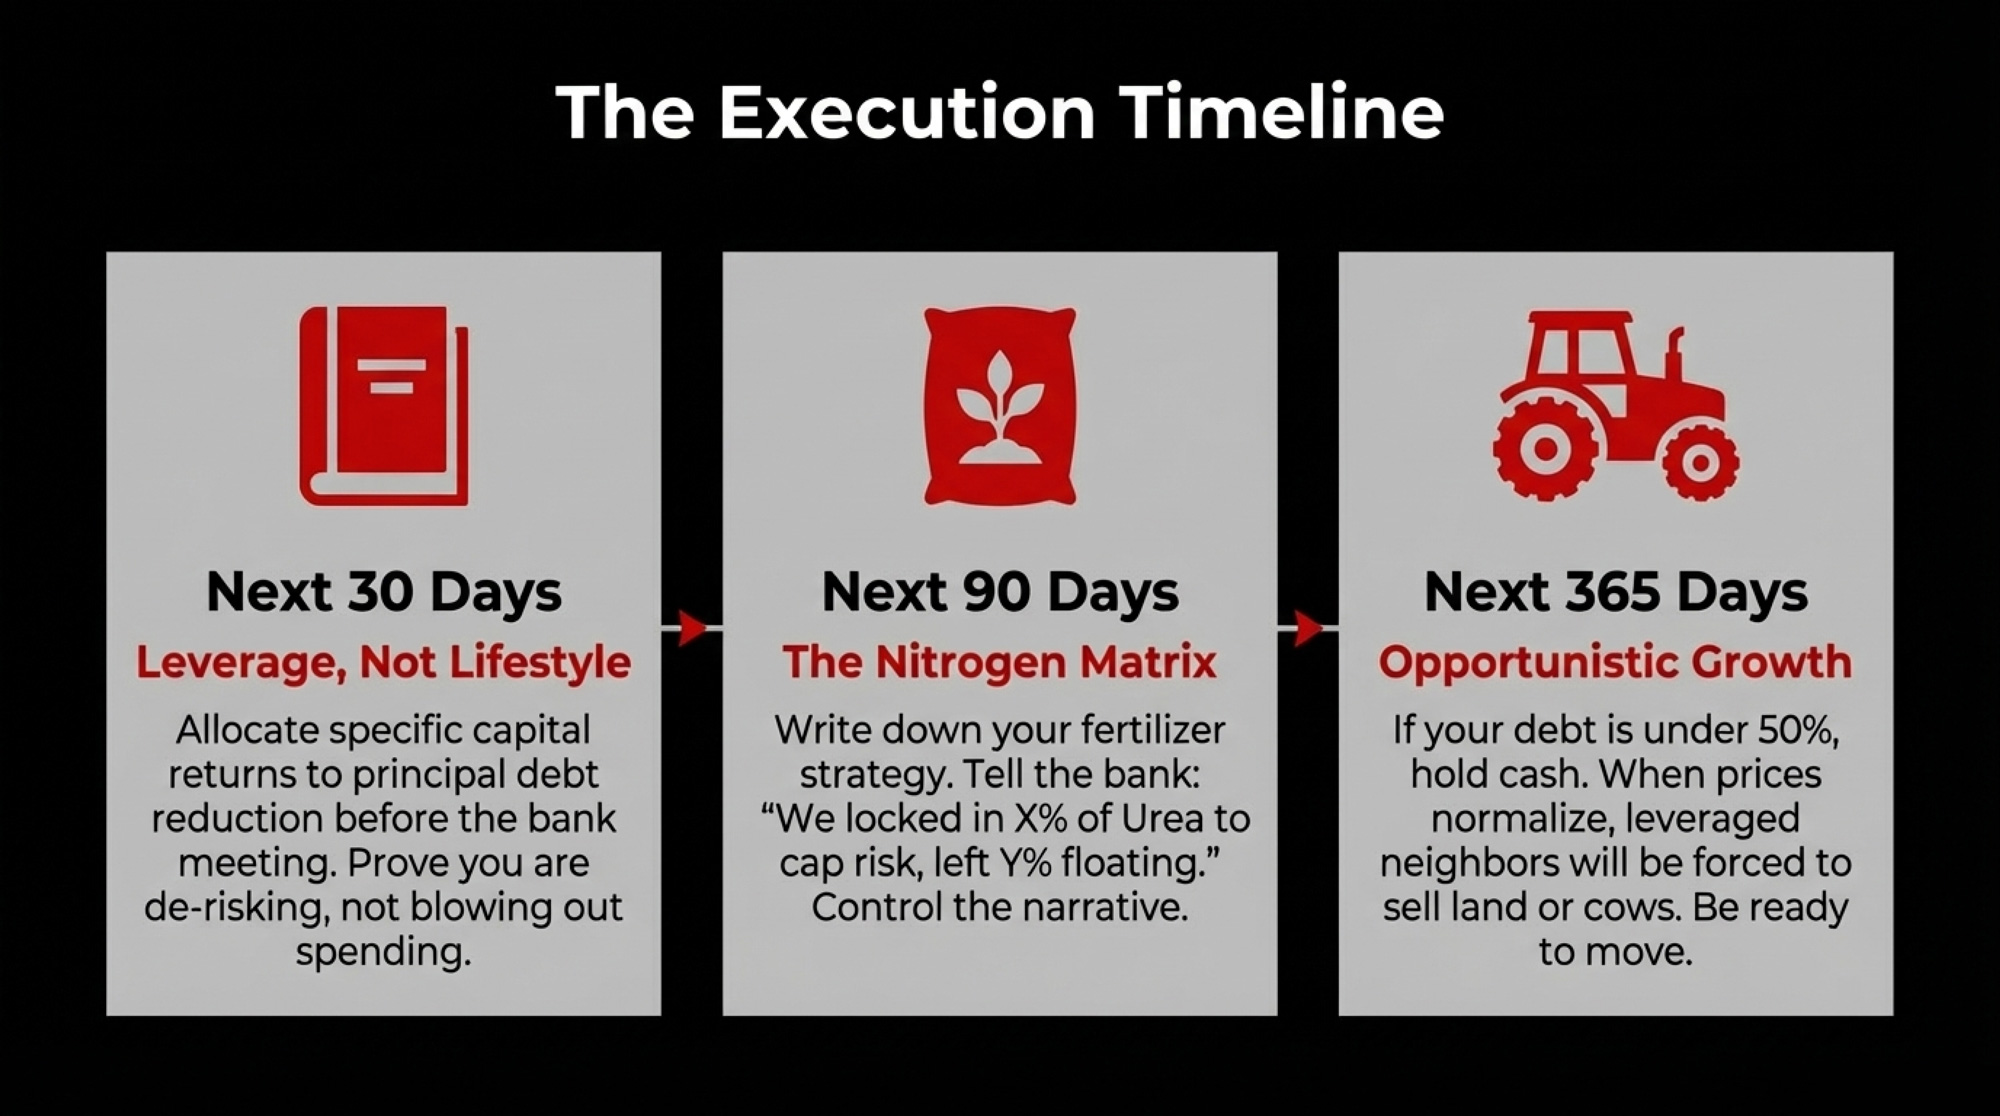
1. Use the payout to move your leverage, not your lifestyle. (Next 30 days)
Decide now what slice of the capital return, dividends, and early NZ$9.70 cash flow you’re going to use to pay down principal on term debt. Then actually do it before the bank review.
On most farms, that won’t magically transform your debt‑to‑asset ratio. But even a visible, documented principal reduction can change how your banker frames you. The story becomes: “We know this payout may be temporary. We used it to de‑risk, not to blow out spending.”
That’s a different conversation than “We’re taking the cash and hoping the good times last.”
2. Stress‑test at NZ$9.20 and current‑plus‑30% urea. (Next 30 days)
Grab three numbers from your own books:
- Your actual breakeven per kgMS, not the NZ$8.68 national average.
- Your real fertiliser spend at today’s prices and tonnages.
- Your current term debt and interest schedule.
Then run the ugly scenario:
- Assume a Farmgate Milk Price of NZ$9.20/kgMS instead of NZ$9.70. That’s not doom‑and‑gloom — it’s the lower half of Fonterra’s published range, and still above ANZ’s NZ$8.70 opening forecast for 2026/27.
- Add roughly 30% to your urea line on top of the March Ballance increase, using your own tonnes.
Now ask:
- Does your debt‑service coverage ratio stay comfortably above about 1.2x? Many lenders start to get uneasy as you drop into that territory.
- Do you still have surplus left for drawings and basic reinvestment after servicing the bank?
If the answer is no to either, it’s better to discover that from your own spreadsheet than from a bank credit memo.
3. Decide your fertiliser strategy for 2026/27 and write it down. (Next 90 days)
You can’t get last year’s nitrogen prices back. The decision now is whether to:
- Lock in some of next season’s urea at today’s elevated levels to cap your worst‑case risk, or
- Wait and hope that conflict risk and export restrictions ease, bringing prices back down.
There’s no universal right answer. But there’s a big difference between walking into a bank meeting saying “we’ll see what happens” and walking in with a one‑page note that says:
- “We’ve locked in X% of our expected urea needs at today’s price to cap risk.”
- “We’ve left Y% open in case markets soften.”
That tells the lender you’re managing risk, not being managed by it.
4. Treat this payout as a window, not a trend. (Next 365 days)
Make yourself a habit: once a year, before major spending decisions, run a “NZ$9.20 plus fertiliser stress test” on your numbers.
Use your own breakeven, not DairyNZ’s average. Plug in a milk price somewhere in the lower half of Fonterra’s realistic range. Add in the fertiliser costs you’re actually seeing, plus a stress margin if you’re on spot.
If your business only works at NZ$9.70 with last year’s costs, that’s not a stable business. It’s a good year.
Over the next 12–18 months, the farms that use this payout window to get structurally safer will look very different from those that use it to lean harder into a price supported by conflict and shipping friction.
What This Means for Your Operation
| Debt-to-Asset | Risk Level | Priority Action | Stress-Test Signal to Watch |
|---|---|---|---|
| >65% | 🔴 High | Pay down term principal NOW — before spending review | DSCR drops below 1.2x at NZ$9.20 |
| 60–65% | 🔴 High | Allocate capital return to leverage reduction, not capex | Breakeven creep above NZ$8.68 national avg |
| 50–60% | 🟡 Moderate | Lock in portion of urea; document fert strategy for bank | Any urea +30% scenario that erodes DSCR |
| <50% | 🟢 Low | Position opportunistically — watch for distressed land/shares | Monitor 2026/27 opening price vs ANZ $8.70 |
- If your debt‑to‑asset ratio is north of 60–65%, use this season’s Fonterra cash to move that number, not your machinery lineup. Even a small, documented shift in leverage gives you more breathing room if the 2026/27 milk price opens closer to ANZ’s NZ$8.70 forecast than NZ$9.70.
- If your breakeven per kgMS is already above DairyNZ’s NZ$8.68 benchmark, you’re operating with less cushion than the national average. Run your own numbers at NZ$9.20 with today’s fertiliser costs. That gap, not the current midpoint, tells you how fragile things really are.
- If your stress‑case debt‑service coverage ratio drops much below about 1.2x, treat that as an urgent signal. That’s the zone where many lenders start tightening terms or asking for a plan, especially if they see structural risk building in your market.
- If you’re under 50% debt‑to‑asset and have some fertiliser already forward‑contracted, you’re in a position to be opportunistic. This payout can be used to quietly build capacity so you can move when land, shares, or cows come loose from more leveraged neighbours over the next couple of years.
- In the next 30 days, before your bank review, do one thing: put your actual breakeven per kgMS and your fertiliser‑adjusted budget next to a NZ$9.20 milk price on a single sheet of paper. That’s the forecast the bank will stress‑test you against, whether they say it aloud or not.
Key Takeaways
- Fonterra’s NZ$9.70 midpoint and NZ$2.00 capital return are real wins — but they’re partly supported by a war premium and freight friction that may not be there when the 2026/27 milk price is set. ANZ’s opening forecast for next season is already NZ$8.70/kgMS.
- DairyNZ’s NZ$8.68 breakeven for 2025/26 was published before Ballance’s March 18 hike. For many farms, the “NZ$1.02/kgMS margin” story is thinner than it looks once current fertiliser costs and potential further nitrogen stress are properly baked in.
- The Lactalis deal gives Fonterra long‑term supply security — a 10‑year RMSA and a 3‑year GSA, both auto‑renewing with 36‑month notice. That hedges the co‑op’s risk. It does not hedge your farm’s breakeven or leverage.
- For genetics‑minded herds, a B2B ingredients focus pushes the “ideal cow” even harder toward high‑solids efficiency over sheer volume. That should show up in how you rank sires and build your next round of matings in the NZ context.
- The farms most exposed to a downside scenario are those in the 60–65% debt band that treat this payout as a permanent raise rather than a one‑off window to fix the balance sheet.
The Bottom Line
The real question isn’t whether NZ$9.70 will hold this season. It’s this: what does your breakeven per kgMS look like if you plug in NZ$9.20 and your latest fertiliser invoice — and how far is that from the story your milk cheque is telling you right now?
Complete references and supporting documentation are available upon request by contacting the editorial team at editor@thebullvine.com.
Learn More
- The Hidden Contract Clause That Could Cost Your Dairy $55,000 in 2026 – This 30-day action plan arms you with the negotiation leverage needed to dodge massive liability shifts in new contracts. It exposes hidden allergen compliance costs and delivers immediate methods to protect your net profit from processor-driven fee hikes.
- The One-Dollar Margin: A Global Wake-Up Call from New Zealand’s Dairy Squeeze – This strategic deep dive reveals why the world’s lowest-cost producers are hitting a structural reset. It breaks down global margin gaps and positions your operation to navigate the 2026/27 price floor before the “war premium” evaporates.
- 9.57 Million Cows, 3.9 Million Replacements: Genetics Built This Dairy Herd Paradox – and 2027 Ends It – This disruptive analysis exposes the “biological trap” of beef-on-dairy and delivers a competitive advantage for 2027. It reveals why the heifer shortage changes everything and how to model your future pipeline to capture looming processor demand.
 The Sunday Read Dairy Professionals Don’t Skip.
 The Sunday Read Dairy Professionals Don’t Skip.
Every week, thousands of producers, breeders, and industry insiders open Bullvine Weekly for genetics insights, market shifts, and profit strategies they won’t find anywhere else. One email. Five minutes. Smarter decisions all week.


