


European butter crashed 35%. History shows your milk check is due in 90 days. The farmers protecting six figures right now aren’t smarter. They’re just 90 days earlier.
Executive Summary: European butter crashed 35%—your milk check follows in 60-90 days. With Class III at $17-18/cwt, production growth running three times normal pace, and spring flush weeks away, the proactive window is narrowing. The wealth gap between acting at 1.3 DSCR versus waiting until 1.0 typically exceeds $150,000—not because one group is smarter, but because they moved earlier. This framework covers the metric your lender is watching, component strategies adding $800-1,200/month, and beef-on-dairy premiums hitting $350-700/head. The playbook mirrors 2015-16: three conversations before pressure hits—accountant, nutritionist, lender.
You know, German retail butter dropped to €0.77 per pack in late December 2025. That’s down from nearly €2.00 just a few months earlier—a correction that barely registered in most North American dairy publications. But here’s what caught my attention: for farmers who’ve learned to read global dairy signals, that price move wasn’t just European grocery news. It might be a 60-90 day advance signal for what’s heading toward our milk checks.
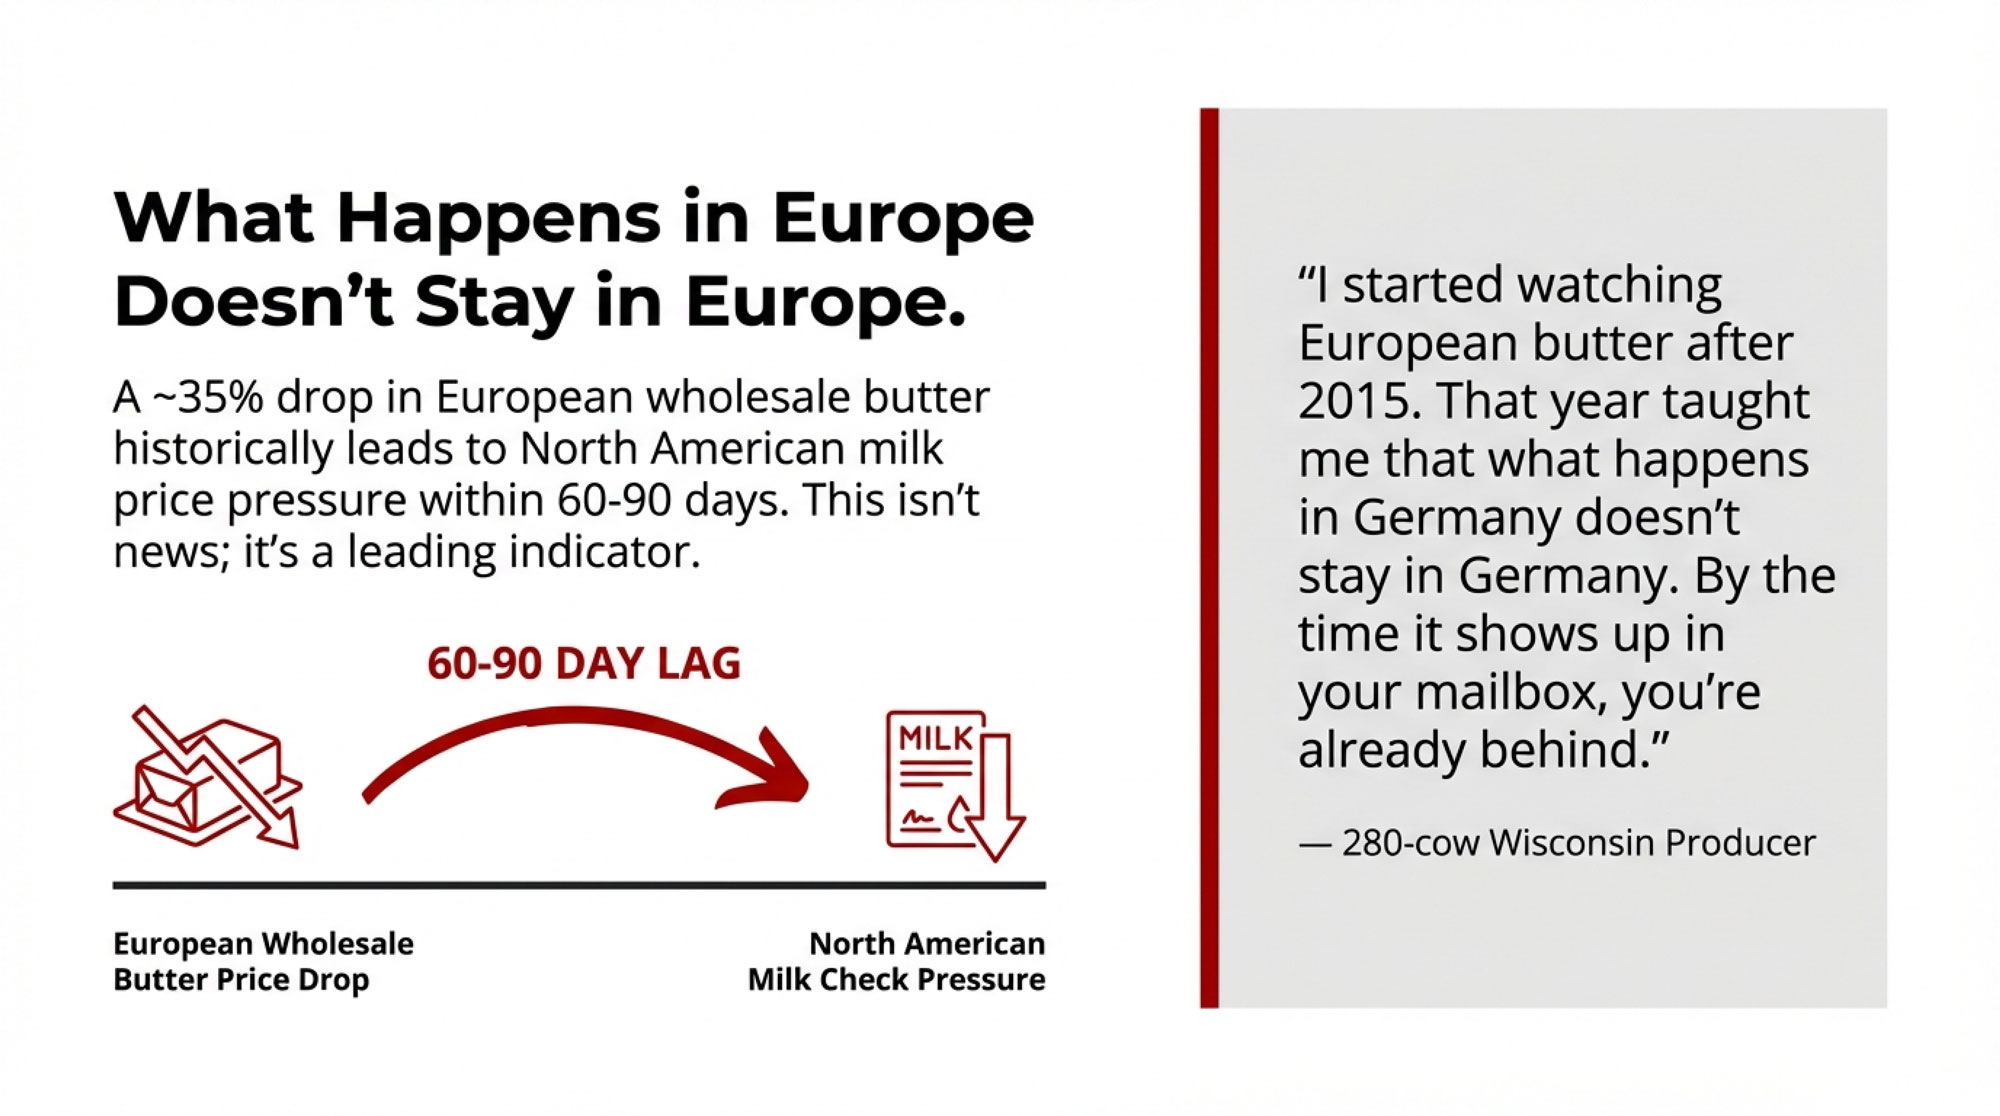
I spoke with a Wisconsin producer running about 280 cows near Fond du Lac recently. He put it simply: “I started watching European butter after 2015. That year taught me that what happens in Germany doesn’t stay in Germany. By the time it shows up in your mailbox, you’re already behind.”
And he’s not wrong. Understanding these global connections—and knowing when they might warrant action—is becoming increasingly valuable for dairy operations navigating interconnected markets. So let me walk you through what farmers across North America are learning about price signals, financial positioning, and the strategic decisions that can make the difference between weathering market pressure and getting caught flat-footed.
AT A GLANCE: Key Insights
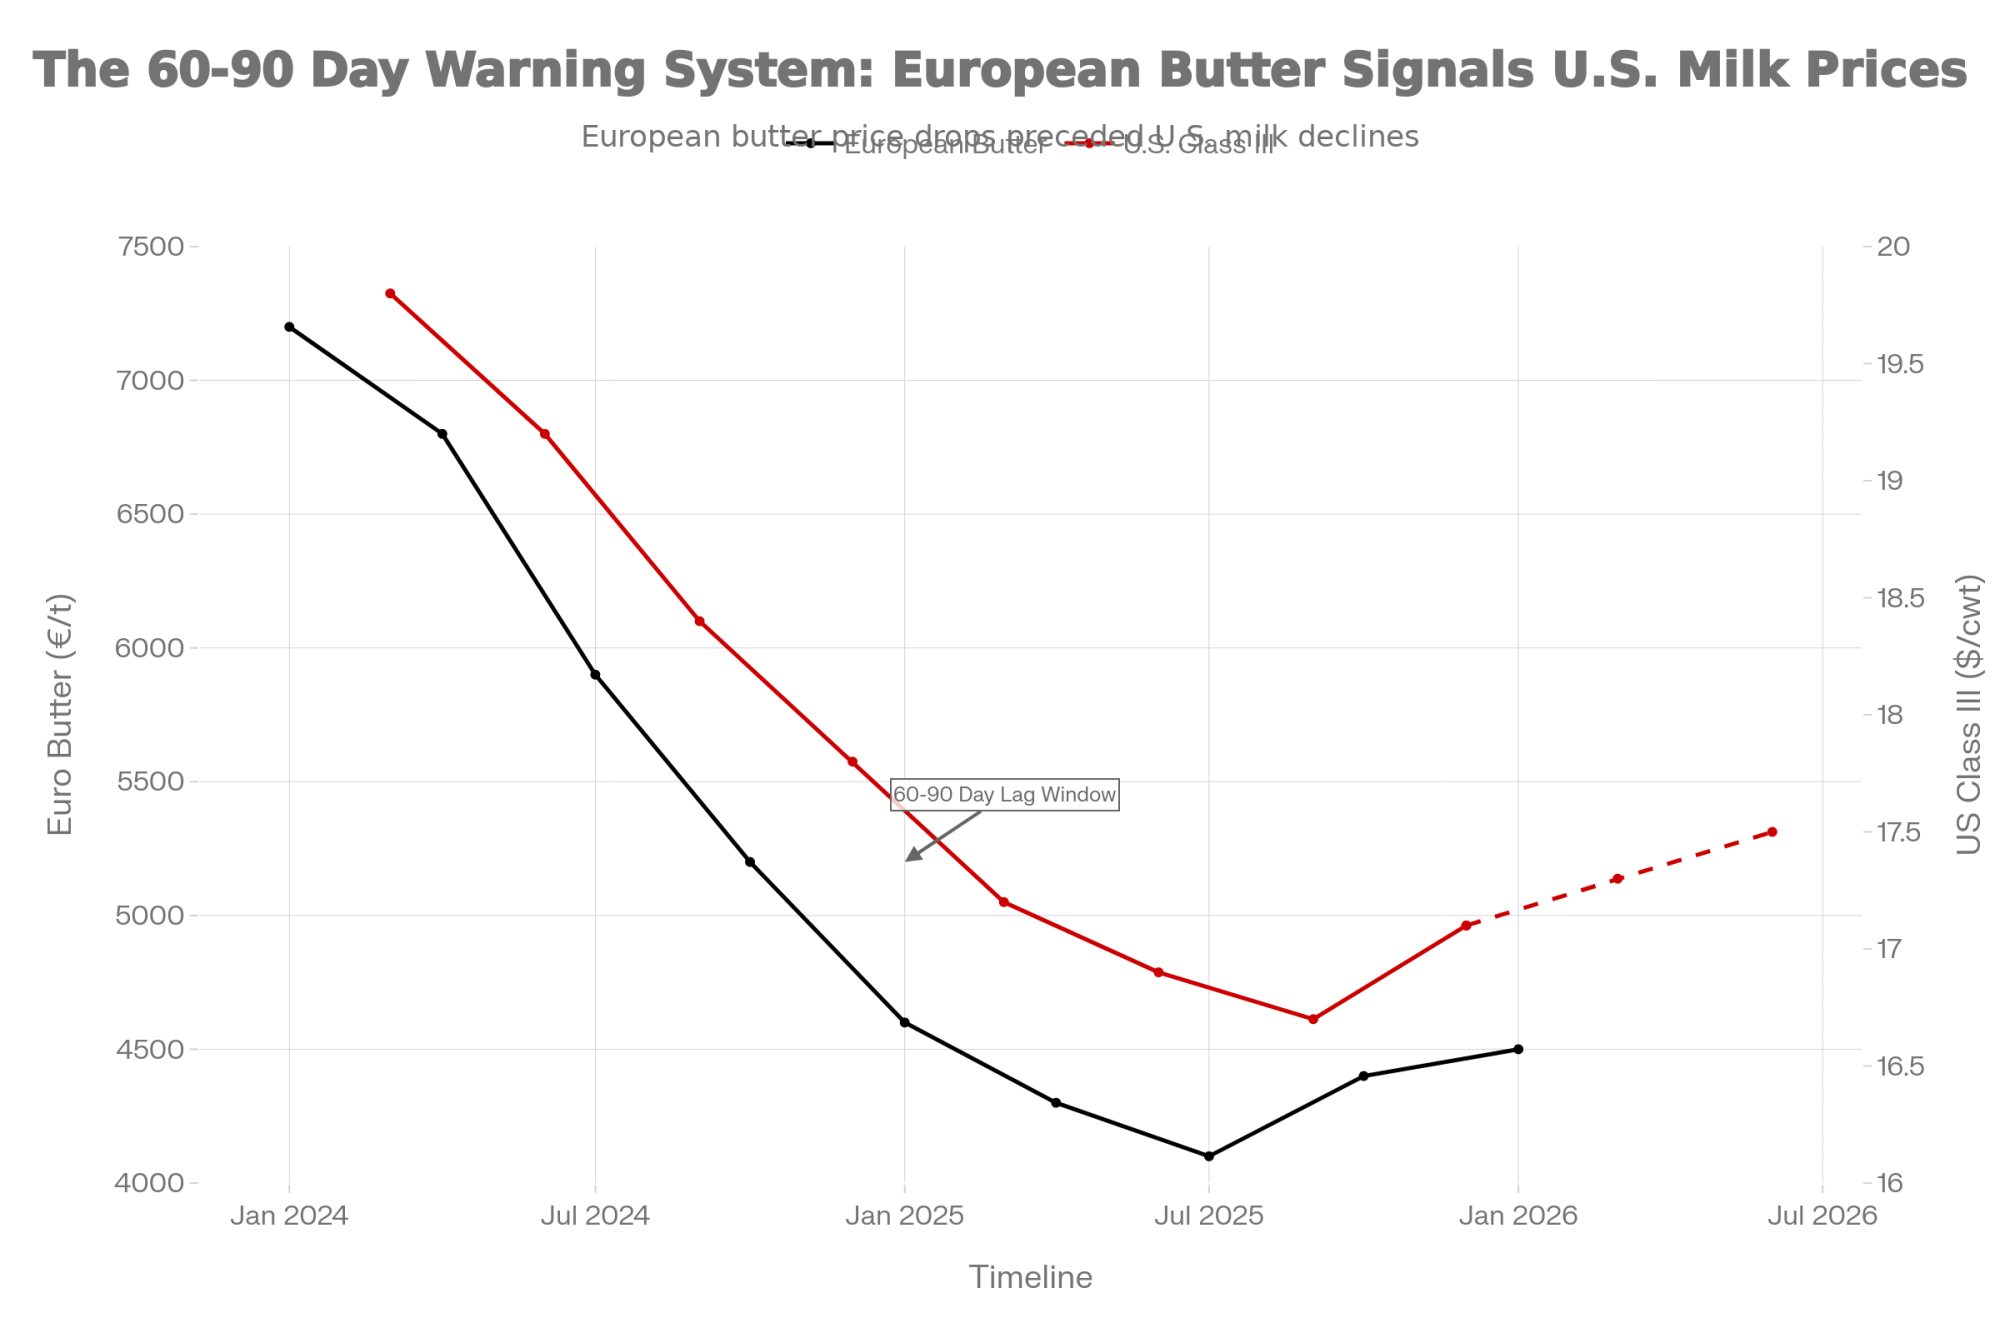
- The Signal: European wholesale butter down ~35% year-over-year; historically correlates to North American price pressure within 60-90 days
- The Metric That Matters: Know your Debt Service Coverage Ratio—acting at 1.3x versus waiting until 1.0x can mean a six-figure difference in preserved wealth
- Near-Term Strategies: Feed-based butterfat improvements can add $800-1,200/month within 60-90 days; beef-on-dairy premiums running $350-700/head
- The Framework: Proactive positioning beats reactive response—farmers who move early consistently outperform those who wait
- The Bottom Line: Markets may surprise either direction, but stress-testing your operation at $15-16/cwt scenarios is sound management
How European Butter Prices Connect to Your Milk Check
The relationship between European dairy commodities and North American milk prices follows a transmission path that agricultural economists have tracked for over a decade now. It typically unfolds across 60-90 days, which—when the signals are reliable—gives observant farmers a meaningful window to prepare.
Dr. Mark Stephenson, who served as Director of Dairy Policy Analysis at the University of Wisconsin-Madison before his recent retirement, studied this lag extensively throughout his career. His research shows that when European wholesale butter drops significantly, the effects tend to ripple through Global Dairy Trade auctions in New Zealand within 2-3 auction cycles, then influence contract negotiations across Oceania before reaching North American processor discussions.
What’s happening right now appears to fit that pattern. European wholesale butter fell from over €7,200 per tonne in early 2024 to the €4,000-5,000 range by late 2025, according to AHDB’s EU wholesale tracking—that’s roughly a 35% year-over-year decline. Class III futures for Q1-Q2 2026 are currently trading in the $17.00-18.00/cwt range on CME, which is actually better than some analysts projected a few months back, but still tight for operations with higher cost structures.
Industry estimates suggest that breakeven for mid-size Wisconsin dairies typically runs $18-19/cwt when all costs, including family living and debt service, are accounted for. Operations in California’s Central Valley often see higher numbers due to feed costs and regulatory compliance, while Northeast operations face their own regional dynamics. Western operations dealing with water constraints and Southeast dairies facing heat stress economics have their own cost pressures layered on top. Canadian producers navigate a different reality entirely—quota values and supply management provide price stability but bring their own capital and cash flow considerations. The specific math varies by region and management, but the directional pressure applies when Class III hovers near or below regional breakevens.
| Region | Typical All-In Breakeven ($/cwt) | Primary Cost Drivers | Current Margin @ $17.50 Class III | Projected Margin @ $15.50 Scenario | Risk Level Q2 2026 |
| Wisconsin | $18.00 – $19.00 | Feed, labor, debt service | -$0.50 to -$1.50 | -$2.50 to -$3.50 | Moderate-High |
| California Central Valley | $20.00 – $22.00 | Feed costs, water, regulatory compliance | -$2.50 to -$4.50 | -$4.50 to -$6.50 | High |
| Northeast (NY, PA, VT) | $19.00 – $21.00 | Labor, fuel, regional feed premiums | -$1.50 to -$3.50 | -$3.50 to -$5.50 | Moderate-High |
| Texas/New Mexico | $17.50 – $19.50 | Water constraints, heat stress mitigation, feed | $0.00 to -$2.00 | -$2.00 to -$4.00 | Moderate |
| Southeast (GA, FL) | $19.50 – $21.50 | Heat stress, humidity management, feed transport | -$2.00 to -$4.00 | -$4.00 to -$6.00 | High |
| Canada (Quota Systems) | Quota value amortized varies | Quota costs, supply management compliance | Price stability via quota system | Price stability via quota system | Low (different market structure) |
Now, I want to be clear about something. Markets can and do surprise us. Futures have been wrong before—2022 comes to mind, when projections sat around $18, and actual prices hit $23 on unexpectedly strong export demand. Some analysts I’ve spoken with remain cautiously optimistic that domestic demand strength could offset some of the pressure we’re discussing. But what’s different about the current setup is the structural inventory situation, which has its own timeline regardless of demand fluctuations.
The Financial Metric Your Lender Is Already Watching
If there’s one number that shapes the conversation you’ll have with your bank—whether it’s a proactive discussion or a reactive one—it’s your Debt Service Coverage Ratio. DSCR tells you whether your operation generates enough cash to cover debt obligations with breathing room… or whether you’re running closer to the edge than you might realize.
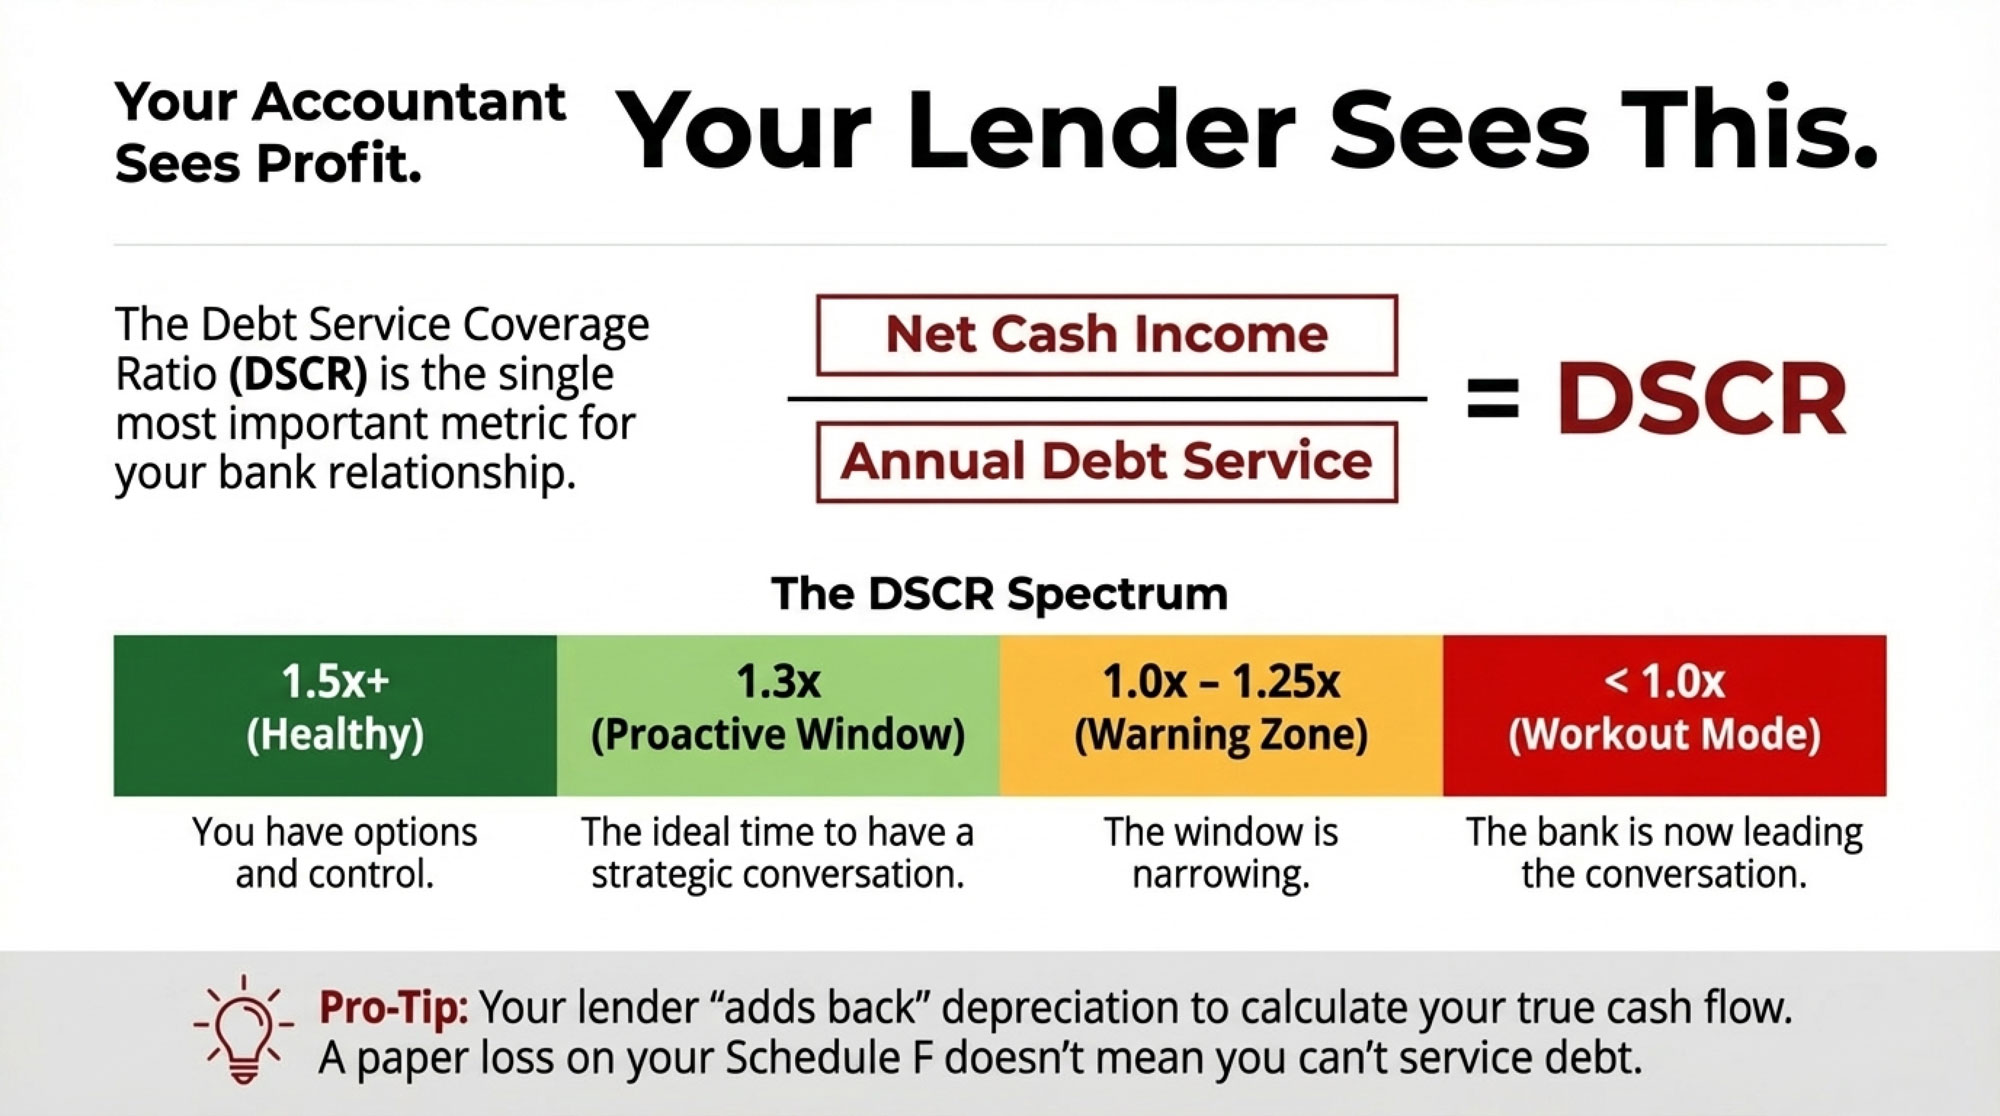
Farm Credit Canada’s educational materials lay out the basics pretty clearly. A DSCR of 1.5 is generally considered healthy—it means you’ve got 1.5 times more cash available than your debt obligations require. Drop below 1.0, and you’re looking at difficulty servicing debt without off-farm income or other support. Most agricultural lenders use similar thresholds, though the specific trigger points for increased monitoring or restructuring conversations vary by institution.
| DSCR Ratio | Financial Position | Who Controls the Conversation | Restructuring Options Available | Typical Cost of Restructuring |
| 1.5x or higher | Healthy, strong cushion | You lead; bank follows | Full menu: extend terms, consolidate, refinance at competitive rates | Standard processing fees (~$500-1,500) |
| 1.25x – 1.49x | Adequate but tightening | Partnership discussion | Most options available; minor rate premiums possible | Standard to slight premium (~$1,000-3,000) |
| 1.0x – 1.24x | Operating in yellow zone | Shared control; bank monitoring increases | Limited options; rate premiums likely | Moderate premium (~$3,000-8,000 + 50-100 bps higher interest) |
| 0.85x – 0.99x | Distressed territory | Bank controls terms | Restricted; workout scenarios | $8,000-15,000 + 100-150 bps higher interest |
| Below 0.85x | Crisis mode | Bank workout team drives | Forced asset sales likely | $15,000+ legal/processing + distressed sale losses |
Here’s what farmers are discovering—sometimes later than they’d prefer—the difference between acting at 1.3x DSCR and waiting until you hit 1.0x isn’t just about the numbers themselves. It’s about who’s leading the conversation and who’s following.

I spoke with a senior agricultural lender at a Midwest Farm Credit association who asked to remain anonymous but offered this perspective: “When a producer comes to us at 1.3 with a plan, we’re partners working on optimization. When they come at 0.95 because their operating line is maxed, we’re in workout mode. Same bank, same farmer, completely different dynamic.”
Why does this matter so much? Industry data on distressed agricultural loans shows some significant cost differences. Farms entering workout typically pay 100-150 basis points higher on restructured debt and face substantially higher legal and processing fees. Proactive restructuring—the kind you initiate while your ratios still look reasonable—generally costs a fraction of what a reactive workout costs. And perhaps more importantly, you’re often selling assets into stable markets rather than whatever conditions happen to exist when you’re forced to act.
Agricultural lenders like AgAmerica have documented case studies showing the financial benefits of proactive restructuring. In their published examples, operations that restructured early reported significant annual savings through debt consolidation and strategic use of bridge financing during capital-intensive phases. These options existed because producers initiated conversations while their ratios still demonstrated operational viability.
Here’s a calculation worth doing this week:
Pull your most recent income statement and loan documents. You need three numbers:
- Net cash income (gross revenue minus operating expenses—but don’t subtract interest, depreciation, or principal payments)
- Annual debt service (all monthly loan payments × 12)
- Divide the first by the second
Pro-tip: Remember that while your tax preparer uses depreciation to lower your tax bill, your lender “adds it back” to your net income to determine your actual cash flow capacity. Don’t let a “paper loss” scare you away from a proactive lender meeting. That $80,000 depreciation expense on your Schedule F doesn’t mean you’re $80,000 poorer in cash—it’s an accounting entry, not money leaving your checking account. Lenders understand this, and you should too when evaluating your real financial position.
If you’re above 1.3, you likely have options and time to be strategic. Between 1.0 and 1.25, the window for proactive decisions may be narrowing. Below 1.0, that conversation with your lender probably needs to happen soon—and having a professional guide you in is worth considering.
RED FLAGS: Signs You May Already Be Past Proactive Positioning
- Operating line balance is climbing more than $5,000/month for three consecutive months
- Deferred maintenance backlog growing—you’re skipping repairs you’d normally make
- Breeding decisions driven by cash flow rather than genetic strategy
- Accounts payable stretching beyond normal terms with key suppliers
- Finding yourself calculating “which bills can wait” rather than “which investments make sense.”
If three or more of these apply, the proactive window may be closing. That doesn’t mean it’s too late—but it does mean the conversation with your lender needs to happen this month, not next quarter.
What’s Building Toward Q2 2026
Several market forces appear to be converging, potentially creating price pressure this spring. I want to be thoughtful here—market projections are exactly that, projections—but the structural setup is worth understanding so you can make your own assessment.
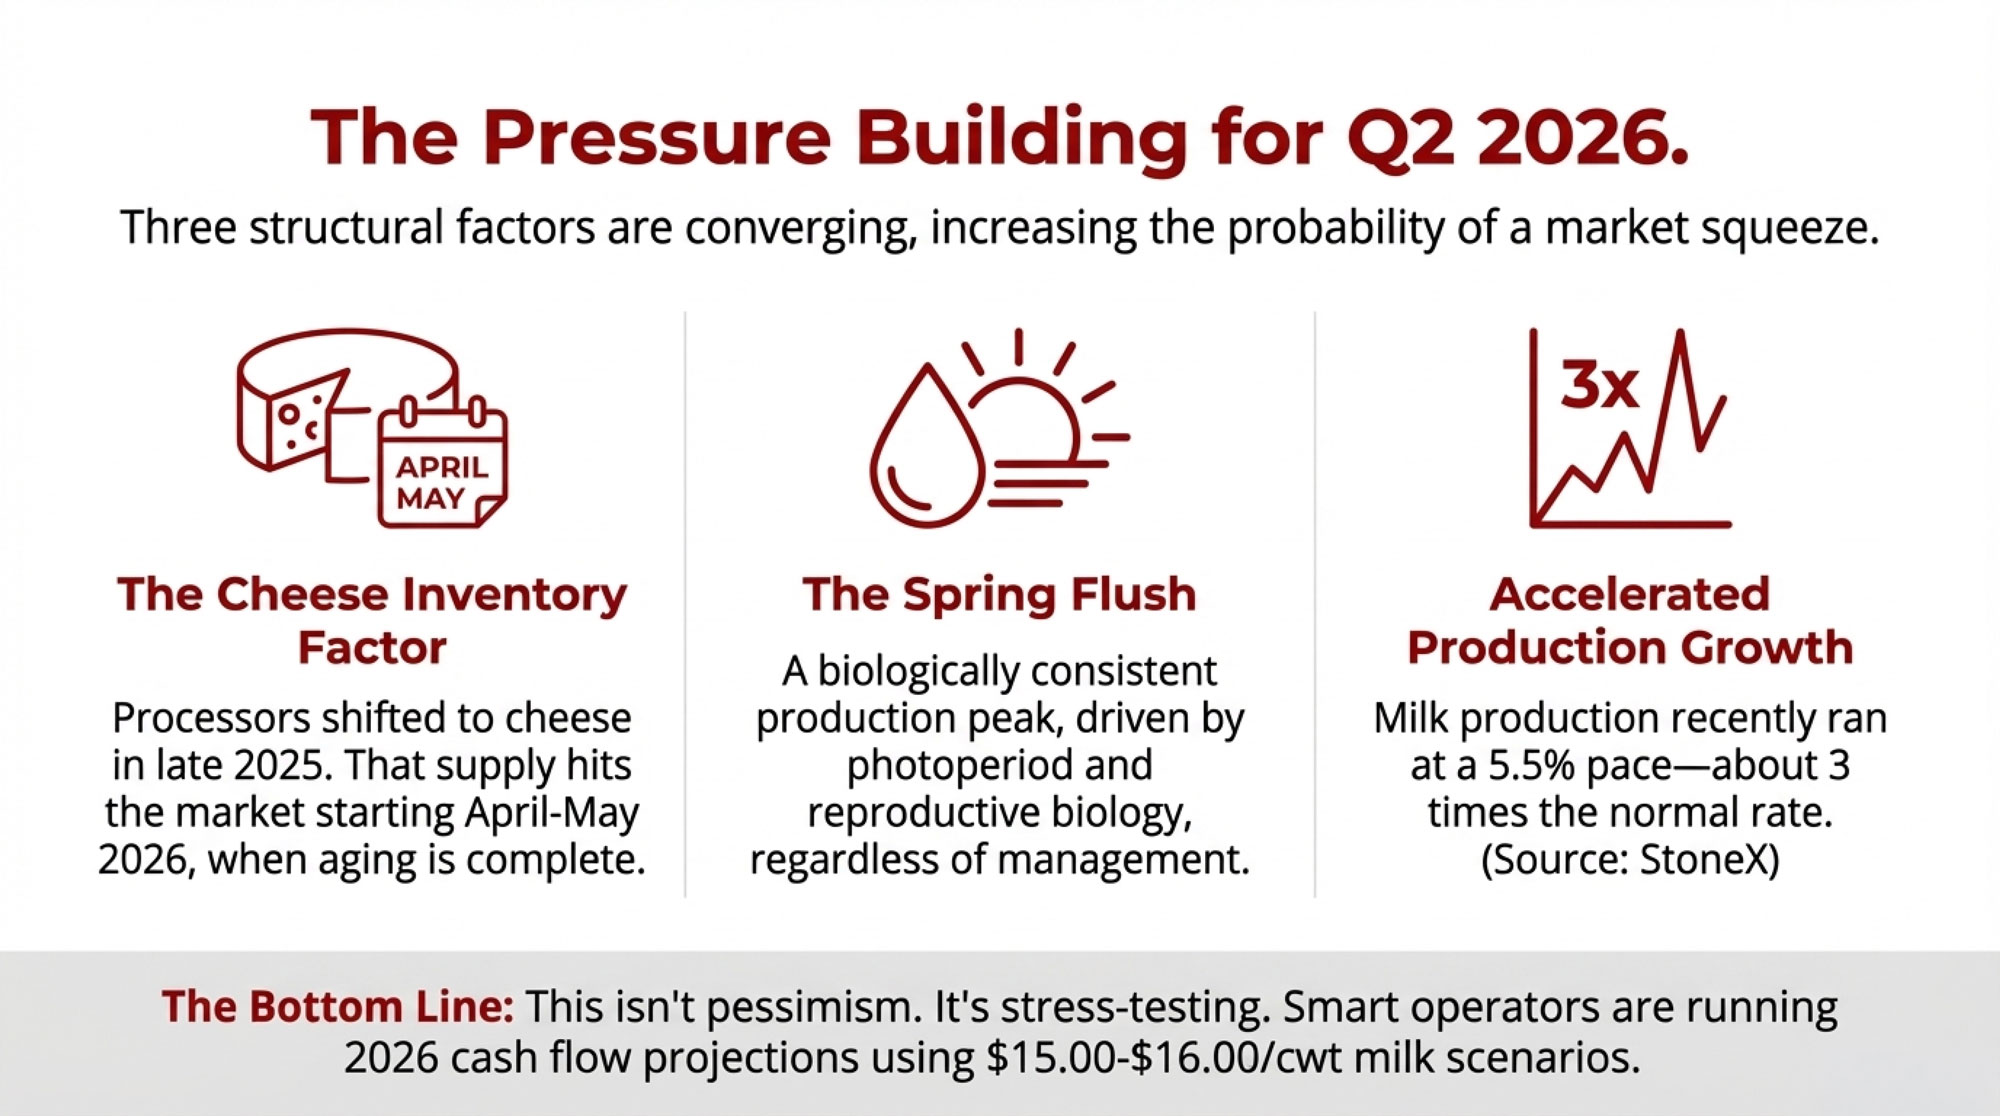
The cheese inventory factor: When butter prices declined through late 2025, processors across the U.S., UK, and EU made a logical shift. Butter had compressed margins and ongoing storage costs. Cheese—particularly aged cheddar—can sit in inventory for months as it matures, serving as a financial buffer during uncertain times.
You probably already know the aging timelines: mild cheddar reaches market readiness in 2-3 months, medium in 4-9 months, and sharp in 9-12 months. The cheese made in December 2025 and January 2026 will mature and need to be moved to market starting around April-May 2026. That’s not speculation about demand—that’s just aging biology meeting calendar math.
The spring flush timing: Every dairy farmer knows spring flush, but the research on its consistency is worth noting. Studies published in the Journal of Dairy Science on annual rhythms in U.S. dairy cattle show that the spring production peak is remarkably consistent across regions, parities, and management systems—driven more by photoperiod and reproductive biology than management decisions.
USDA’s December 2025 forecast projects U.S. milk production for 2026 at 106.2 million metric tons, up 1.2% from 2025. StoneX Director of Dairy Market Insight Nate Donnay noted in late December that milk production growth was running at an estimated 5.5% pace in September and October—about three times the normal rate. That’s notable context heading into the new year.
The export question: Here’s what’s been encouraging—September 2025 U.S. cheese exports hit 116.5 million pounds, up about 35% year-over-year, according to USDA Foreign Agricultural Service data. That was a remarkable achievement for the industry. The question some analysts are asking is whether markets that absorbed those record volumes will have the same appetite just as domestic production peaks.
None of this means $13 milk is coming. Markets find equilibriums, demand can surprise to the upside, and spring flush intensity varies year to year. But farmers projecting cash flow for Q2 2026 might consider running scenarios at $15.00-16.00/cwt alongside their base case assumptions. That’s not pessimism—it’s the kind of stress-testing that helps operations stay resilient when surprises happen.
Why Component Performance Is Becoming a Competitive Advantage
One of the most significant structural shifts in U.S. dairy over the past decade has been the steady improvement in milk components. And the numbers here are pretty remarkable. CoBank’s Knowledge Exchange published an analysis in September 2025 showing that U.S. butterfat levels increased approximately 13% over the past decade—from about 3.75% in 2015 to 4.24% by 2024. That’s roughly six times the improvement rate seen in the EU and New Zealand.
What’s particularly noteworthy is how this shifts farm-level economics during price compression. Class III and Class IV pricing formulas reward butterfat and protein by the pound rather than by volume. When base prices compress, the premium for higher components becomes proportionally more valuable as a share of the milk check.
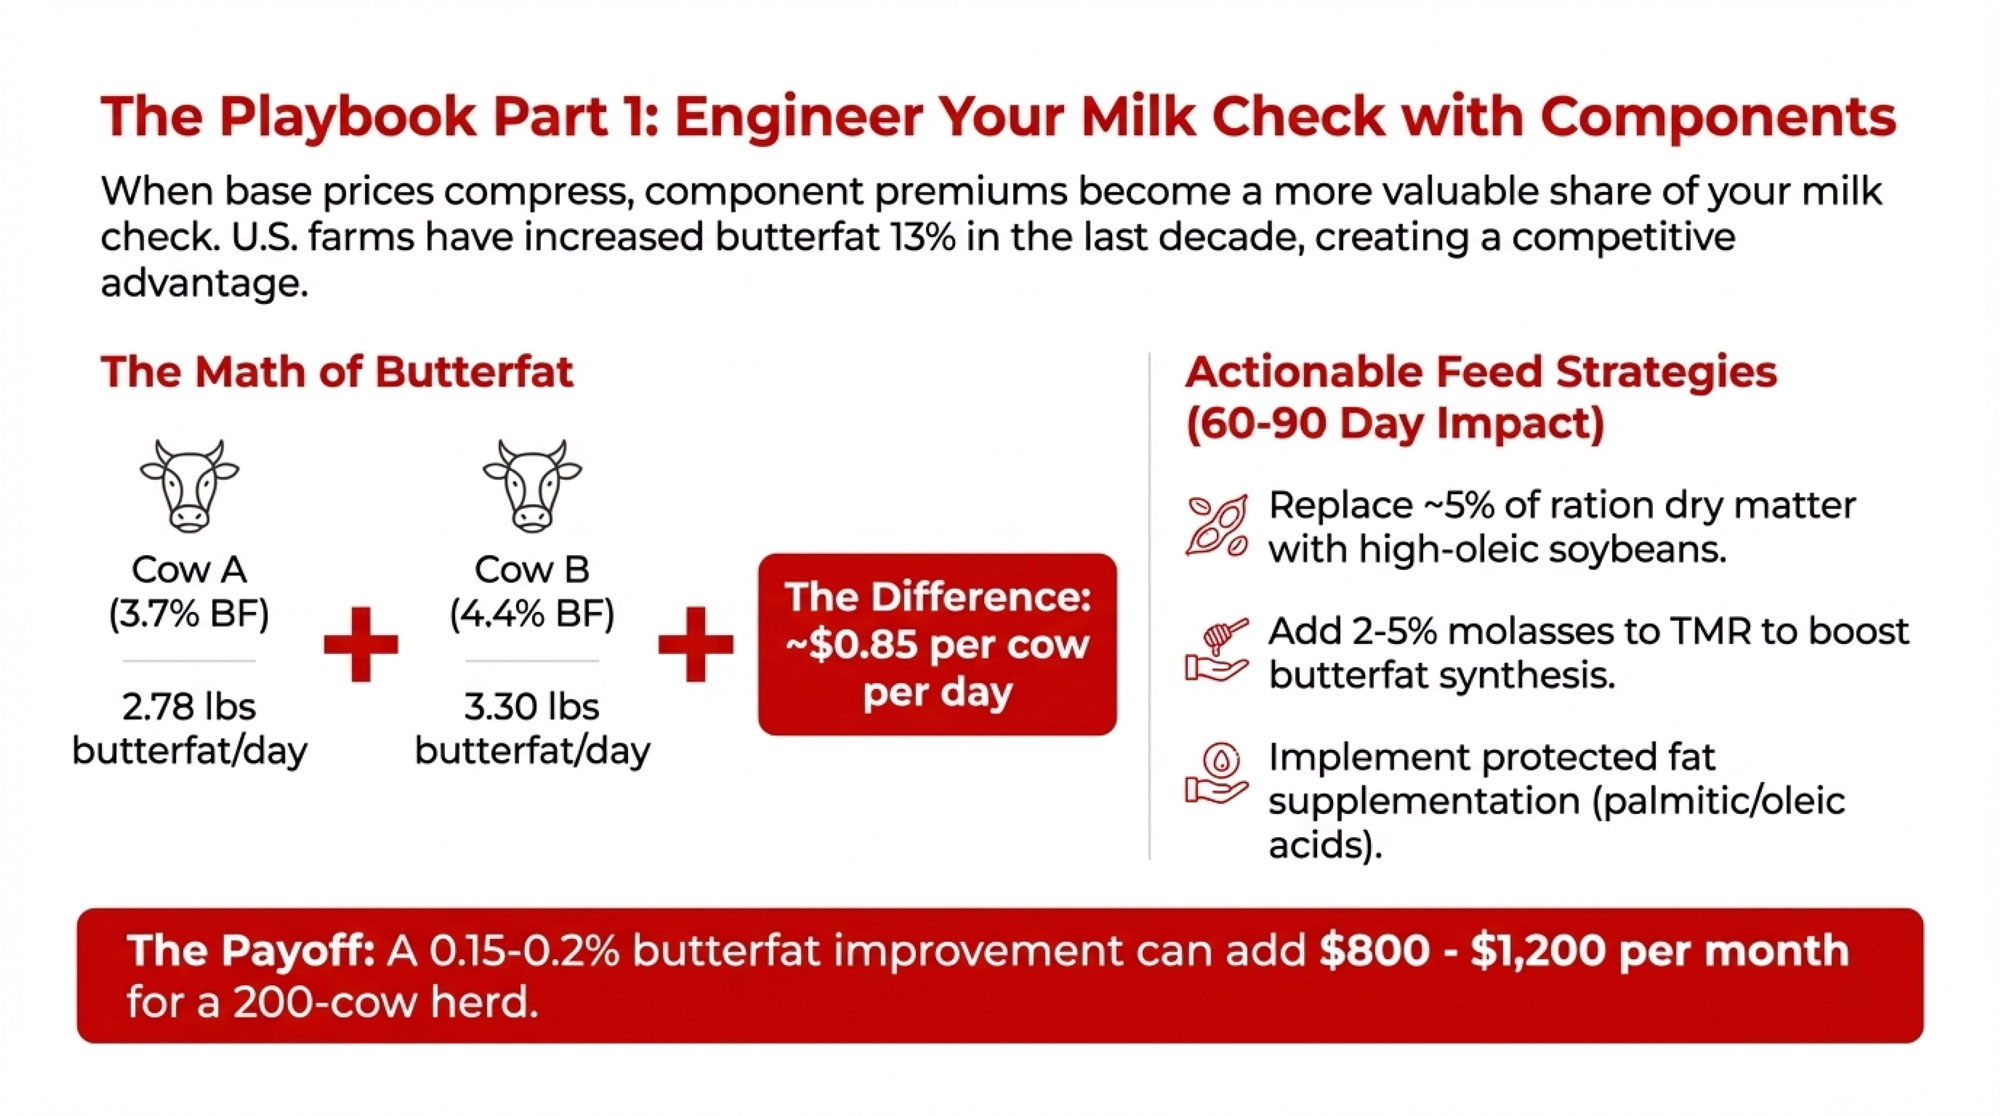
Let me walk through some rough math on two cows producing identical volume but different components:
Cow A at 3.7% butterfat: 75 lbs/day = 2.78 lbs butterfat daily
Cow B at 4.4% butterfat: 75 lbs/day = 3.30 lbs butterfat daily
At current butterfat component pricing—which has been running in the $1.55-1.75/lb range in recent months according to USDA announcements—that 0.52-pound daily difference represents roughly $0.80-0.90 per cow per day. Scale that across a 200-cow herd over a year, and we’re talking meaningful revenue differences.
Now, genetic improvement takes 2-3 years to show up meaningfully in the bulk tank. But feed ration adjustments can produce measurable butterfat improvements within 60-90 days—which matters for operations looking at near-term margin pressure.
A Penn State study published in the Journal of Dairy Science in June 2024 found that replacing about 5% of ration dry matter with whole high-oleic soybeans improved income over feed cost by approximately $0.27/cow/day—roughly $99/cow annually. The research synthesized results from multiple feeding trials, so the findings are pretty robust.
Dairy nutritionists generally recommend adding 2-5% molasses to TMR to stimulate fiber-digesting bacteria and boost acetate production, which supports butterfat synthesis. Many farms report butterfat increases of 0.10-0.15 percentage points from this relatively simple adjustment. Protected fat supplementation—combinations of palmitic and oleic acids—can increase milk fat yields within 30-45 days of implementation.
For farms facing compressed margins, even a 0.15-0.2% butterfat improvement translates to meaningful revenue—potentially $800-1,200 monthly for a 200-cow operation at current component pricing. It’s not a complete solution to price pressure, but it’s real money that shows up in the tank relatively quickly.

The Beef-on-Dairy Opportunity
One revenue diversification strategy that’s gained remarkable traction is beef-on-dairy crossbreeding. Industry surveys, including data from the American Farm Bureau Federation, based on Purina’s 2024 producer research, indicate that roughly seven in ten dairy operations are now actively implementing crossbreeding programs. That’s a significant shift from even five years ago.
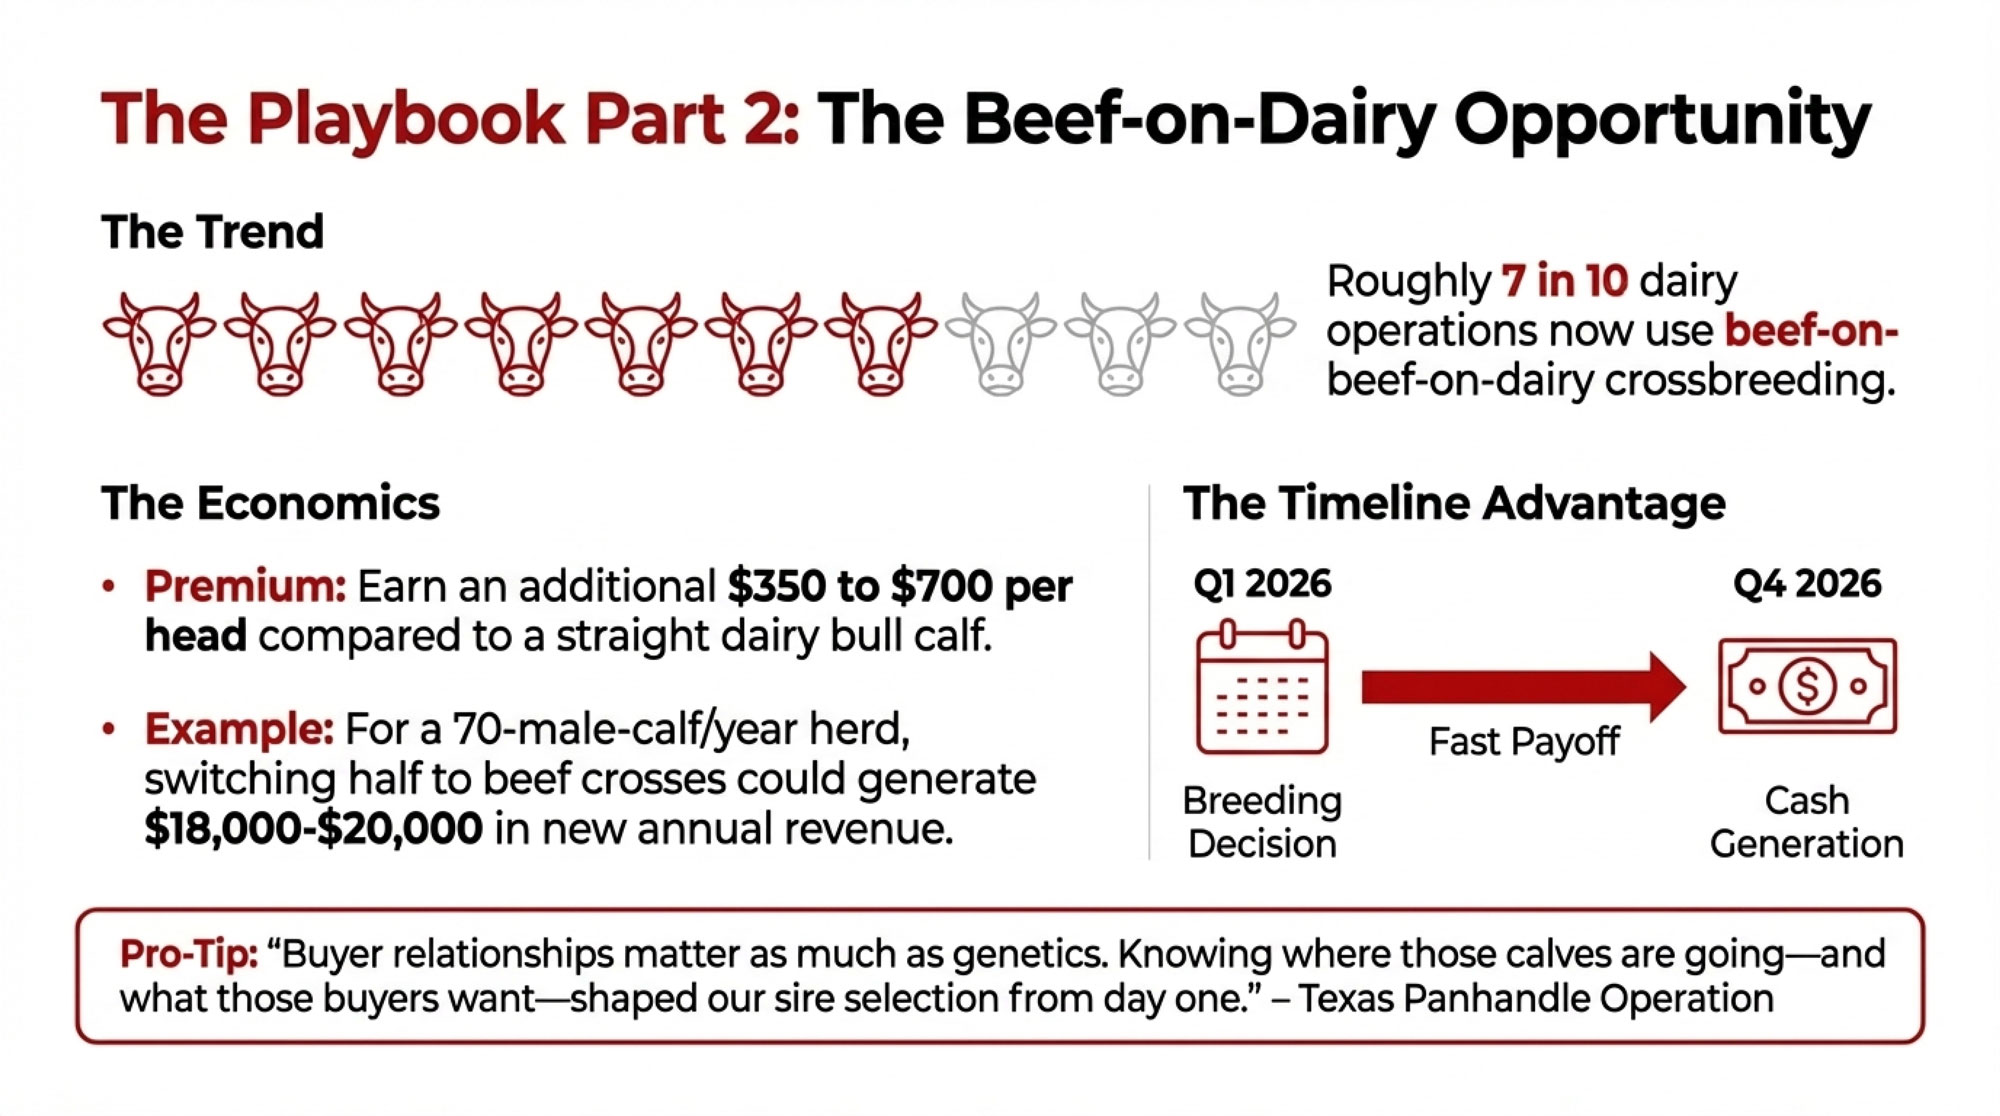
The economics are fairly straightforward. Industry analysis shows that the majority of dairy farmers participating in these programs receive meaningful premiums for beef-on-dairy calves, with reports of additional revenues ranging from $350 to $700 per head compared to straight dairy bull calves. For an operation producing 70 male calves annually, switching half to beef crosses could generate $18,000-$20,000 in additional annual revenue.
What stands out to me about this trend is the timeline. Beef-on-dairy calves sell at 6-9 months, meaning breeding decisions made in Q1 2026 generate cash in Q4 2026. That’s a faster payoff than almost any other diversification strategy available to dairy producers—which matters when you’re managing through uncertain price periods.
Penn State Extension research on beef×Holstein crosses shows these animals have greater potential to put on muscle than purebred Holstein steers and generally show improved feedlot performance. The carcass quality has proven competitive, and the market infrastructure has developed rapidly to accommodate increased supply. One California producer I spoke with mentioned that his local auction now has specific beef-on-dairy sales days—something that would have seemed unlikely five years ago.
A Texas Panhandle operation I connected with recently shared a different angle on this. They’ve been running beef-on-dairy for three years now and emphasized that buyer relationships matter as much as genetics. “We spent six months building connections with regional feedlots before we started,” the manager told me. “Knowing where those calves are going—and what those buyers want—shaped our sire selection from day one.”
Implementation is fairly straightforward for most operations: genomic testing identifies which cows should continue breeding to elite dairy genetics (typically top 50% by genomic merit) versus which shift to beef sires—Angus, Simmental, or Charolais being common choices depending on regional buyer preferences.
WHAT ONE PRODUCER LEARNED FROM 2015
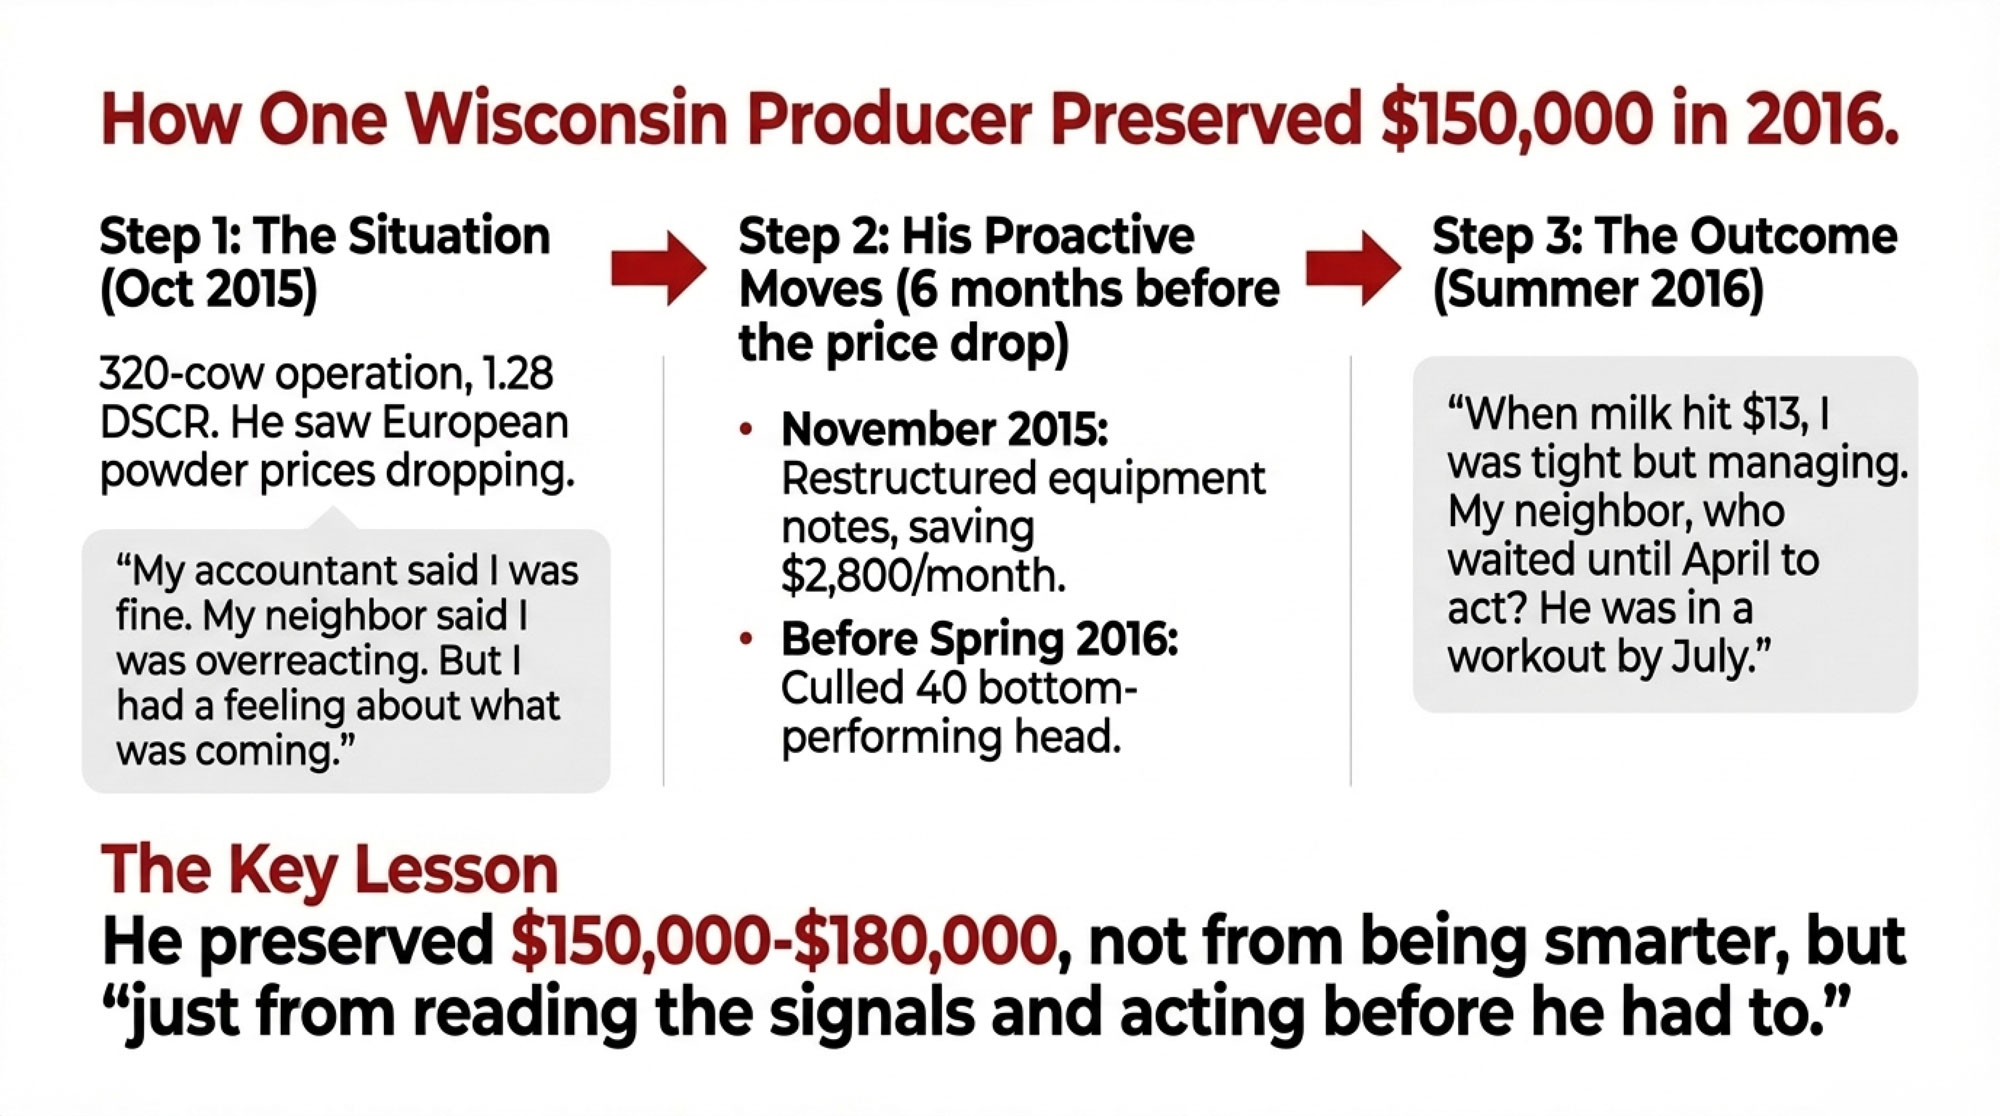
A 320-cow operation in Dodge County, Wisconsin, offers a useful case study. The producer—who asked that I not use his real name but was willing to share his experience—was running at about 1.28 DSCR in October 2015 when he started noticing warning signs.
“My accountant said I was fine. My neighbor said I was overreacting. But I’d been watching powder prices in Europe drop for months, and I had a feeling about what was coming.”
He restructured his equipment notes that November, extending terms and reducing his monthly obligation by $2,800. He culled 40 head—his bottom performers on both production and components—before spring 2016.
“When milk hit $13 that summer, I was tight but managing. My neighbor, who waited until April to act? He was in a workout by July. Similar starting points, different decisions, very different outcomes.”
His estimate of the wealth difference: around $150,000-$180,000 preserved by moving about six months earlier. Not from being smarter, he emphasized—just from reading the signals and acting before he had to.
What Peer Accountability Groups Are Teaching Farmers
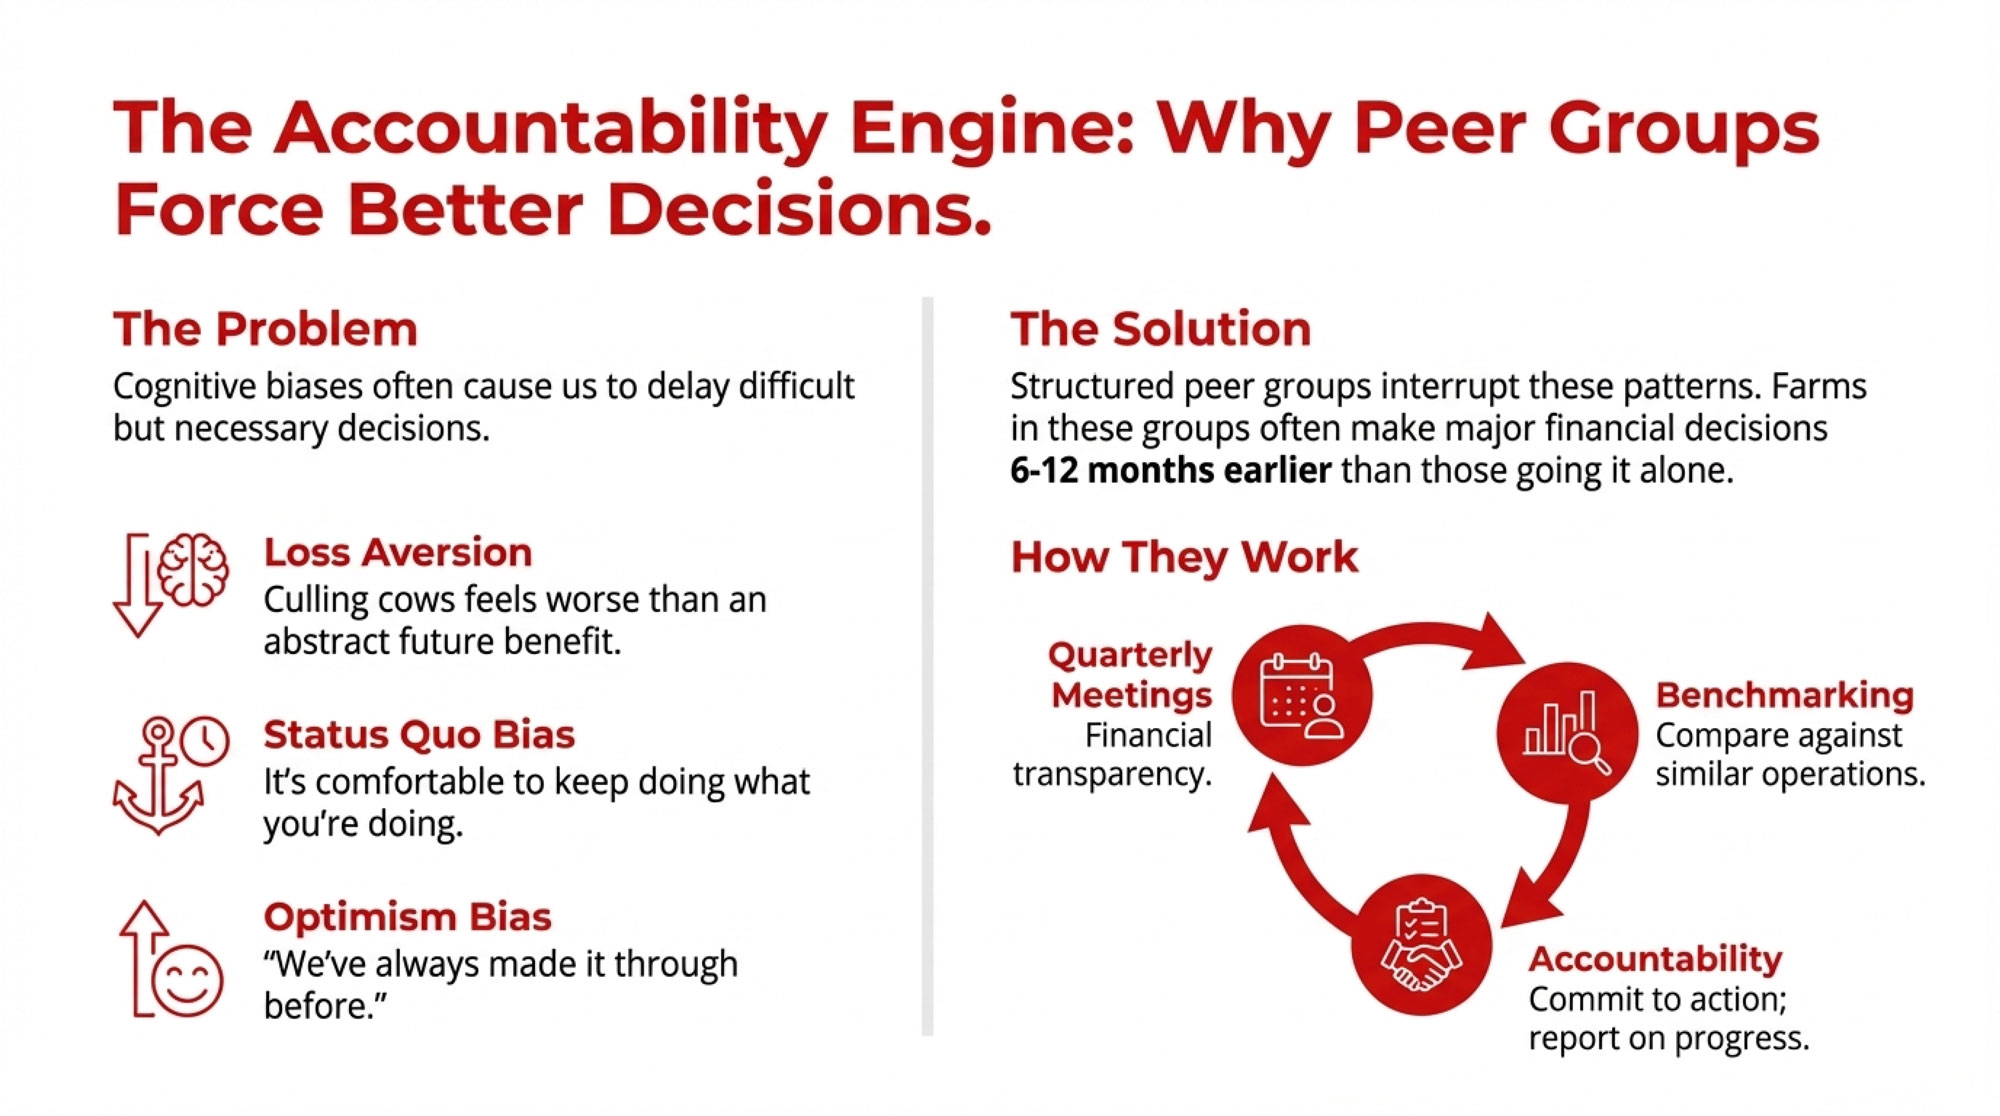
There’s growing evidence suggesting that farms participating in structured peer groups make major financial decisions 6-12 months earlier than farms relying solely on individual analysis. And the mechanisms behind this are fascinating—rooted in behavioral economics as much as farm management principles.
Research on structured farm management groups has consistently shown meaningful financial advantages for participants. Studies tracking farms in peer advisory programs have found notable improvements in operating profit and return on assets compared to non-participants—though the specific magnitude varies by region, group structure, and management intensity.
The Ohio State University Extension put together a helpful fact sheet on peer group value that explains part of the mechanism. As they describe it, “With trusting relationships, members can share their farm’s production data such as yield, inputs, labor, and equipment, along with core financial ratios. Peers then act as an informal board of directors by identifying the strengths and areas for improvement.”
Here’s something I’ve noticed over the years: most dairy farmers don’t actually know their neighbor’s DSCR. They might know what kind of tractor he bought or roughly what he’s feeding, but the real financial picture? That stays behind closed doors. And that isolation can be expensive.
Having sat in on several of these groups over the years, I’ve observed something important about what actually happens in those rooms. The groups seem to override the cognitive biases that can cause all of us—not just farmers—to delay difficult decisions. Loss aversion makes culling cows feel worse than the abstract benefit of “preserving financial flexibility.” Status quo bias creates comfort with continuing current practices even when data suggests change might be warranted. Optimism bias whispers, “we’ve always made it through before.”
The farmers losing the most money right now aren’t necessarily the ones with the worst operations. They’re often the ones who calculated correctly but couldn’t pull the trigger—who knew what they should do but found reasons to wait another month, another quarter, another year.
Peer groups interrupt these patterns through straightforward mechanics: quarterly meetings with financial transparency, benchmarking against similar operations, and accountability for stated commitments. When you tell five other farmers in January that you’re going to restructure your equipment debt and cull your bottom 15%—and they’re going to ask you about it in April—it changes the calculus.
Kim Gerencser, a Saskatchewan-based farm business and management consultant who has been facilitating peer groups for well over a decade, has written and spoken extensively about the value of accountability structures. In interviews with Country Guide, he’s emphasized that the groups that sustain themselves over many years do so because participants find genuine value in the structure. The accountability piece, he’s noted, is what really matters.
For farmers who haven’t participated in this kind of group, options include Cornell’s Dairy Profit Discussion Groups, various state extension programs, cooperative-facilitated groups, and private consultant-led formations. The common elements that seem to make groups effective: quarterly meetings, financial transparency among members, neutral facilitation, and strong confidentiality agreements.
A Practical Six-Month Framework
For farmers who’ve assessed their position and decided proactive action makes sense, here’s what a practical timeline might look like. I want to emphasize that this isn’t the only approach, and every operation’s circumstances differ. A 500-cow California dairy faces different cost structures and cooperative relationships than a 150-cow Vermont operation or a 2,000-cow Texas facility.
But the underlying framework—financial clarity first, then cost structure adjustment, then ongoing accountability—seems to apply broadly based on what I’ve seen work across different regions and operation sizes.
Month 1 (January): Financial Clarity
The starting point is knowing exactly where you stand. Complete the DSCR calculation using both historical and projected prices. Pull your operating line balance trend over the past six months—if it’s been climbing $3,000-8,000 monthly, you may already be running negative cash flow, regardless of what last year’s financial statement showed.
Review your DHIA reports to identify the bottom 15-20% of your herd by combined production and components. These become your first-look candidates if cash flow requires culling decisions.
And if you’re considering a lender conversation, schedule it now while you’re initiating from a position of relative strength. The framing matters. Something like: “I’ve run forward projections based on current futures. I’d like to discuss options while we’re still well above your monitoring threshold” positions you as a proactive manager rather than a distressed borrower.
Month 2 (February): Cost Structure Adjustment
If culling decisions make sense for your operation, executing them while cattle prices remain stable preserves value. Current market prices for cull cows typically range from $1,200-1,800/head, depending on region and market conditions; distressed selling in a soft spring market could mean $800-1,100. That difference across 35 cows adds up quickly—real money for most operations.
Implement any feed ration adjustments to improve butterfat. The 60-90 day timeline for feed-based component gains means February changes can show up in April milk checks.
If beef-on-dairy makes sense for your operation, begin that breeding protocol on lower genomic performers. Revenue arrives in Q4 2026.
Month 3 (March): Risk Management and Accountability
Evaluate hedging options based on your operation’s risk tolerance and expertise. Dairy Revenue Protection and Class III options are available for farms that want price-floor protection, though they come with costs and basis risk that warrant careful evaluation—ideally with someone who understands these tools well.
Consider joining or establishing a peer accountability group. The first meeting should present your current position and action plan. Having external accountability through the spring flush period can be valuable.
Months 4-5 (April-May): Monitor and Maintain Discipline
Track actual versus projected cash flow weekly. This is where discipline matters—there can be temptation to reverse culling decisions or restructuring if short-term prices tick up.
If you’re in a peer group, the meeting during this period provides external validation. Present your January baseline, your April position, and your variance analysis. Let the group help you assess whether you’re on track.
Month 6 (June): Assessment and Forward Planning
Compare actual DSCR to January projections. Evaluate what worked, what didn’t, and what you’ve learned. Develop your Q3-Q4 plan incorporating any beef-on-dairy calf revenue and continued component focus.
What success might look like: A farm that entered January at 1.3x DSCR with $18.50/cwt breakeven, facing uncertain milk prices, emerges in June at 1.15-1.18x DSCR with $16.80/cwt breakeven—having maintained position above the critical 1.0x threshold even through potential price pressure. That’s not a dramatic turnaround story. It’s just solid management under challenging conditions.
The Conversation That Matters Most
Perhaps the hardest part of proactive financial management isn’t the calculations or even the lender meetings. It’s the kitchen table conversation about making significant changes before a crisis becomes undeniable.
What farmers who act early seem to be deciding is whether the discomfort of acknowledging vulnerability now is worth the financial protection it might provide later. And honestly, that’s not an easy trade-off. Culling cows you’ve raised can feel like a retreat. Calling your lender proactively can feel like admitting weakness. Joining a peer group and sharing your financials can feel uncomfortable.
But the alternative—waiting until circumstances force the same decisions from a weaker position—tends to cost real money, according to the research and case studies I’ve reviewed. The wealth difference between proactive and reactive positioning can range from $150,000 to $300,000 or more over a 2-3-year market cycle, depending on the operation’s size and the severity of the downturn.

That’s what tends to happen when operations restructure at penalty rates rather than market rates, sell cattle into distressed markets rather than stable ones, pay workout fees rather than standard processing fees, and navigate restricted credit access for years rather than maintaining banking relationships.
Key Takeaways
On global market signals:
- European butter prices and Global Dairy Trade auction results can provide 60-90 days of advance indication for U.S. milk price direction
- Current signals suggest potential price pressure in Q2 2026, though markets can surprise, and projections always carry uncertainty
- Worth monitoring: GDT auction results at globaldairytrade.info, AHDB EU wholesale prices, and CLAL’s international databases
On financial positioning:
- DSCR is the metric lenders watch most closely—knowing yours and projecting it forward matters
- The wealth difference between acting proactively versus reactively can be substantial over a market cycle
- Proactive restructuring conversations tend to yield significantly better terms than reactive conversations during distress
On operational strategies:
- Component improvement through feed rations can generate meaningful monthly revenue within 60-90 days
- Beef-on-dairy crossbreeding offers $18,000-$20,000 potential annual revenue diversification with a 6-9 month payoff timeline
- Culling decisions reduce cost structure but require careful analysis of volume versus efficiency trade-offs specific to each operation
On decision-making:
- Peer accountability groups appear to help farmers make structural decisions earlier than solo analysis
- The psychological barriers to early action—loss aversion, status quo bias, optimism bias—are normal human tendencies
- The farms that navigate market pressure most successfully seem to share a common trait: they made uncomfortable decisions while they still had meaningful control over terms and timing
The Bottom Line
The European butter correction of 2024-2025 wasn’t just a European story. It appears to be an early chapter in a global market adjustment that’s still developing. For dairy farmers willing to monitor these signals, clearly understand their financial position, and make proactive decisions, it may also represent an opportunity to strengthen operations before market pressures fully test them.
The question isn’t whether to prepare—smart operators are always preparing. The question is whether you’ll do it on your terms or the bank’s.
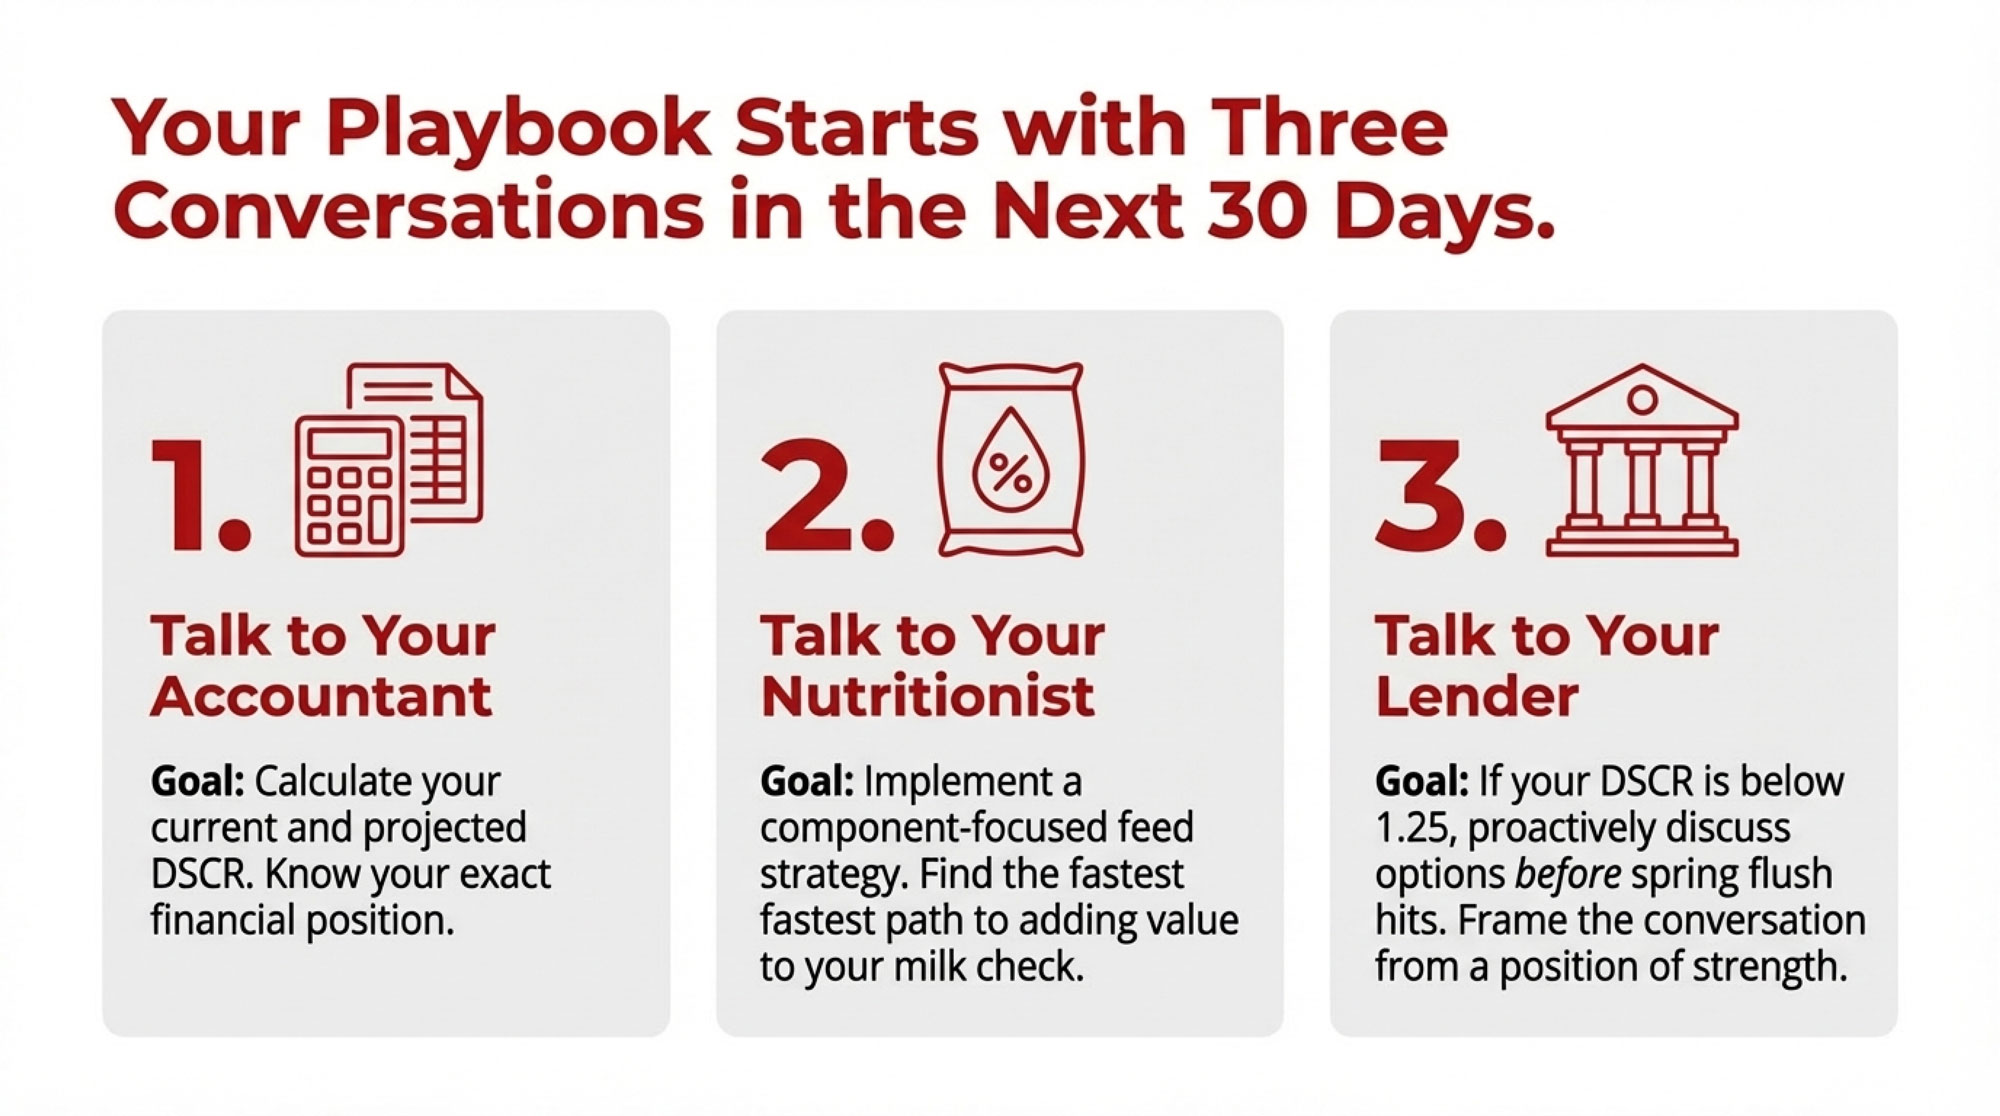
For producers reading this in January 2026, that means three conversations in the next 30 days: one with your accountant to calculate your current DSCR, one with your nutritionist about component-focused ration adjustments, and—if your number is below 1.25—one with your lender before spring flush hits. The farmers who preserved six figures in 2015-2016 didn’t have better operations. They had better timing.
For dairy producers seeking resources: University extension dairy programs in most states offer farm financial analysis services. The Center for Dairy Profitability at UW-Madison publishes annual benchmarking data. Regional cooperatives increasingly offer member financial planning support. Farm Credit institutions provide forward-looking cash flow analysis. The key is engaging these resources while your financial position still allows flexibility to act thoughtfully on what you learn.
Note: Market projections are inherently uncertain. This article provides educational framework, not financial advice. Consult qualified professionals for operation-specific decisions.
Complete references and supporting documentation are available upon request by contacting the editorial team at editor@thebullvine.com.
Learn More
- 2025’s $21 Milk Reality: The 18-Month Window to Transform Your Dairy Before Consolidation Decides for You – Choose your survival model—mega-scale, niche, or partnership—before consolidation decides for you. This long-range analysis reveals the restructuring heading toward 2030 and delivers a strategic 18-month window to transform your farm gate revenue.
- The 90-Day Dairy Pivot: Converting Beef Windfalls into Next Year’s Survival – Stack $266 per cow in additional revenue using this tactical guide to cull cows, component premiums, and beef-crosses. It arms you with the specific breakeven calculations needed to out-manage and out-last the current flat-price market cycle.
- The New Dairy Playbook: 5 Trends Redefining Profitability in 2025 – Gain a competitive edge by mastering the automated feeding and robotic systems delivering $180 per cow in annual savings. This report breaks down current payback periods, helping you build a high-efficiency operation during global supply surges.
 The Sunday Read Dairy Professionals Don’t Skip.
 The Sunday Read Dairy Professionals Don’t Skip.
Every week, thousands of producers, breeders, and industry insiders open Bullvine Weekly for genetics insights, market shifts, and profit strategies they won’t find anywhere else. One email. Five minutes. Smarter decisions all week.


