


One herd guessed 4% ketosis. The meter said 40.7%. This is the story behind that gap—and how to find your real number before it costs you.
Executive Summary: Four high‑producing herds thought subclinical ketosis was a minor issue; whole‑herd BHBA testing showed an average 46% of fresh cows were ketotic, including one herd that guessed 4% and actually sat at 40.7%. That kind of hidden SCK rate quietly drives more metritis, fever, extra days open, culls, and lameness—even when cows “look fine” at the bunk. Using published cost estimates, a 300‑cow herd can easily be leaking around $34,800 a year to undetected SCK alone, before you price in extra DAs or foot problems. The article walks through what’s actually working in transition pens right now: realistic DCAD and calcium strategies, where NASEM 2021 sets the floor on MP and methionine, and what newer data say about rumen‑protected methionine, fatty acids, and choline. It also lays out practical guardrails on BCS loss, fat: protein ratios, NEFA, stocking density, and bunk space so you can read early‑lactation milk records like a health report, not just a production snapshot. The core challenge is simple: stop guessing at SCK and fresh‑cow energy balance and start measuring them with BHBA tests and a few key ratios. If you’re willing to run a 30‑day BHBA check and one clean pen trial with your nutritionist, this piece gives you the numbers and thresholds to decide whether your transition program is truly dialed in or looks that way.
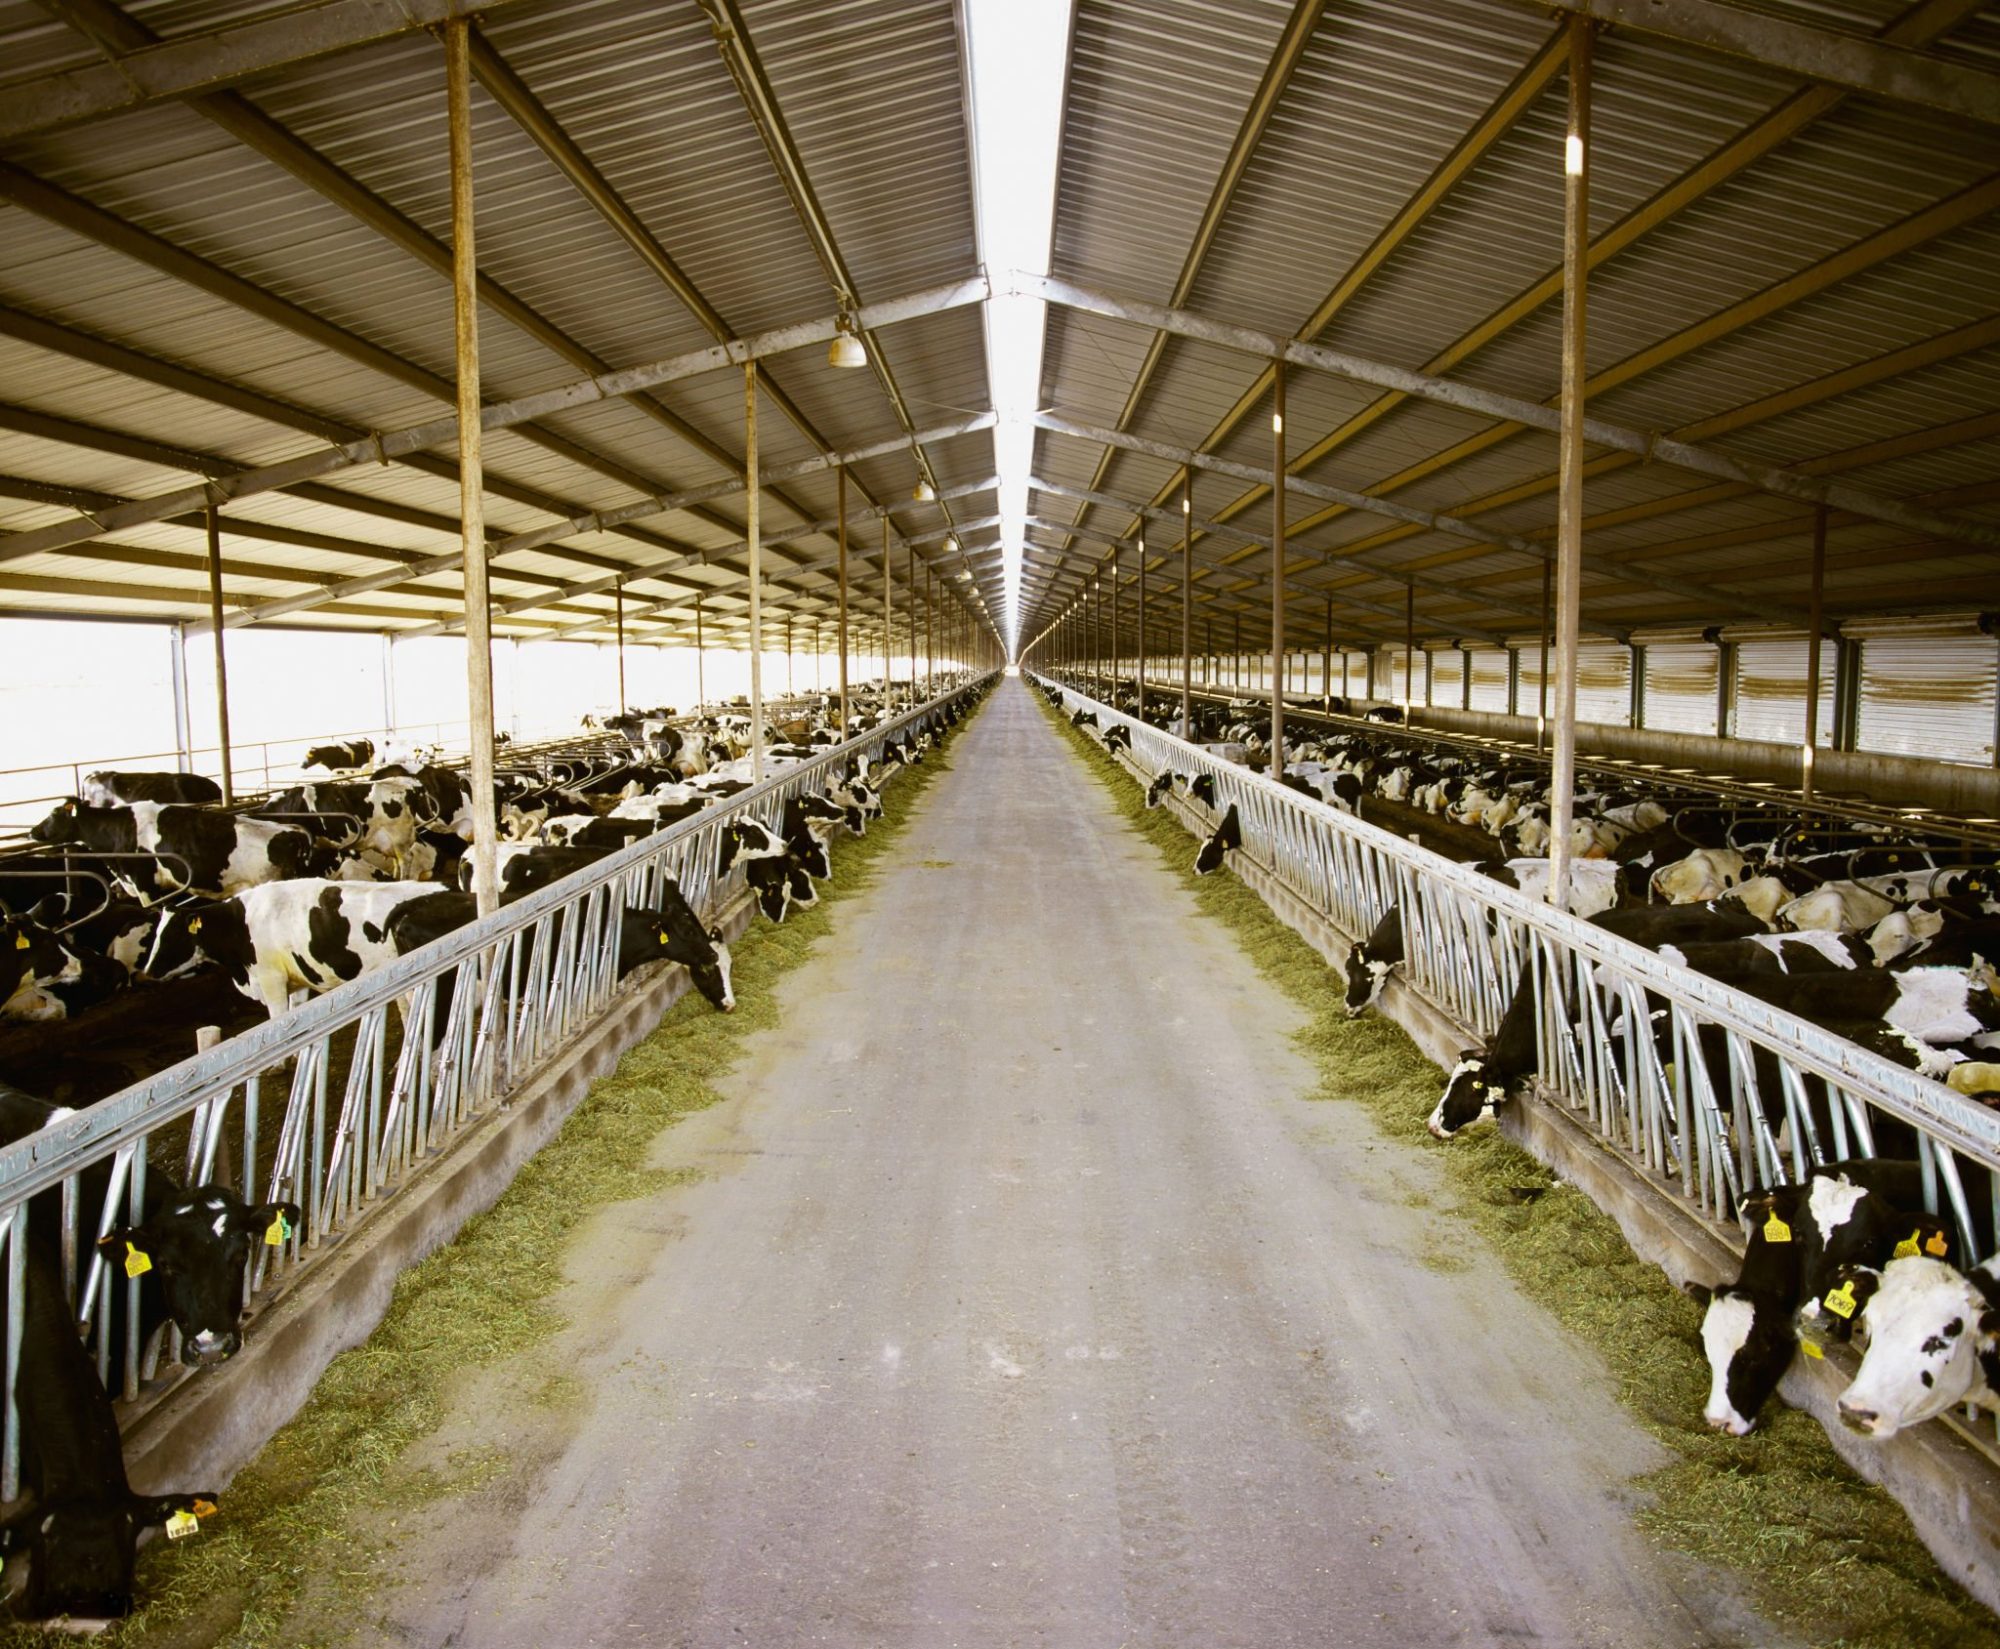
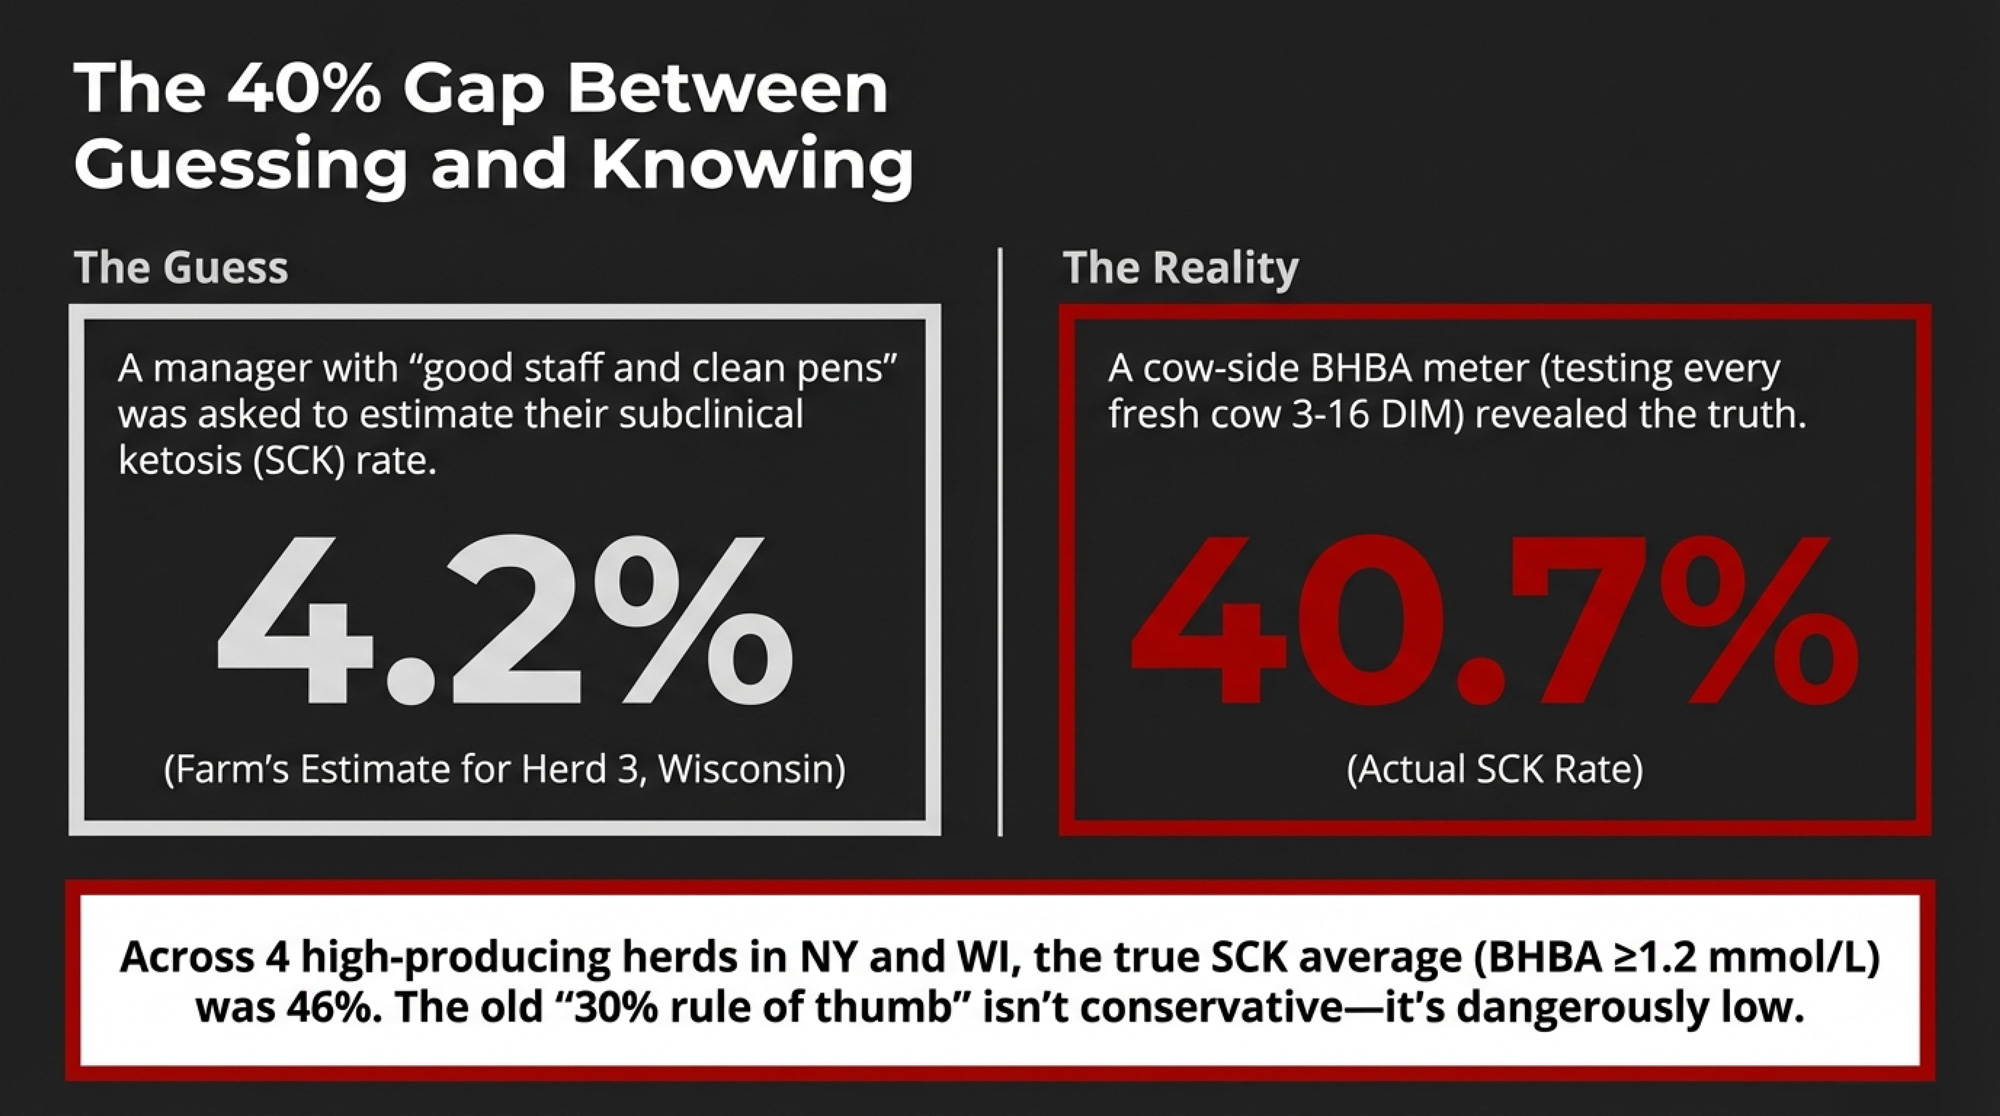
The herd thought they knew their fresh cows. Good staff. Clean pens. A close‑up program that had been “working” for years. When the vet asked how many fresh cows were dealing with subclinical ketosis, the manager guessed around four percent. Maybe five on a bad month.
Then they pulled blood on every fresh cow between 3 and 16 DIM with a cow‑side BHBA meter.
The number wasn’t 4%. It was 40.7% — and when the researchers put that herd together with three other high‑producing herds in New York and Wisconsin, the true average was 46% subclinical ketosis, using a BHBA cut‑point of 1.2 mmol/L in early lactation. The cows were standing, eating, and milking. On the surface, they looked fine.
That’s the uncomfortable starting point for any honest conversation about transition cows in 2026. The risk isn’t just in “train wreck” fresh pens. It’s in the gap between what you think is happening and what a simple meter would show.
Three Transition Groups, Three Real Jobs
Most progressive herds now run some version of three transition groups: far‑off drys, close‑ups, and fresh cows. On paper, that sounds basic. In practice, how those three groups are fed, stocked, and managed is where profit gets made or lost.
Far‑off dry cows usually live on a controlled‑energy diet. Think straw or other lower‑energy forages to hold intake and energy down while keeping the rumen full and chewing. Their job is boring by design: don’t get fat, don’t crash, keep the rumen ready to go back to work.
Close‑up cows have a much more delicate assignment in the last three weeks before calving:
- Step up energy without packing on extra condition.
- Step up the metabolizable protein to match colostrum and fetal growth.
- Keep enough bunk and lying space open that they’ll actually eat what you’ve formulated.
NASEM 2021 pegs far‑off dry cows at around 12% crude protein and 7.2% MP, and close‑up cows at 13% CP and 8.6% MP, which works out to roughly 1,000 g of MP per day one week before calving. In the field, many nutritionists now push that closer to 1,100–1,200 g of MP in the last month to cover both a fast‑growing fetus and colostrum synthesis, especially if dry matter intake slips in the last 7–10 days.
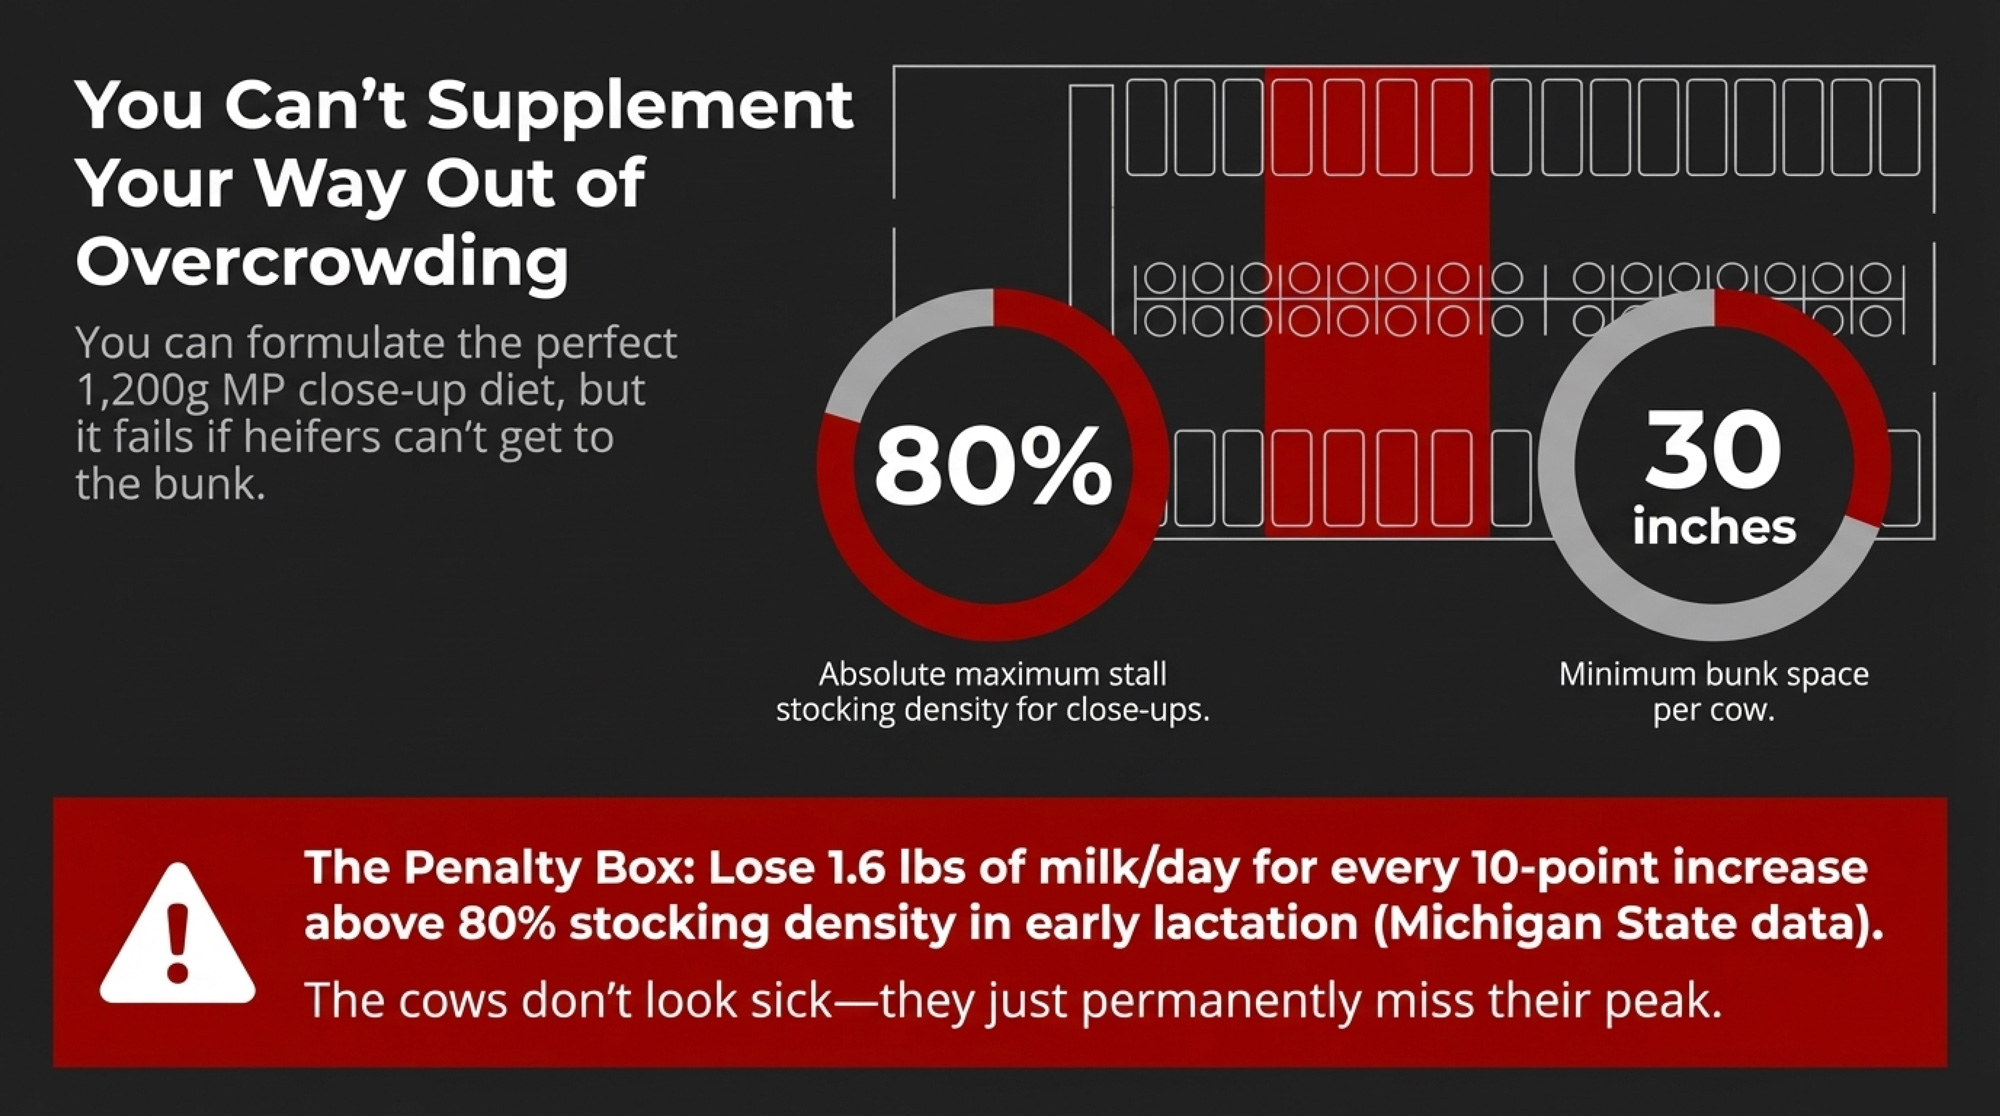
Space matters as much as the spreadsheet. Work out of Wisconsin and elsewhere points to 80% of stalls and at least 30 inches of bunk space per cow as realistic targets for close‑up pens. When first‑calvers get jammed in with older cows and bunk stocking goes much past that, Michigan State data shows you can lose about 1.6 lb of milk per day for every 10‑point increase above 80% stocking in early lactation. Those heifers don’t look “sick” — they just never hit the peaks they could have.
Fresh cows then step onto your high‑group TMR with deliberate tweaks Hutjens and others have hammered on for years:
- Functional fiber: 3–4 lb of long hay or 1–2 lb of processed straw to keep the rumen happy and help keep DAs in check.
- Additive stack: yeast, monensin, organic chromium, buffer, higher vitamin E, rumen‑protected choline, organic trace minerals — all packed into a 10–21 day fresh window.
On paper, that fresh‑cow ration looks expensive. In the barn, those first two to three weeks largely set the lactation curve.
Does Your Fresh Pen Have a Quiet Calcium Problem?
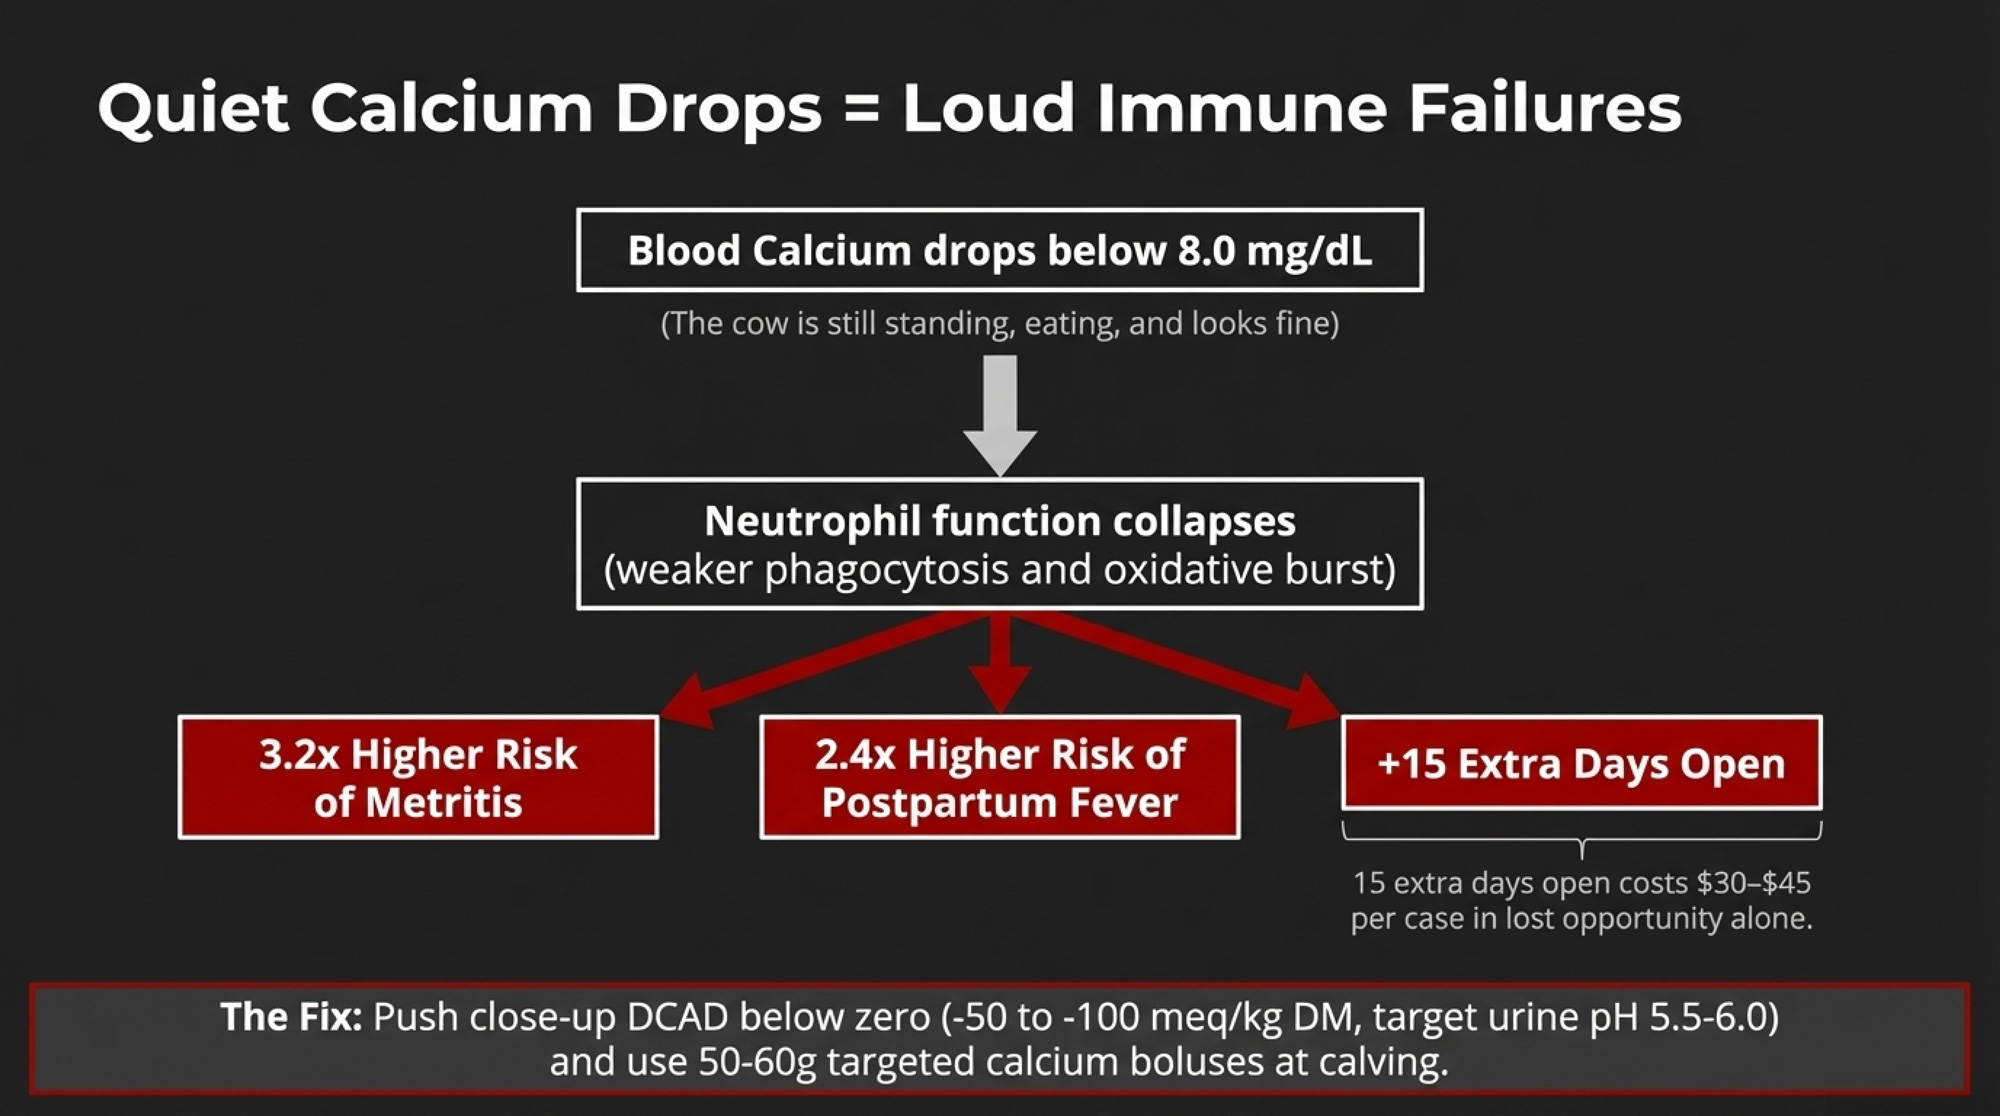
Clinical milk fever is obvious. Subclinical hypocalcemia? Not so much. Total blood calcium drops below about 8.0 mg/dL, but the cow is still standing, eating, and milking. From the aisle, she looks fine.
Martinez and co‑workers at the University of Florida followed multiparous Holsteins and grouped them by plasma calcium right after calving (JDS 95:7158, 2012). Cows with subclinical hypocalcemia (total Ca <8.0 mg/dL) had:
- 3.2× higher risk of metritis,
- 2.4× higher risk of postpartum fever,
- Higher BHBA (around 1.0 vs 0.7 mmol/L), and
- About 15 extra days open (124 vs. 109).
If you figure each extra day open beyond target costs $2–$3 in lost opportunity, 15 days open adds $30–45 per case on top of treatment and milk loss — and that’s before you price in more metritis and fever.
The immune story is even more interesting. Those subclinically hypocalcemic cows had fewer circulating neutrophils, and the ones they did have were less effective at phagocytosis and oxidative burst. In plain language, they walked through the highest‑risk period of their lactation with a weaker front‑line immune response.
You’ve basically got two big levers here:
- DCAD close‑up programs. Push dietary cation–anion difference below zero a few weeks pre‑calving (often −50 to −100 meq/kg DM, depending on forages and salts). Aim for a urine pH of 5.5–6.0 in Holsteins and 5.0–5.5 in Jerseys, and feed 150–180 g of calcium per day in the close‑up ration so there’s actually calcium in the gut to absorb.
- Calcium boluses. Most commercial boluses deliver 50–60 g of calcium from a mix of calcium chloride, sulfate, and/or propionate. Given at calving and again 12–24 hours later, they push blood calcium up for 2–6 hours while the cow’s internal system catches up.
Especially in older cows, skipping both DCAD and boluses is basically choosing more metritis, more fever, and a blunted immune system in the fresh pen.
Can 1.5% Fat in the First 21 Days Really Move the Needle?
A lot of herds feed fat. Very few have a clean answer to what it’s actually doing in the first three weeks after calving.
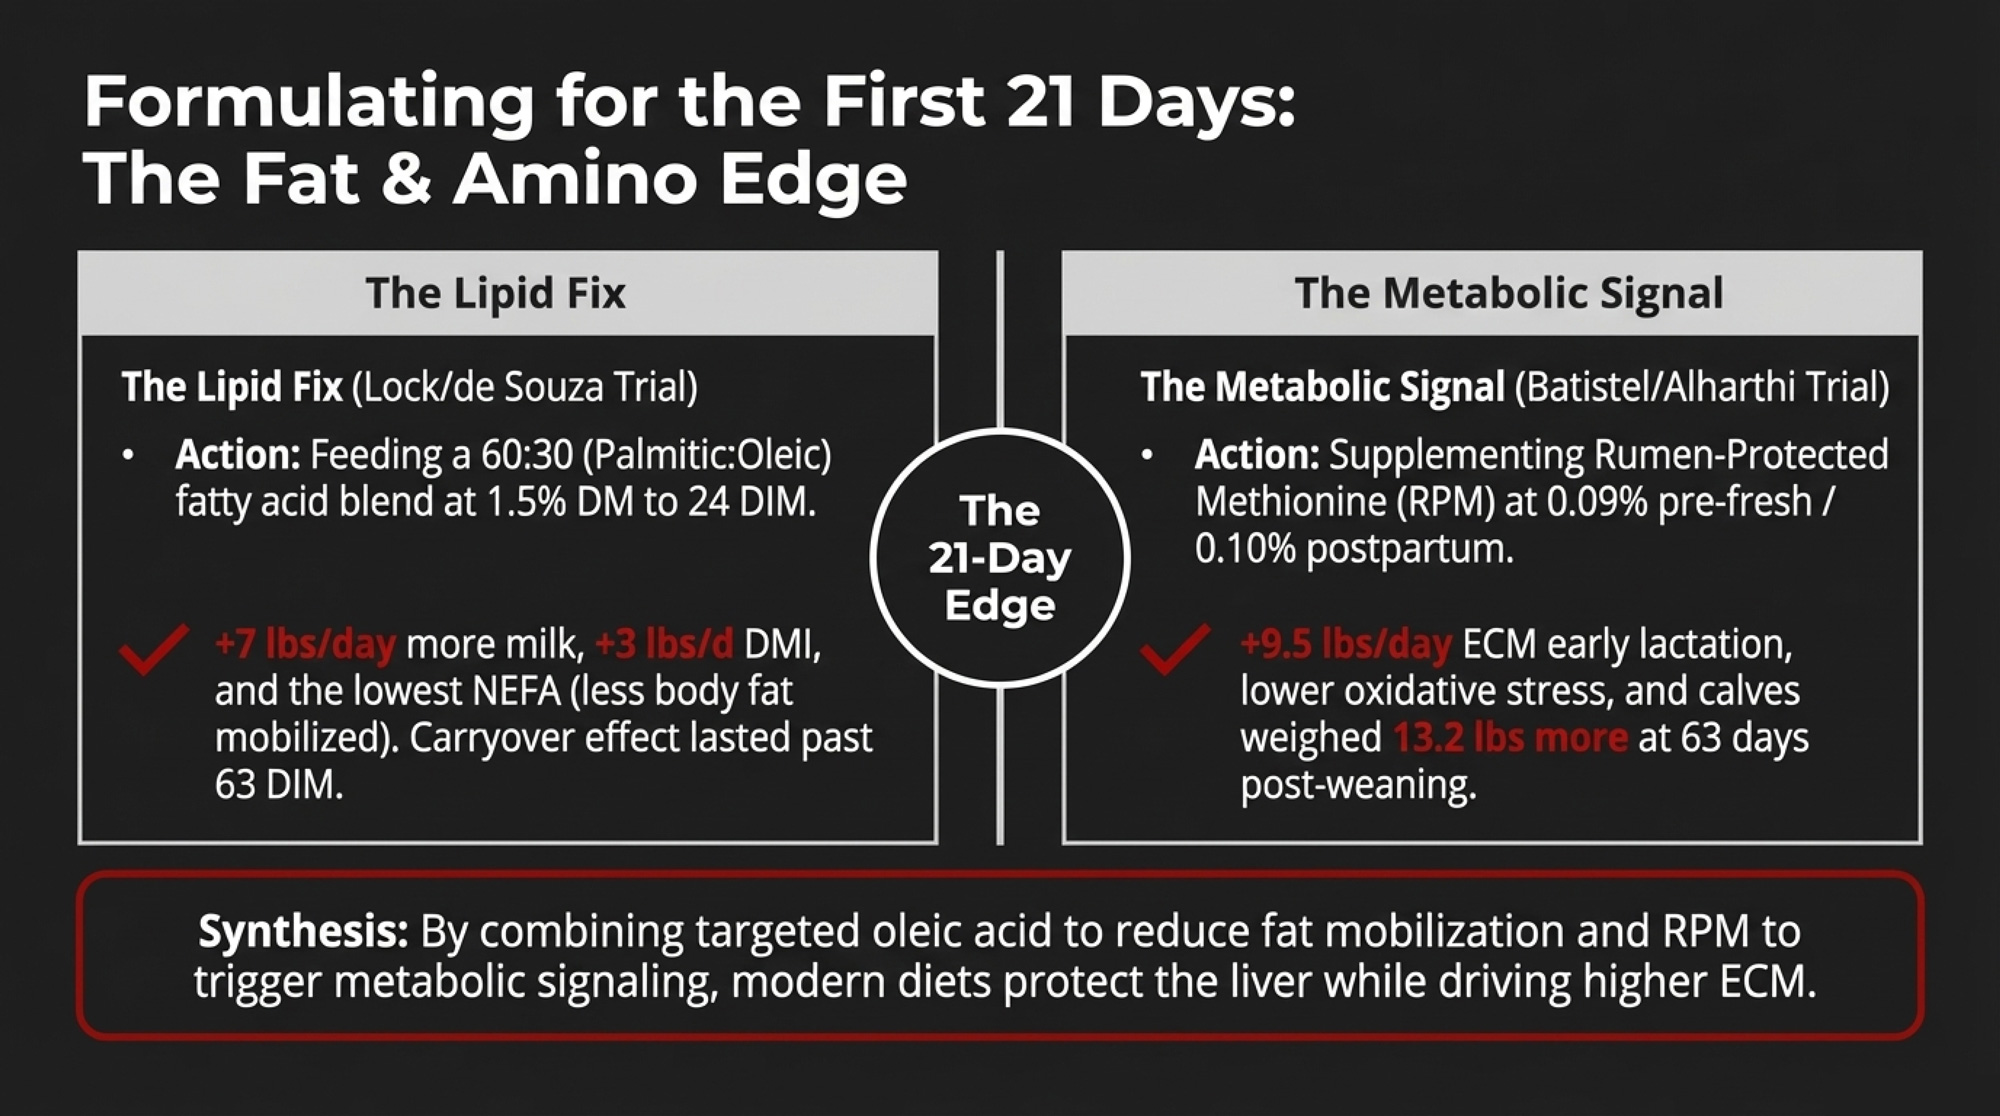
Adam Lock’s group at Michigan State ran a trial that has changed how a lot of nutritionists think about fresh cow fat. In de Souza’s study (JDS 104, 2021), fresh Holsteins were fed a fatty acid (FA) supplement at 1.5% of ration DM from calving to 24 DIM:
- Treatments: control (no FA) or FA blends with palmitic (C16:0) to oleic (C18:1) ratios of 80:10, 70:20, and 60:30.
- From 25 to 63 DIM, all cows went on the same diet with no supplemental FA.
Here’s what happened:
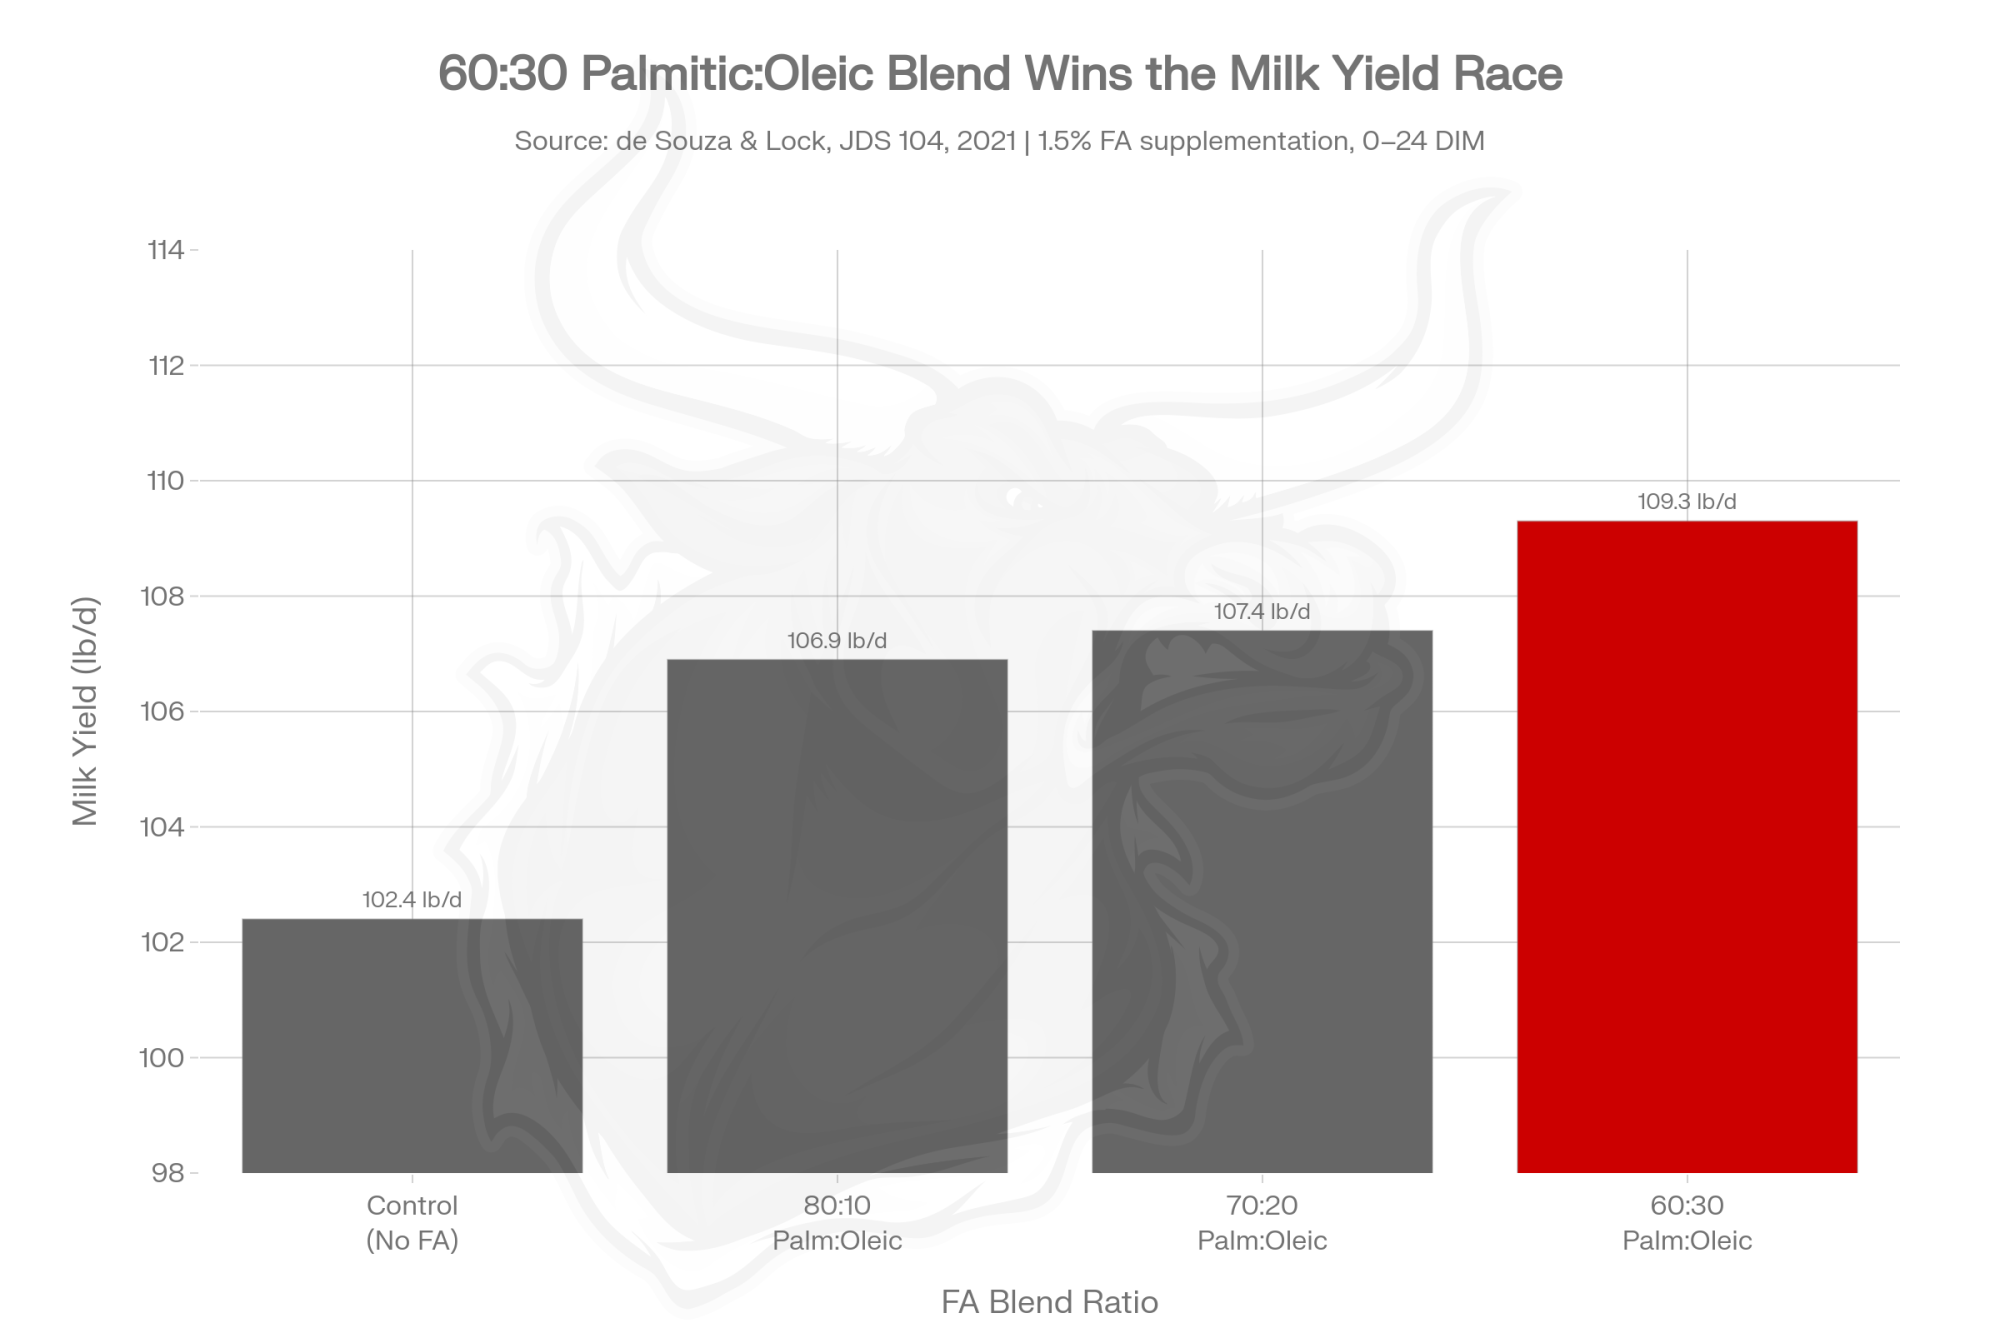
| Control | 80:10 | 70:20 | 60:30 | |
| Milk (lb/d) | 102.4 | 106.9 | 107.4 | 109.3 |
| DMI (lb/d) | 44.7 | 45.5 | 46.0 | 48.0 |
| Milk fat (lb/d) | 4.18 | 4.73 | 4.58 | 4.60 |
| NEFA (mEq/L) | 0.72 | 0.84 | 0.75 | 0.67 |
The 60:30 palmitic: oleic blend was the clear winner. Compared with the control, those cows:
- Gave about 7 lb/d more milk,
- Ate 3+ lb/d more dry matter, and
- Had the lowest NEFA, meaning less body fat mobilization.
From day 25 to 63, after every cow was on the same non‑supplemented ration, the FA‑supplemented cows kept a production edge. De Souza and Lock called it a carryover effect: those extra fatty acids in the first three weeks seemed to set a higher production level that stuck even after the supplement was pulled.
Will 1.5% fresh‑cow fat pencil in every herd? No. It depends on your base ration energy, fat prices, and how hard cows are mobilizing tissue. But if you’re running high‑producing pens and watching BCS slide hard in the first month, this is the kind of trial you and your nutritionist can design and measure on your own farm.
Methionine in Transition Cows: More Than Just Balancing a Ratio
Methionine used to sit in the “balance it with lysine, then move on” bucket. Work out of Illinois and Wisconsin has pushed it into a different category for transition cows.
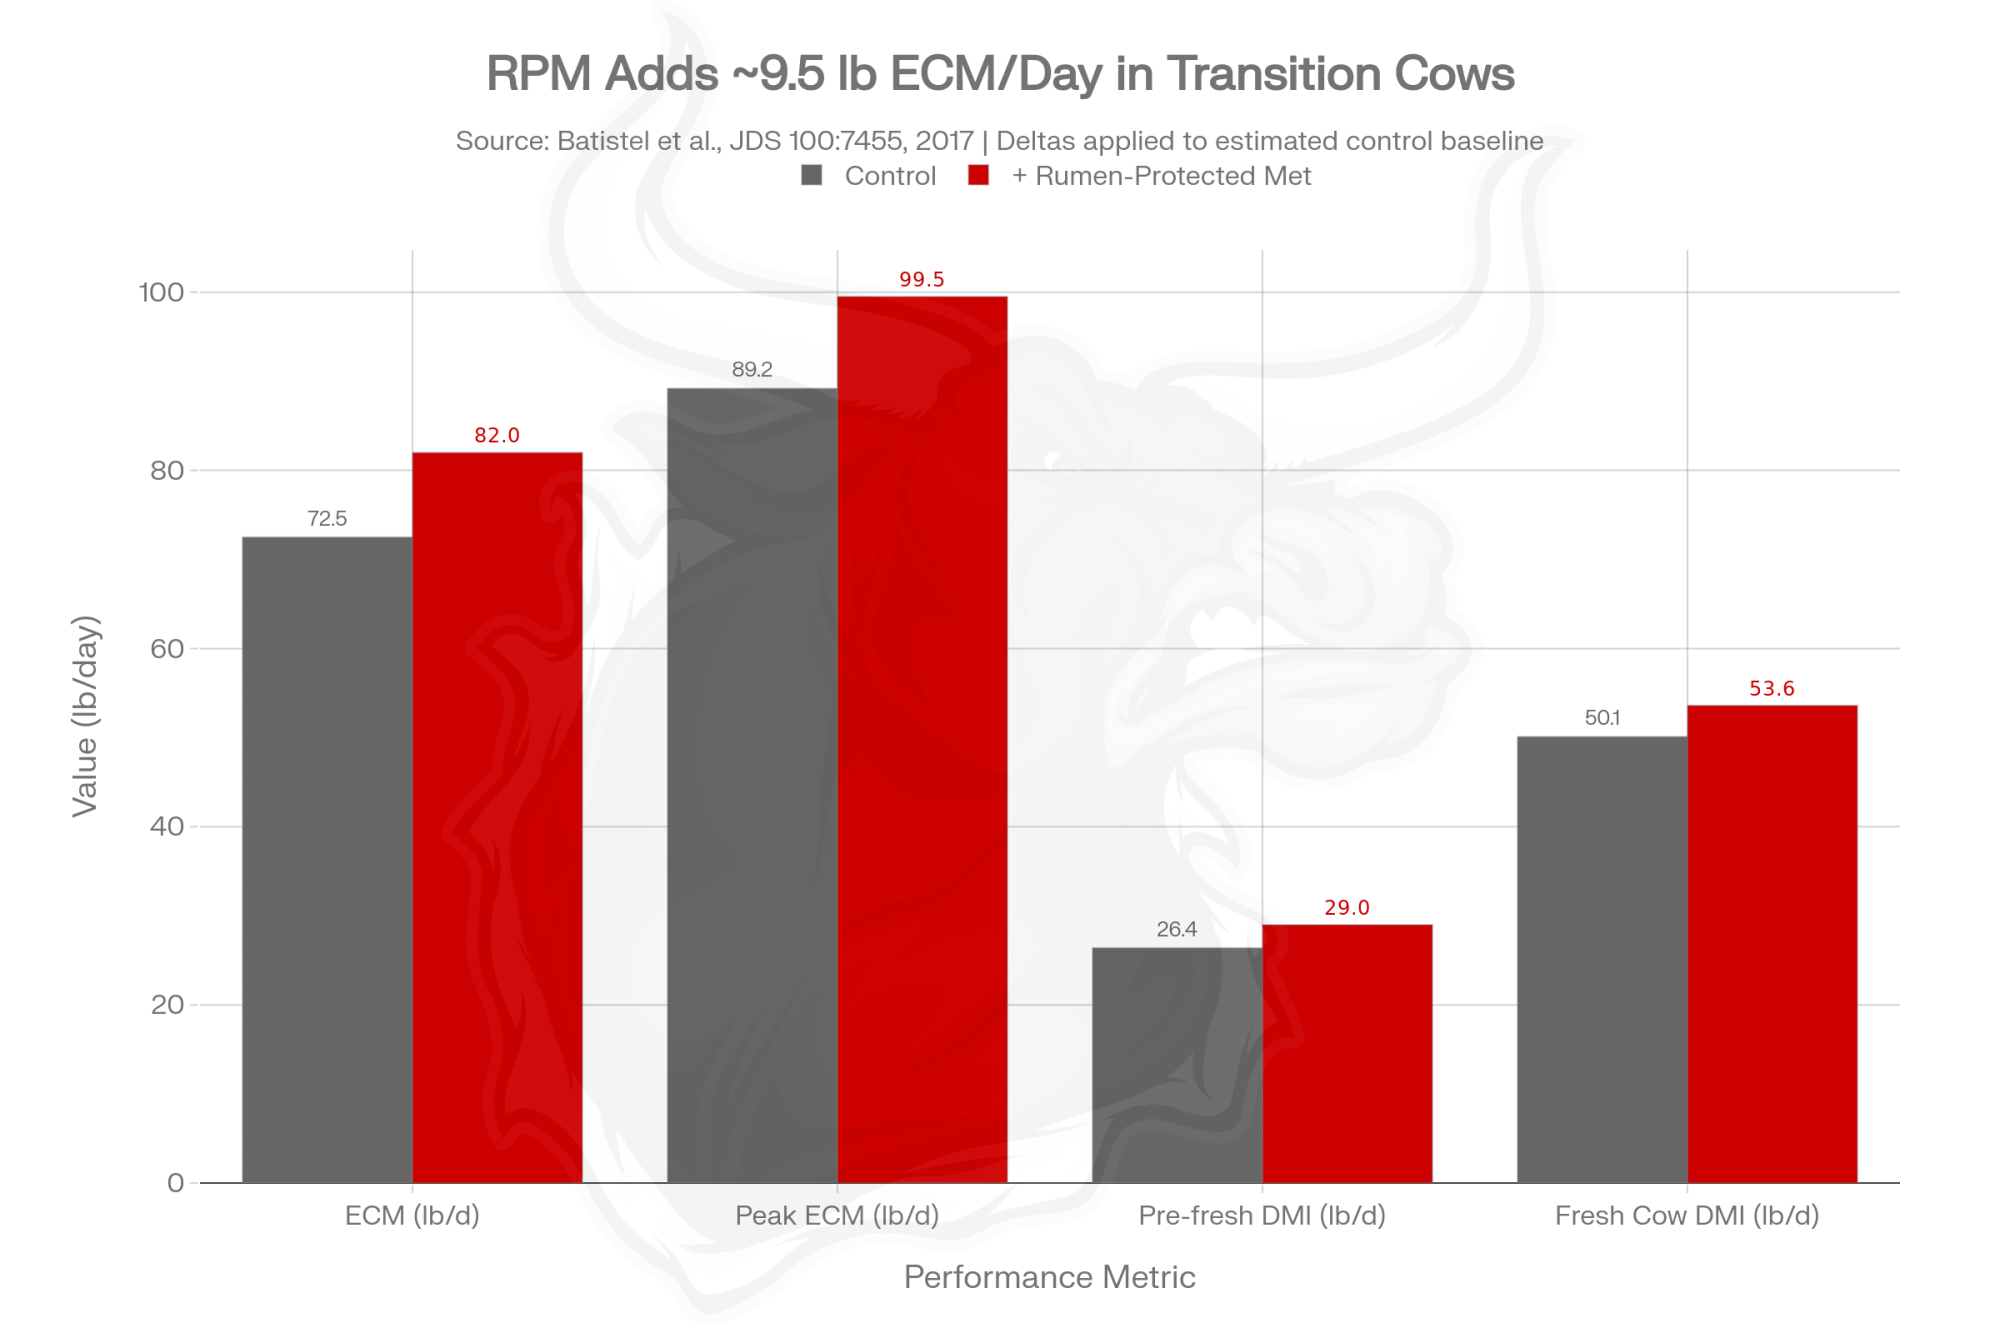
Batistel et al. supplemented Holstein cows with rumen‑protected methionine (RPM) at about 0.09% of DM pre‑freshand 0.10% postpartum in a series of trials (JDS 100:7455, 2017). Compared with controls, RPM cows:
- Produced about 9.5 lb/d more energy‑corrected milk in early lactation,
- Hit a peak ECM about 10.3 lb/d higher,
- Ate about 2.6 lb/d more DM pre‑fresh, and
- Ate 3.5 lb/d more DM as fresh cows, with peak DMI up 3.3 lb/d.
That’s not a rounding error. That’s a different gear in the most sensitive part of the lactation.
In a follow‑up trial (JDS 101:480, 2018), the same group dug into what was happening inside those cows. Methionine‑supplemented cows had:
- A higher liver functionality index,
- Better neutrophil function (more aggressive about killing bacteria), and
- Lower markers of oxidative stress and inflammation.
Then they followed the calves. Alharthi and co‑workers reported that calves from RPM‑supplemented dams weighed about 5 kg (11 lb) more at 42 days and about 6 kg (13.2 lb) more at 63 days post‑weaning (J Anim Sci Biotechnol9:78, 2018). They also documented meaningful changes in hepatic gene expression linked to energy metabolism.
That’s where the Illinois group started saying, “Methionine is more than just an essential amino acid.” In transition cows, it looks a lot like a metabolic signal.
NASEM 2021 still treats methionine strictly as an amino acid to meet MP requirements. The committee didn’t increase recommended methionine beyond what’s needed for milk yield and maintenance. Given the Batistel and Alharthi work, many field nutritionists now treat NASEM as the floor and add RPM on top when the economics make sense.
The Four-Herd Ketosis Data That Change How You Read “Fresh Cow Looks Fine”
Back to that 46% number, because it’s not a one‑off.
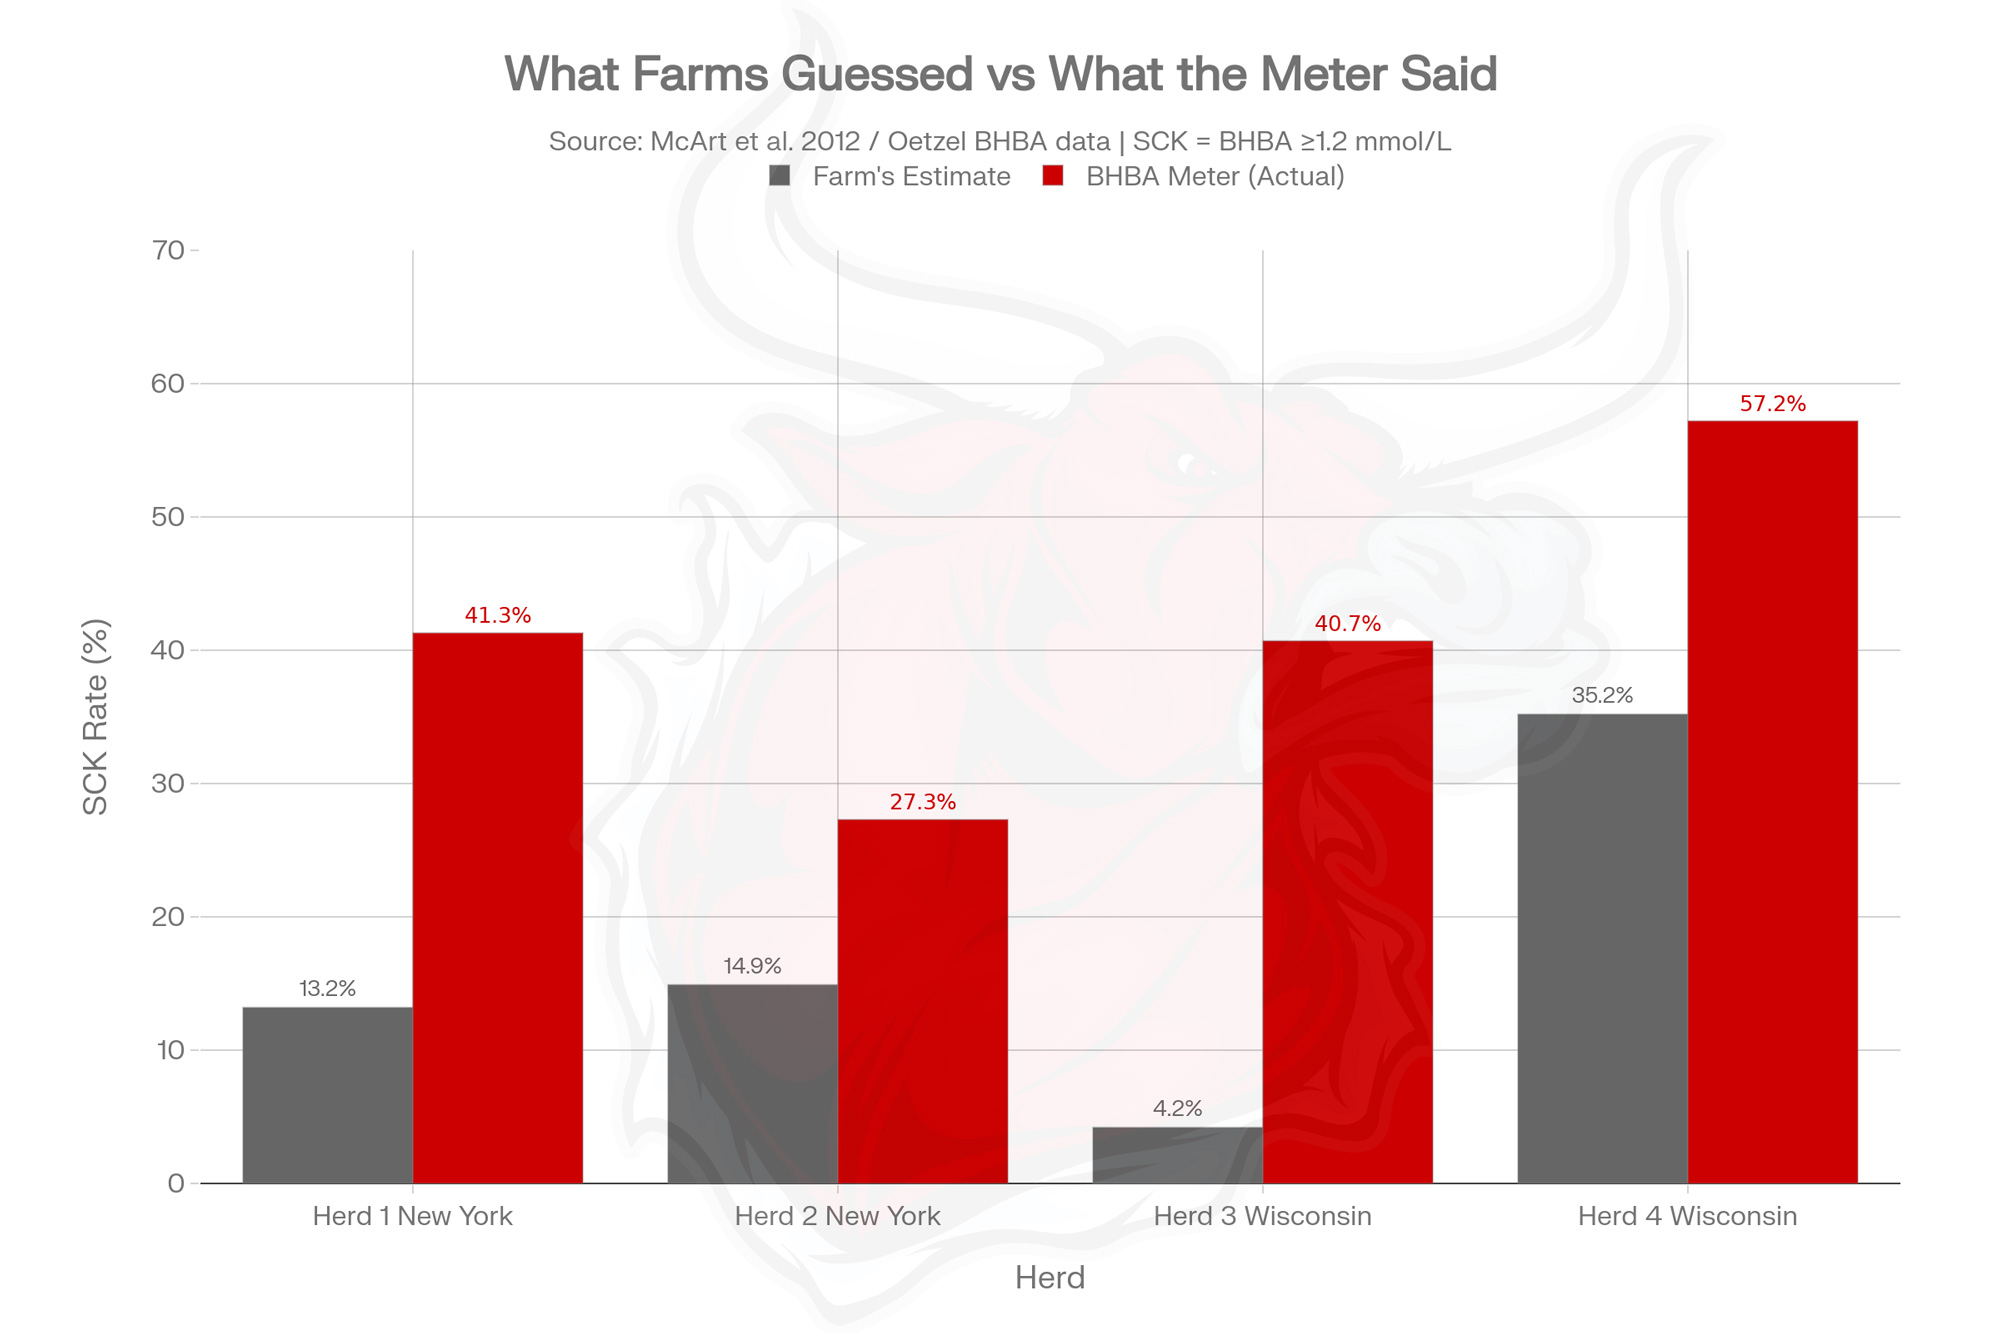
The four‑herd data set Hutjens uses in his classes comes from McArt et al. 2012 and Oetzel’s BHBA work. Here’s the snapshot:
| Herd | Location | Cows | Milk (lb/d) | SCK observed by farm | SCK measured (BHBA ≥1.2) |
| 1 | New York | 1,890 | 92.0 | 13.2% | 41.3% |
| 2 | New York | 1,827 | 92.0 | 14.9% | 27.3% |
| 3 | Wisconsin | 2,794 | 86.7 | 4.2% | 40.7% |
| 4 | Wisconsin | 4,106 | 77.0 | 35.2% | 57.2% |
Herd 3 is the one everyone remembers: 4.2% subclinical ketosis based on what the farm was catching vs 40.7% when every fresh cow was actually tested. Again, these weren’t disaster herds. Milk flowed. Cows walked.
Across all four herds, McArt et al. reported an overall prevalence of subclinical ketosis of 43.2%. Hutjens’ slide commentary rounds the field reality to about 46%. Either way, that “30% SCK” rule of thumb you still hear kicked around is on the low side, not the conservative side.
Wisconsin AgSource DHI data on 3,400 herds and 215,000 cows gives some real‑world weight to those numbers:
- First‑lactation cows with SCK had about a 22% chance of repeat ketosis in the next lactation.
- Older cows with SCK had about a 45% chance of repeat ketosis next time.
- Conception rate dropped by 6 points in first‑lactation cows and 2 points in older cows.
- Culling rates went up 6 points in heifers and 5 points in older cows.
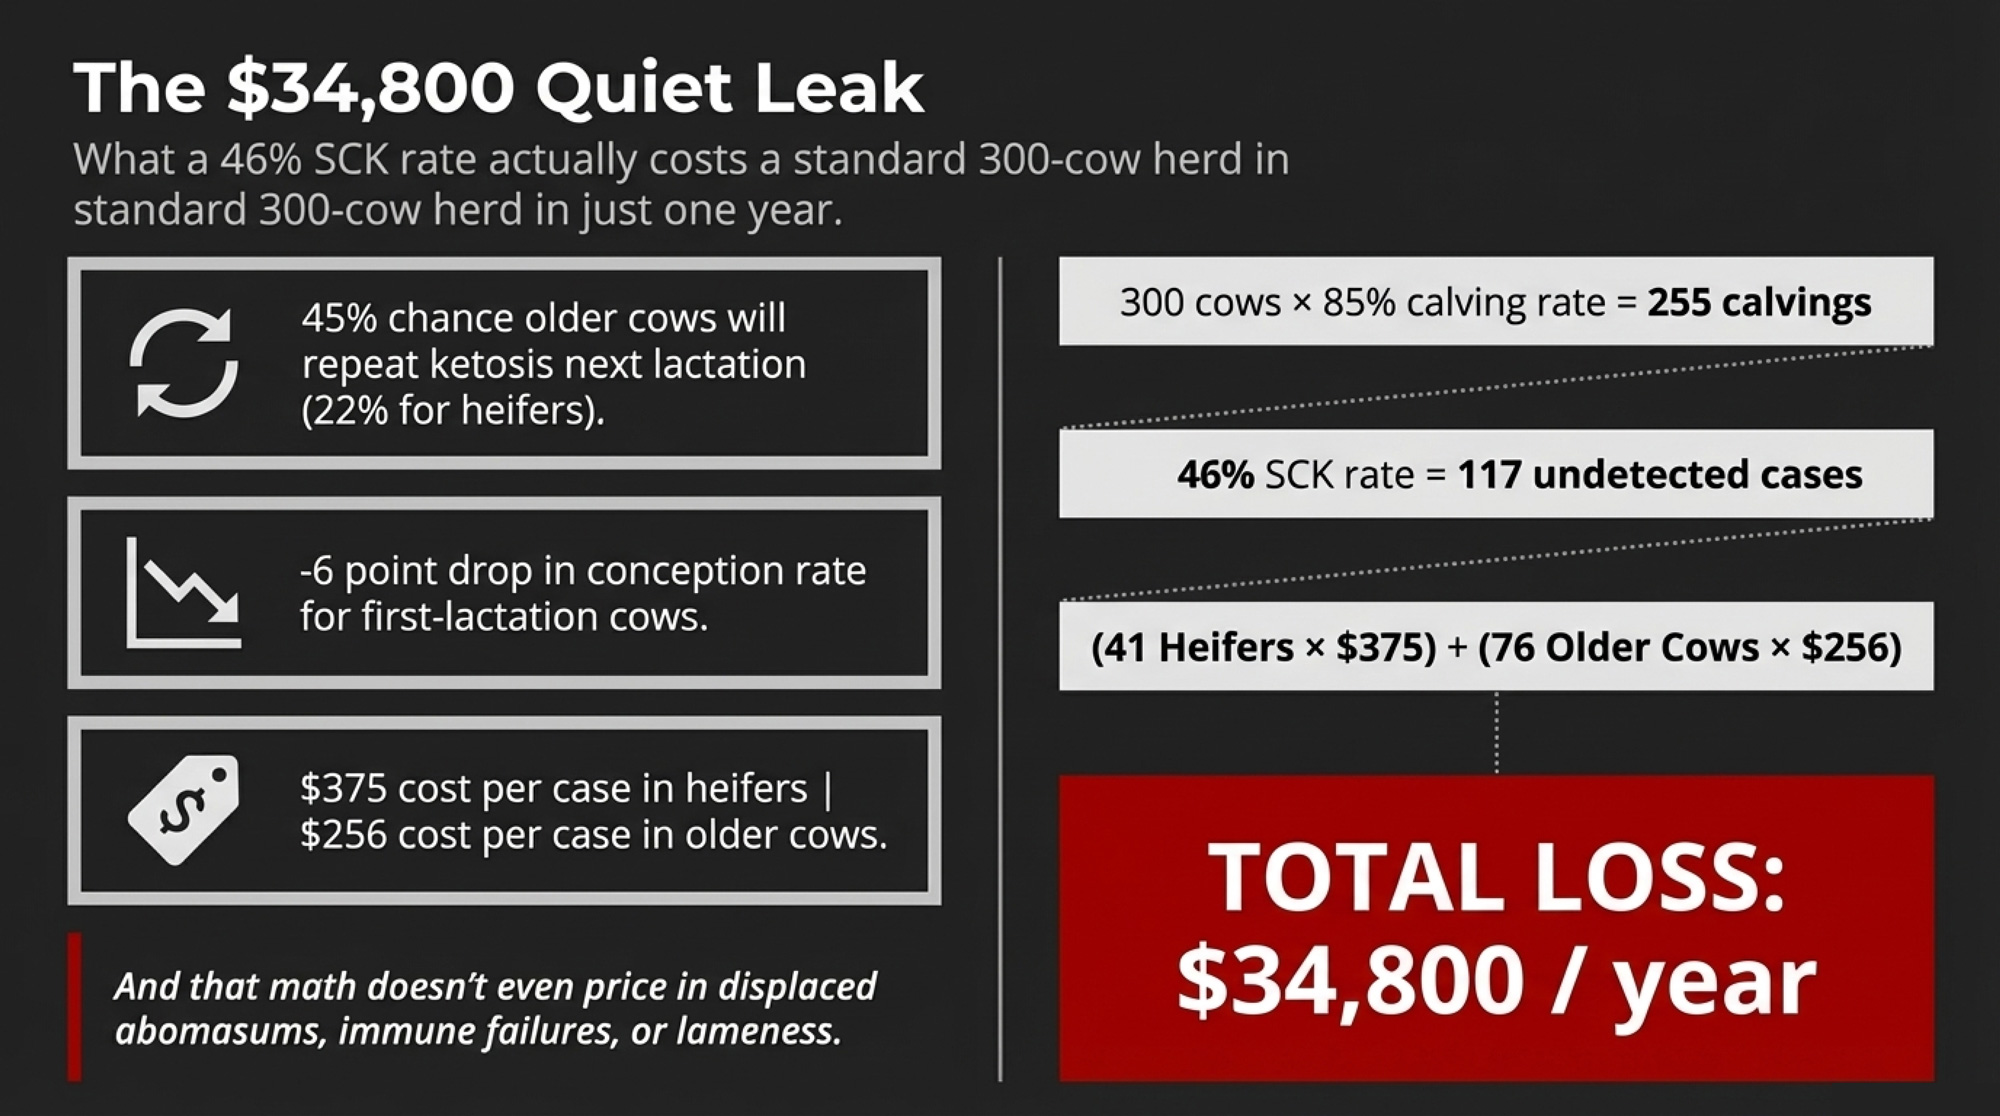
- Estimated cost per case: roughly $375 in first‑lactation cows and $256 in older cows.
Put that into your own barn math. Take a 300‑cow herd:
- 300 cows × 85% calving rate ≈ 255 calvings per year.
- If 46% of those calvings involve SCK, that’s about 117 cows with subclinical ketosis.
- Assume 35% heifers and 65% older cows: 117 × 0.35 ≈ 41 heifers, 117 × 0.65 ≈ 76 older cows.
- Cost: 41 × $375 + 76 × $256 ≈ $34,800 per year in SCK‑related losses.
That’s one year. On 300 cows. Without adding a single line for DAs, left shifts in immune function, or lameness.
BCS, Lameness, and Why the Digital Cushion Belongs in This Story
Cows melting after calving is almost background noise on many farms. You notice the very thin ones. The rest look like “fresh cows.”
Carvalho et al. followed Holsteins from calving through 21 DIM and grouped them by whether they gained or lostbody condition score in those first three weeks (JDS 97:3666, 2014). When they later looked at pregnancy per AI, cows that gained BCS had much higher pregnancy rates — on some farms, several times higher — than cows that lost condition. Barletta et al. (Theriogenology 104:30–36, 2017) told the same story: cows losing BCS after calving were less fertile than cows maintaining or gaining condition.
Then there’s the foot‑level math.
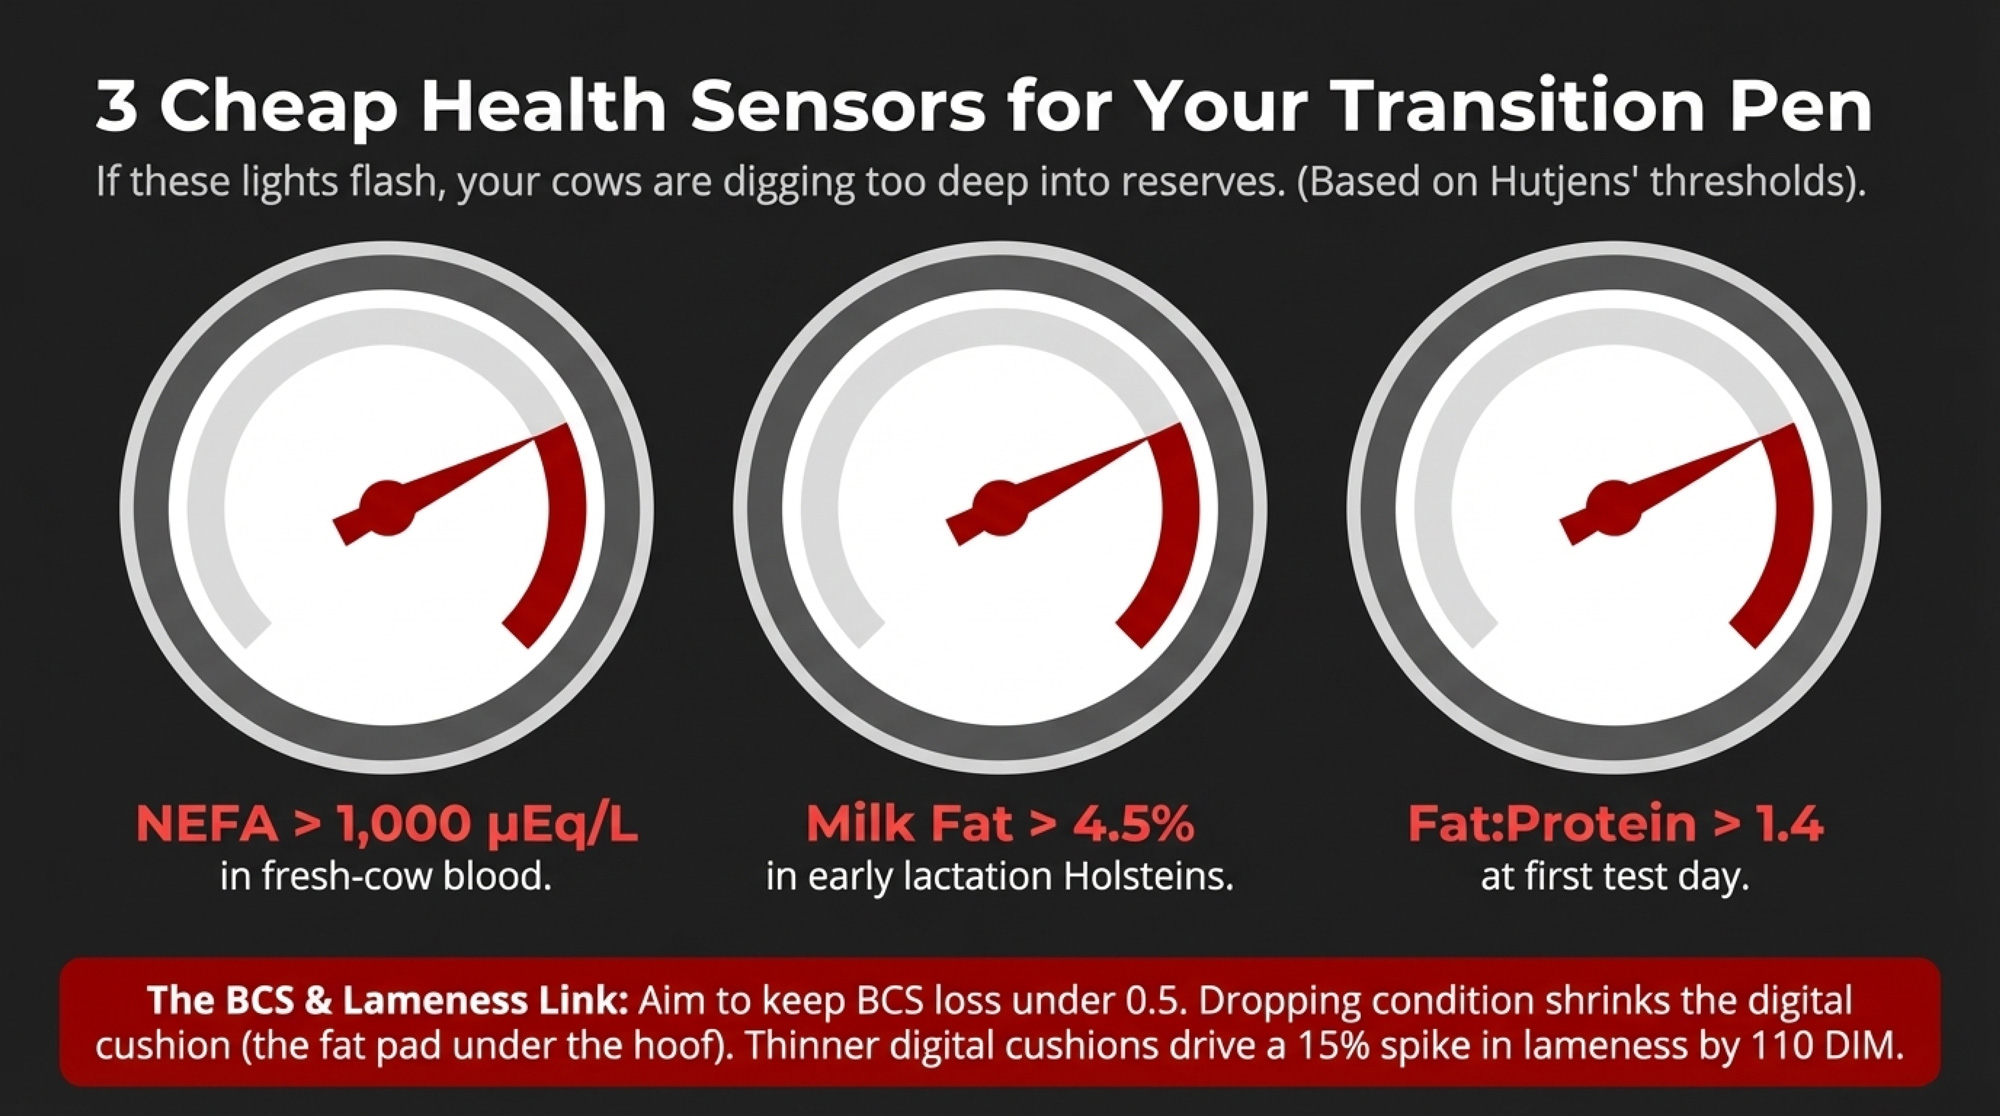
Lischer and Ossent’s work on digital cushion thickness (DCT) — the fat pad under the hoof — and lameness risk has been repeated and refined in more recent longitudinal studies. Cows with the thickest digital cushions had roughly 15% fewer lameness problems than those with the thinnest. DCT kept falling after calving and bottomed out around 110–120 DIM, roughly when cows finally return to positive energy balance.
Hutjens’ rule of thumb on that work is simple:
- Aim to keep BCS loss under 0.5 after calving.
- Treat any loss greater than 0.75 BCS in the first 60 DIM as a major red flag.
He backs that with three cheap warning lights:
- NEFA over 1,000 μEq/L in fresh‑cow blood.
- Holstein milk fat over 4.5% in early lactation.
- Fat: protein ratio above 1.4 (true protein) at first test.
Those numbers cost very little to look at, and they tell you whether your transition program is quietly pushing cows into a level of negative energy balance that sets up both ketosis and lameness.
What NASEM 2021 Changed — and Where the Field Has Already Moved Past It
NASEM 2021 (the update to NRC 2001) gave nutritionists a new baseline. Bill Weiss laid out several transition‑relevant changes that show up in the tables Hutjens uses.
Key NASEM 2021 updates for transition cows:
- Dry matter intake. Expected DMI is now adjusted for NDF and the pre‑calving drop. With a high‑straw, low‑energy dry diet, NASEM projects close‑up DMI around 1.8–2.0% of body weight, dropping to about 1.65%of body weight in the week before calving.
- Fetal requirements. Nutrient demand from the fetus is modeled starting at 150 days pregnant, rising on a curve to 280 days. There’s still no formal adjustment for twins, even though Hutjens notes 6–8% of older Holsteins carry twins.
- Protein for dry cows and heifers.
- Far‑off dry cows: 12% CP, 7.2% MP.
- Close‑ups: 13% CP, 8.6% MP.
- Springing heifers: 14% CP, 9.2% MP.
Weiss mentions a target of roughly 1,000 g MP one week pre‑calving. Field practice often layers another 100–200 g MP on top in high‑producing herds to cover colostrum and the fetal curve.
NASEM models did not show a clear benefit to adding more starch to close‑up diets, and the committee chose not to bump methionine requirements or include rumen‑protected choline (RPC) as a required nutrient. That’s the conservative job of a requirement system. It also explains why a lot of nutritionists now talk about “where we’re going beyond NASEM” in transition cows:
| Transition Topic | NASEM 2021 Standard | What Progressive Herds Are Doing | Red Flag if You’re Not |
|---|---|---|---|
| Close-Up MP | ~1,000 g/d one week pre-calving (8.6% MP) | 1,100–1,200 g/d in last 30 days to cover fetal growth & colostrum synthesis | Low-peak ECM in fresh cows; colostrum quality flags |
| Methionine | Met as required amino acid to meet MP only | Adding RPM on top of MP requirements based on Batistel 2017 (9.5 lb/d ECM gain) | Sluggish fresh-cow DMI; high oxidative stress markers |
| Rumen-Protected Choline | Not modeled as a required nutrient | Adding 13–14 g/d choline chloride (Ghaffari 2025 meta-analysis: +1.29 kg/d milk, +0.48 kg/d DMI) | High fatty liver incidence; poor early-lactation DMI recovery |
| Close-Up Energy | Low-energy, high-straw diet; no modeled benefit to added starch | Modest energy increase (slightly lower NDF, more starch/sugar) so cows arrive at calving adapted to high-energy ration | BCS crashes in first 21 DIM; fat:protein ratio >1.4 at first test |
| Fresh Cow Fat | No formal recommendation | 1.5% DM as 60:30 palmitic:oleic blend, 0–24 DIM (de Souza/Lock: +7 lb/d milk, lowest NEFA) | High NEFA (>1,000 µEq/L); poor body condition maintenance |
| Stocking Density | Not modeled | Max 80% of stalls; ≥30 in. bunk space in close-up pens (Michigan State: −1.6 lb milk/day per 10-pt overstock) | Heifers underperforming vs. genetic potential at peak |
| SCK Threshold | No formal monitoring protocol | BHBA ≥1.2 mmol/L cow-side meter, every fresh cow 5–14 DIM, 30-day audit minimum | You’re guessing 4%; the meter may say 40.7% |
NASEM’s job is to be slow and conservative. Yours is to know where that line sits and then, with your own numbers, decide where stepping beyond it makes sense.
What This Means for Your Operation
You don’t fix transition cows by copying a ration on Facebook. You fix it by measuring, then making decisions in your own pens. Here are a few places to start.
- For the next 30 days, stop guessing on subclinical ketosis — measure it.
For one full month, pull BHBA on every fresh cow between 5 and 14 DIM with a cow‑side meter. Don’t cherry‑pick the “sick” ones. Then compare the actual SCK rate to what you and your team would’ve guessed. If your gap looks anything like Herd 3’s 4.2% vs 40.7%, you know you’ve got a program problem, not a cow problem. - Audit your close‑up pen with a notebook, not just your eyes.
Count stalls. Count headlocks. Count cows. If your close‑up pen is consistently running much above 80% of stallsor cows have less than 30 inches of bunk space, accept that no supplement will fully outrun that stocking penalty in early lactation. That’s a facilities-and-grouping decision, not a magic additive. - Let BCS, loss, fat, protein, and NEFA be your cheap health sensors.
Pull your first test day data. If Holstein fresh cows are averaging fat: protein ratios over 1.4 or fat over 4.5%, and you’re seeing average BCS losses over 0.5 in the first 60 DIM, treat that as proof your cows are digging too deep into reserves. That’s your cue to re‑look at dry‑off BCS targets, close‑up intake, and time in the fresh pen. - Run one clean pen trial on methionine or fresh‑cow fat.
Take the Batistel methionine and de Souza/Lock fat data to your nutritionist. Pick one pen where records are solid, and agree on a 60–90 day window where that pen gets RPM or a 60:30 palmitic: oleic FA blend at 1.5% of DM. Track ECM, DMI, metritis, and ketosis against your own baseline. If it pays in your numbers, you’ve earned the budget. If it doesn’t, you’ve got real data instead of a brochure. - Tilt your bull list a notch toward health, where the pen keeps biting you.
If you’re constantly fighting ketosis, milk fever, or lameness, don’t try to solve it only in the feed alley. Push a little more weight toward metabolic and health traits in the index you already trust. It’s not an overnight fix, but your future transition cows can be a lot more forgiving than some of the cows you’re managing now.
Key Takeaways
- If you do one thing in the next 30 days:
Test BHBA on every fresh cow once between 5 and 14 DIM for a month. If your real SCK rate comes back anywhere near the 40–46% range those four herds saw, you’ll know this isn’t about “a few bad actors” — it’s a herd‑level pattern you can actually manage. - If your fresh cows are losing more than 0.5 BCS by 60 DIM or your fat: protein ratio is over 1.4:
Treat that as a system problem, not a cow problem. Before you add another product, check stocking rate, group moves, and whether your close‑up ration really lines up with what NASEM says those cows can eat in the last 7–10 days. - If you’re on the fence about methionine, fat, or choline in transition diets:
Don’t buy a “program.” Design a trial in one pen with good records, then decide based on your ECM, DMI, and disease numbers over 60–90 days whether those additives earn a spot in your budget.
The Bottom Line
The four herds in the Oetzel/McArt project didn’t suddenly become “bad” the day the BHBA meter came out. The only thing that changed was that, for a few weeks, somebody measured instead of guessing. If you did the same in your fresh pen next month, would the numbers back up what you already believe about your transition cows — or hand you the kind of 46% shock that forces you to change how you feed and manage the most important group on your farm?
Complete references and supporting documentation are available upon request by contacting the editorial team at editor@thebullvine.com.
Learn More
- The $500 Transition Gap: Why Your Neighbor’s Fresh Cows May Outperform Yours by Next Winter – This breakdown exposes the massive profit spread between blanket protocols and targeted transition care. It delivers a proven roadmap to capture an extra $200–$500 per cow by identifying high-risk animals before they crash.
- More Milk, Fewer Farms, $250K at Risk: The 2026 Numbers Every Dairy Needs to Run – This analysis reveals the brutal margin math facing 500-cow dairies in 2026. It arms you with the strategic positioning needed to navigate heifer shortages and shifting milk pricing before the next industry reset hits.
- The Next Frontier: What’s Really Coming for Dairy Cattle Breeding (2025–2030) – Explore how AI and newborn genomic testing are fundamentally rewriting the dairy breeding playbook. This disruptive look at 2025–2030 technology shows you how to slash labor costs by 70% while maximizing feed efficiency.
 The Sunday Read Dairy Professionals Don’t Skip.
 The Sunday Read Dairy Professionals Don’t Skip.
Every week, thousands of producers, breeders, and industry insiders open Bullvine Weekly for genetics insights, market shifts, and profit strategies they won’t find anywhere else. One email. Five minutes. Smarter decisions all week.


