


If you haven’t checked your 12‑month basis, you don’t actually know which side of the $11B dairy map you’re on.
Executive Summary: More than $11 billion in new U.S. dairy plants across 19 states is quietly deciding which herds get competitive milk cheques and which ones fight a losing basis battle. The article maps out how growth corridors tied to new cheese‑and‑whey complexes in places like Dodge City, Lubbock, Franklinville, and Pasco are pulling ahead, while slow‑investment basins like New Mexico see shrinking cow numbers, fewer farms, and tougher processor leverage. It uses hard numbers—like an $384,000 per year basis hit for an 800‑cow herd and the spread between cheap dry whey and high‑value WPC‑80—to show how product mix and whey processing now drive a big chunk of your profitability. You’ll see exactly how different plant types (pizza cheese, yogurt, butter/powder, cheese + whey) value butterfat and protein, and get a practical checklist to align your genetics, feeding, and contracts with the plant you’re actually shipping to. For Canadian producers, the piece also lays out how the 2026 USMCA review and under‑used dairy TRQs—worth about 3.6% of the Canadian market or roughly $200M a year—could affect quota‑backed balance sheets. It finishes by pushing mid‑career owners to run their 12‑month basis, talk honestly about their “enough” number, and decide whether to double down, adapt, or design an exit before the basin makes that decision for them.

Here’s what’s really going on in dairy right now: the value of your milk cheque has less and less to do with how hard you work, and more and more to do with where your milk goes and what your processor turns it into after the truck leaves your lane.
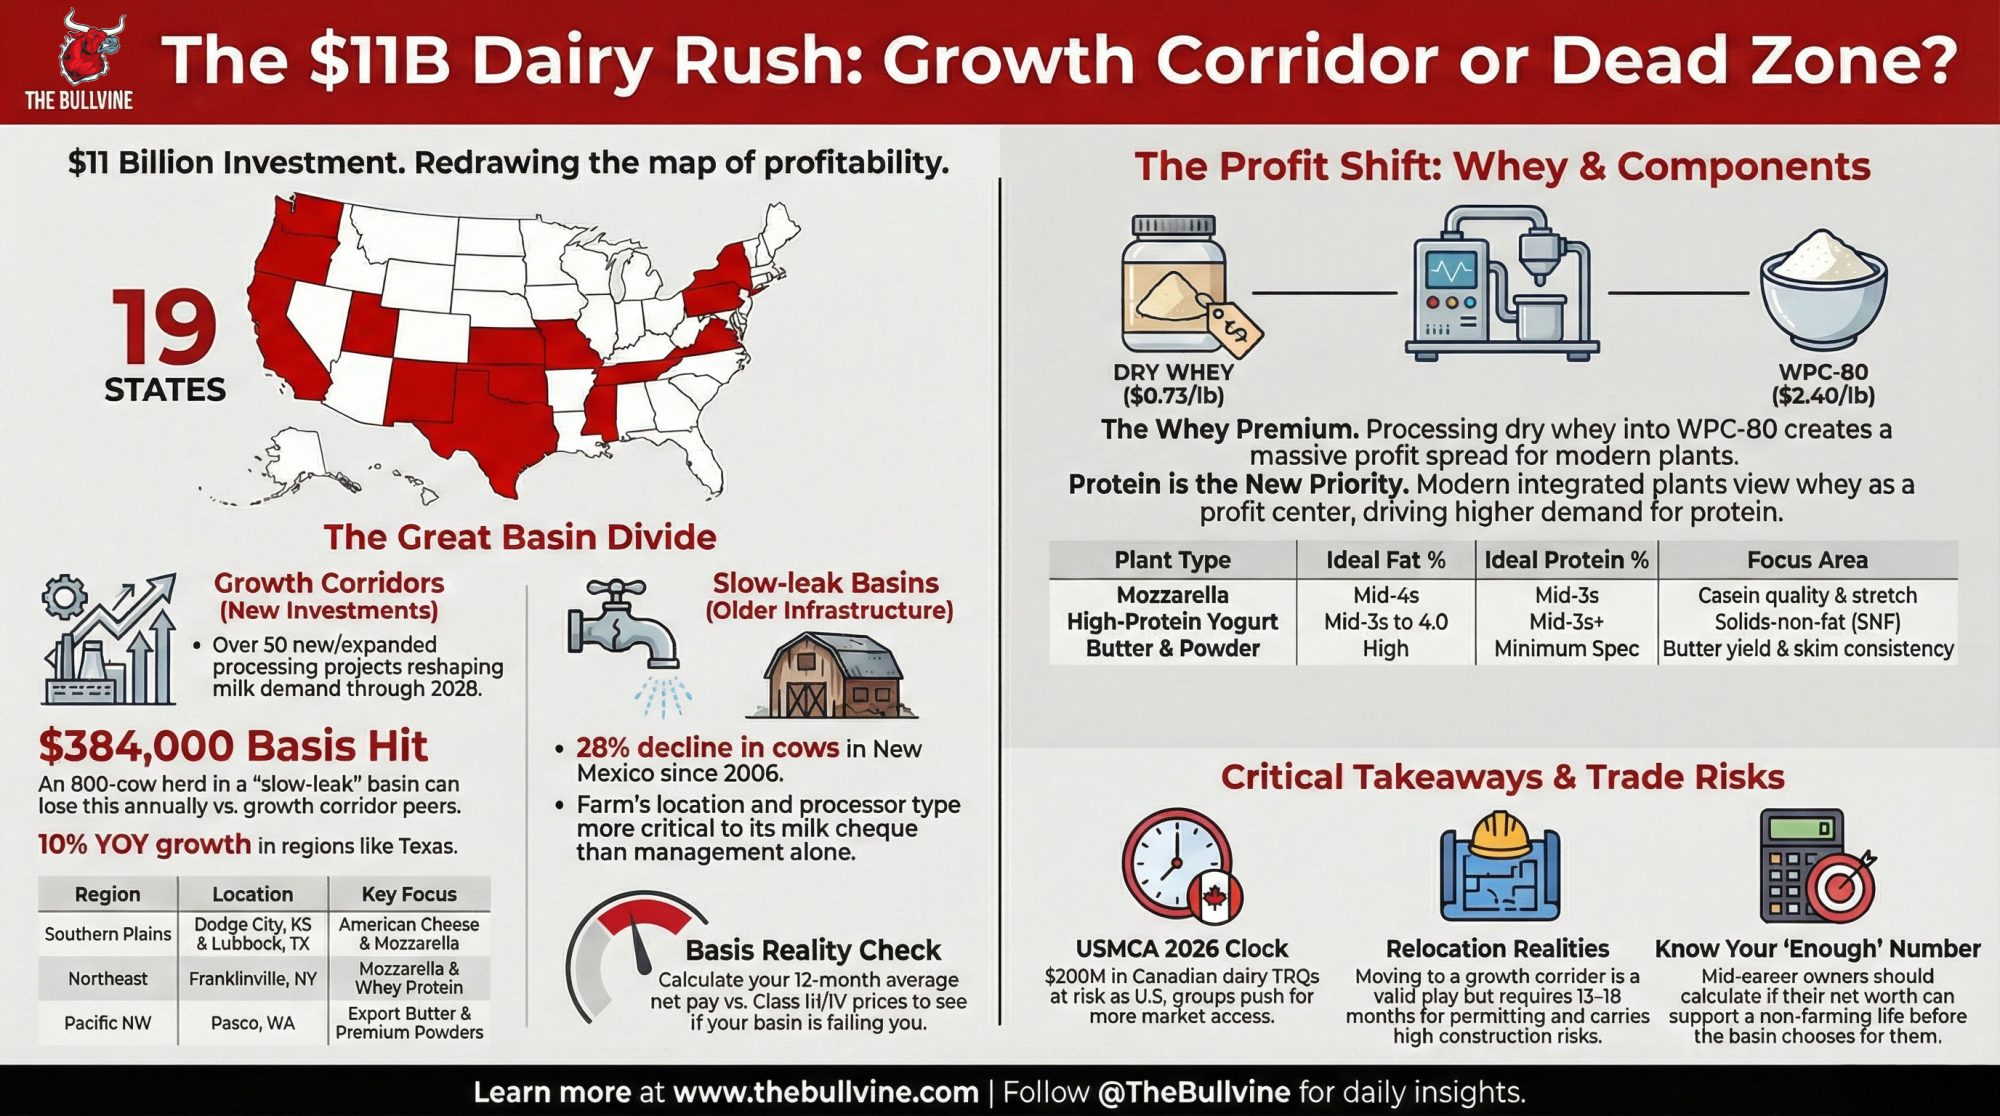
In October 2025, the International Dairy Foods Association pulled the curtain back on something a lot of us could feel but hadn’t seen spelled out: U.S. dairy processors are planning more than 11 billion dollars in new and expanded manufacturing capacity across 19 states, spread over more than 50 projects between 2025 and early 2028. That’s not just a few new dryers. That’s a complete reshaping of where milk will be in demand and which basins will spend the next decade fighting basis.
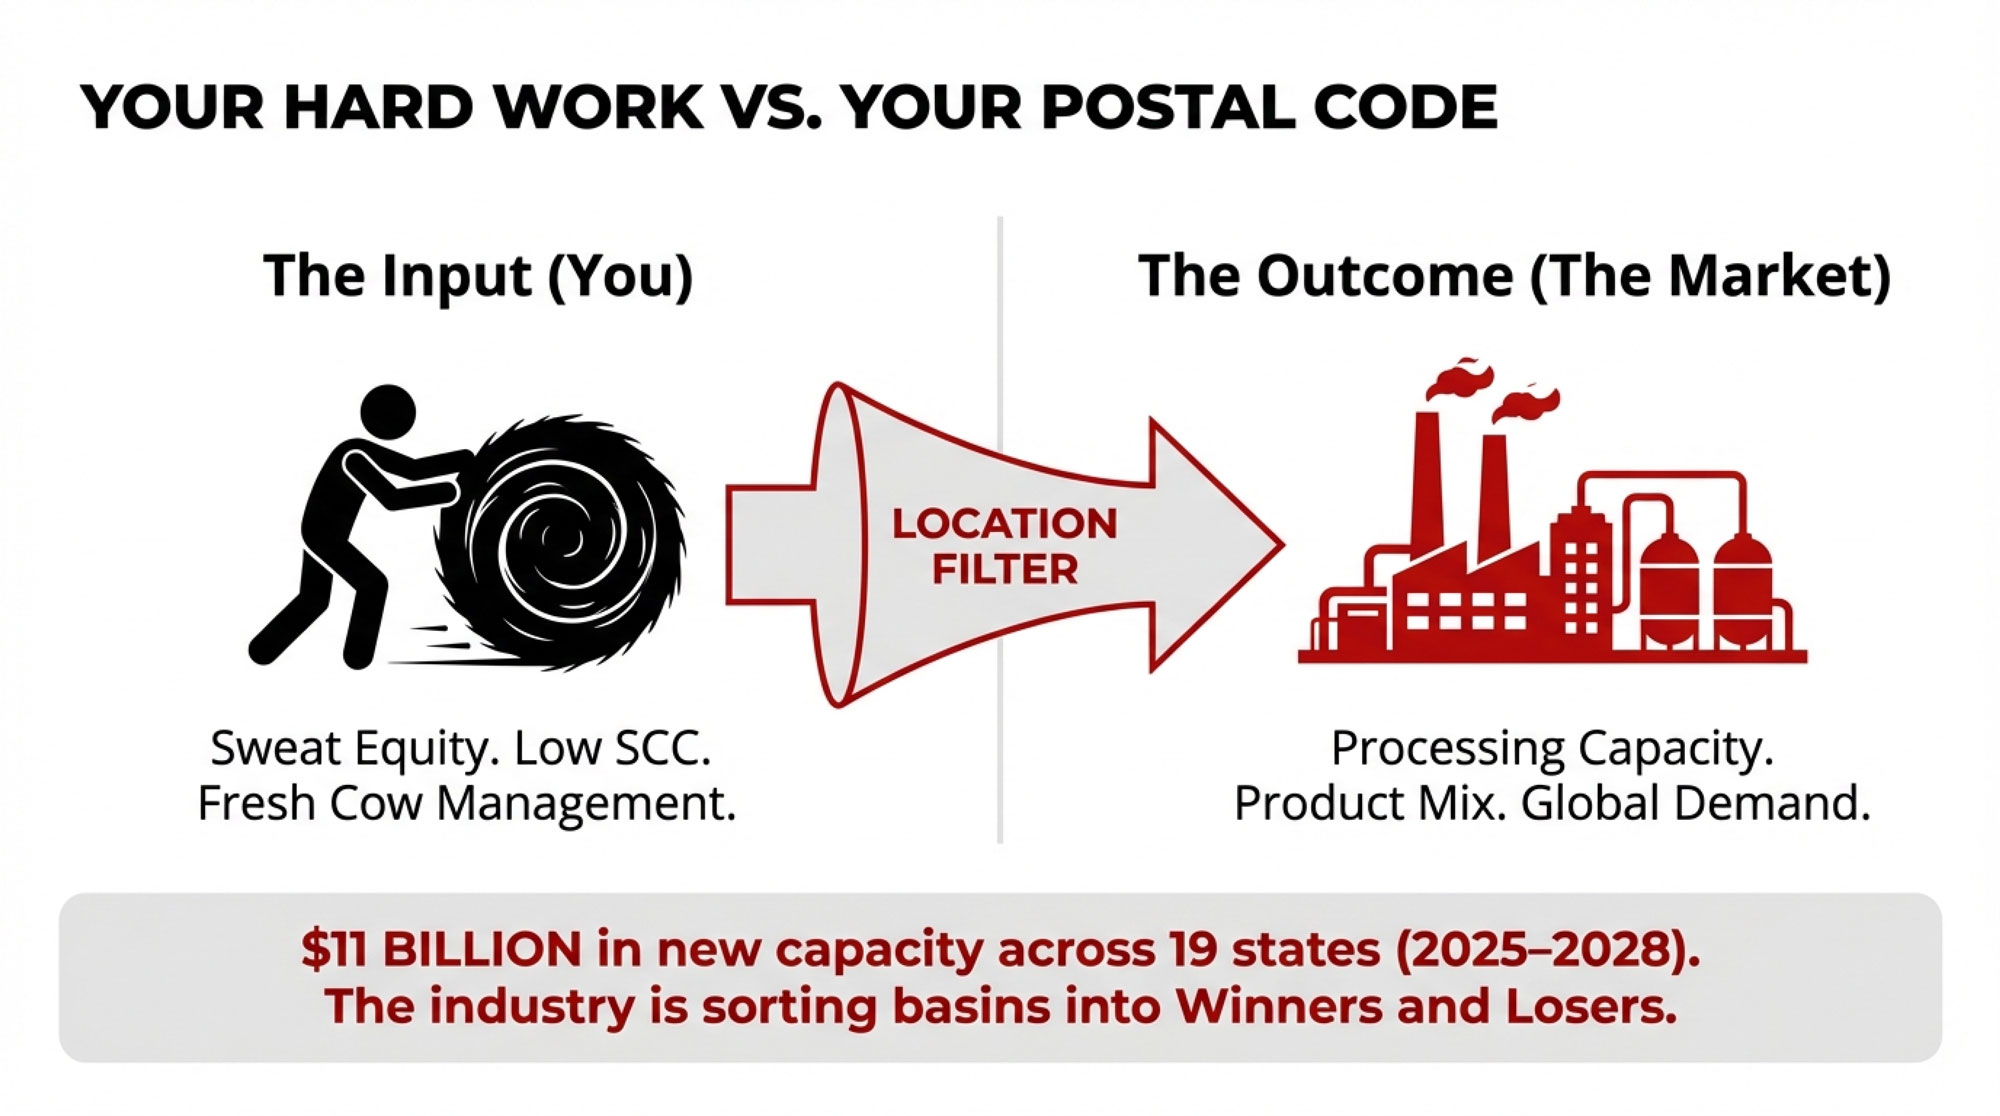
What producers are finding is simple: if your milk cheque has been stubbornly a dollar or two per hundredweight behind what a peer in another state or province is getting—even when your butterfat performance, SCC, and fresh cow management look just as good—there’s a good chance it’s not “you.” It’s your basin.
Let’s walk through where the new stainless is going, what those plants really want from your cows, and how that ties into contracts, quota, and the decisions sitting on your kitchen table for the next five to ten years.
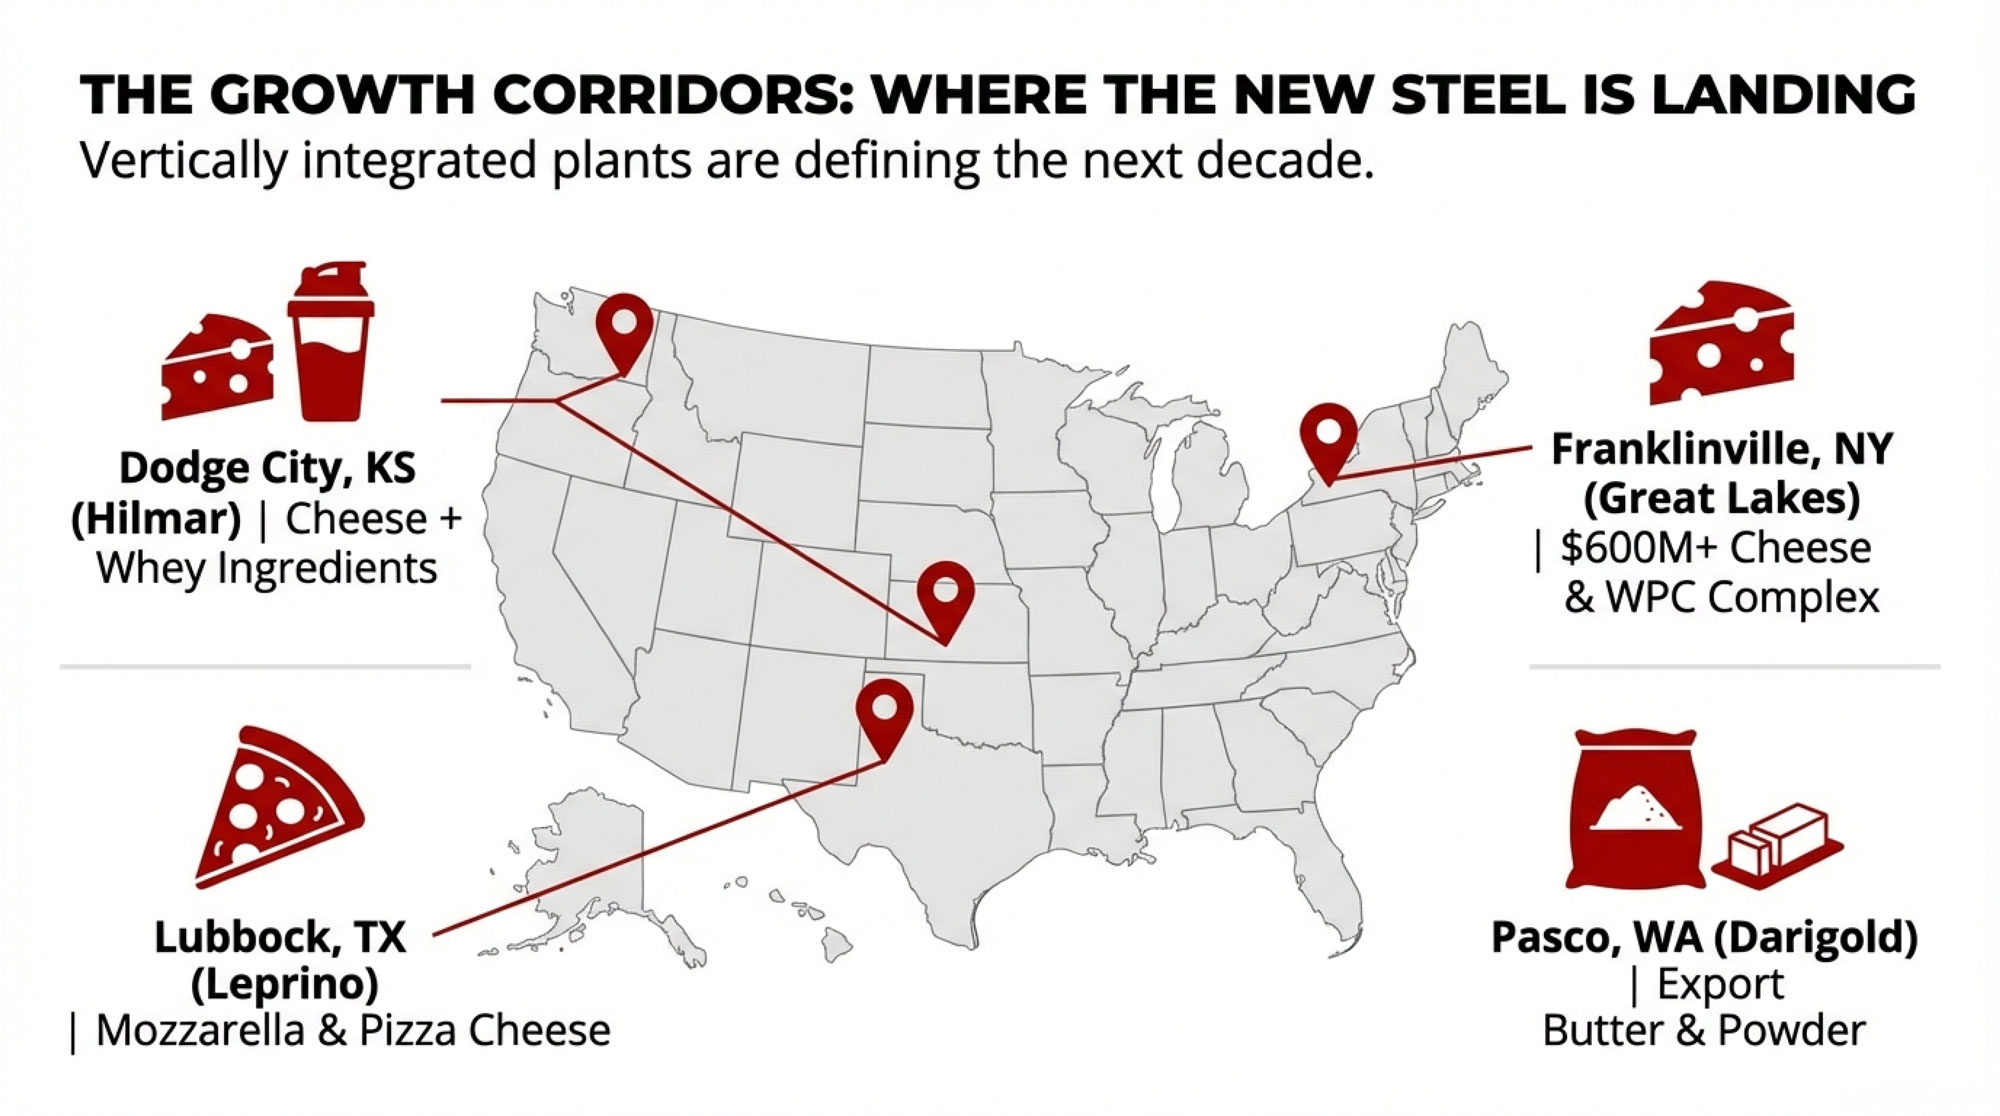
Where the New Steel Is Landing – and Where It’s Not
Looking at this trend across the map, some regions are clearly being picked as growth corridors. Others are being left to age out quietly.
| Plant Name | Region | Est. Project Start | Est. Operational | Product Focus |
|---|---|---|---|---|
| Hilmar Dodge City | High Plains | Q2 2025 | Q3 2027 | Cheese + Whey Ingredients |
| Leprino Lubbock | High Plains | Q3 2025 | Q4 2026 | Mozzarella / Nutrition |
| Great Lakes Franklinville | Northeast | Q1 2025 | Q2 2027 | Mozzarella + WPC |
| Darigold Pasco | Pacific NW | Q4 2024 | Q2 2026 | Butter + Powders |
| [+46 Additional Projects] | Various | 2025–2027 | 2026–2028 | Mixed |
Southern and High Plains: Dodge City and Lubbock
On the Southern and High Plains, the money is not subtle.
- In Dodge City, Kansas, Hilmar Cheese is constructing a large-scale cheese and ingredient complex designed for American‑style cheeses and whey‑based ingredients. State and company documents point to milk intake measured in the millions of pounds per day, feeding both domestic and export markets. This isn’t just “more cheese vats”; it’s a vertically integrated cheese-and-whey plant built to squeeze value out of every solid in your milk.
- Over in East Lubbock, Texas, Leprino Foods’ new plant is ramping up. Economic development filings estimate about 300 jobs and describe a product mix centered on mozzarella and nutrition‑type ingredients for global pizza and foodservice channels. A Bullvine analysis of USDA data showed Texas’ milk output up around 10 percent year‑over‑year heading into 2025, enough to move the state into third place nationally behind California and Wisconsin. That growth isn’t happening in a vacuum; it’s anchored in plants like this.
Northeast and Great Lakes: Franklinville and the Yogurt Belt
Shift to the Northeast and Great Lakes.
- In Franklinville, New York, Great Lakes Cheese is building a roughly 600,000‑square‑foot facility designed to process about 4 million pounds of milk per day into mozzarella, provolone, cheddar, and whey protein concentrate, complete with on‑site shredding and slicing. Local reporting notes that cost estimates have climbed from around 500 million dollars to more than 600 million as steel, concrete, and labour prices rose over the course of the build. When someone puts that kind of money into a plant, they’re betting big on that draw area for decades.
- Around the broader Upstate New York “yogurt belt”, multiple plants have spent more than a decade building out Greek and high‑protein cultured capacity to ride the shift toward higher‑protein dairy snacks. Those investments show up every time you walk past the Greek yogurt aisle.
Pacific Northwest: Pasco and Export Fats
Out west, the Pacific Northwest is making its own moves.
- Darigold’s new plant near Pasco, Washington, is described in company and business reports as a high‑hundreds‑of‑millions‑of‑dollars project aimed at producing high‑grade butter and premium milk powders, including infant‑nutrition‑grade products, with a heavy export focus. The co‑op has been clear: this plant is designed for global markets, not just to mop up local oversupply.
Taken together, these plants tell you where processors want to be: high-volume basins with room to grow, close to cheap feed and logistics, and able to supply cheese, whey ingredients, butter, and powders that compete in export markets.
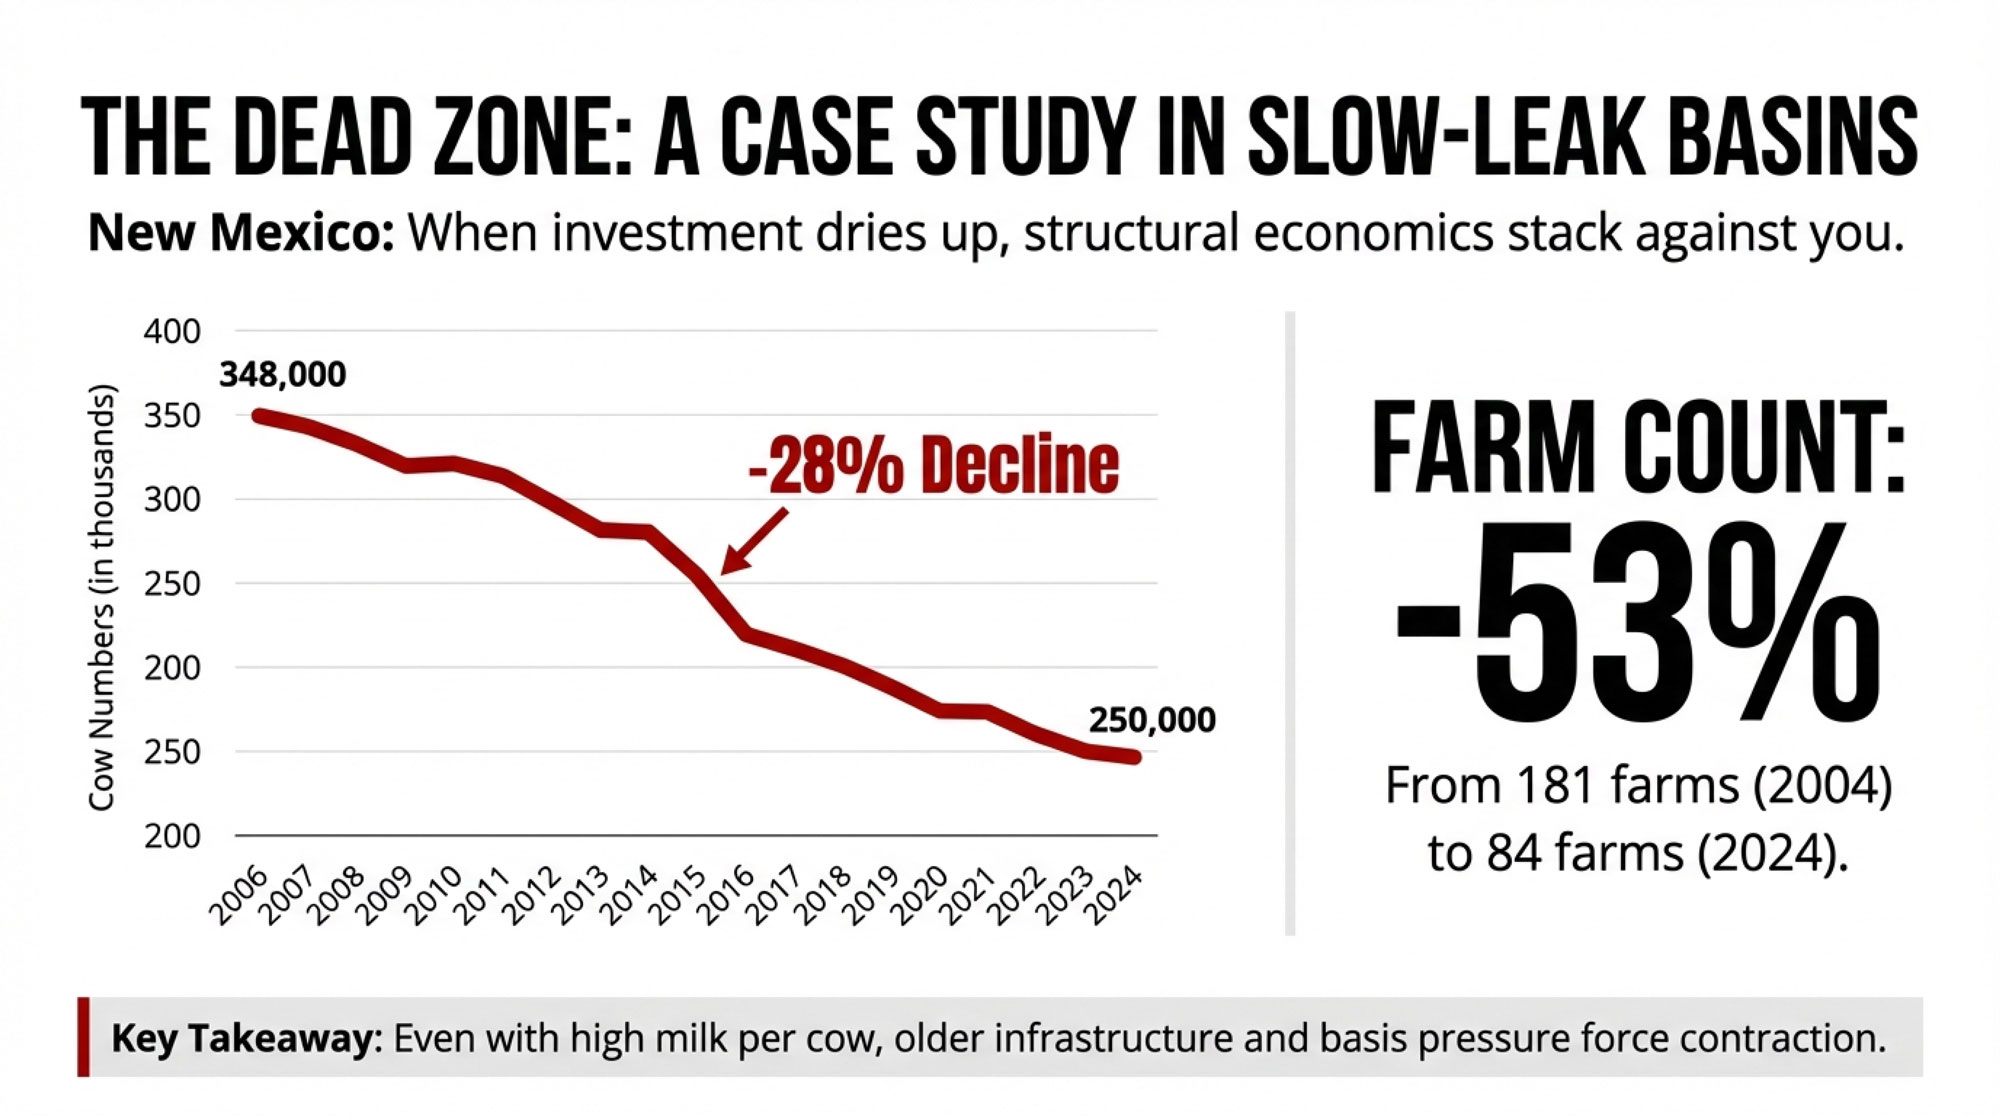
Slow-Leak Basins: New Mexico as a Case Study
Then there are regions where the story is quietly running in the opposite direction.
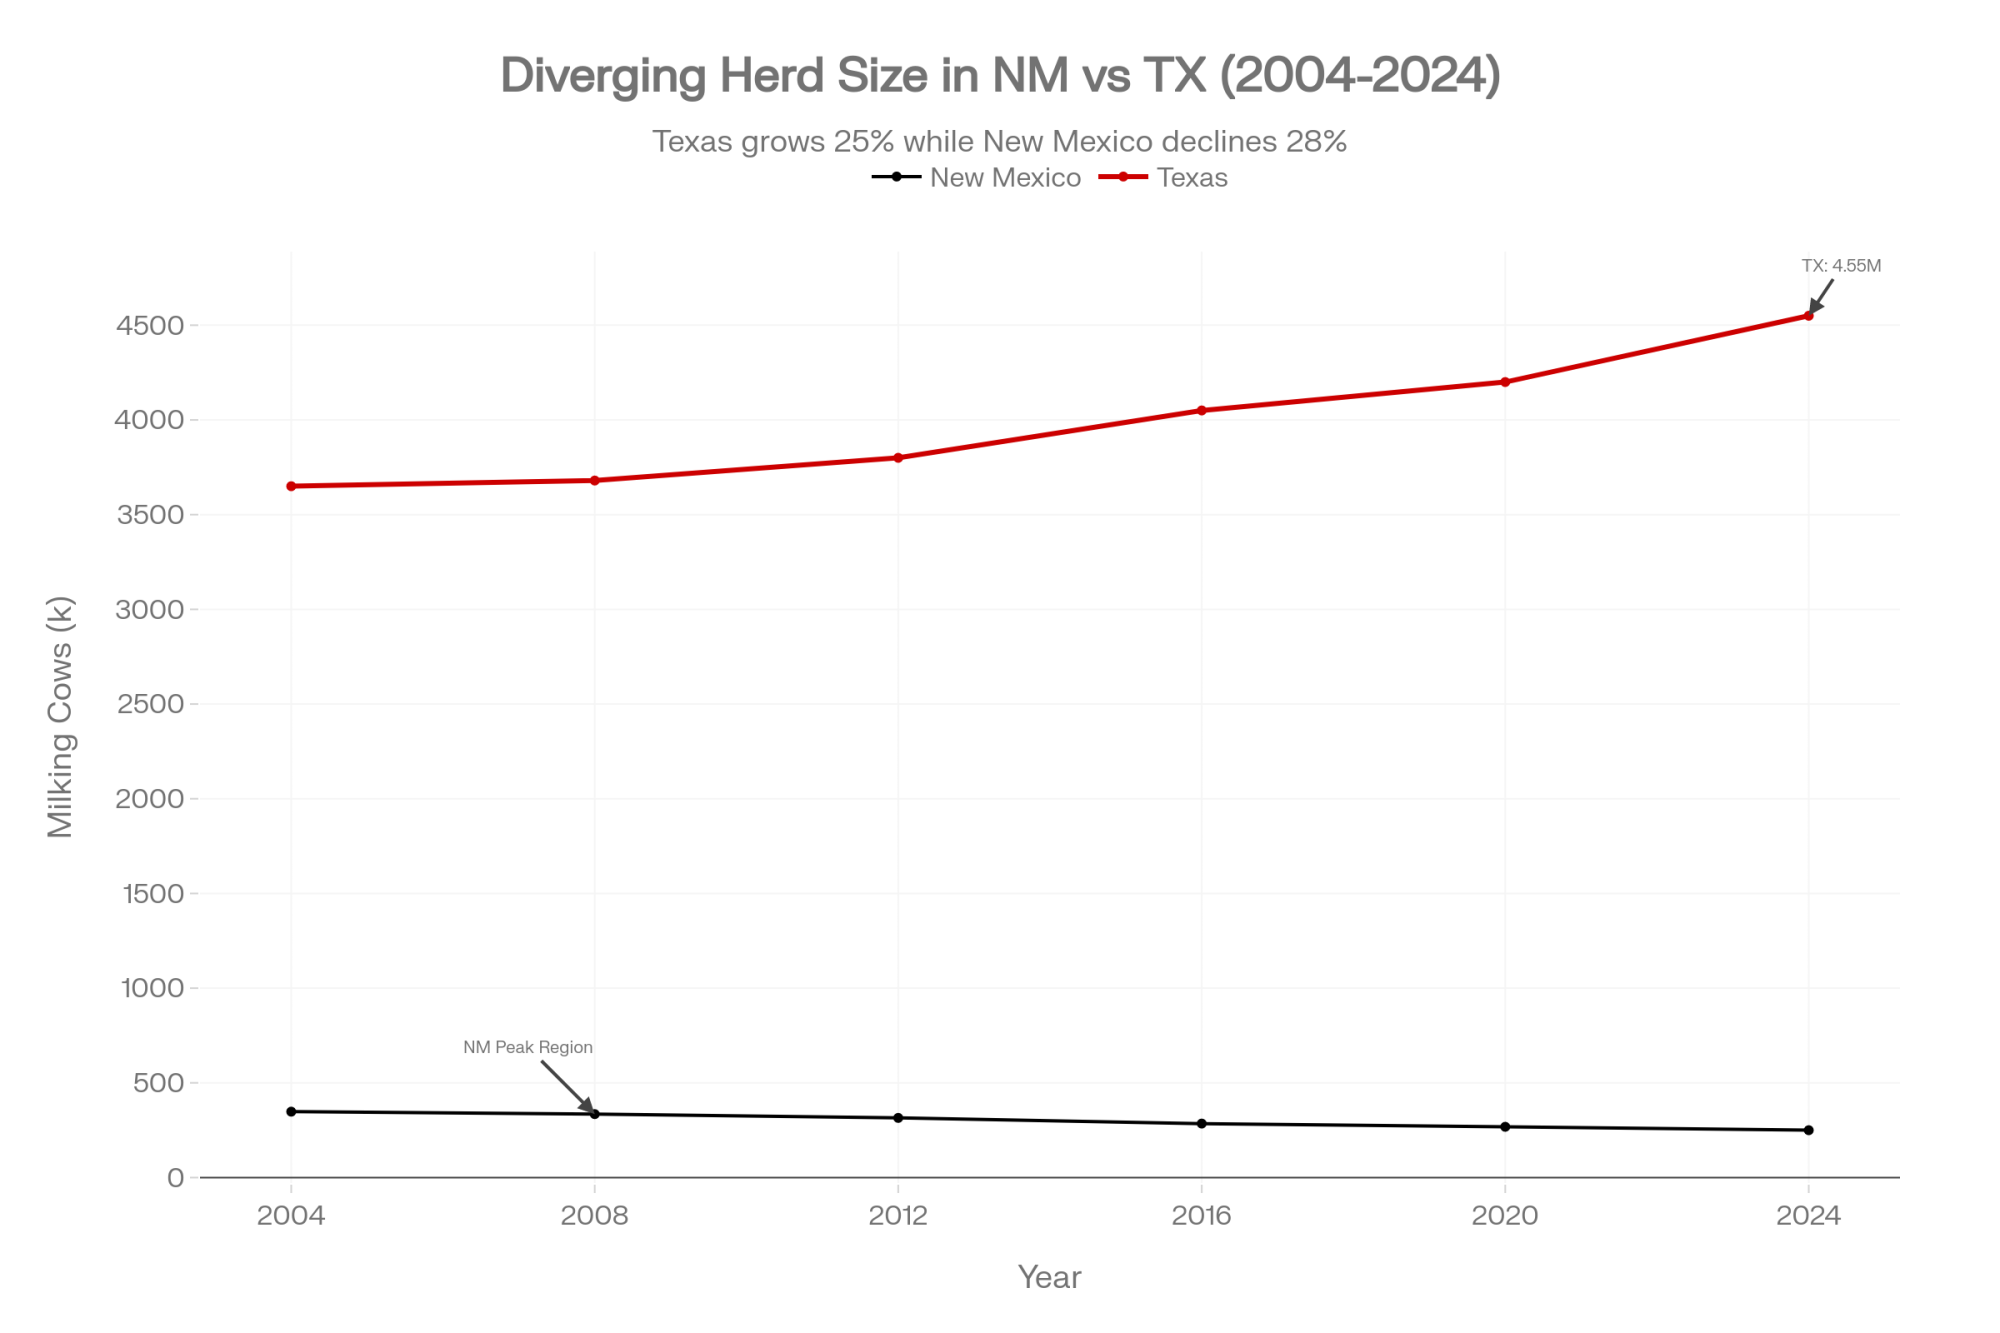
| Year | New Mexico Cows (000s) | Texas Cows (000s) |
|---|---|---|
| 2004 | 348 | 3,650 |
| 2008 | 335 | 3,680 |
| 2012 | 315 | 3,800 |
| 2016 | 285 | 4,050 |
| 2020 | 268 | 4,200 |
| 2024 | 250 | 4,550 |
Take New Mexico. New Mexico State University’s “Key Indicators” for the dairy industry show that:
- Milking cow numbers peaked at 348,000 in 2006 and were down to 250,000 cows in 2024—about a 28 percent decline.
- The number of dairies fell from 181 in 2004 to 84 farms by October 2024, more than halving the farm count over two decades.
Milk per cow has improved, but the number of cows and farms has clearly gone down. Much of that milk still goes into cheese and fluid products, but much of the processing infrastructure is older and competing with the kind of new, integrated plants being built in Kansas and Texas.
Producers in that basin talk about longer hauls, fewer realistic processor options, and net pay prices that often land below Class III or Class IV benchmarks once you tally basis, hauling, over‑order charges, and other adjustments. Meanwhile, peers in the draw area of new plants like Lubbock and Franklinville often see tighter spreads to class prices and better access to protein and quality premiums.
That’s the quiet sorting that’s happening: growth corridors where plants are hungry for milk, and slow‑leak basins where, even with good cows and good management, structural economics are stacked against you.
What These Plants Actually Want: Cheese, Protein, and Export Leverage
Looking at this trend, it’s worth getting very clear on one thing: these new plants are not just generic “milk sinks.”They’re built around specific demand patterns.
Cheese Demand Still Drives the Bus
USDA and industry data show that U.S. cheese consumption has been on a long-term upward trajectory, in both total tonnage and per‑capita terms. Growth is especially strong in pizza, foodservice, and prepared foods. Plants like Leprino Lubbock and Great Lakes Franklinville are basically purpose‑built to feed that demand: pizza‑style mozzarella, sliced/shredded retail cheese, and ingredient blocks for food manufacturers.
High-Protein Dairy Isn’t a Fad
On top of that, we’ve seen a rapid rise in high‑protein dairy—Greek yogurt, skyr, high‑protein drinkable yogurts, and snack cups. A 2024 global market report estimates the high‑protein yogurt segment as a multi‑billion‑dollar market globally, with North America holding a leading share. That tracks with what we’ve watched in the “yogurt belt” over the last decade: plants upgrading separators, adding ultrafiltration, and building more cultured capacity to chase that higher‑protein consumer.
Whey Is Now a Profit Centre, Not a Nuisance
Here’s where a lot of older mental models still lag behind.
A 2021 review in the journal Foods describes cheese whey as a nutrient‑rich liquid stream that can be fractionated into whey protein concentrates and isolates, lactose, and permeate, each of which can be used in sports nutrition products, infant formula, clinical nutrition, and other food and feed applications. Engineering and economic studies on integrated cheese‑and‑whey operations show that installing membrane filtration, evaporators, and dryers can transform whey from a disposal cost into a significant profit contributor, especially when whey protein prices are strong.
In simple terms: in a modern cheese plant, whey isn’t “waste” anymore. It’s a major business line. And that has real implications for which cows and component profiles are most valuable to your buyer.
The Whey Premium: Why Processors Suddenly Care So Much About Protein
If you want to understand why so many of these new plants are built with full whey-processing lines, the price spread tells most of the story.
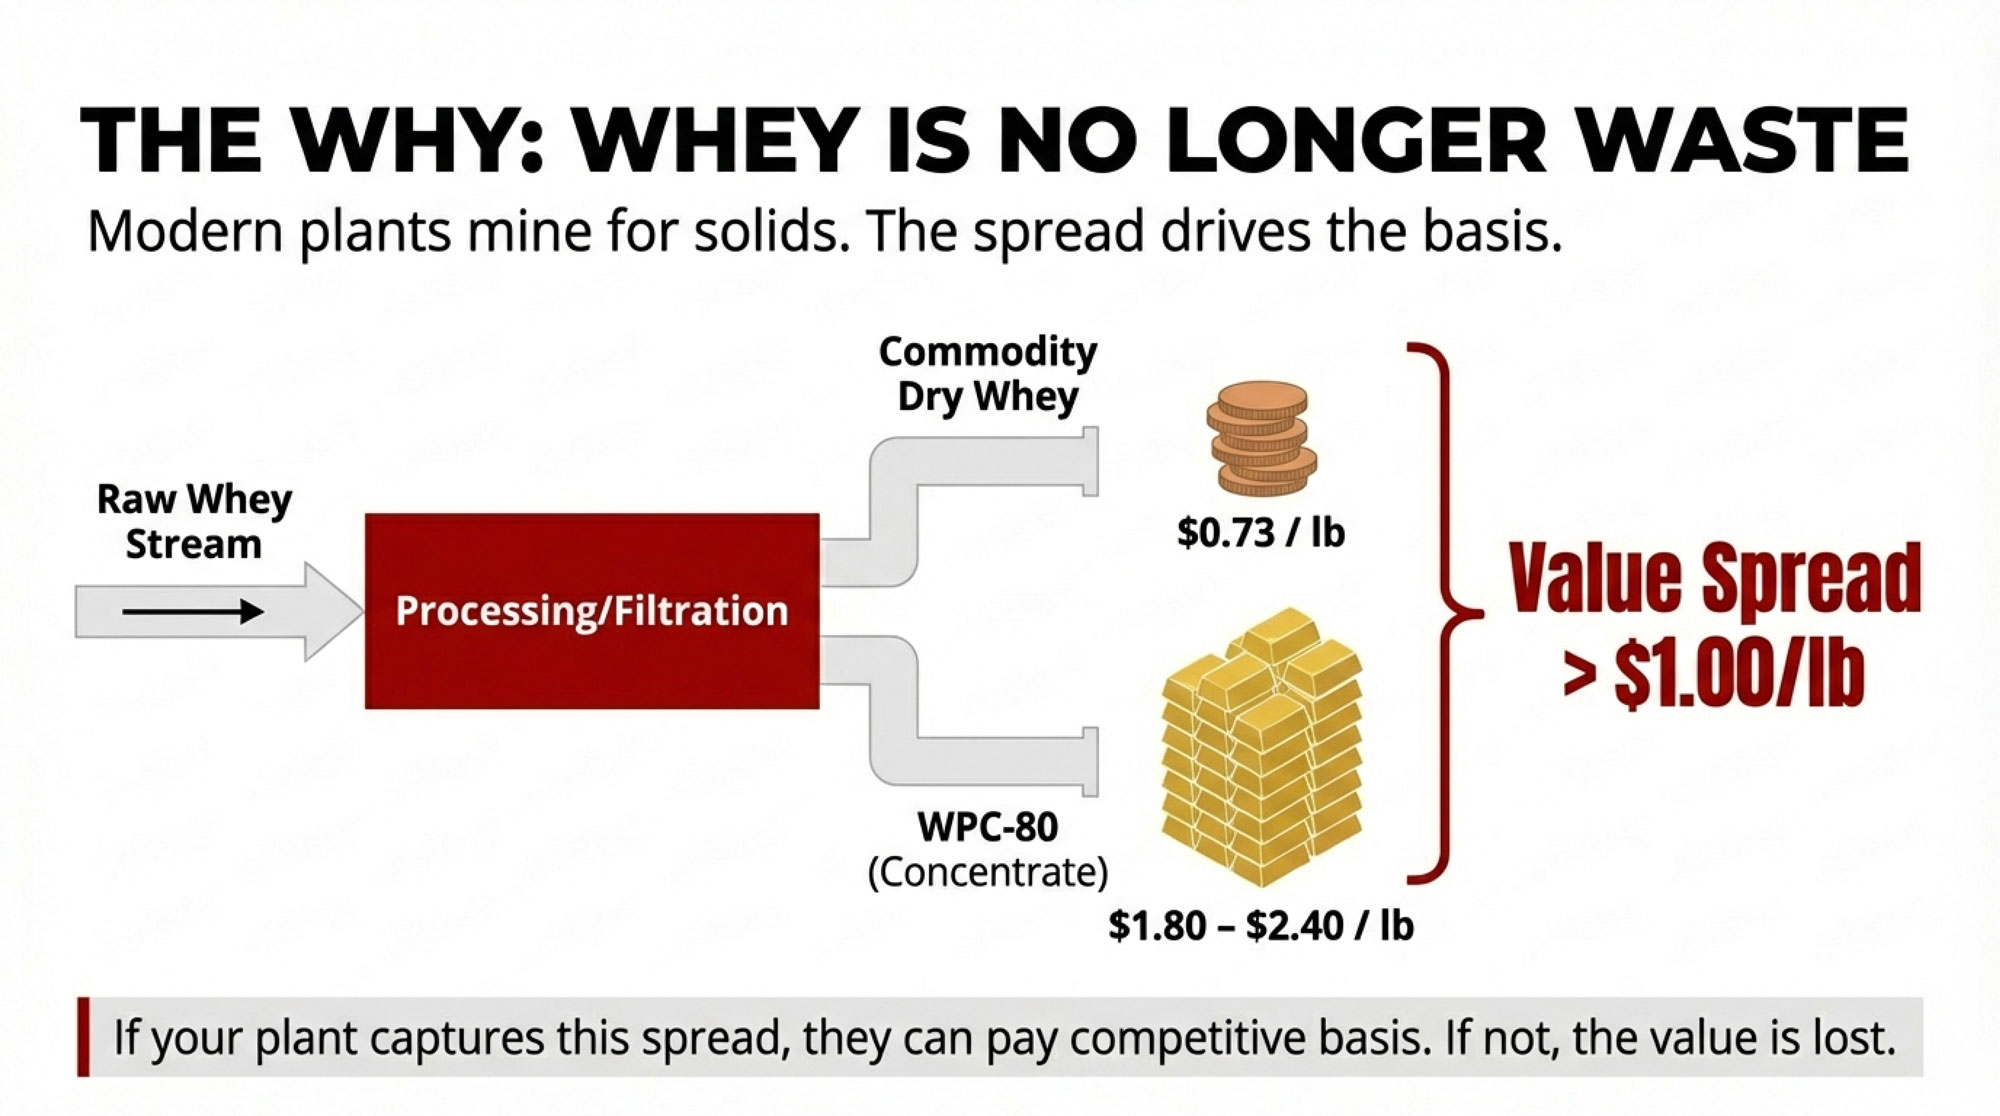
Looking at late 2025 and early 2026, U.S. market data show commodity dry whey trading in roughly the $0.30 to $0.75 per pound range over the year, with CME cash dry whey at about $0.735 per pound to start 2026. Over the same period, European and U.S. market reports for food‑grade 80% whey protein concentrate (WPC‑80) put spot prices in the $1.80 to $2.40 per pound range, depending on the market and contract.
So when you convert a pound of protein from commodity dry whey into WPC‑80, you’re often adding more than a dollar per pound of value—even after you account for the extra processing costs.
| Product | Low Price ($/lb) | Mid Price ($/lb) | High Price ($/lb) | CME/Spot Current |
|---|---|---|---|---|
| Commodity Dry Whey | 0.30 | 0.53 | 0.75 | 0.735 |
| WPC-80 (Food Grade) | 1.80 | 2.10 | 2.40 | 2.15 |
| Value Uplift (WPC-80 minus Dry Whey) | 1.05 | 1.57 | 1.65 | 1.42 |
That’s the kind of spread that makes it worth building Franklinville‑type plants with full whey systems, or designing Dodge City around cheese and ingredients rather than just cheese and lagoons. And it’s why, from a processor’s perspective, protein isn’t just “the other line on the pay slip” anymore. It’s central to how they hit their margins.
For you, the take‑home is pretty simple: if your buyer is extracting WPC‑80 or higher-value whey ingredients, the true protein in your milk is tied directly to their profit. If they’re not, that value may never make its way back to your milk cheque.
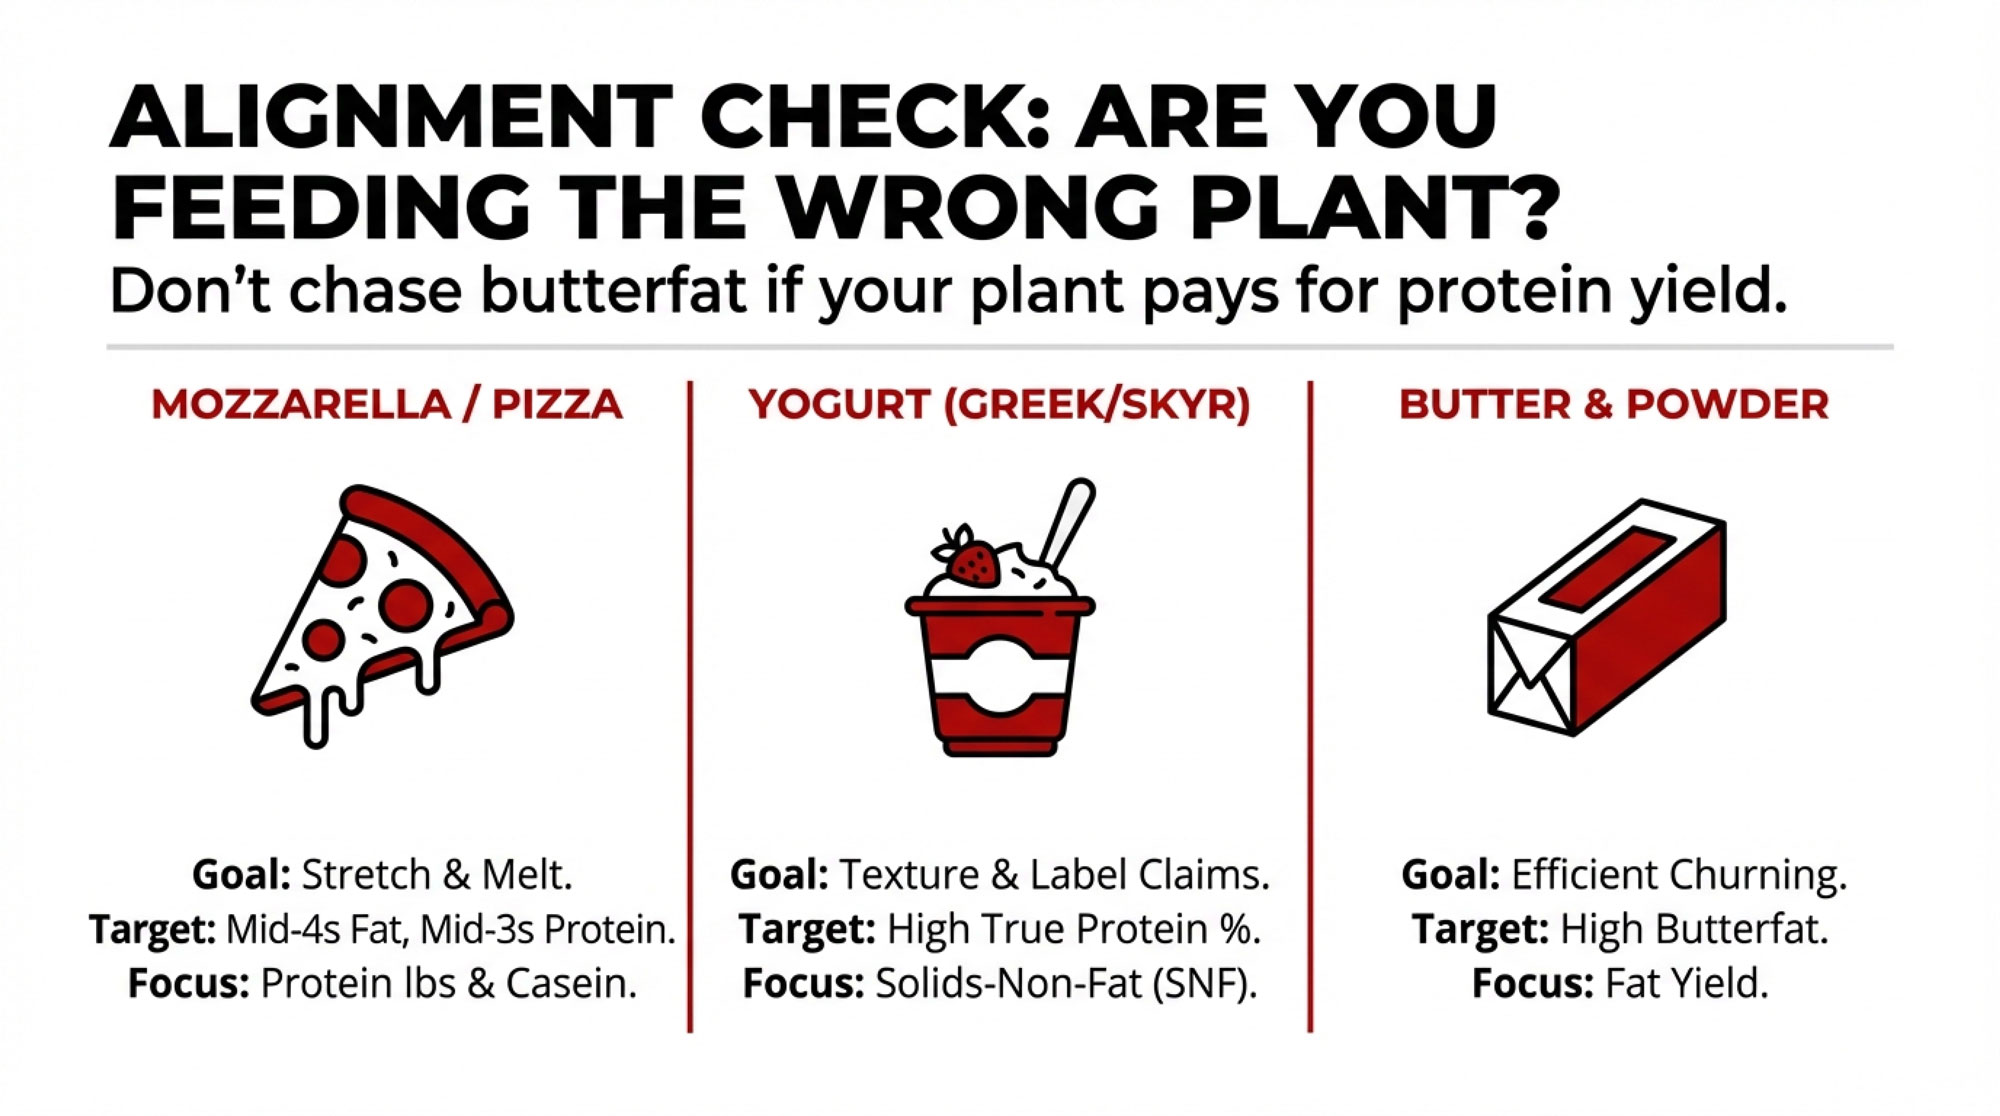
Components by Plant Type: Are Your Cows Aligned with Your Market?
This is where we stop talking “industry” and start talking “your breeding program and ration.”
What producers are finding is that you can’t decide if your butterfat and protein targets are “right” until you know what plant type you’re feeding and how it makes money.
Here’s a simple way to frame it.
Quick Guide: Plant Type vs Component Priorities
| Plant Type | Main Products | Component Priorities | Target Range (BF% / TP%) | Genetics/Feeding Emphasis |
|---|---|---|---|---|
| Mozzarella / Pizza Cheese | Low-moisture mozz, shredded, pizza blend | Cheese yield, stretch, melt; balanced fat and protein | 4.2–4.6% BF / 3.2–3.5% TP | Protein pounds & casein quality; moderate fat; avoid excess butterfat spend |
| High-Protein Cultured (Greek, Skyr) | Greek yogurt, drinkables, high-protein cups | True protein, solids-non-fat; texture, label claims | 3.0–4.0% BF / 3.4–3.8% TP | Strong protein %; exceptional fresh cow management; transition nutrition critical |
| Cheese + Whey Ingredients | Cheese + WPC/WPI, lactose, permeate | Balanced fat and protein; high whey yield & quality | 4.0–4.5% BF / 3.2–3.5% TP | Protein pounds for whey streams; minimize low-value excess fat; balance for dual yield |
| Butter & Powder | Butter, SMP/NFDM, WMP | Butter yield, consistent skim for powders | 4.3–4.8% BF / 2.8–3.2% TP | Butterfat (when butter prices strong); protein to spec; less protein premium reward |
Those are general ranges, not prescriptions, but they capture the way many modern plants think about components.
If your herd’s components don’t match the row that fits your plant, that’s a red flag that genetics and feeding may be out of sync with your market.
Mozzarella and Pizza Cheese Plants
For facilities like Hilmar Dodge City and Leprino Lubbock, what matters most is stretch, melt, and cheese yield. Cheese yield work and industry guidelines suggest that milk for mozzarella typically performs best with butterfat in the mid‑4s and true protein in the mid‑3s, understanding that each plant fine‑tunes this based on product specs.
If your milk goes into pizza cheese, that usually means:
- Leaning harder into protein pounds and casein quality in your sire selection—alongside fat pounds—rather than chasing butterfat alone.
- Being careful about spending heavily to push butterfat up into the 4.5–4.7% range if your plant doesn’t pay much extra for it and is more constrained by protein and whey flows.
Honestly, this is where a lot of the herds I talk to are still tuned to an old reality: breeding and feeding for butterfat as if the plant were still selling mostly butter and cheddar, while their milk quietly feeds integrated pizza cheese and whey ingredient lines.
High-Protein Yogurt and Cultured Plants
In parts of Upstate New York and Quebec, milk is heavily geared toward Greek yogurt and other high‑protein cultured products. These plants often skim or divert much of the fat and care much more about true protein and solids‑non‑fat to meet texture and high‑protein label claims.
A 2024 high‑protein yogurt market analysis underlines that this category is a multi‑billion‑dollar segment globally, with North America leading, so it’s not a short‑term fad. Herds shipping into these plants usually do fine with butterfat in the mid‑3s up to around 4%, but see more value from:
- True protein in the mid‑3s or higher, which reduces the need for added solids and improves process yields.
- Exceptional fresh cow management and transition-period nutrition that keep cows out of negative energy balance and support both volume and protein.
Merck Veterinary Manual updates and a 2024 Journal of Dairy Science paper both point out that cows with better energy balance and properly balanced amino acid supply in early lactation produce not just more milk, but more protein-rich milk. When your milk is destined for Greek shelves, that matters a lot.
Cheese + Whey Ingredient Complexes
Plants like Great Lakes Franklinville and integrated Hilmar sites are built specifically to maximize both cheese and whey ingredient revenues. They need:
- Butterfat in the low‑ to mid‑4s to keep cheese yields strong without creating a mountain of surplus fat.
- True protein in the mid‑3s, so both cheese and whey protein flows look good.
If your herd is sitting at, say, 4.7–4.8% butterfat and barely 3.0% true protein, you might be slightly out of tune with what those plants actually value. A nutritionist I know who works across freestall and dry lot systems in Wisconsin and Minnesota always starts with one question: “Where does your milk actually go, and how do they pay for protein?”Her point is that if your components and your buyer’s business model aren’t aligned, your selection and feeding strategy is probably leaving money on the table, even if your cows look stellar in the tank.
Butter and Powder Plants
Finally, you’ve got the butter and powder plants—Darigold’s new Pasco site being a more advanced example, but plenty of regions rely on similar facilities.
Those plants care most about:
- Enough butterfat to keep churns efficient when butter is strong.
- Consistent skim that can be dried into powders meeting spec for export or industrial use.
In these operations, high butterfat can be highly valuable when butter prices are strong, and protein may be treated more as a specification to meet than a major premium driver. The catch is that product mixes that are heavy on bulk butter are more exposed to global price swings than diversified cheese‑and‑ingredient portfolios. So even if your components are dialed in, your pay price will still ride those markets more than someone shipping into a cheese+WPC plant with stronger branding and export contracts.
Under Quota: Comfort, Risk, and USMCA 2026
If you’re farming under supply management in Canada, some of this sounds like “U.S. problems.” Quota does cushion you from the worst of global volatility. But it doesn’t make geography, product mix, or trade politics irrelevant.
Quota as Asset and Shield
Policy work on Canadian dairy has noted that, on many farms, the value of butterfat quota has risen to the point where it represents one of the largest single assets on the balance sheet. It’s also clear that quota values vary widely by province. Sector analyses and board data generally show:
- British Columbia with some of the highest indicative values.
- Ontario and Quebec are in a mid-range band.
- Several Atlantic provinces are somewhere between the central provinces or slightly above them, depending on policy and demand.
That means two 80‑cow herds with similar cows and management can be sitting on very different quota asset bases purely because of the postal code.
| Dairy Category | TRQ Allocation (tonnes) | Typical Utilization Rate (%) | Headroom / Underutilized (tonnes) | Exposure Risk if Filled |
|---|---|---|---|---|
| Cheese | 18,500 | 65–75% | 4,600–6,500 | High—U.S. pizza/specialty cheese competes directly |
| Butter | 2,100 | 40–60% | 840–1,260 | Medium—commodity butter; price-sensitive |
| Milk Powders (NFDM/SMP) | 9,200 | 50–70% | 2,760–4,600 | High—U.S. powder exports target Asian markets; Canada a competitor |
| Yogurt & Cultured | 4,500 | 55–70% | 1,350–2,025 | Medium—category growth; competitive dynamics unclear |
| Total Dairy TRQs | 34,300 | 55–68% avg. | 10,000–15,000 (total) | $200M/year at risk |
The USMCA Review Clock Is Ticking
What’s interesting right now is how the USMCA 2026 review intersects with that.
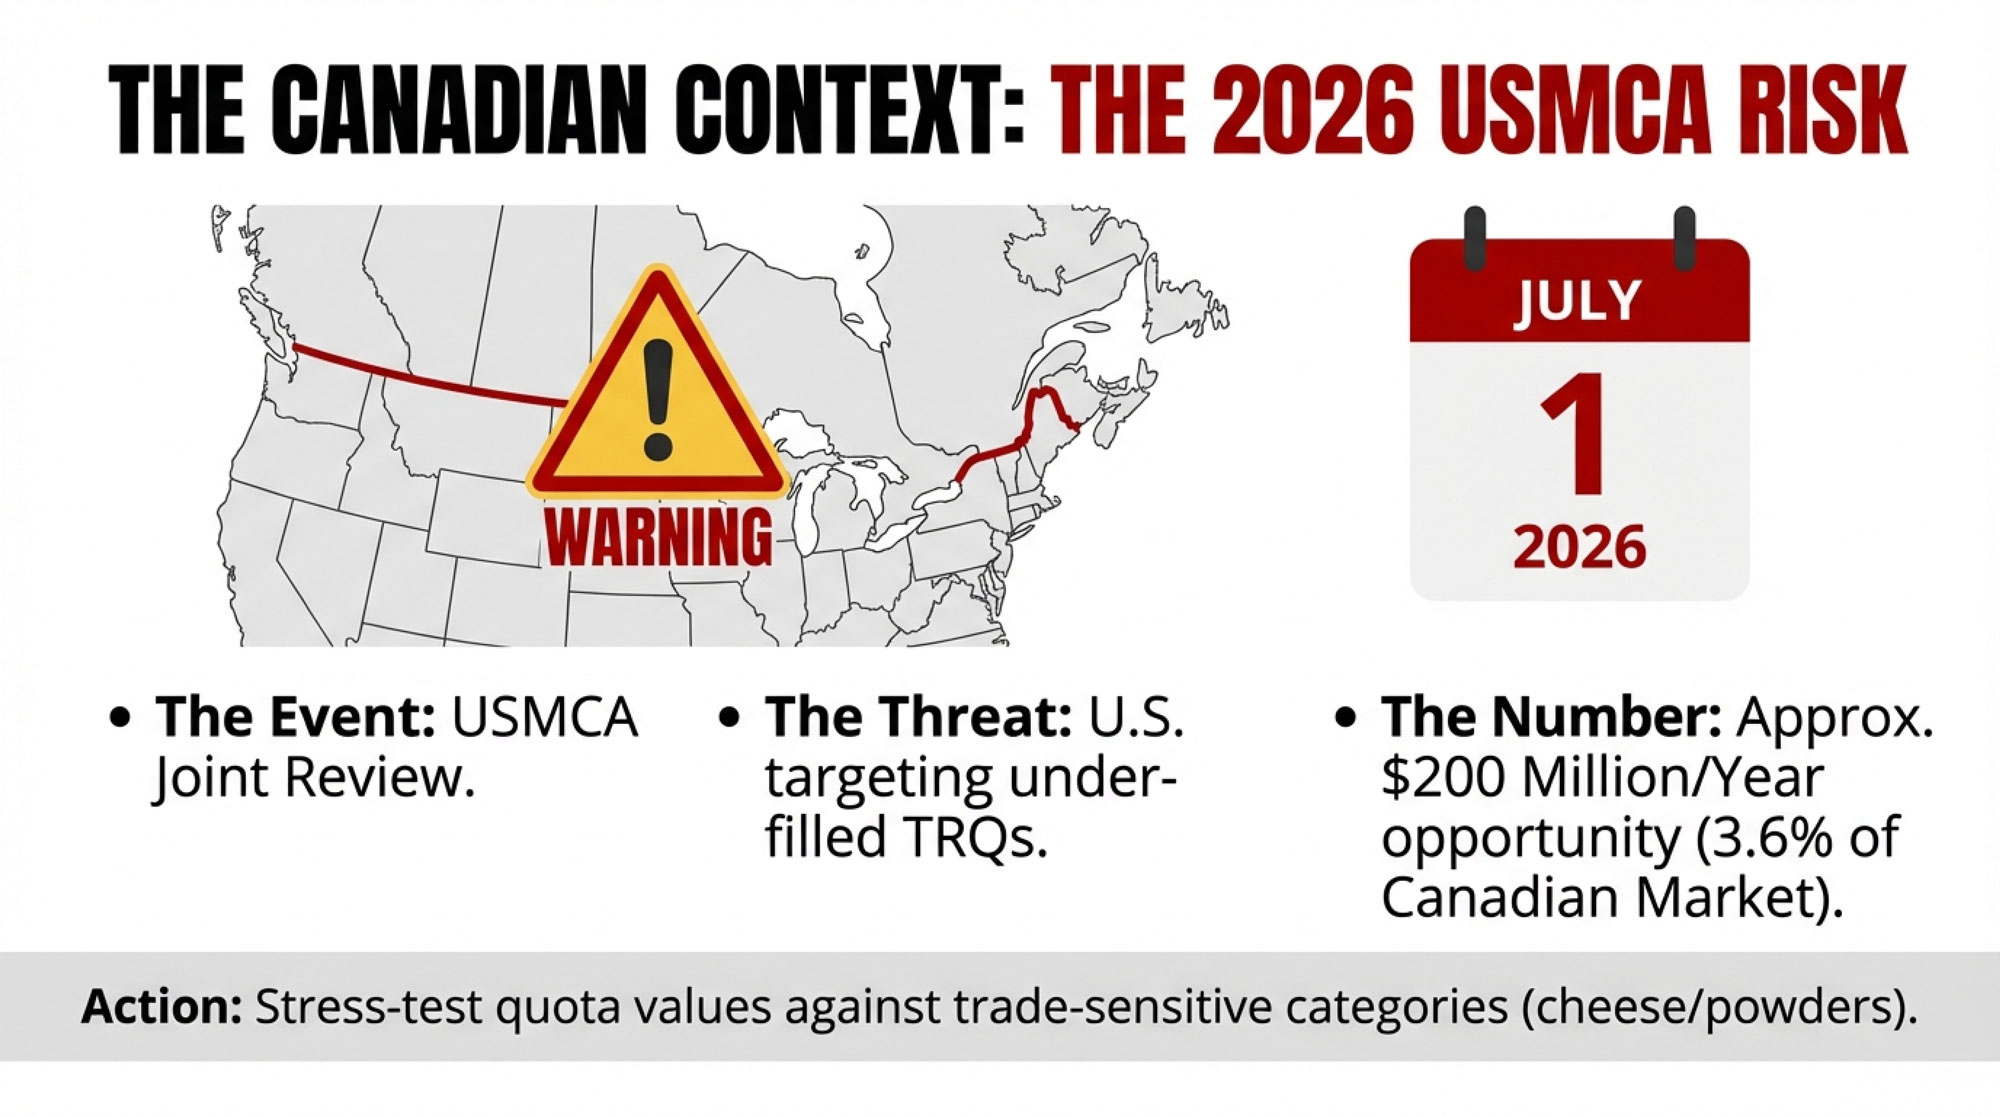
The agreement’s first joint review is scheduled for July 1, 2026, six years after the USMCA came into force. U.S. dairy organizations have spent the last year making sure dairy is at the front of that conversation.
In early January 2026, the National Milk Producers Federation summarized its push this way:
- On December 3, 2025, NMPF Executive Vice President Shawna Morris testified at a USTR hearing, criticizing how Canada administers its dairy tariff‑rate quotas and handles surplus nonfat milk solids on the global market.
- That same day, a bipartisan group of 74 U.S. House members sent a letter to U.S. Trade Representative Jamieson Greer, urging that unresolved dairy issues with Canada be treated as a priority in the 2026 review.
- NMPF and the U.S. Dairy Export Council have highlighted that Mexico and Canada together accounted for roughly 3.6 billion dollars in U.S. dairy exports last year, about 44 percent of total export value, making USMCA markets central to U.S. dairy growth.
A University of Wisconsin Extension analysis estimates those TRQs equal about 3.6% of Canada’s market (~$200M/year), and Canadian data show they’ve generally been underfilled, often well below half of available volume.
Trade analysts at think tanks like the Center for Strategic and International Studies have flagged Canadian dairy policy and supply management as likely flashpoints in the 2026 review, noting that unresolved dairy issues could complicate efforts to renew or extend the agreement without friction. The Canadian Chamber of Commerce has likewise called 2026 “the year of the USMCA review” and warned that missteps could create new risks for Canadian exporters, including in agriculture. Recent coverage of remarks by U.S. and Canadian officials at forums like Davos underscores that dairy remains a sensitive topic in bilateral talks.
None of that means the quota suddenly becomes worthless. But if you’ve got a lot of net worth tied up in quota, 2026 is a smart time to:
- Understand whether your local plants are heavily exposed to categories that U.S. exports could compete with—cheese, powders, and some specialty products.
- Sit down with your advisor and at least sketch out how your balance sheet would look under different long‑term scenarios: no change, modest extra imports, or more significant shifts.
Even if the conclusion is “we stay the course,” arriving there with your eyes open is better than being surprised by a decision made in Ottawa and Washington.
Relocation: When the Basin Really Is Against You
Relocation is one of those topics that always sounds cleaner on paper than it feels in real life.
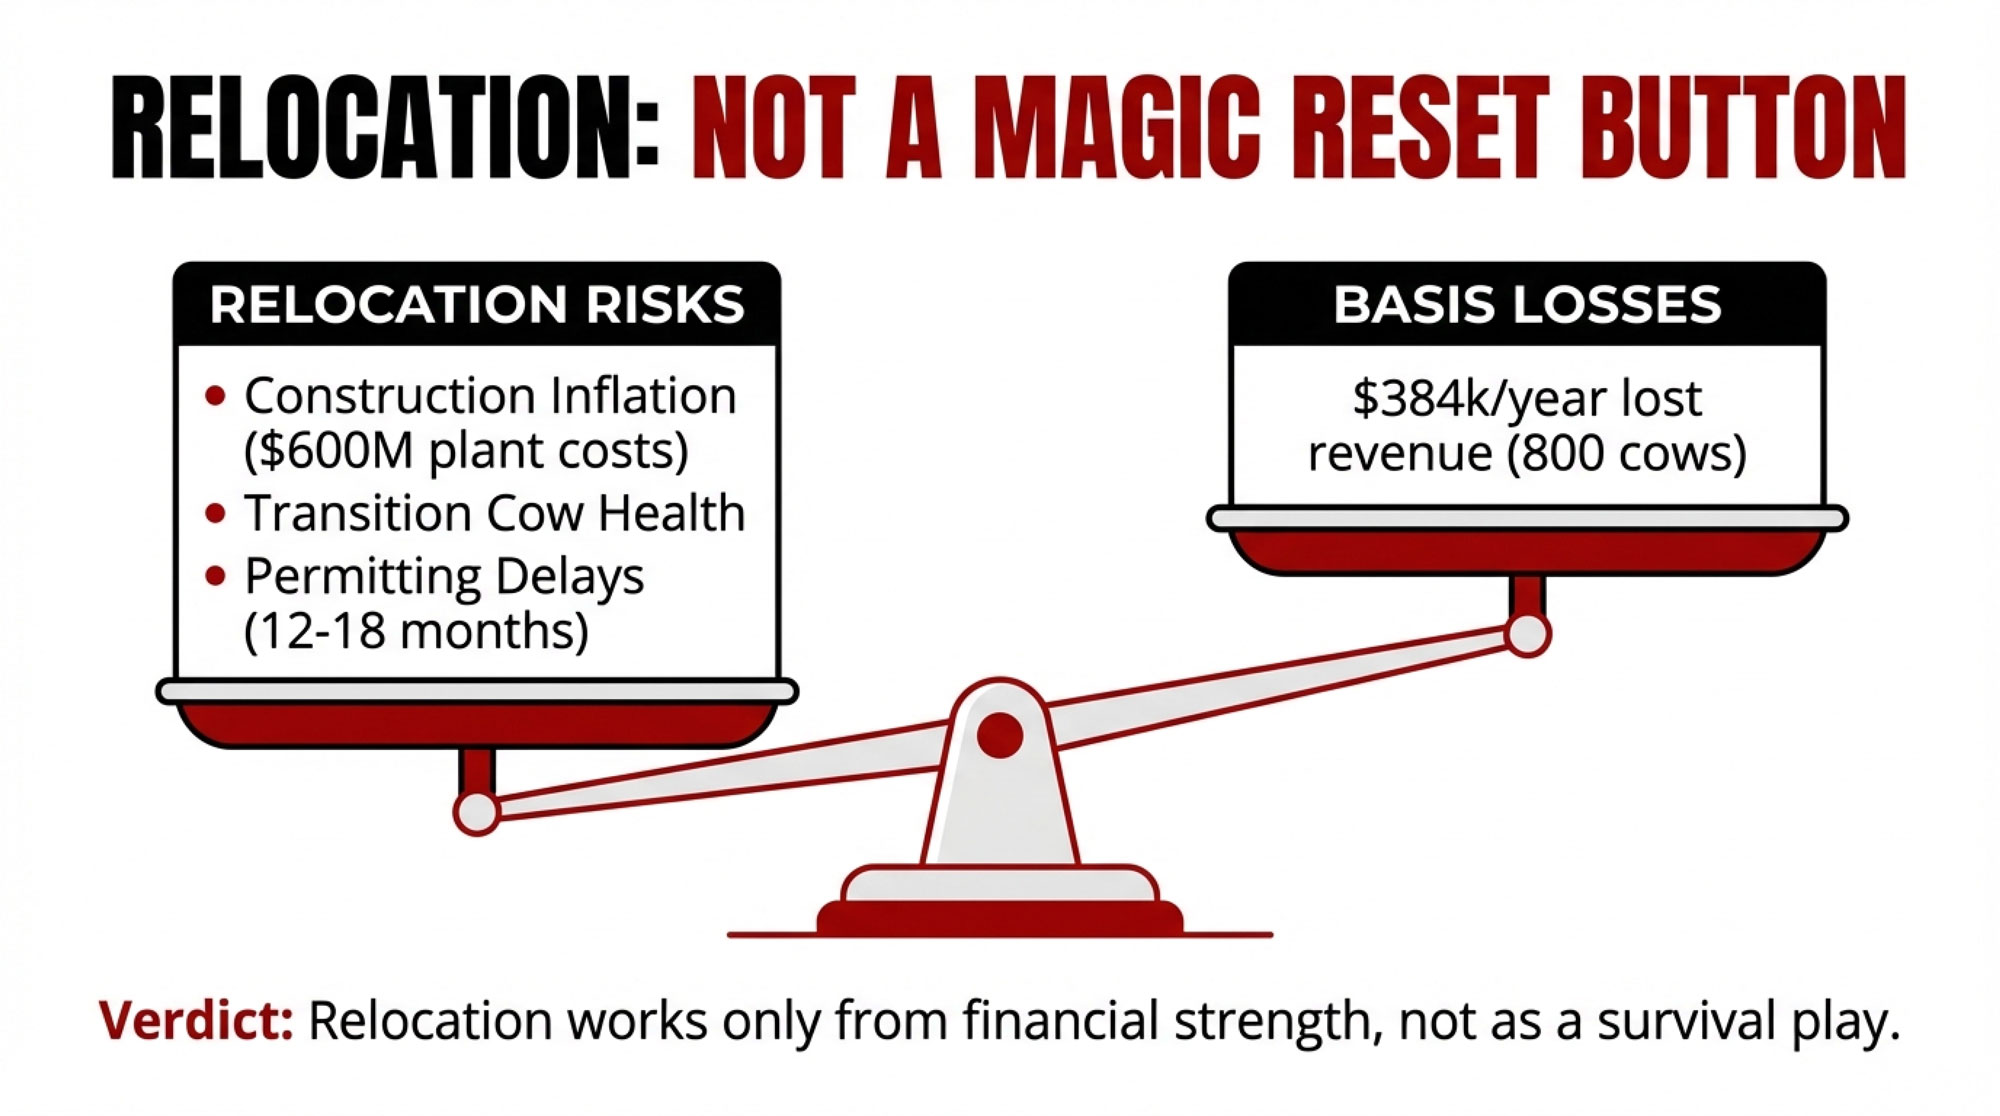
Let’s say you’ve got an 800‑cow freestall herd averaging 24,000 pounds per cow per year. That’s roughly 19.2 million pounds a year, or 192,000 hundredweight. If your net pay has averaged 2 dollars per hundredweight lowerthan comparable herds in a stronger basin—because your plants are older, your haul is longer, and your basis is chronically ugly—that’s roughly 384,000 dollars a year in lost revenue compared to your peers. Over ten years, you’re looking at 3.8 million dollars. That’s hard to ignore.
On a scratch pad, the logic writes itself: sell where you are, rebuild near a growth corridor like Lubbock or Dodge City, and solve the basis problem.
But as a lot of producers who’ve built or moved know, the spreadsheet leaves out a few things.
In Texas, for example, large dairies fall under concentrated animal feeding operation rules, which require engineered manure and lagoon systems, public notice, and permits from state regulators. Extension resources and consultant experiences suggest that fully permitting and constructing a new large‑scale dairy often takes a year or more, and 12–18 months from initial planning to full regulatory signoff is common for complex projects.
Construction costs are another wild card. The Franklinville cheese plant is a textbook case: local reports show expected project costs rising from around 500 million dollars to more than 600 million dollars during construction, due to increases in steel, concrete, and labour costs. You don’t have to be building a half‑billion-dollar cheese plant to feel those same forces when you price new barns or parlours.
Then there’s the herd. Veterinary and nutrition research make it clear that cows in the transition period are highly vulnerable to stress and diet changes. Studies and clinical guidance tie abrupt changes in housing, climate, and nutrition to higher rates of metabolic disease and lower early‑lactation performance. Herds that have moved long distances often report:
- An initial drop in production, especially among fresh cows.
- A spike in metabolic and health issues occurs until diets and routines stabilize.
- Reproductive performance that takes a full lactation—or longer—to get back where they want it.
Meanwhile, your balance sheet is carrying two sets of fixed costs: the new site’s investment and operating costs, plus any remaining debt or obligations tied to the old place until it’s sold, rented, or repurposed.
When you talk to lenders who work with these moves, a common theme is that the relocations that succeed usually start from a position of relative strength—solid equity, manageable debt, and a plan for 18–24 months of turbulence. The high‑risk cases are the last‑ditch attempts to move away from a bad basin after years of weak cash flow.
So, relocation can absolutely be a valid play if your basin is structurally against you and you’ve got the financial and human bandwidth to ride out the turbulence. But it’s not a magic reset button. For a lot of herds, the more realistic play is to rework contracts, adjust herd size, optimize components for the plant you’ve got, or map a planned exit that protects the equity you’ve built.
Mid-Career Reality Check: What Are You Actually Optimizing For?
This is where the economics meets real life.
If you’re in that mid‑career window—say 45 to 55—it’s pretty common to feel pulled in multiple directions. You’ve spent your adult life building equity in land, cows, quota, and infrastructure. Maybe you’ve got kids in their late teens or twenties hovering around the operation. And you’re looking at the basis, processor power, and USMCA politics, wondering exactly what you’re trying to optimize over the next decade.
Around a lot of kitchen tables, the same questions keep coming up:
- “Are we trying to maximize wealth, or just keep things stable and liveable, or set the kids up if they want in?”
- “If our basin and plant picture doesn’t improve, is it fair to pass this exact business model on to them?”
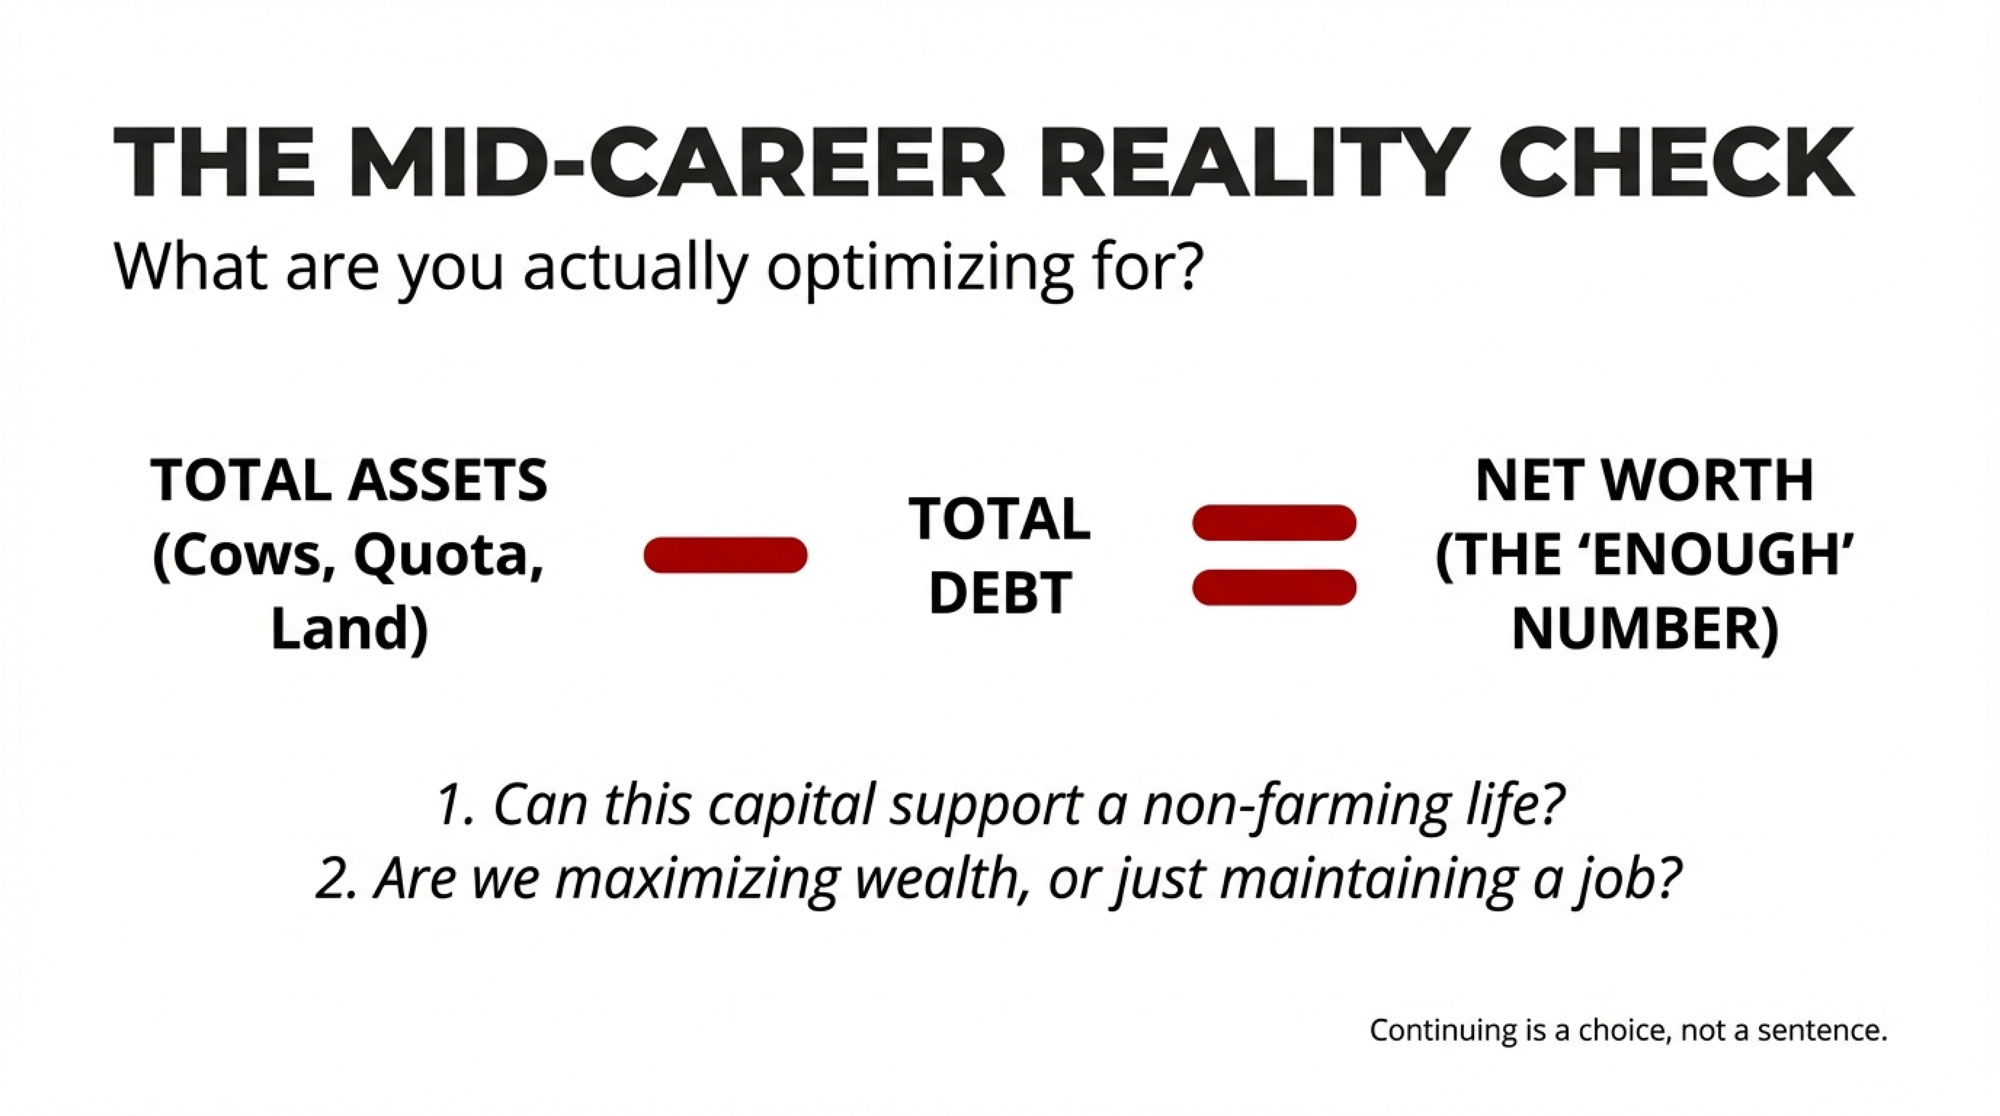
- “If we sold and got out, do we have any idea what ‘enough’ would actually look like?”
Financial planners and farm transition advisors often lean on a simple framework: if you total up your assets—land, facilities, herd, quota—and subtract debt, the capital left can often support a modest, sustainable annual withdrawalif invested prudently. A common rule of thumb outside agriculture is that withdrawing a low single‑digit percentage of your investment portfolio each year can support long‑term income without rapidly eroding principal.
Some mid‑size dairies, when they actually run that math, discover their net worth is high enough that, if converted into investments, it could support a reasonably comfortable non‑farming life. Others find there’s a gap. In both cases, the exercise tends to change how they see the trade‑offs between grinding on in a weak basin, making big capital bets, or designing an orderly exit.
The point isn’t that everybody should sell. It’s that continuing on as you are is a choice—not a sentence. Knowing your “enough” number makes your choice more informed.
What to Watch Closely in 2026–2027
So, with all this on the table, what should you actually keep an eye on over the next couple of years?
1. How Your Local Plants Are Talking About Milk
If you’re within a reasonable haul of new or recently expanded plants—Dodge City, Lubbock, Franklinville, Pasco, or any of the other IDFA‑highlighted projects—listen carefully to the way folks from those plants talk about milk.
- During ramp‑up, you’ll hear things like “We’re looking for quality milk” and “We’re open to talking about new volume and terms.”
- Once they’re full, the message shifts to “We’re basically at capacity right now” or “We aren’t really onboarding new farms.”
That tone shift is a decent real‑world indicator of how much leverage you have when you sit down to talk contracts or consider moving milk.
2. Your Own Rolling Basis Trend
This is one of the most practical things you can do without hiring a consultant.
- Grab your last 12 months of milk cheques.
- Calculate your average net pay per hundredweight, including premiums and after hauling, over‑order charges, and any other line items.
- Pull the average Class III or Class IV price over that same period.
- Compare the two—and then, if you can, do the same for a few years back.
If you see that you’ve been consistently more than one dollar per hundredweight below the relevant class price, and your local plants haven’t added or modernized capacity in years, that’s a strong clue you’re in a structurally weak basin, not just riding a bad month or two. On the flip side, if your basis has stayed reasonably tight and you’re near new plants, your situation is very different.
3. USMCA Milestones for Canadian Farms
For Canadian producers, it’s worth penciling in a couple of things:
- The USMCA joint review kicks off on July 1, 2026, and U.S. dairy groups have already laid out a detailed case for greater access to Canada.
- The University of Wisconsin Extension and Canadian agencies will continue publishing updates on TRQ utilization, dispute outcomes, and any changes to allocation rules; these will be early indicators of pressure points.
You don’t need to become a trade lawyer, but staying loosely plugged into those updates will help you avoid being blindsided if something shifts in sectors tied closely to your local plants.
A Simple Checklist for Your Farm This Month
If you want to move from “interesting article” to “action on your own operation,” here’s a short list you can actually work through in the next few weeks.
1. Talk to your processor or co-op rep:
- Ask, plainly, what your milk is being turned into: pizza cheese, specialty cheese, yogurt, butter, powder, whey ingredients, or fluid.
- Ask how they value butterfat, true protein, and quality in their pay formula—and whether that formula has changed as they’ve added (or not added) whey and ingredient capacity.
2. Run your own 12-month basis:
- Calculate your average net pay per hundredweight for the last year and compare it to the average Class III or IV.
- Look at where that basis is relative to three or five years ago. Has it improved, stayed flat, or eroded?
3. Check your component alignment:
- Look at your herd’s average butterfat and true protein over the last year.
- Based on your plant type, ask whether those levels line up with what your buyer’s business model actually rewards.
- Talk with your nutritionist about whether there are ration, amino acid, or transition‑period adjustments that could support stronger protein percentages or better component balance without hurting health.
4. For Canadian producers:
- Track updates from your provincial board and national organizations on USMCA negotiations, TRQ disputes, and any changes in import administration.
- Sit down at least once with your accountant or advisor to map out which portion of your net worth is sitting in quota and how it might respond under different long-term scenarios.
5. For mid‑career owners:
- Run a back‑of‑the‑envelope “enough number” exercise with a financial planner: if you sold, paid off all debt, and invested the remainder, what kind of annual income could that realistically support under conservative withdrawal assumptions?
- Compare that to what you and your family actually want in terms of work, stress, legacy, and lifestyle.
The Bottom Line: Don’t Let the Map Make the Decisions for You
The processors have already placed their bets. More than 11 billion dollars in new and expanded plants tells you exactly where they think the future of milk cheques is: basins tied into cheese, whey ingredients, and exportable fats and powders, not just any place that can grow corn silage.
You can’t move Hilmar or Leprino closer to your lane, and you can’t single‑handedly rewrite USMCA. But you can:
- Get crystal clear on where your milk actually goes and how it’s valued.
- Tune your genetics and feeding so your cows fit the economics of the plant you’re feeding, not the plant you wish you had.
- Track your basis, your assets, and your options so you can choose your path rather than have the basin quietly choose it for you.
So maybe this week, you grab a coffee, pull out your last 12 milk cheques and a notepad, and ask a couple of blunt questions: Are we in a growth corridor, a slow‑leak basin, or somewhere in between? Given that answer, are we trying to optimize for wealth, stability, or legacy over the next decade?
There isn’t a single “right” answer. But in a world where $11 billion is being poured into some regions and not others, pretending the map hasn’t changed—that’s the one move that really doesn’t pencil out.
Key Takeaways
- $11B in new U.S. plants is redrawing the milk cheque map. Growth corridors near Dodge City, Lubbock, Franklinville, and Pasco are winning; slow-investment basins like New Mexico—down 28% in cows since 2006—are losing leverage fast.
- Whey is no longer waste—it’s margin. Commodity dry whey trades $0.30–$0.75/lb; WPC-80 runs $1.80–$2.40/lb. Plants that capture that spread can pay more for your protein.
- Your component targets should match your buyer’s business model. Mozzarella plants want balanced fat and protein (mid-4s/mid-3s); yogurt plants lean on protein and SNF; butter/powder sites reward butterfat when markets are strong.
- Run your 12-month basis this week. If you’re consistently $1+/cwt below Class III or IV with no new plant investment nearby, your basin—not your management—may be the problem.
- Canadian producers: the 2026 USMCA review is coming. U.S. groups are targeting under-filled dairy TRQs worth ~3.6% of Canada’s market (~$200M/year). Know how exposed your quota and local plants are.
Complete references and supporting documentation are available upon request by contacting the editorial team at editor@thebullvine.com.
Learn More
- Milk Component Management: Tuning the Engine for Maximum Profit – Arm yourself with a blueprint for auditing components against processor demands. This deep dive exposes the specific nutritional levers you must pull to turn standard milk into high-value protein streams that match modern plant specs.
- The 2026 USMCA Review: Survival Strategies for Supply Management – This breakdown delivers a clear-eyed look at the trade pressures and consolidation trends rewriting the 2026 playbook. Master the strategies needed to safeguard your equity against shifting border policies and aggressive processor realignments.
- Genetic Selection for the Modern Ingredient Plant: Breeding the Cow of the Future – Discover how cutting-edge selection indexes are moving beyond simple volume. This analysis reveals the genetic shortcuts to breeding a cow that thrives in a component-first market, ensuring your herd remains the preferred supplier for elite ingredient plants.
 Join the Revolution!
 Join the Revolution!
Join over 30,000 successful dairy professionals who rely on Bullvine Weekly for their competitive edge. Delivered directly to your inbox each week, our exclusive industry insights help you make smarter decisions while saving precious hours every week. Never miss critical updates on milk production trends, breakthrough technologies, and profit-boosting strategies that top producers are already implementing. Subscribe now to transform your dairy operation’s efficiency and profitability—your future success is just one click away.


