
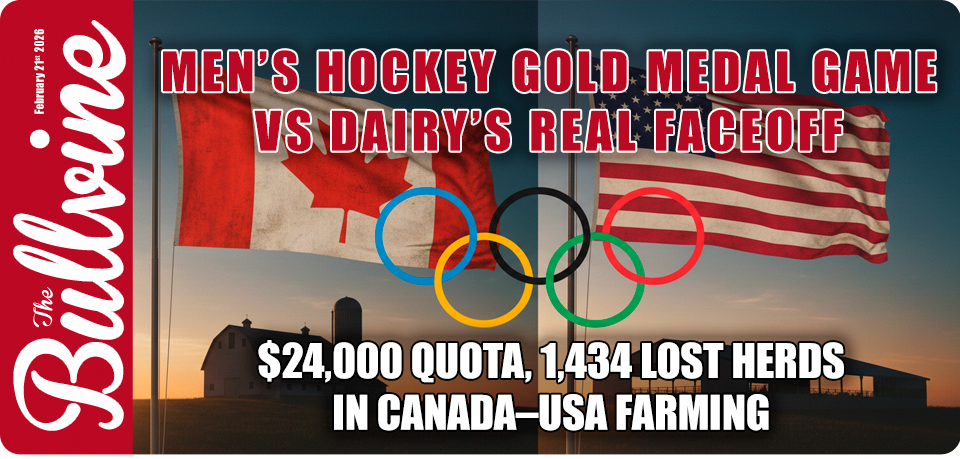


While Canada and the U.S. fight for men’s hockey gold, 1,434 dairy herds are gone, and quotas are at $24,000/kg. Where does your balance sheet land in this faceoff?
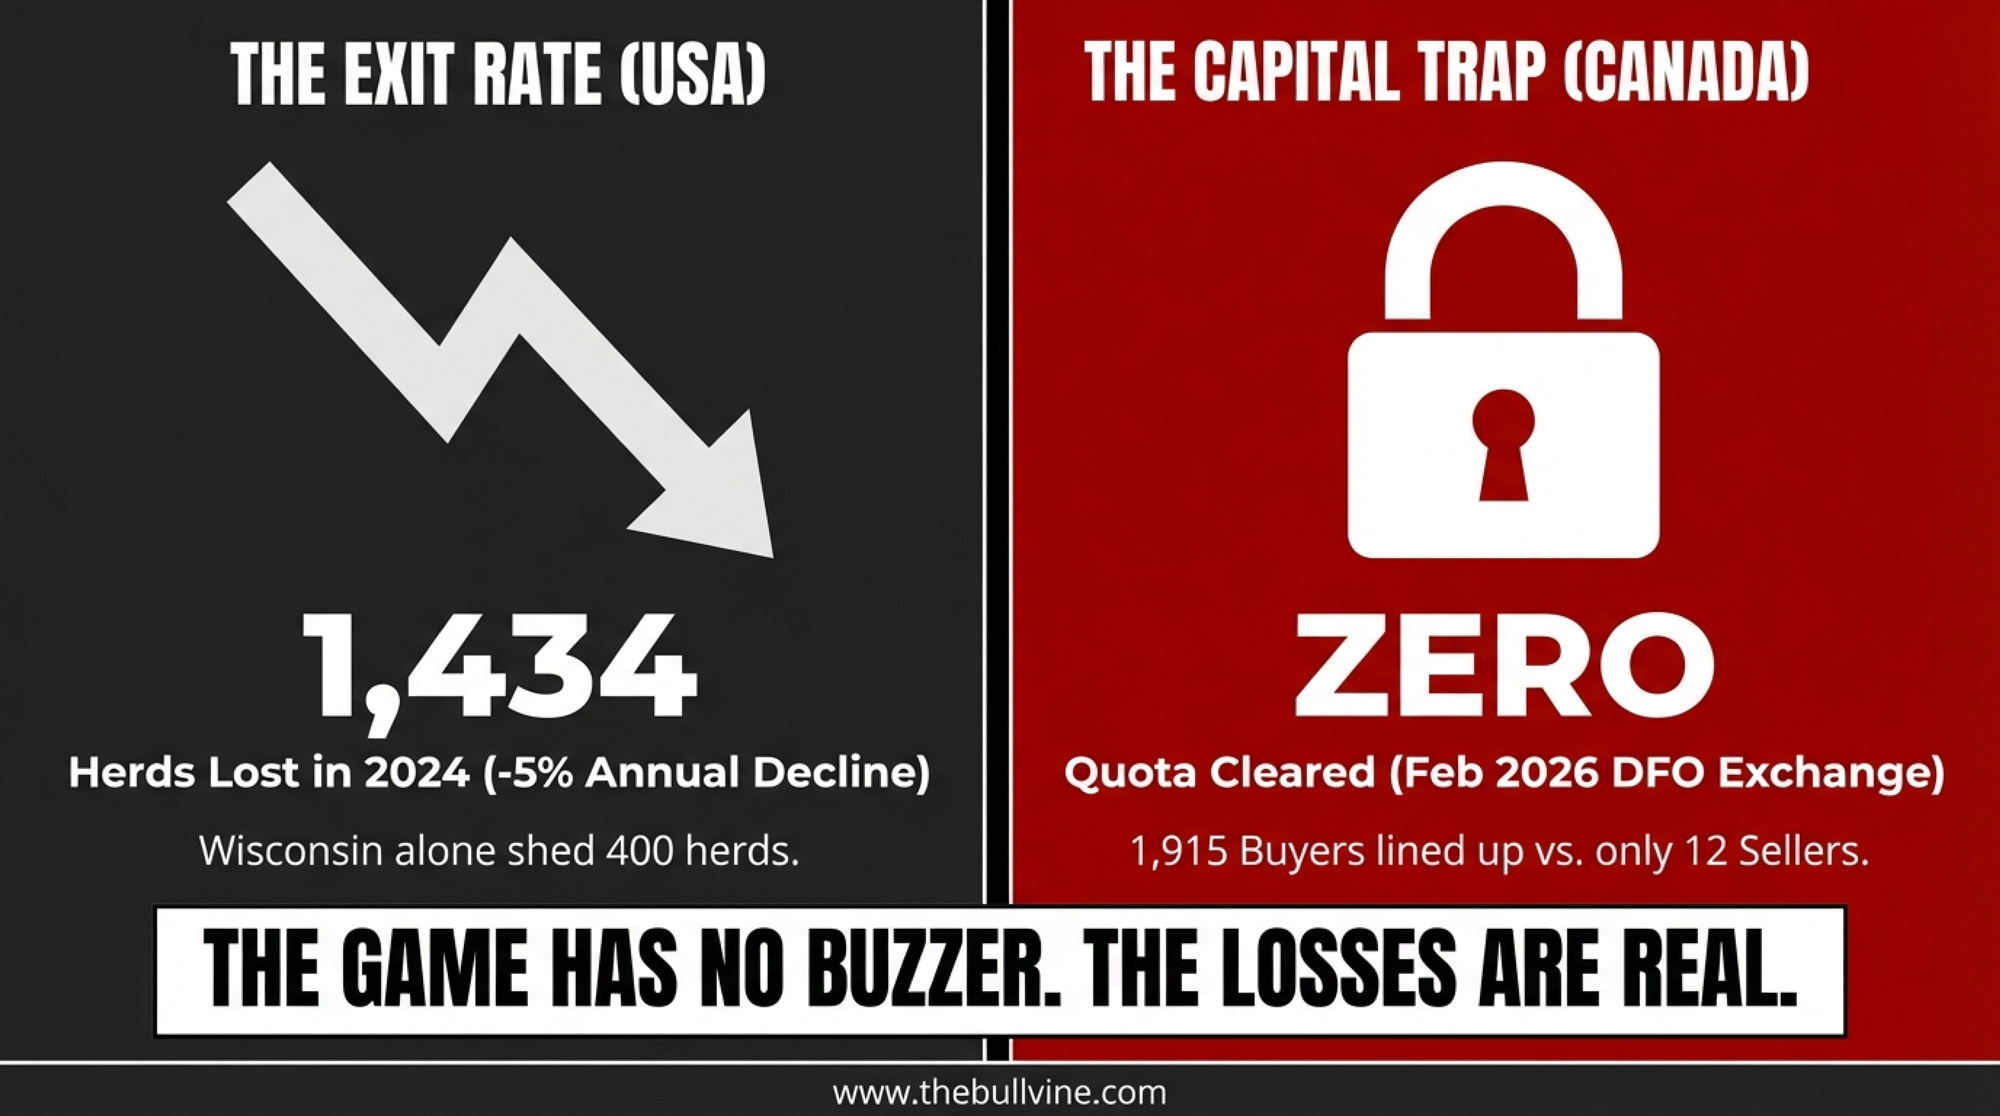
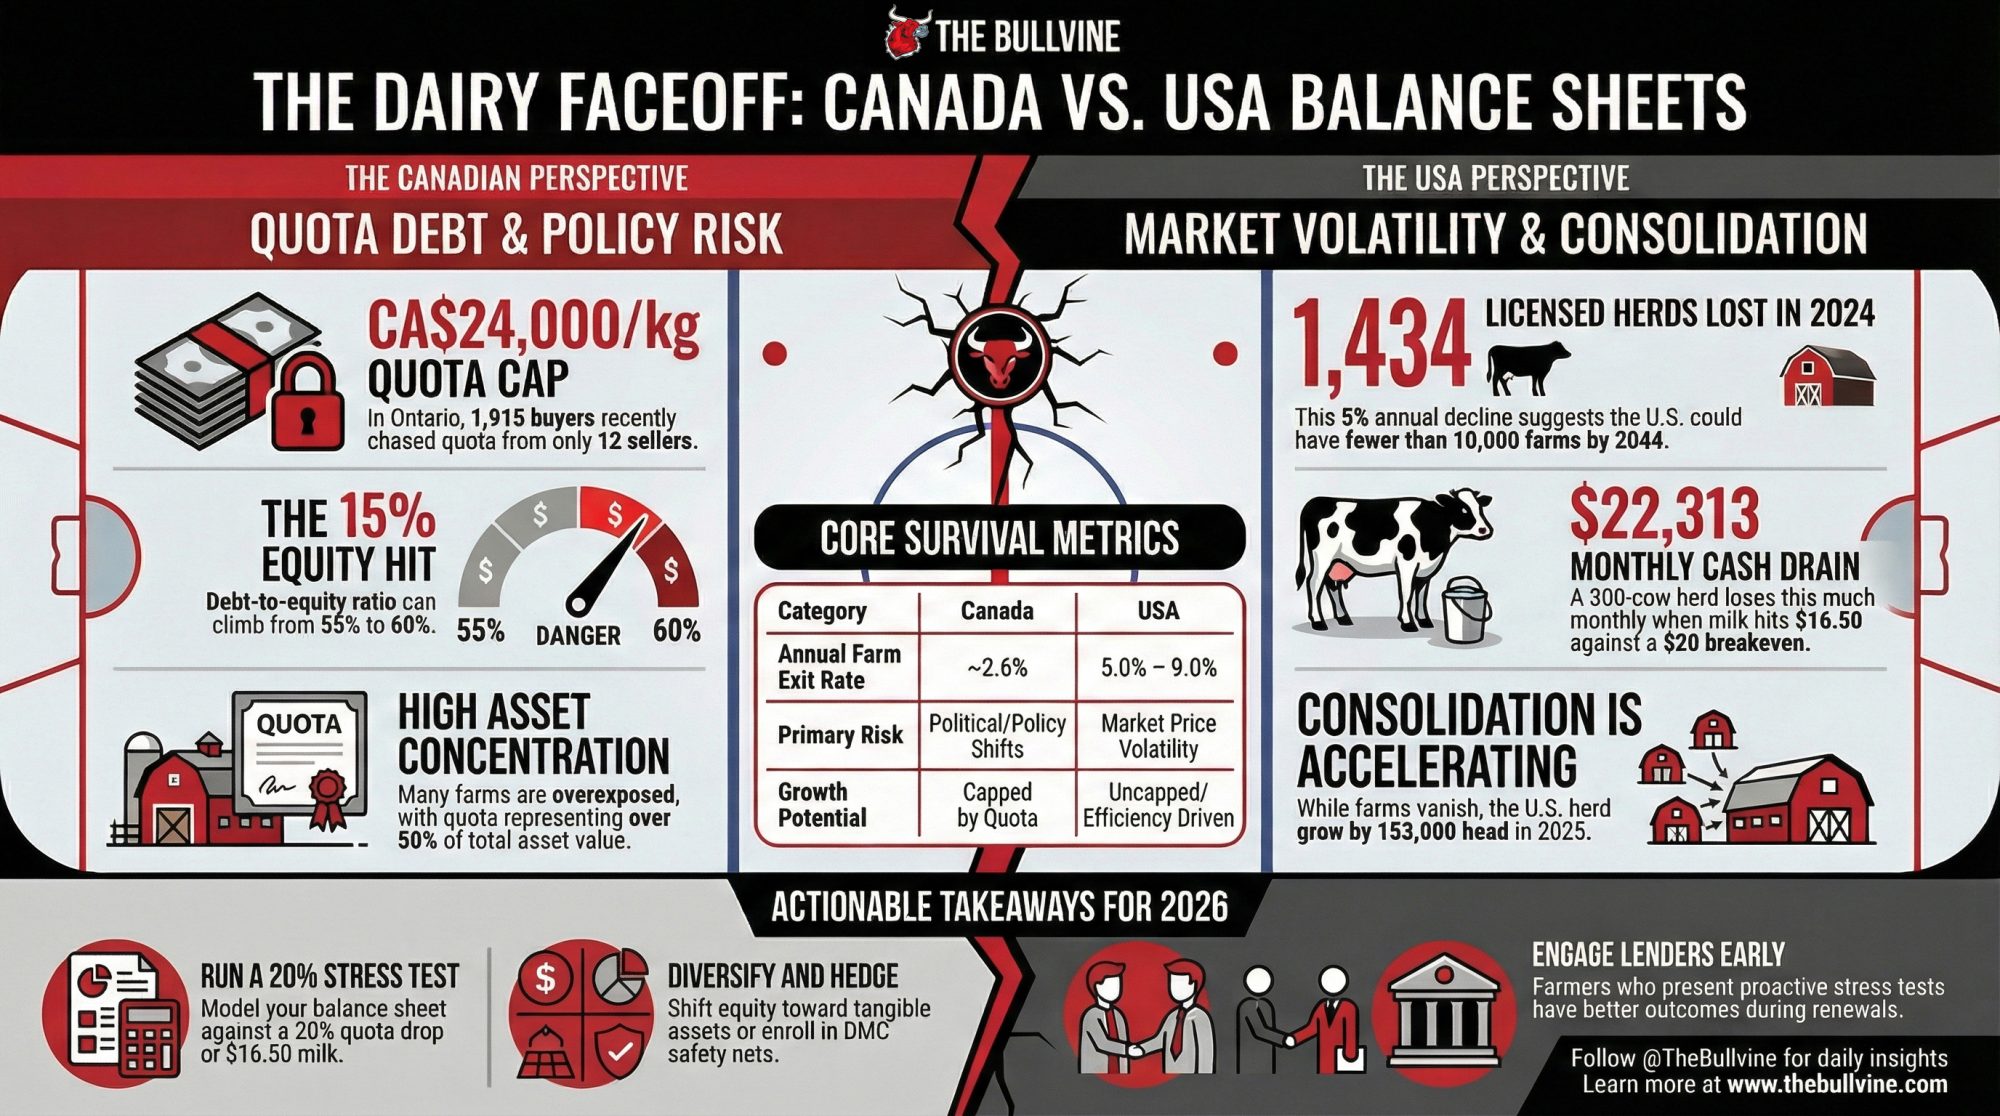
The U.S. lost 1,434 licensed dairy herds in 2024 — a 5% annual decline that dragged the national total to 24,811 operations, with Wisconsin alone shedding 400. At this rate, the country falls below 10,000 dairy farms before 2044. Across the border, Dairy Farmers of Ontario cancelled its February 2026 quota exchange entirely: 1,915 buyers lined up, 12 sellers offered quota, but the system couldn’t clear a single allotment round at the CA$24,000-per-kilogram butterfat cap.
| Year | 5% Decline Scenario | 7.5% Decline Scenario |
|---|---|---|
| 2024 | 24,811 | 24,811 |
| 2027 | 21,000 | 19,800 |
| 2030 | 18,400 | 15,800 |
| 2035 | 13,200 | 9,200 |
| 2040 | 9,500 | 5,300 |
| 2044 | 7,800 | 3,100 |
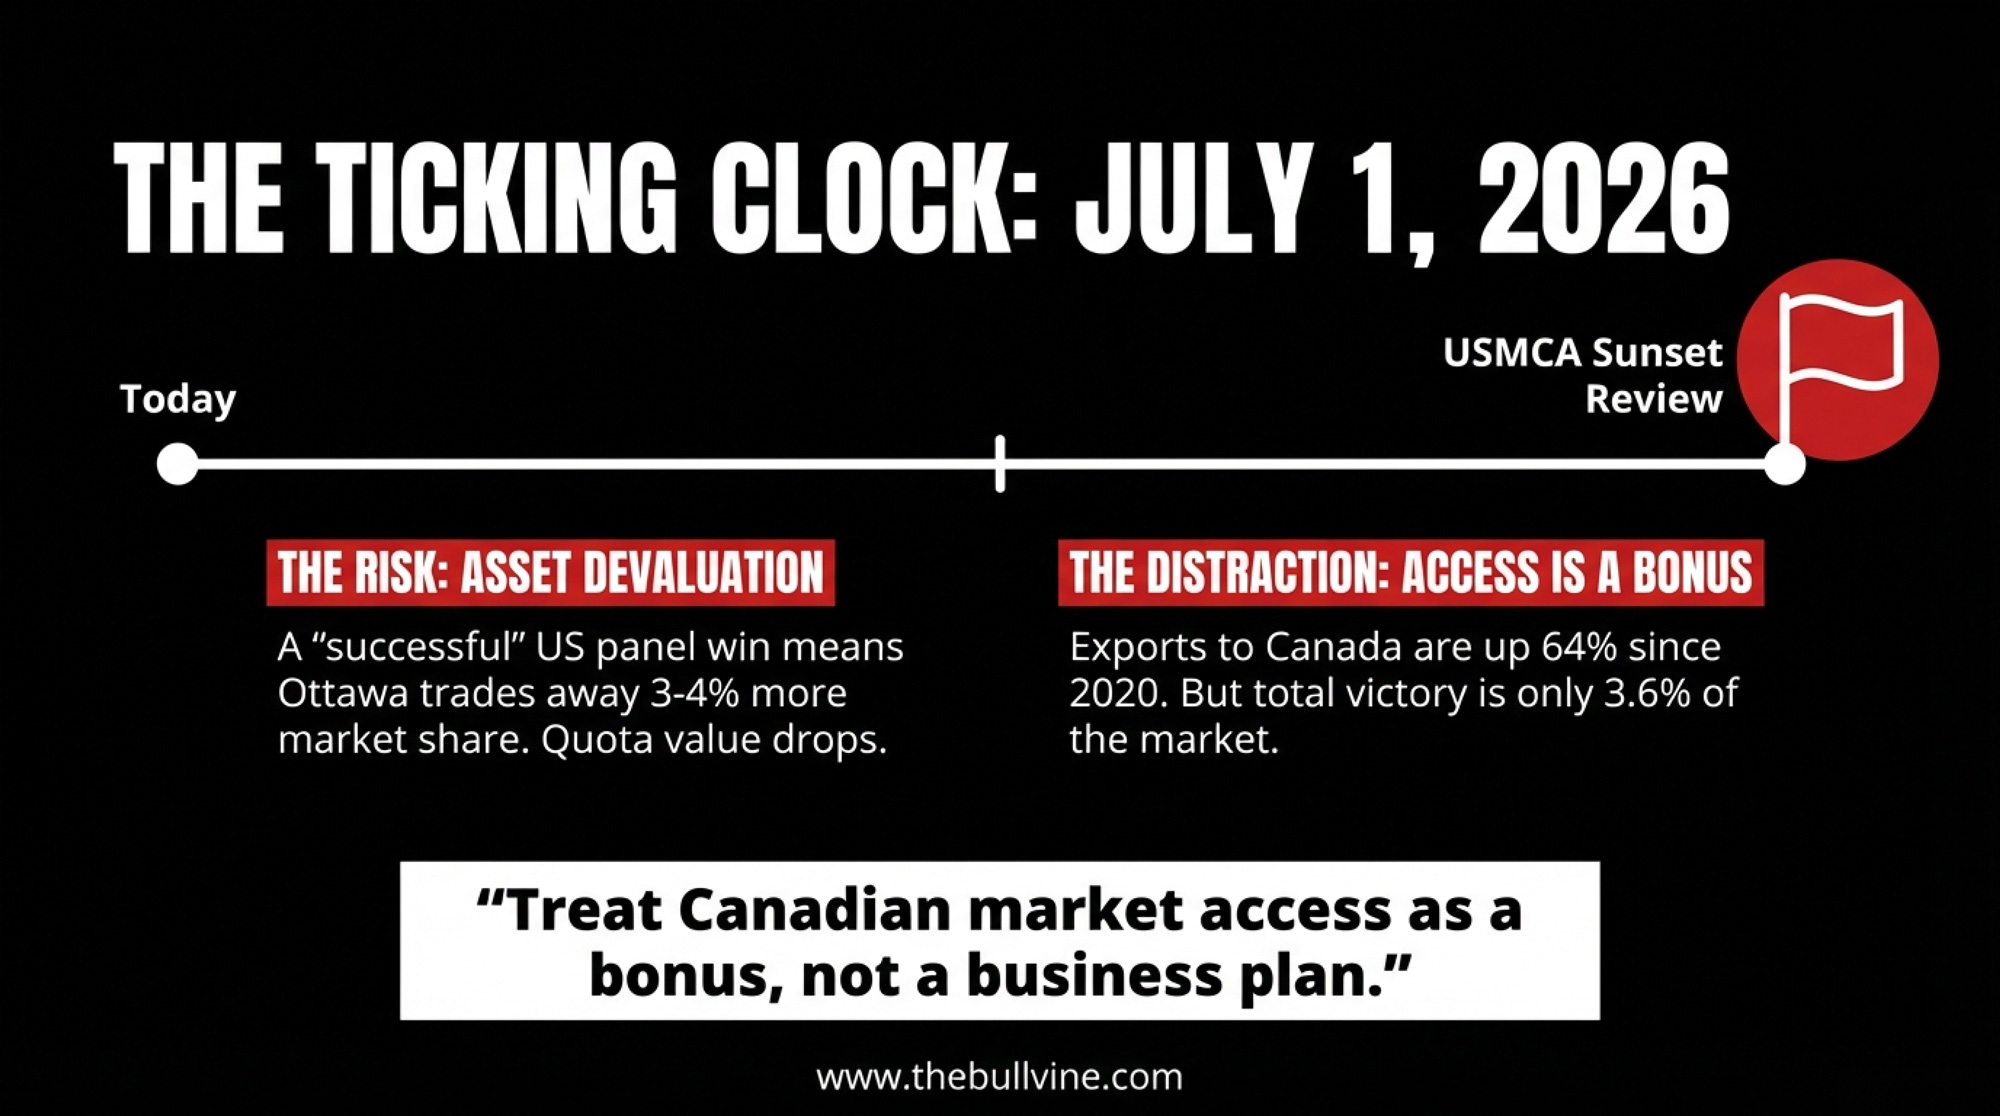
Tomorrow morning, Canada and the U.S. face off for Olympic hockey gold at Milano Santagiulia — 8:10 a.m. ET on NBC. That game lasts sixty minutes. The dairy version of this rivalry has no final buzzer, and the July 1, 2026,USMCA sunset review could rewrite both rule books.
Five months from the most significant dairy trade reset in a generation, neither system is as healthy as its politicians claim. If you haven’t stress-tested your balance sheet against a 15% equity hit, you’re not being an optimist. You’re a spectator.
Two Rule Books, Same Rink
You know the basics, so we’ll keep this tight. Canada runs supply management: production quotas, cost-of-production pricing through the CDC, and import tariffs of 200% to 315%. Your milk cheque is predictable. Your growth is capped.
The U.S. runs an open market with federal safety nets. Dairy Margin Coverage catches you — partially — when margins collapse. But volume is uncapped. That’s freedom. Until DMC margins crash from $15.57/cwt in September 2024 to $10.04/cwt by November 2025. That’s how fast the floor moves.
Two operations will carry this story.
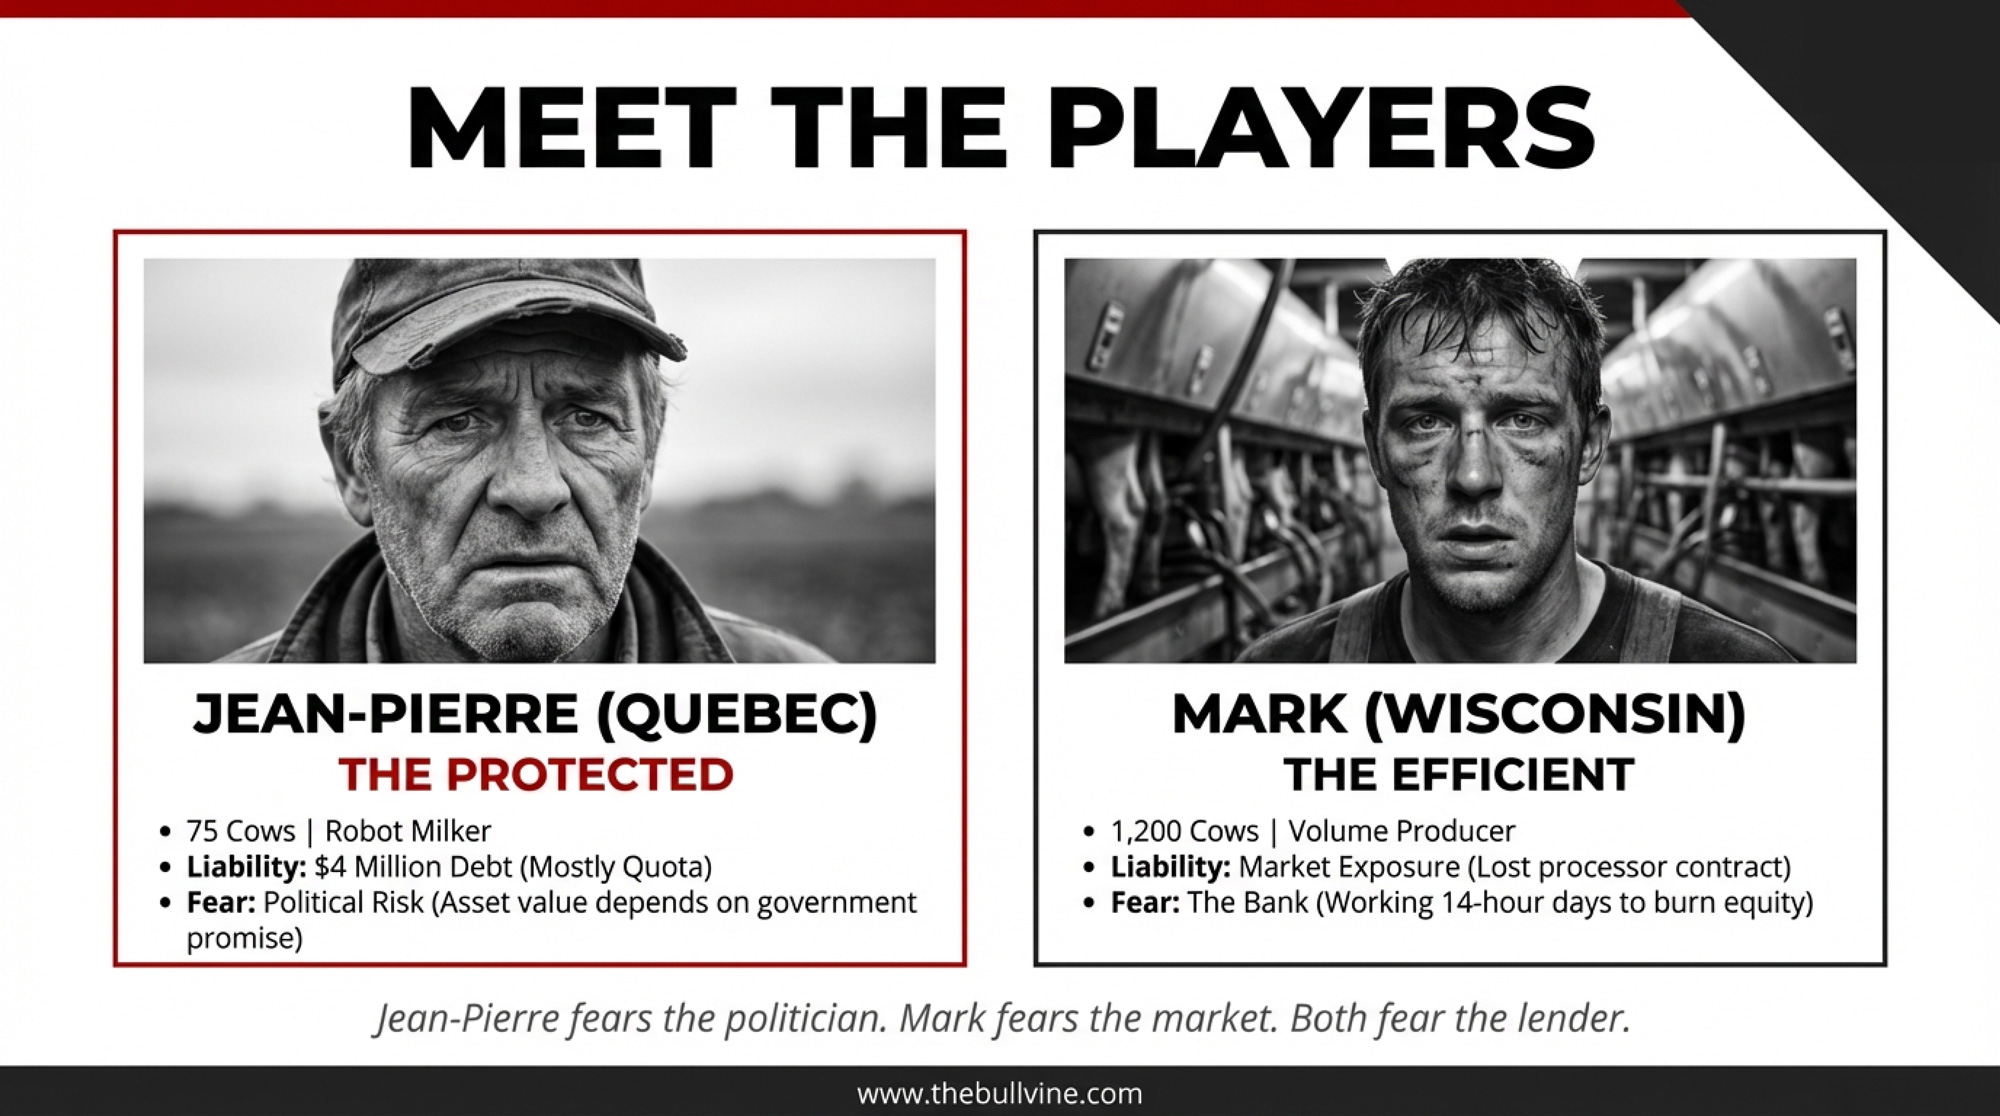
In Quebec, call him Jean-Pierre. Seventy-five cows, a modern robot, and CA$4 million in debt — most of it for the quota he bought to bring his son into the business. His milk cheque is high, but the bank takes most of it. One policy change could blow up his balance sheet, because his CA$3 million in quota value isn’t backed by concrete or genetics. A political promise backs it.
In Wisconsin, call him Mark. Twelve hundred cows. An efficiency machine who just lost a processor contract because the plant switched to “dedicated suppliers” from even larger farms. He’s selling milk on the spot market at a loss, hoping DMC payments and a friendly lender bridge the gap. He has freedom — including the freedom to go broke while working 14-hour days.
Jean-Pierre fears the politician. Mark fears the market. Both fear the bank.
| Metric | Jean-Pierre (Quebec) | Mark (Wisconsin) |
| Herd Size | 75 cows (robot) | 1,200 cows |
| Total Debt | CA$4.0M (75% for quota) | $2.8M (land, equipment, cattle) |
| Quota Asset Value | CA$3.0M @ CA$24,000/kg | N/A |
| Milk Price Stability | High (cost-of-production formula) | Volatile ($16.50–$24/cwt swings) |
| Growth Constraint | Capped by quota availability | Uncapped (if capital/market allow) |
| Primary Risk | USMCA concessions erode quota value | Processor consolidation + spot market collapse |
| Breaking Point | 15% quota drop → 60%+ debt-to-equity → bank review | 6 months @ $16.50 milk → $134K equity burn → DSCR < 1.0 |
| Safety Net | Ottawa compensation (CA$320K over 10 years) | DMC Tier I (covers 65% of output) |
How Many Farms Are Actually Surviving?
USDA NASS data confirms 24,811 licensed U.S. dairy herds at the end of 2024, down 1,434 (about 5%) from the prior year. Eighty-six percent of those losses hit the Midwest and East — Wisconsin dropped 400 herds, Minnesota and New York combined for another 315, and Pennsylvania lost 90. Rabobank’s North American dairy outlook projected roughly 2,800 U.S. dairy closures for 2025 — a 7–9% annual exit rate through 2027. For context, Agriculture Secretary Brooke Rollins was talking about a “golden age” for dairy that same week.
The cows aren’t disappearing. They’re consolidating. The February 20, 2026, USDA Milk Production report shows the U.S. averaged 9.50 million head in 2025, up 153,000 from 2024, with average herd size nationally at 377 cows. More milk from fewer farms. The engine doesn’t have a brake pedal.
Canada’s exit rate runs slower. Agriculture and Agri-Food Canada’s Dairy Sector Profile puts the count at 12,007 farms in 2014 and 9,256 in 2024 — an average annual decline of approximately 2.6%. National average herd size has climbed to 150 cows. But Dalhousie University food economist Sylvain Charlebois co-authored a 2020 report with the University of Guelph’s Simon Somogyi warning that Canada could lose half its dairy farms by 2030 without fundamental supply management reform — a warning he reiterated in May 2025. The DFO exchange cancellation tells the same story from inside the system: when 1,915 producers want to buy quota, and 12 want to sell, the system isn’t just “protective.” It’s a capital trap with a waiting list
What Does a 15% Quota Drop Mean for Your Balance Sheet?
Here’s where the numbers get personal. Grab a pencil.
The Canadian stress test. Take Jean-Pierre’s 100-cow equivalent Ontario operation. At DFO’s CA$24,000/kg butterfat cap and approximately 1.25 kg BF daily allocation per cow, his quota represents roughly CA$3 million in asset value. That quota is collateral for the operating line, the land, the robot, and his parents’ retirement.

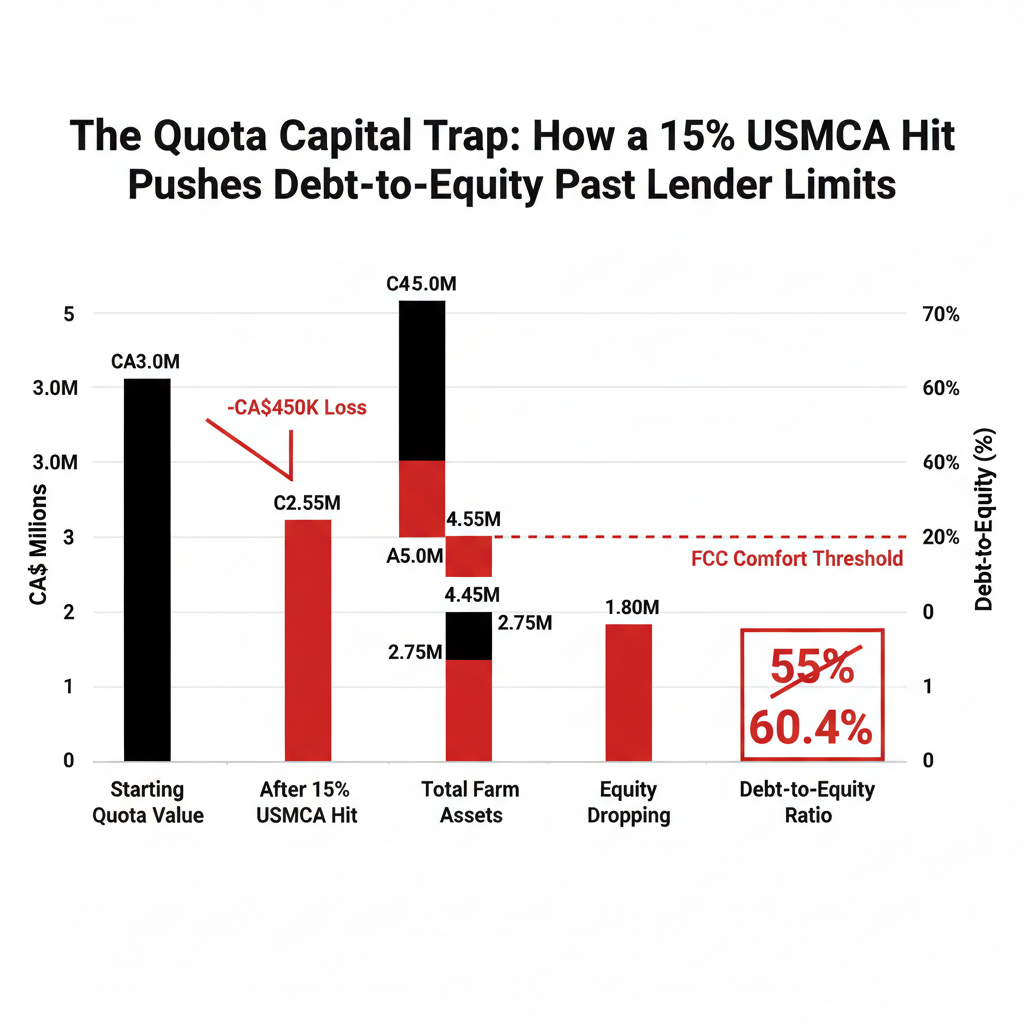
Model a USMCA concession that triggers a 15% decline in quota values:
- Quota asset value drops: CA$3.0M → CA$2.55M (CA$450,000 paper loss)
- Total farm assets: CA$5.0M → CA$4.55M
- Total debt: CA$2.75M (unchanged)
- Equity drops: CA$2.25M → CA$1.80M
- Debt-to-equity ratio jumps: 55% → 60.4%
- That crosses Farm Credit Canada’s comfort threshold for operating renewals
Nobody can assign a probability to this scenario. But if Jean-Pierre hasn’t run it, his lender already has. There’s no futures market for Canadian quota — the succession math just broke, and you can’t hedge against it.
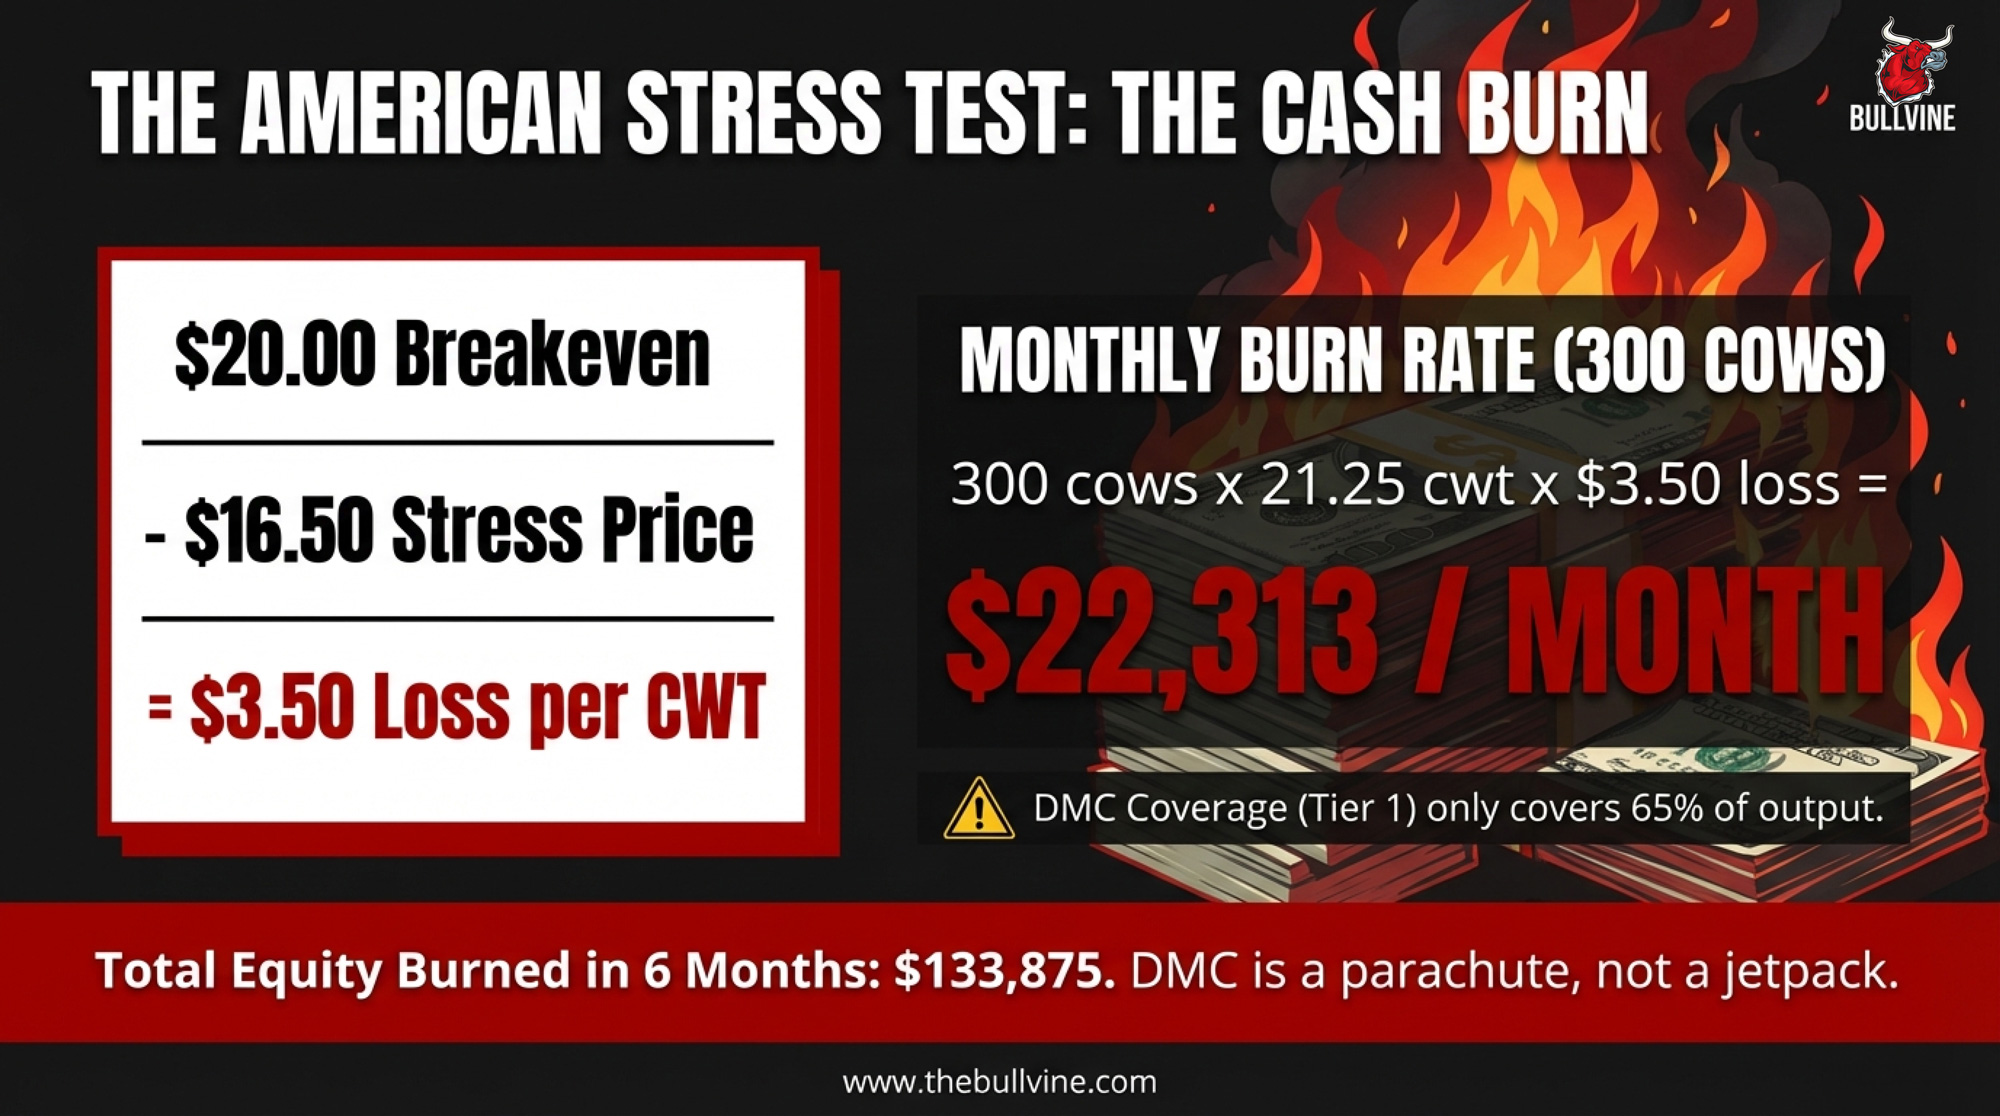
The American stress test. Take Mark’s 300-cow equivalent herd. USDA puts Wisconsin’s average at roughly 25,493 lbs/cow annually — call it 2,125 lbs/cow per month, or 21.25 cwt. The University of Wisconsin–Madison Extension’s July 2025 dairy enterprise budget puts the cost of production in the range of $18.68 to $21.50/cwt. Midpoint: ~$20/cwt. Now stress at $16.50 milk:
- 300 cows × 21.25 cwt/month = 6,375 cwt monthly output
- $20.00 breakeven − $16.50 = $3.50/cwt gap
- 6,375 × $3.50 = $22,313/month cash drain
- DMC Tier I at 5M lbs covers ~4,167 cwt/month — 65% of Mark’s output
- Remaining 2,208 cwt fully exposed: $7,728/month uncovered loss
- Six months at the full rate burns $133,875 in equity
| Month | Monthly Cash Drain | Cumulative Equity Loss |
|---|---|---|
| 1 | $22,313 | $22,313 |
| 2 | $22,313 | $44,626 |
| 3 | $22,313 | $66,939 |
| 4 | $22,313 | $89,252 |
| 5 | $22,313 | $111,565 |
| 6 | $22,313 | $133,878 |
Mark’s lender is already running these numbers. If his DSCR falls below 1.0, the conversation shifts from “renewal” to “exit planning.”
Your turn: [your herd size] × [your cwt/cow/month] × [gap between your breakeven and stress price] = monthly cash exposure. If six months of it exceeds your liquid reserves, you’ve got a decision to make before the market makes it for you.
What Does USMCA 2026 Mean for Your Milk Cheque?
When Idaho dairyman Ted Vander Schaaf told the U.S. Senate Finance Committee on February 12 that the USMCA’s foundation depends on Canada following through on its dairy commitments, Jean-Pierre wasn’t watching C-SPAN. He was doing morning chores. But the testimony was about his CA$3 million.
Here’s what the trade data shows. U.S. dairy exports to Canada topped $1.2 billion through the first 11 months of 2025 — up 11% from 2024 and 64% higher than 2020. America is already selling plenty of dairy into Canada, despite the rhetoric. The central U.S. complaint: Canada allocates 85–100% of its tariff-rate quotas to Canadian processors—the companies with the least incentive to import American competition. Average TRQ fill rates: just 42% across key categories.
Congressional pressure is bipartisan and escalating. In December 2025, Rep. Jim Costa led 74 members of Congress in pushing USTR to hold Canada accountable. On February 5, USDEC and NMPF co-launched the Agricultural Coalition for USMCA.
Every percentage point of additional access erodes the structural guarantee that makes Jean-Pierre’s quota valuable. DFC president Pierre Lampron called the original USMCA signing “a dark day in the history of dairy farming in Canada” on November 30, 2018. Since then, Ottawa has committed CA$2.95 billion in direct compensation to dairy producers — CA$1.75 billion for concessions under CETA and CPTPP (disbursed between 2019–20 and 2022–23) and CA$1.2 billion for CUSMA (being disbursed from 2023–24 through 2028–29), according to Agriculture and Agri-Food Canada’s Dairy Direct Payment Program. That works out to roughly CA$320,000 per farm spread over a decade. It was an admission that concessions cause real financial damage. The question for 2026 isn’t whether more damage is coming. It’s how much, and whether the next round covers the gap between what Jean-Pierre’s quota was worth on June 30 and what it’s worth on July 2.
For Jean‑Pierre, a “successful” U.S. panel win looks like Ottawa trading away 3–4% more of his home market so Mark can ship more powder north — and his banker quietly repricing that CA$3 million quota.
For Mark, more Canadian access is a bonus, not a lifeline. Even if U.S. negotiators win everything they want, 3.6% of the Canadian market is a small number against 225.9 billion pounds of domestic production. Don’t build a business plan around it.
The Invisible Cost Neither System Budgets For
Dr. Andria Jones-Bitton’s survey of 1,132 Canadian farmers, conducted in 2015–16 and published in Social Psychiatry and Psychiatric Epidemiology in 2020, found 45% reported high stress, 57% met criteria for anxiety classification, and 35% for depression — all far above the general population. Her pandemic follow-up found every metric worsened. Jean-Pierre’s stress is capital-weighted — a multi-million-dollar asset controlled by politicians he can’t lobby. Mark’s is market-weighted — chronic price swings and the knowledge that 1,434 operations vanished last year. Neither system budgets for this, but both pay for it — in burnout, in broken families, in farms that go dark.
If you’re struggling: Farm Aid 1-800-FARM-AID | 988 Suicide & Crisis Lifeline | Do More Ag Foundation (Canada)
Canada vs USA Dairy Farming: Which System Wins?
If Jean-Pierre and Mark sat down with this table, here’s what each would circle first:
| Category | Edge | The Asterisk |
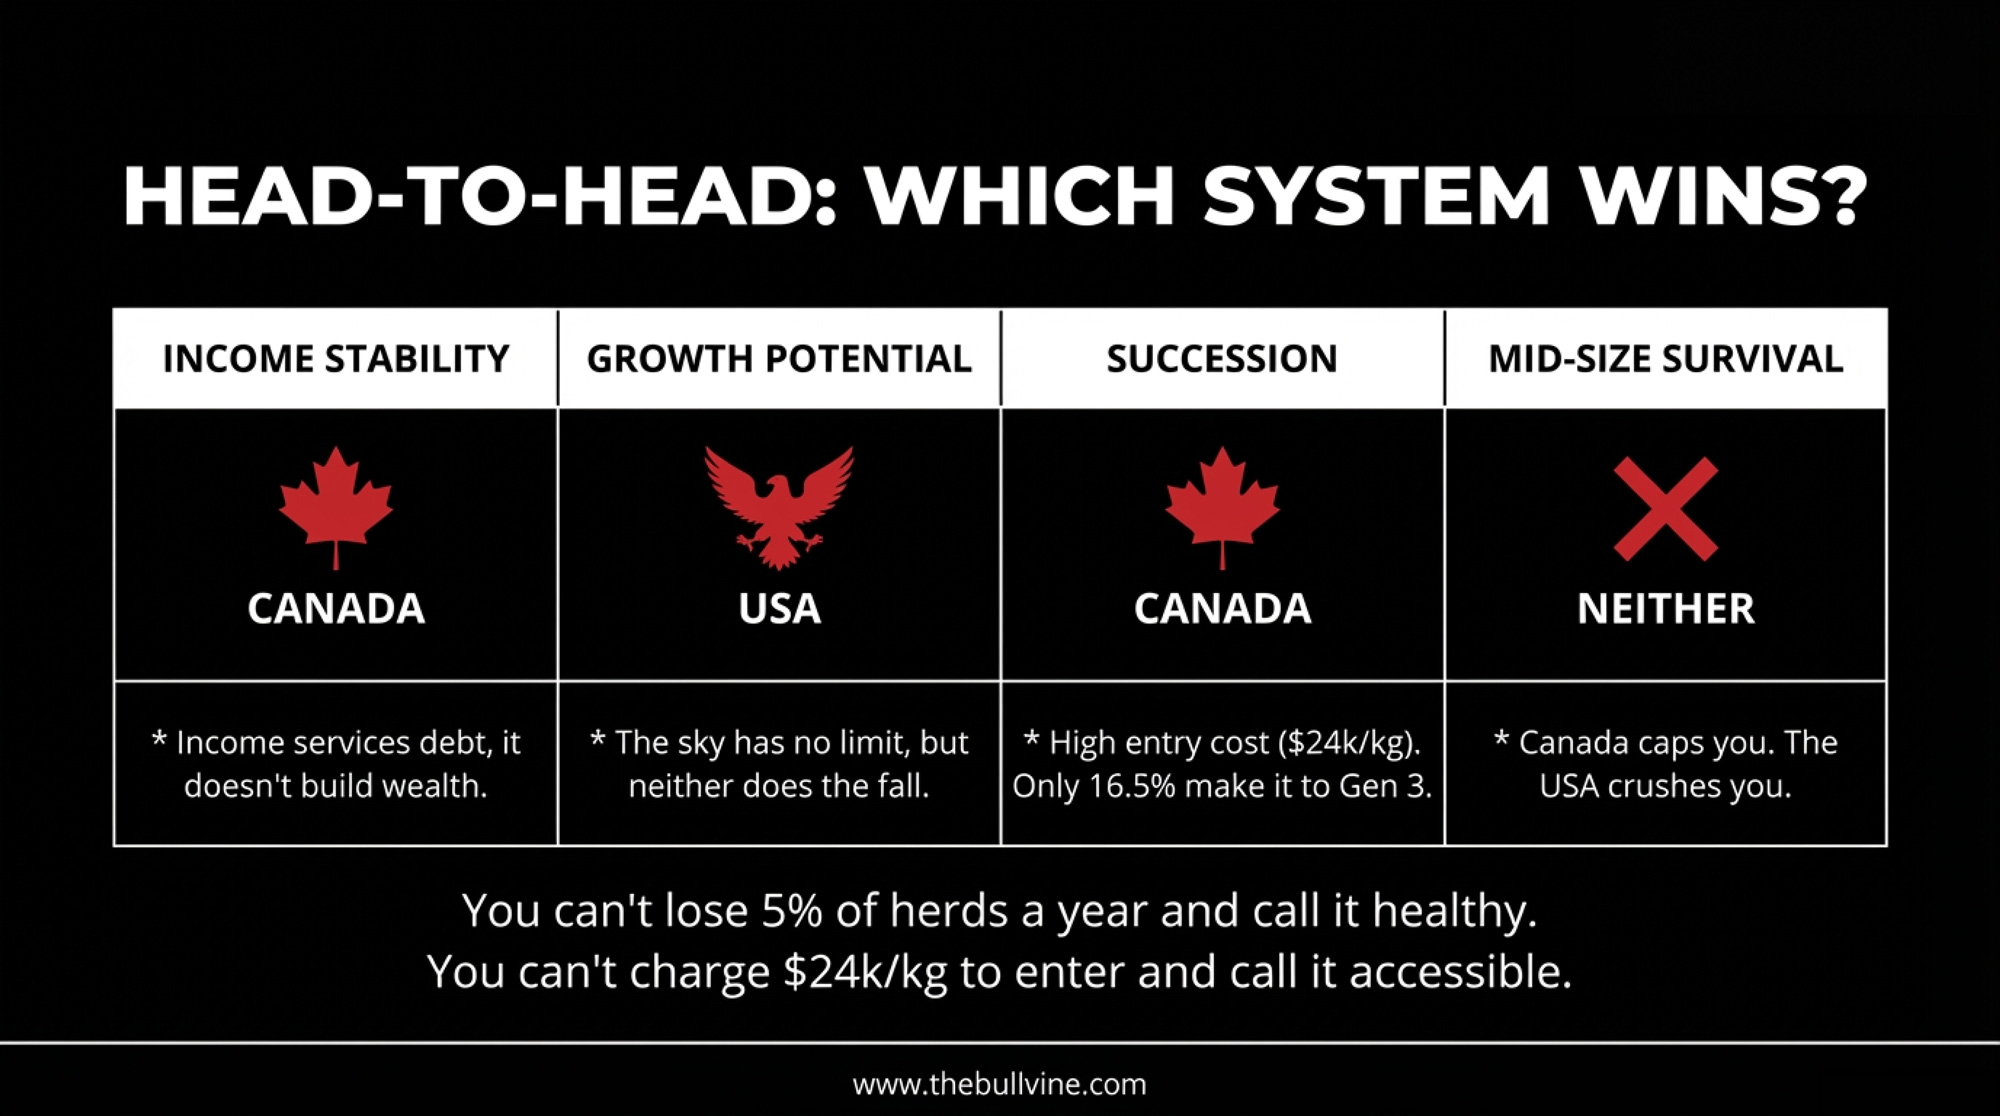
| Income Stability | Canada | Jean-Pierre’s “stable income” services CA$24,000/kg debt — it doesn’t build wealth |
| Growth Potential | U.S. | Mark’s sky has no limit. Neither does the fall |
| Entry for Young Farmers | U.S. | No quota to buy. But you’re entering a market, losing 5–9% of participants per year |
| Succession | Canada | 98% of Canadian dairy farms are family-owned and operated, per DFC’s 2025 pre-budget submission. But 88% lack a formal written succession plan, and only about 16.5% of family farms make it to a third generation |
| Trade Policy Risk | U.S.(lower) | Mark’s operation isn’t collateralized on a political construct. |
| Mid-Size Survival | Neither | Canada caps you. The U.S. crushes you. Both bleed the middle. |
The Canadian system is arguably superior for preserving a mid-sized family farm that already exists. It creates a stable, middle-class existence for 9,256 families. The U.S. system is superior for the entrepreneur who can stomach the casino.
But you can’t lose 5% of your farms every year and call it “healthy”. And you can’t charge CA$24,000 per kilogram for the right to milk a cow and call it “accessible”. Both systems are aging out — just at different speeds and for different reasons.
What This Means for Your Operation
If you milk in Canada (Jean-Pierre’s playbook):
- 30 days: Run three balance-sheet scenarios through FCC’s calculator — current quota value, minus 10%, minus 20%. If the minus-20% scenario pushes your debt-to-equity above 0.60, you need a contingency plan before Ottawa sits down at the table.
- 90 days: If the quota represents more than 50% of your total asset base, you’re overexposed to a single political construct. Start shifting equity toward land, equipment, or off-farm investments. The trade-off is real: diversification capital competes with quota debt service. But the concentration risk is worse.
- 365 days: Get involved in producer organizations ahead of the USMCA talks. Don’t let the November 2023 panel victory create complacency. The sunset clause is a reset button, not a renewal.
If you milk in the U.S. (Mark’s playbook):
- 30 days: Enroll in DMC by February 26. The production history reset and higher Tier I cap change the math for every herd under 350 cows. The trade-off: Tier II coverage gets expensive for larger herds, and the 5M-lb Tier I cap still leaves Mark’s remaining output exposed. Model it anyway.
- 90 days: If your all-in cost of production exceeds $20/cwt and your DSCR sits below 1.15, you’re one 90-day price dip from an exit conversation. Run the number now. Review processor contract renewal terms — if yours expires before December, negotiate before July 1, as leverage dynamics change.
- 365 days: Treat Canadian market access as a bonus, not a business plan. Invest in what you can control: efficiency, milk quality, risk management, and genetics aimed at the component premiums processors are chasing.
If you milk on either side:
- Watch the ITC report on Canadian dairy protein — expected March 2026, four months before the USMCA decision. It sets the tone.
- Talk to your lender. Now. Not when you’re in trouble. The farmer who walks in with a stress test gets a different conversation than the one who gets called in.
| Timeframe | If You Milk in Canada 🇨🇦 | If You Milk in USA 🇺🇸 | Both Systems |
| 30 Days | Run 3 balance-sheet scenarios (current, −10%, −20% quota value). If −20% pushes debt-to-equity >60%, you need a plan now | Enroll in DMC by Feb 26. Model Tier I production history reset vs cost | Stress-test your actual breakeven. Stop guessing. |
| 90 Days | If quota = >50% of total assets, you’re overexposed to a political construct. Start shifting equity to land/equipment/off-farm | If cost of production >$20/cwt and DSCR <1.15, you’re one 90-day price dip from exit | Talk to your lender NOW—before you’re in trouble |
| 90 Days | Get involved in producer orgs before USMCA talks. Panel victory ≠ complacency | Review processor contract terms if yours expires before Dec. Negotiate before July 1 | Watch the March ITC report on Canadian dairy protein—it sets the tone |
| 365 Days | Diversification capital competes with quota debt service, but concentration risk is worse | Treat Canadian access as bonus, not business plan. Invest in efficiency, quality, genetics | Neither government has your back. Plan accordingly. |
| 365 Days | Don’t let July 1 sunset clause sneak up on you—USMCA is a reset button, not auto-renewal | Processors are chasing component premiums—breed for what they’ll pay for, not what they paid for | The rules change July 1. Your balance sheet needs to work on July 2. |
Key Takeaways
- If you’re in Canada, a 10–15% quota value hit in the 2026 USMCA review can push your debt‑to‑equity from the mid‑50s into the 60s fast — run those scenarios now.
- If you’re in the U.S., six months of $16.50 milk on a $20/cwt breakeven can burn well over $100,000 in equity on a 300‑cow herd, even with DMC — your DSCR needs to be safely above 1.15.
- When the quota is more than 50% of your total assets, or your lender already flags leverage, you’re overexposed to forces you don’t control on either side of the border.
- Treat extra Canadian market access as found money, not a business plan, and treat current quota values as political, not permanent — both systems reward those who stress‑test and adjust early.
- The men’s hockey gold medal game ends Sunday; the real Canada–USA faceoff is whether your balance sheet still works on July 2 if the rules or the milk price move against you.
The Real Gold Medal
The jerseys come off tomorrow. The medals get boxed. The hashtags fade.
But Jean-Pierre will still walk into his Quebec barn at 4:30 a.m. on Monday, servicing CA$4 million in debt on a political promise that expires in 131 days. And Mark will still be milking 1,200 cows in Wisconsin on the spot market, watching his equity burn at $22,313 a month while waiting for a rally that may not come before his lender’s patience runs out.
Both are betting entire family histories on systems that haven’t been tuned since the last time the border was this tense. The real win isn’t a gold medal. It’s making sure there are still farm families on both sides with enough skin in the game when the next generation drops the puck.
Start with your own balance sheet. What’s your actual debt-to-equity ratio today — and what does it look like on July 2 if quota drops 15% or milk hits $16.50 for six months?

Executive Summary:
The U.S. lost 1,434 dairy herds in 2024, while Ontario’s February 2026 quota exchange was cancelled after 1,915 buyers chased quota from just 12 sellers at CA$24,000/kg. This article uses the men’s hockey gold medal game as the backdrop to show the real Canada–USA faceoff: quota‑backed stability with capital risk versus open‑market upside with a 5–9% annual farm exit rate. For Canadian producers, it shows how a 10–15% quota value hit in the 2026 USMCA review could push debt‑to‑equity ratios past lender comfort levels. For U.S. herds, it shows what six months of $16.50 milk does to a 300‑cow balance sheet, even with DMC, and why more access to Canada is a bonus, not a business plan. You get step‑by‑step barn math to plug in your own herd size, breakeven, and equity, plus a 30/90/365‑day checklist for both systems. If you’re milking on either side of the border, this is your game tape before July 1 — because when the gold medals are boxed away, your balance sheet is still on the ice.
Complete references and supporting documentation are available upon request by contacting the editorial team at editor@thebullvine.com.
Learn More
- Profitable but Drowning: The Interest Rate Crisis Reshaping Mid-Size Dairy – Arms you with a line-by-line breakdown of how 2025 loan repricing impacts your bottom line. It exposes the $1.30/cwt hidden cost of debt and delivers a 90-day survival checklist to keep your lender from calling the loan.
- USMCA 2026: The $200M Question – Why Only 42% of U.S. Dairy Access to Canada Gets Used – Reveals why USMCA market access is failing and breaks down the structural loopholes negotiators must fix by July. It positions your operation to capitalize on the 2026 “reset” by identifying real trade growth beyond the political headlines.
- The Next Frontier: What’s Really Coming for Dairy Cattle Breeding (2025-2030) – Explores how CRISPR and AI are projected to deliver up to $5,000 in extra annual revenue per cow by 2030. It reveals a roadmap to transition from commodity volume to high-value “designer milk” components that outpace traditional markets.
 The Sunday Read Dairy Professionals Don’t Skip.
 The Sunday Read Dairy Professionals Don’t Skip.
Every week, thousands of producers, breeders, and industry insiders open Bullvine Weekly for genetics insights, market shifts, and profit strategies they won’t find anywhere else. One email. Five minutes. Smarter decisions all week.


