
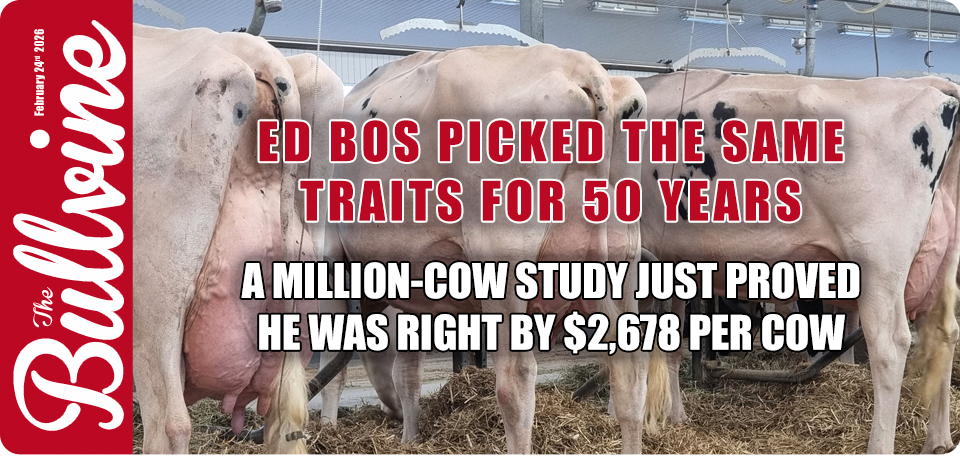


Before your next semen order, read this: the traits adding $2,678 per cow aren’t the ones on the show posters.
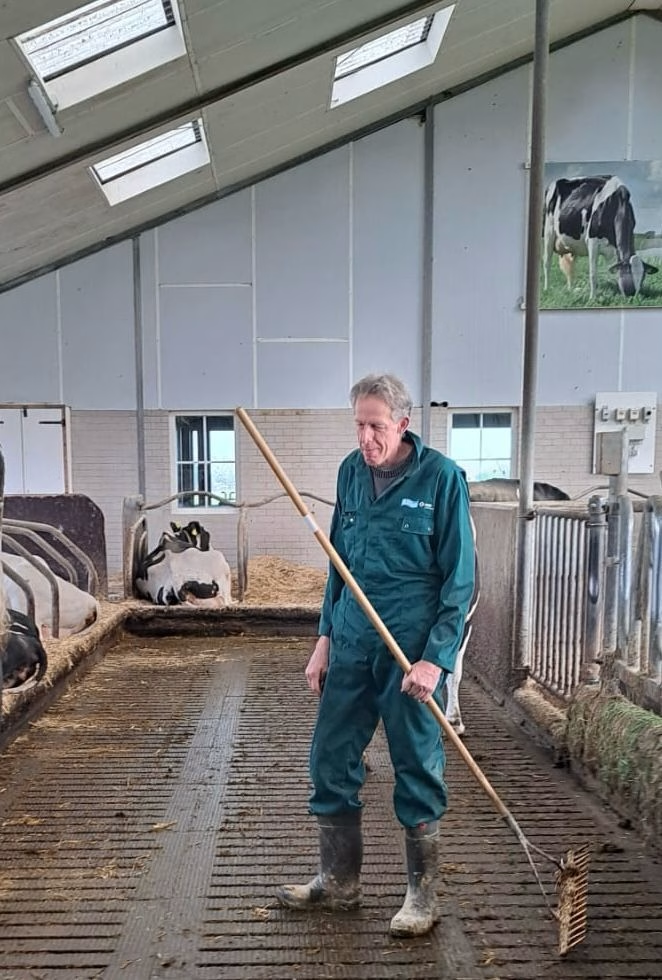
Even “on vacation,” Ed Bos reaches for a broom. The breeder behind 415 Excellent Holsteins and three Master Breeder shields at Bosdale Farms in Cambridge, Ontario, is pitching in at Bons Holsteins in Ottoland, Netherlands — the operation of Nico Bons, who trained under Ed as an 18-year-old in 1994 and has since bred 127 homebred Excellents and won the 2022 European Championship at Cremona. The mentorship started with clean barns. Three decades later, it still does. (Read more about Ed’s influence on Nico)
Ed Bos has been picking bulls the same way since he was a teenager at Bosdale Farms in Cambridge, Ontario: udders, feet, legs, and rumps. Not stature. Not dairy character. The rest of the industry spent fifty years rewarding tall, sharp cows — 415 Excellent-classified Holsteins and three Holstein Canada Master Breeder shields later, nobody’s calling it stubbornness anymore.
“We have always believed that breeding for a well-balanced high-type cow achieves the highest profitability,” the Bos family says. “An excellent cow is a good benchmark for longevity. We see our profitability per cow being maximized with cows that continue to keep themselves in the herd.” (Read more: Bosdale Farms: The Legacy Behind Canada’s Most Excellent Cows)
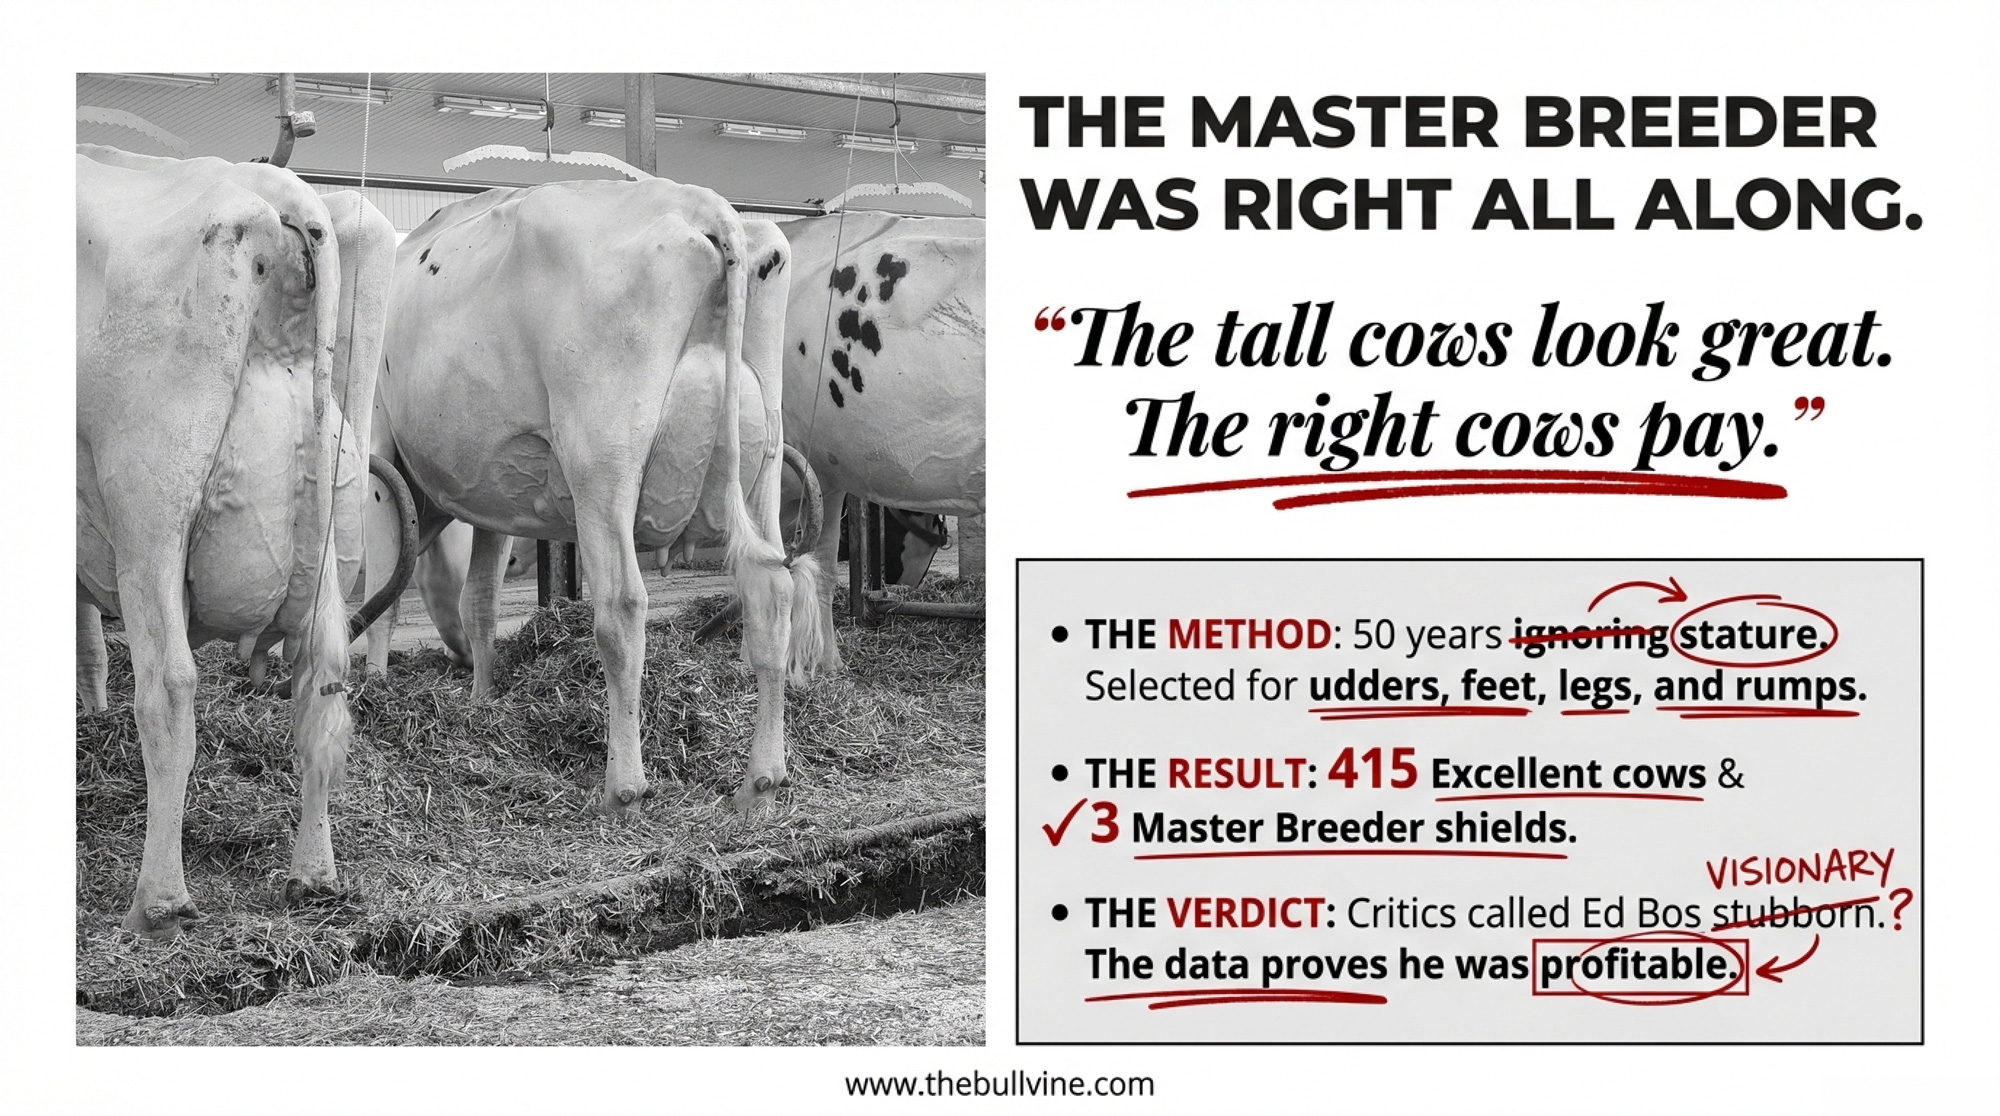
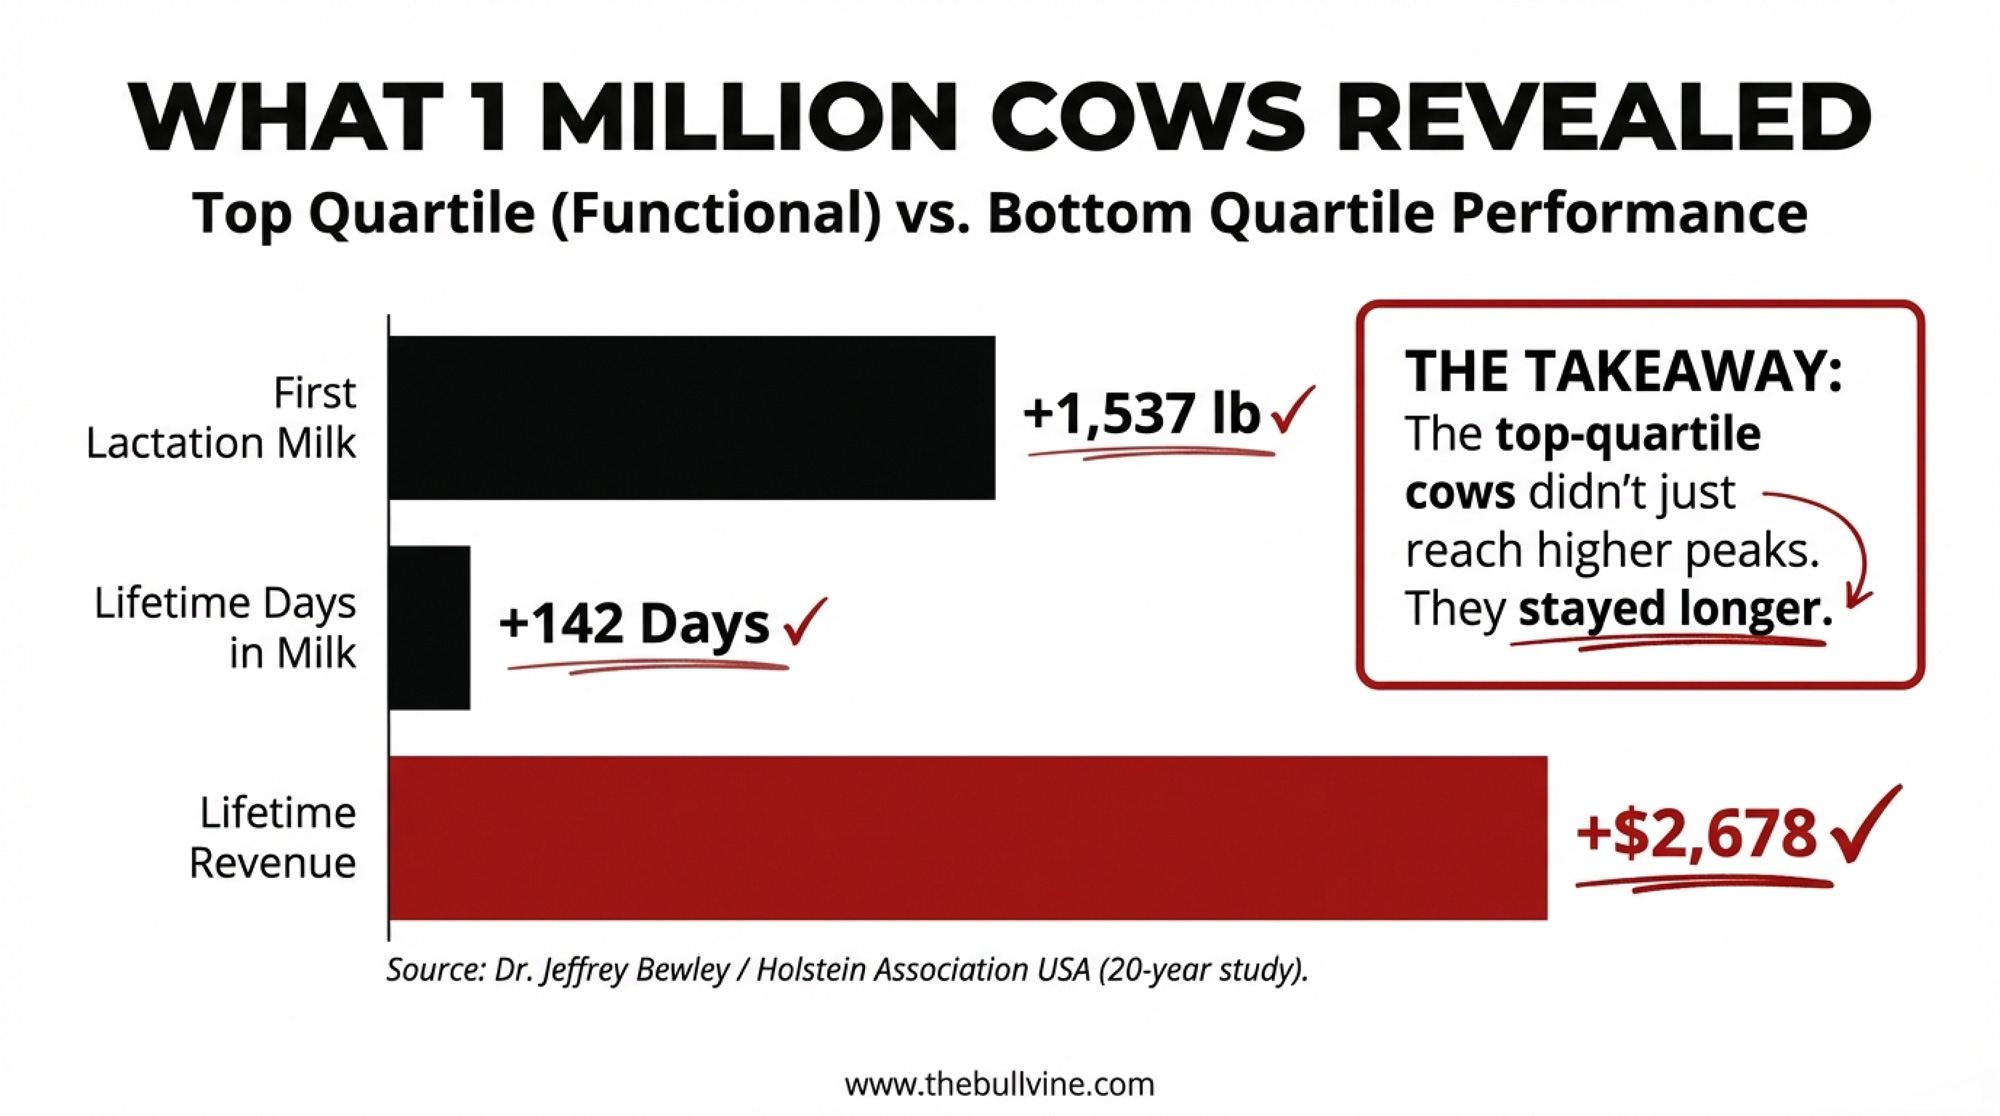
Then Dr. Jeffrey Bewley’s team at Holstein Association USA matched classification records against lifetime production data for over one million cows. The functional traits Ed Bos built his herd on — the ones that don’t win Grand Champions — turned out to be worth $2,678 per cow in lifetime revenue. The tall cows look great. The right cows pay.
What Did a Million Cows Actually Reveal?
Bewley brought a bias to the research — and he’s been honest about it. He figured conformation probably wouldn’t matter as much as breeders believed. Type traits felt to be softer than genomic predictions and production data.
His team — Lindsey Worden, Daren Sheffield, and Bewley — presented “A Million Reasons Why Conformation Matters” at the 16th Western Dairy Management Conference in March 2023, with the full report published at holsteinusa.com/typematters. They split over one million U.S. Holsteins spanning nearly 20 years into quartiles by first-lactation final score. Top quartile (82–89) versus bottom quartile (76 and below).
The gaps weren’t subtle:
- 1,537 lb more first-lactation 305-day energy-corrected milk
- 13,389 lb more lifetime ECM — approximately $2,678 in gross milk revenue per cow, using Holstein USA’s long-term milk price of $20/cwt
- 142 more lifetime days in milk — nearly five extra months producing
The top-quartile cows didn’t reach higher peaks. They stayed longer. And the linear traits that kept them milking — udders and feet-and-legs — weren’t the traits that make classifiers or show judges stop and stare. They’re the ones Ed Bos has been quietly selecting for since the early 1970s.
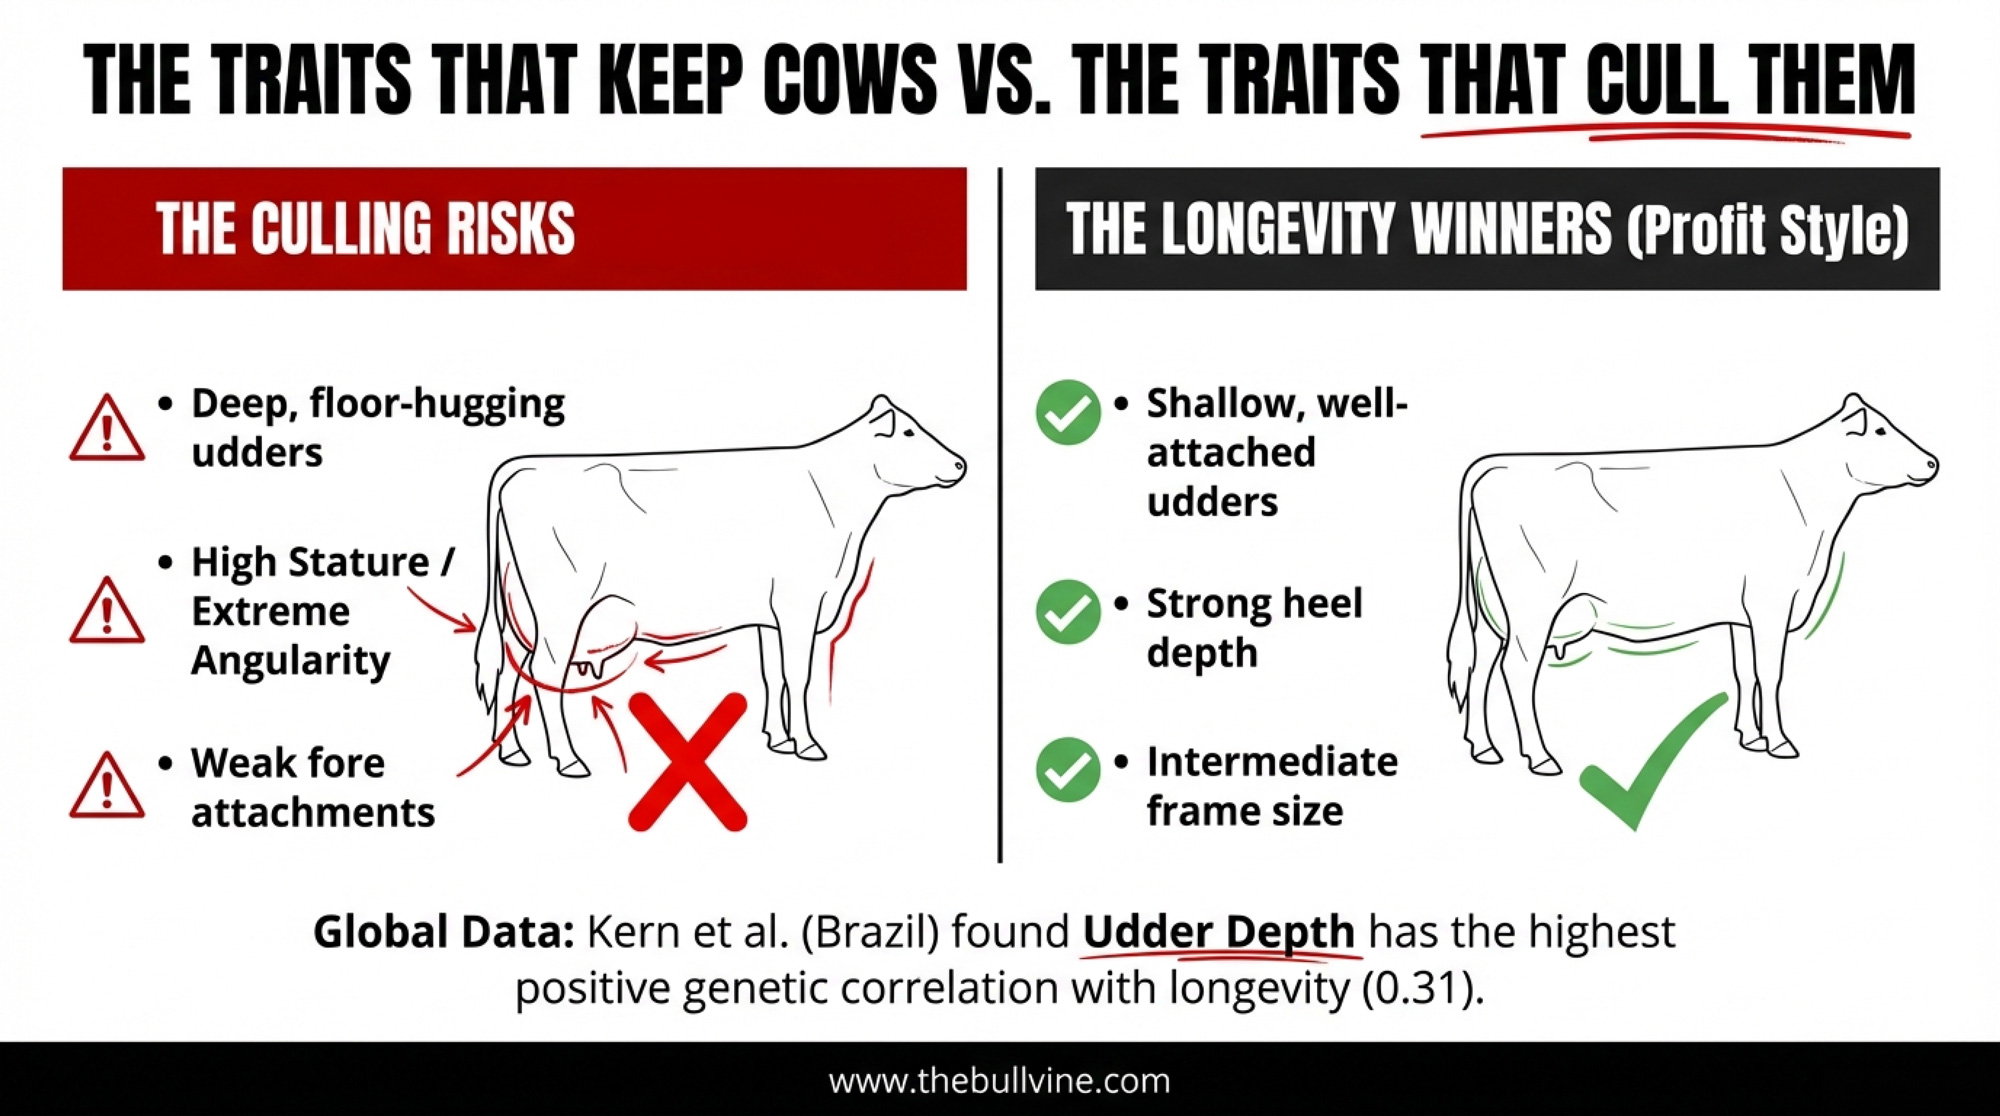
Which Traits Keep Cows in the Herd — and Which Push Them Out?
If you’ve pulled your culling records and wondered why some of your highest-scored heifers don’t make it to third lactation, the answer is probably hiding in which traits earned those scores.
| Trait Category | Keeps Cows in the Herd | Pushes Them Out Early |
| Udder Depth | Shallow, well-attached (genetic correlation +0.31 with longevity) | Deep, “floor-hugging” udders |
| Fore Attachment | Strong, tight fore attachment | Weak or loose fore attachments |
| Frame & Body Depth | Intermediate frame / moderate body depth | Deep-bodied, heavy-framed cows (correlation −0.15) |
| Rear Udder | High rear udder height | Low rear udder height (worst when paired with angularity) |
| Feet & Legs | Strong heel depth (top contributor to Pro$ in Alcantara 2022 study) | Shallow heels / flat feet |
| Combination | Wide chest + shallow udder + strong heels | Deep body + weak fore udder + angular (p < 0.0001) |
This isn’t a single study from a single country. Kern et al. (2015) studied Brazilian Holsteins born from 1990 to 2008. Setati et al. (2004) analyzed 34,201 cows in Southern Africa. Török et al. (2021) tracked 17,717 Hungarian Holstein-Friesians. The udder-trait findings held across all three:
| The Longevity Winners | The Culling Risks |
| Shallow, well-attached udder depth | Deep, “floor-hugging” udders |
| Strong, tight fore attachment | Weak or loose fore attachments |
| Intermediate frame / moderate body depth | Deep-bodied, heavy-framed cows |
| High rear udder | Low rear udder height |
| Strong heel depth | Shallow heels / flat feet |
Sources: Kern et al. (2015), Scientia Agricola; Setati et al. (2004), Tropical Animal Health and Production; Török et al. (2021), Animals.
Kern’s data is particularly telling: udder depth showed the highest positive genetic correlation with longevity at 0.31. Direct selection for longevity is painfully slow — heritability sits at just 0.05–0.07.
But udder depth is more heritable (0.23–0.26), measurable in first lactation, and provides a backdoor to longevity that direct selection can’t deliver efficiently.
Setati’s Southern African data reinforced the picture: genetic correlations between longevity and udder traits ranged from 0.22 to 0.48. The only notable negative correlations were with body depth (−0.15) and fore teat length (−0.07).
Török’s Hungarian data added the combination dimension. Three trait pairings showed the strongest effects on longevity (all at p < 0.0001): wide-chested, deep-bodied cows had the highest culling risk; weak fore udders paired with deep udders were the worst mammary combination; and very angular cows with low rear udder height showed the poorest survival.
When extreme angularity met a low rear udder, the result was worse than either trait alone predicted.
Brazil, Southern Africa, and Hungary. Same answer. The cow that stays isn’t the tallest — she’s the one with the best mammary and the strongest foundation.
THE STATURE TRAP: Why Your UDC Score May Be Lying to You
Here’s the part that doesn’t fit on a breed association poster.
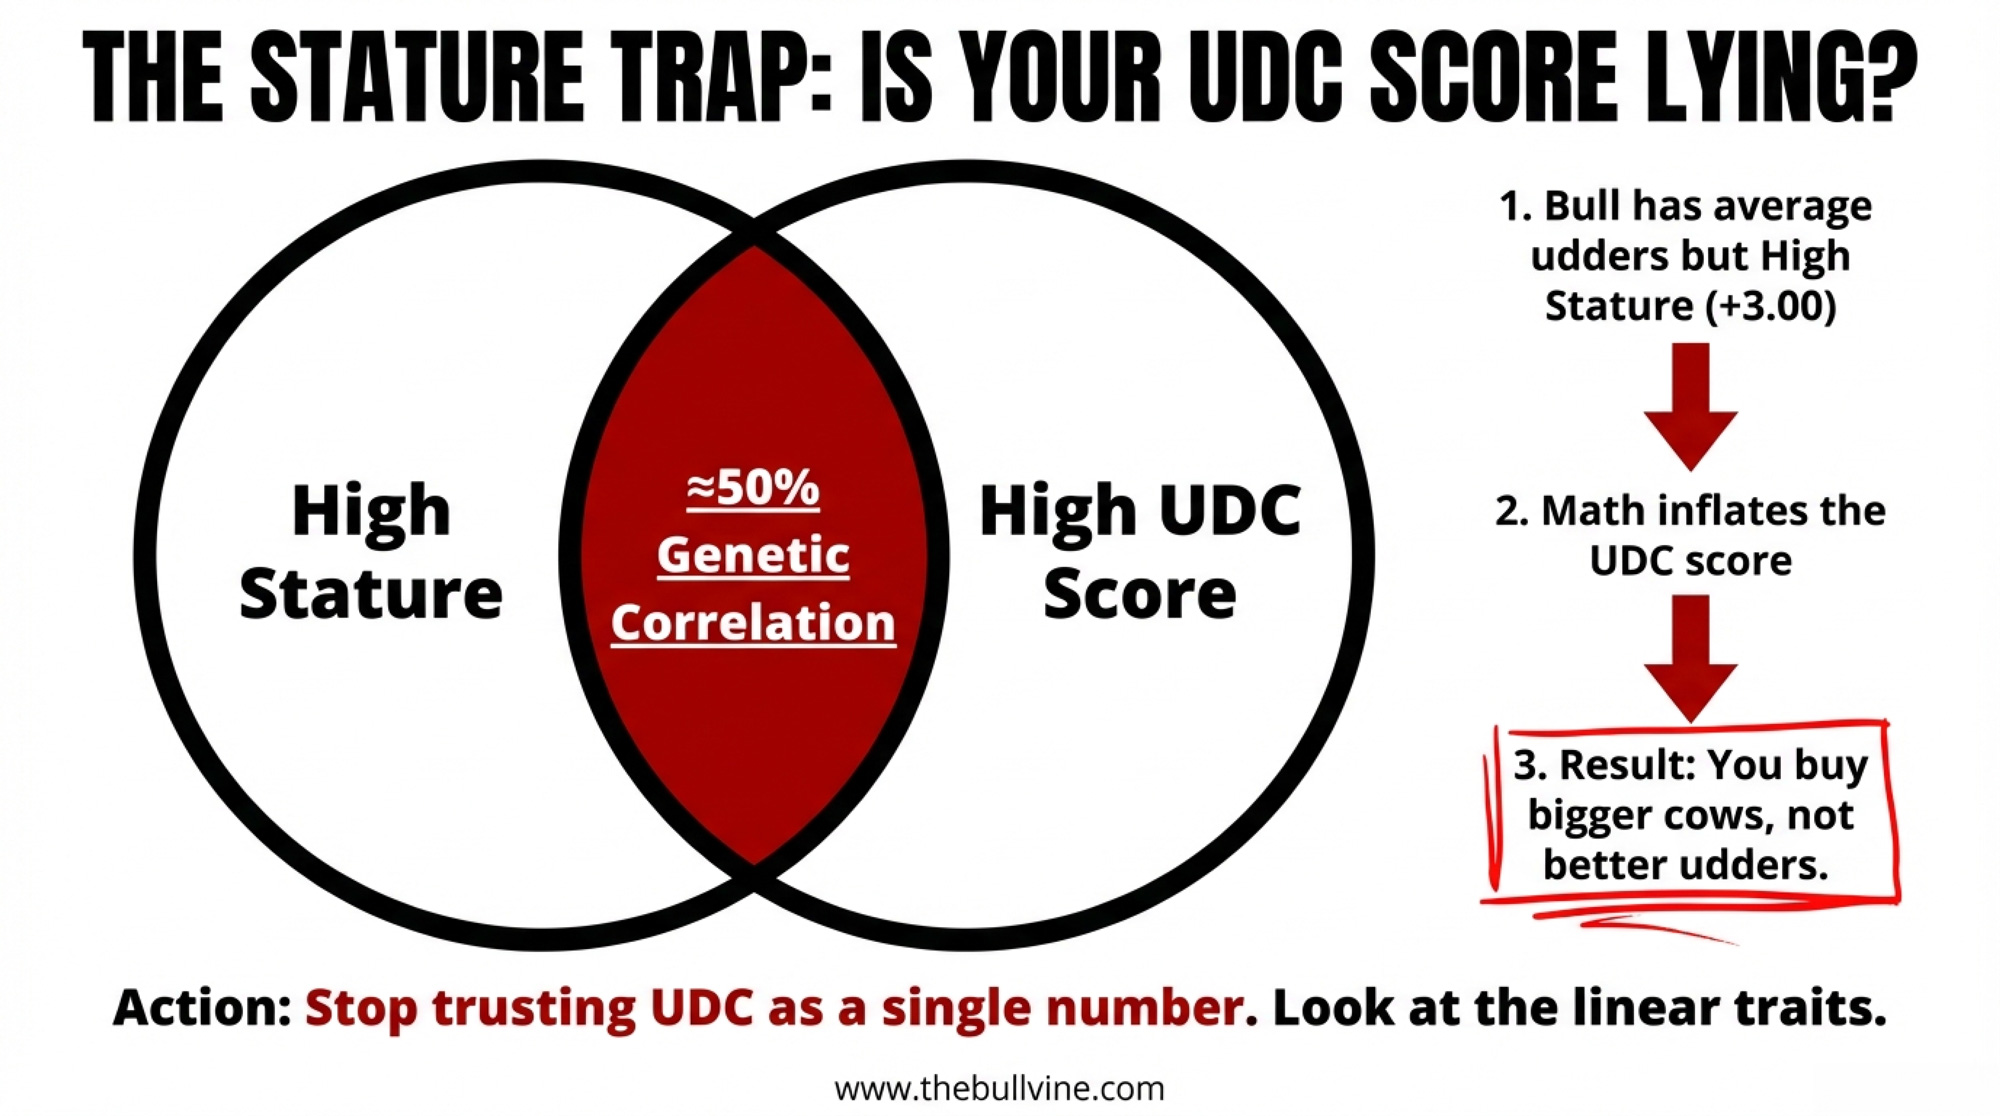
There’s a roughly 50% genetic correlation between stature and udder composite. If a bull is +3.00 for Stature, his UDC is likely inflated by the math, not necessarily by better-attached udders.
His daughters might score well for UDC simply because they’re tall, not because their mammary systems are functionally superior.
Nate Zwald demonstrated this at the 130th National Holstein Convention in St. Charles, Illinois, in 2015, when he served as general manager of Alta Genetics’ U.S. division. “It shouldn’t take a tall cow to have a good udder or feet and legs,” Zwald told the audience. “The correlation is still too high.”
Take three hypothetical sires — identical for production and health but differing by one point each on overall type, feet-and-legs, and udders. Their TPI rankings? Approximately 4th, 100th, and 1,000th.
The top-ranked bull didn’t necessarily sire better-uddered daughters — he sired taller daughters, and the correlation pushed his composites up.
“We think we are selecting for better UDC and FLC, but the unintended effect is that we are also making bigger cows,” Zwald said.
Holstein USA has tried to address this — the UDC formula includes a negative weighting for stature (−0.20) to offset the correlation partially. And in December 2024, they updated the stature linear scale from 51″–61″ to 55″–65″ to better reflect the current population.
Those fixes reduce the distortion. They don’t eliminate a 50% genetic correlation.
The fix on your end: Stop trusting UDC as a single number. Pull it apart. Look at udder depth, fore attachment, and rear attachment height individually. A bull with moderate stature and genuinely strong udder depth will keep daughters in your herd longer than a tall bull whose UDC is propped up by frame.
The Dairy Character Problem Nobody Wants to Name
And then there’s dairy character — the trait that’s quietly doing its own damage.
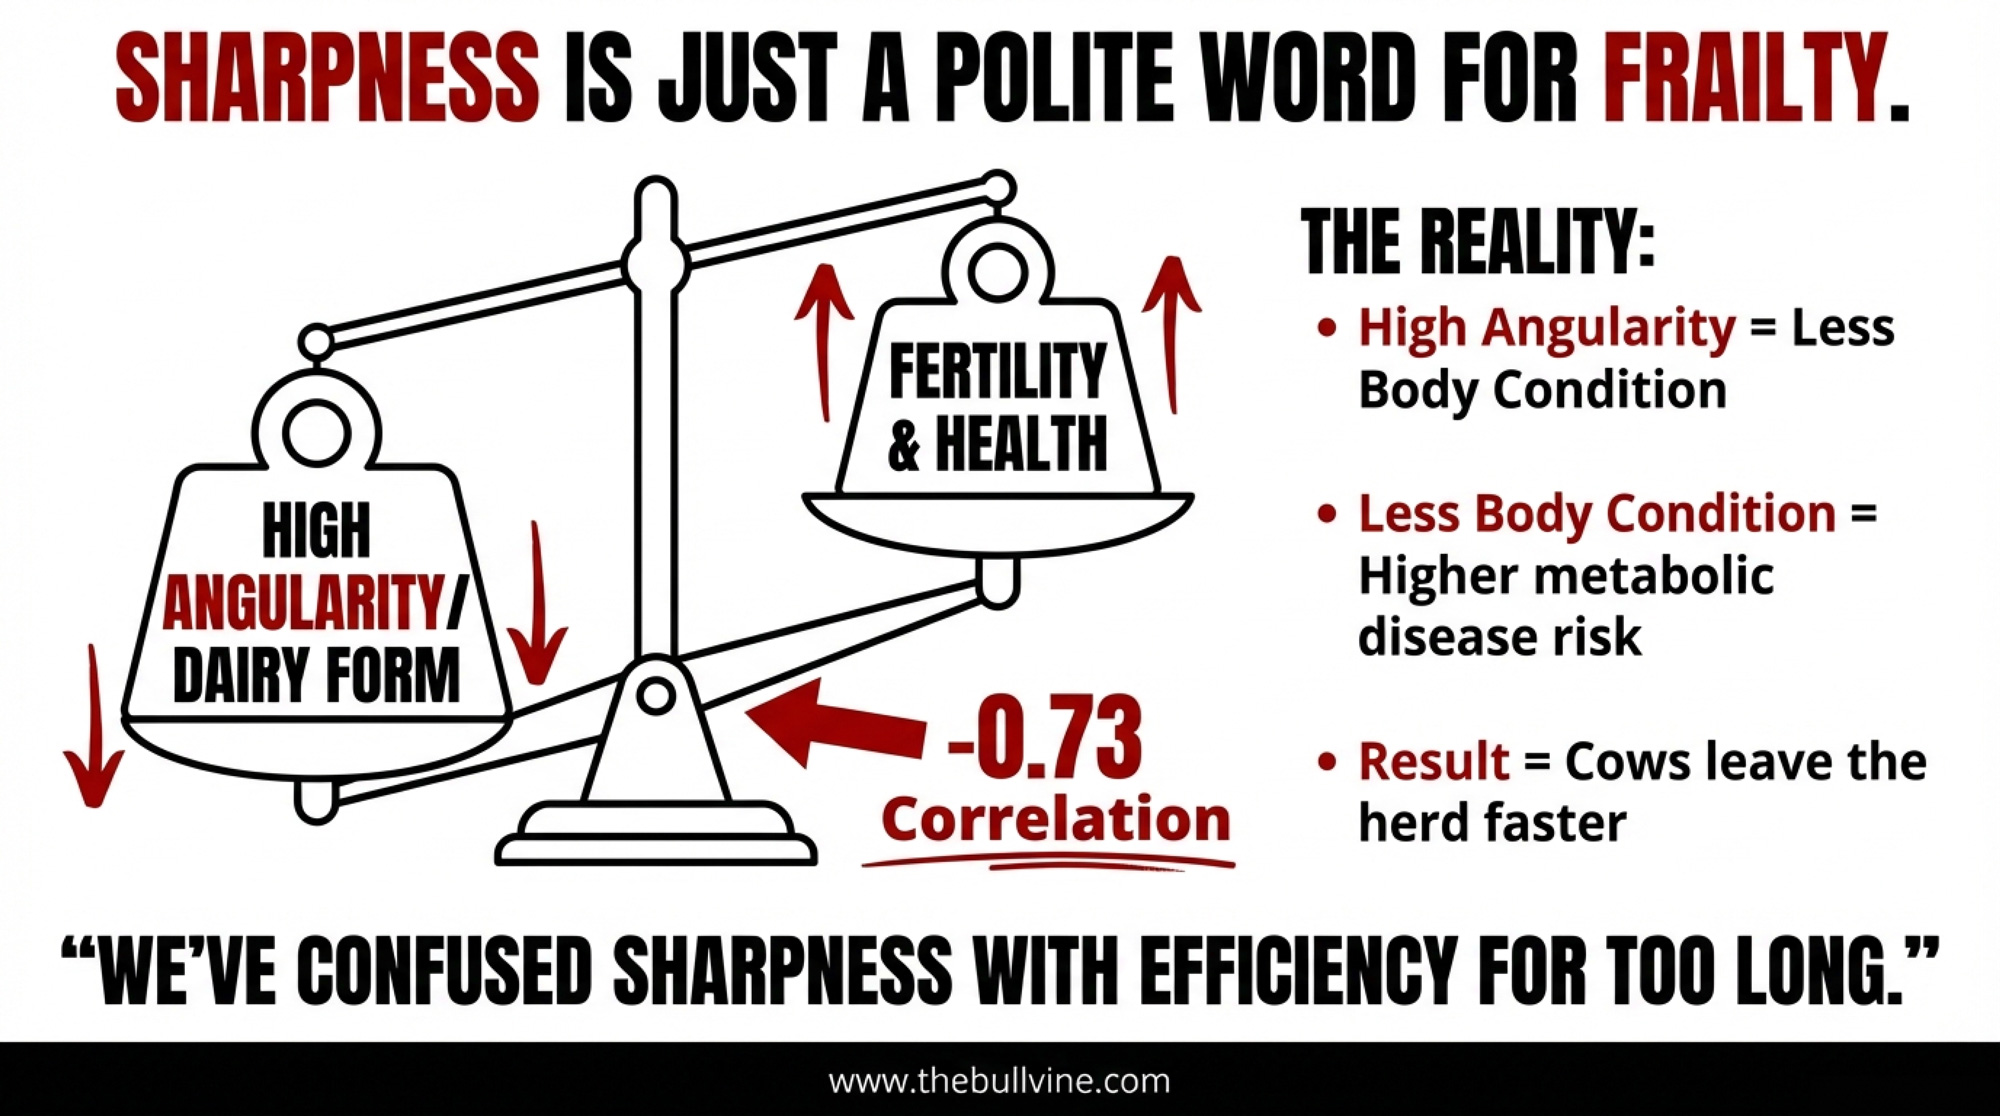
We’ve confused “sharpness” with “efficiency” for too long. Dechow et al. (2003, Journal of Dairy Science) documented a −0.73 genetic correlation between Body Condition Score and Dairy Form in first-lactation Holsteins. That’s not a mild tendency. Cows that score high for angular dairy character are genetically predisposed to carry less body condition, which elevates metabolic disease risk and hammers fertility.
The industry is starting to catch on. Kevin Jorgensen, senior Holstein sire analyst at Select Sires, shared in early 2025: “We’ve been focusing on moderating stature for over a decade, and there’s definitely a huge demand in the market for shorter cows.” Emily Bosch of Holstein Association USA acknowledged the shift: “We have also seen trends in the show ring start to align more towards selecting cattle that can be productive in real-world environments, including an increased emphasis on cows of more moderate stature.”
The April 2025 NM$ revision made it official. Body weight composite now carries a −11% emphasis — an active penalty on cow size. The show-ring cow and the commercially profitable cow have been diverging for years. The indexes finally say so out loud.
So when someone tells you a sharp, angular heifer “has great dairy character,” ask the follow-up: Does she have the body condition to transition well, or did we just breed a cow who looks the part but can’t hold flesh when she needs it most?
Does Body Depth Actually Drag Down Profit?
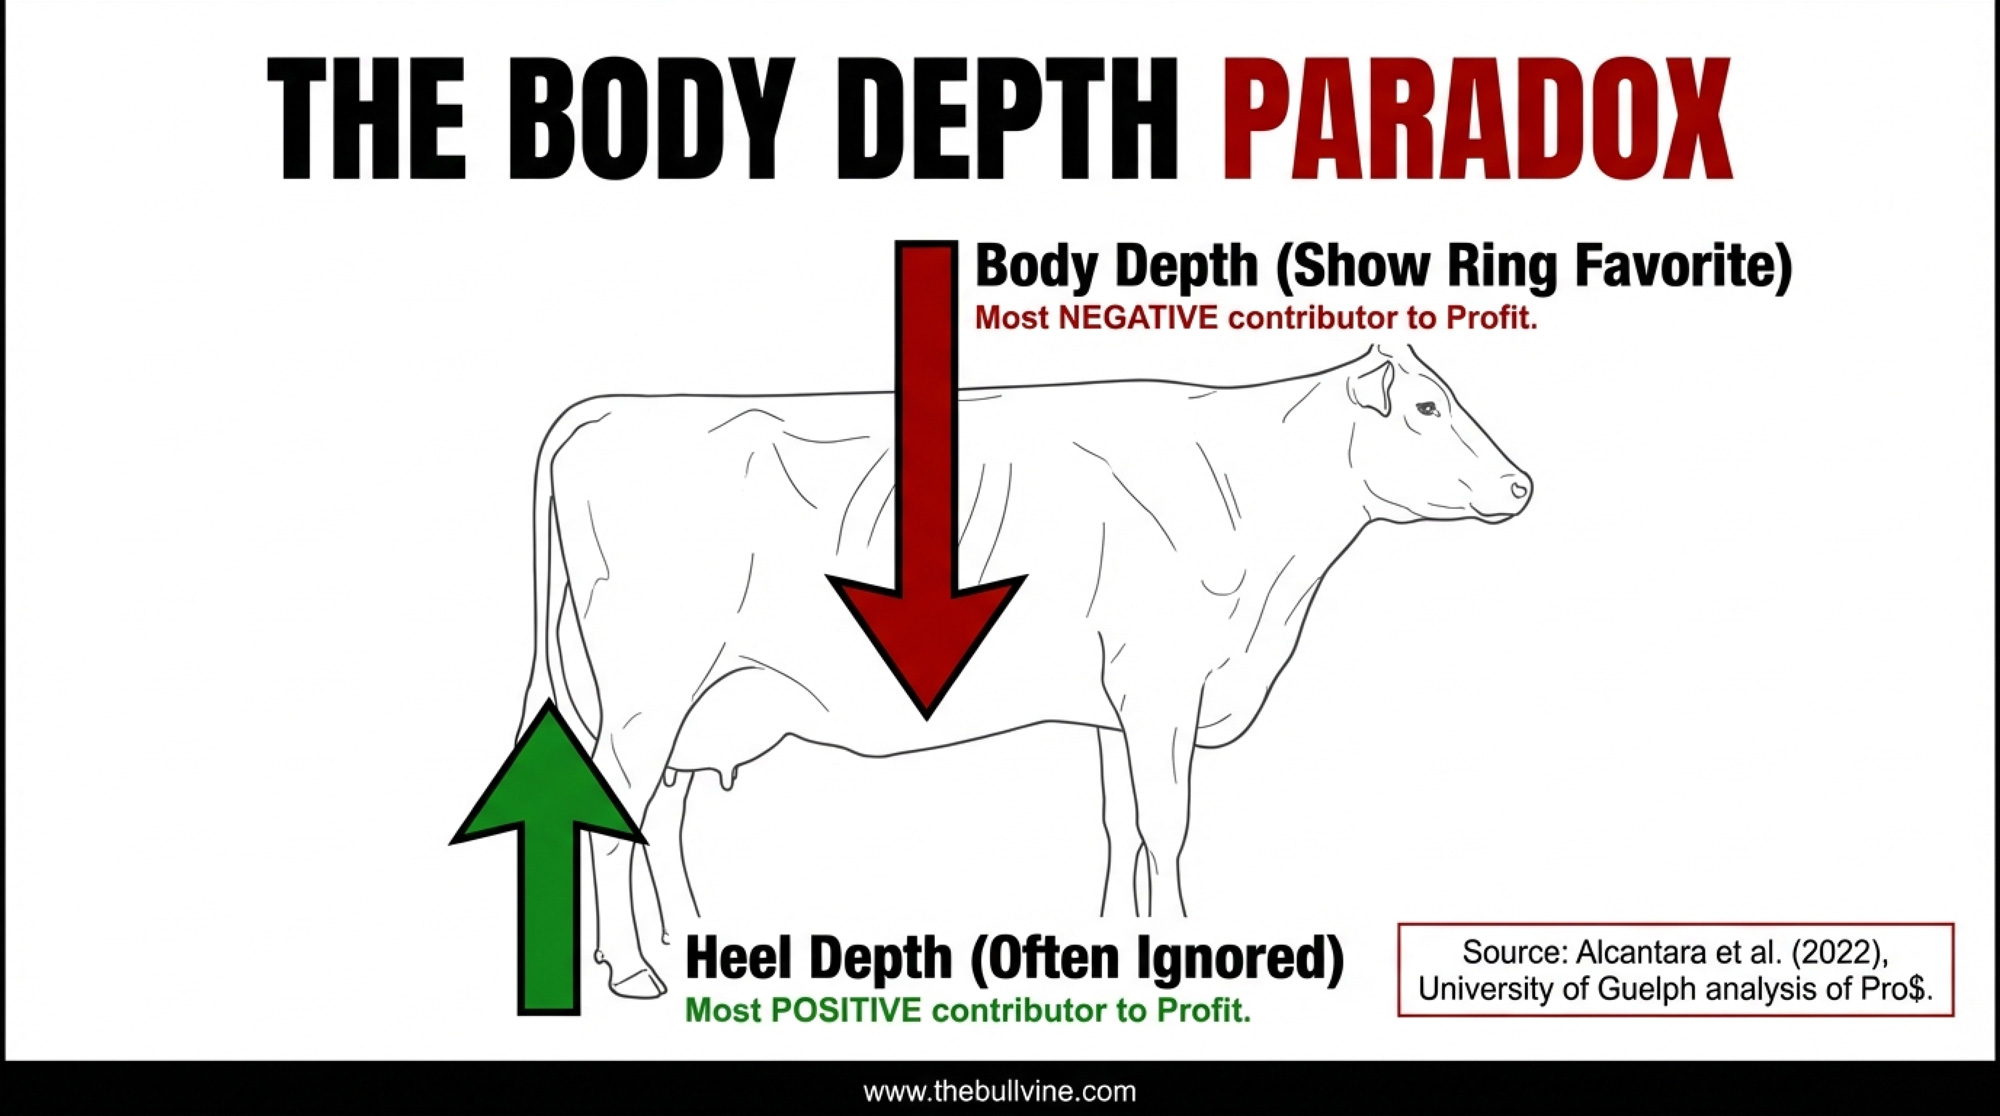
Alcantara et al. (2022) at the University of Guelph put the economics in black and white. They analyzed 9,351 proven Holstein bulls in the Canadian Journal of Animal Science:
- Body depth = the most negative conformation contributor to Pro$
- Heel depth = the most positive conformation contributor to Pro$
- The model explained 72.5% of the variance in Pro$
The two conformation traits that move Canada’s profit index the most push it in opposite directions. Body depth — the trait the show ring rewards — is a drag on profit. Heel depth — the trait nobody talks about at ringside — is a profit driver.
Can You See This on Real Farms?
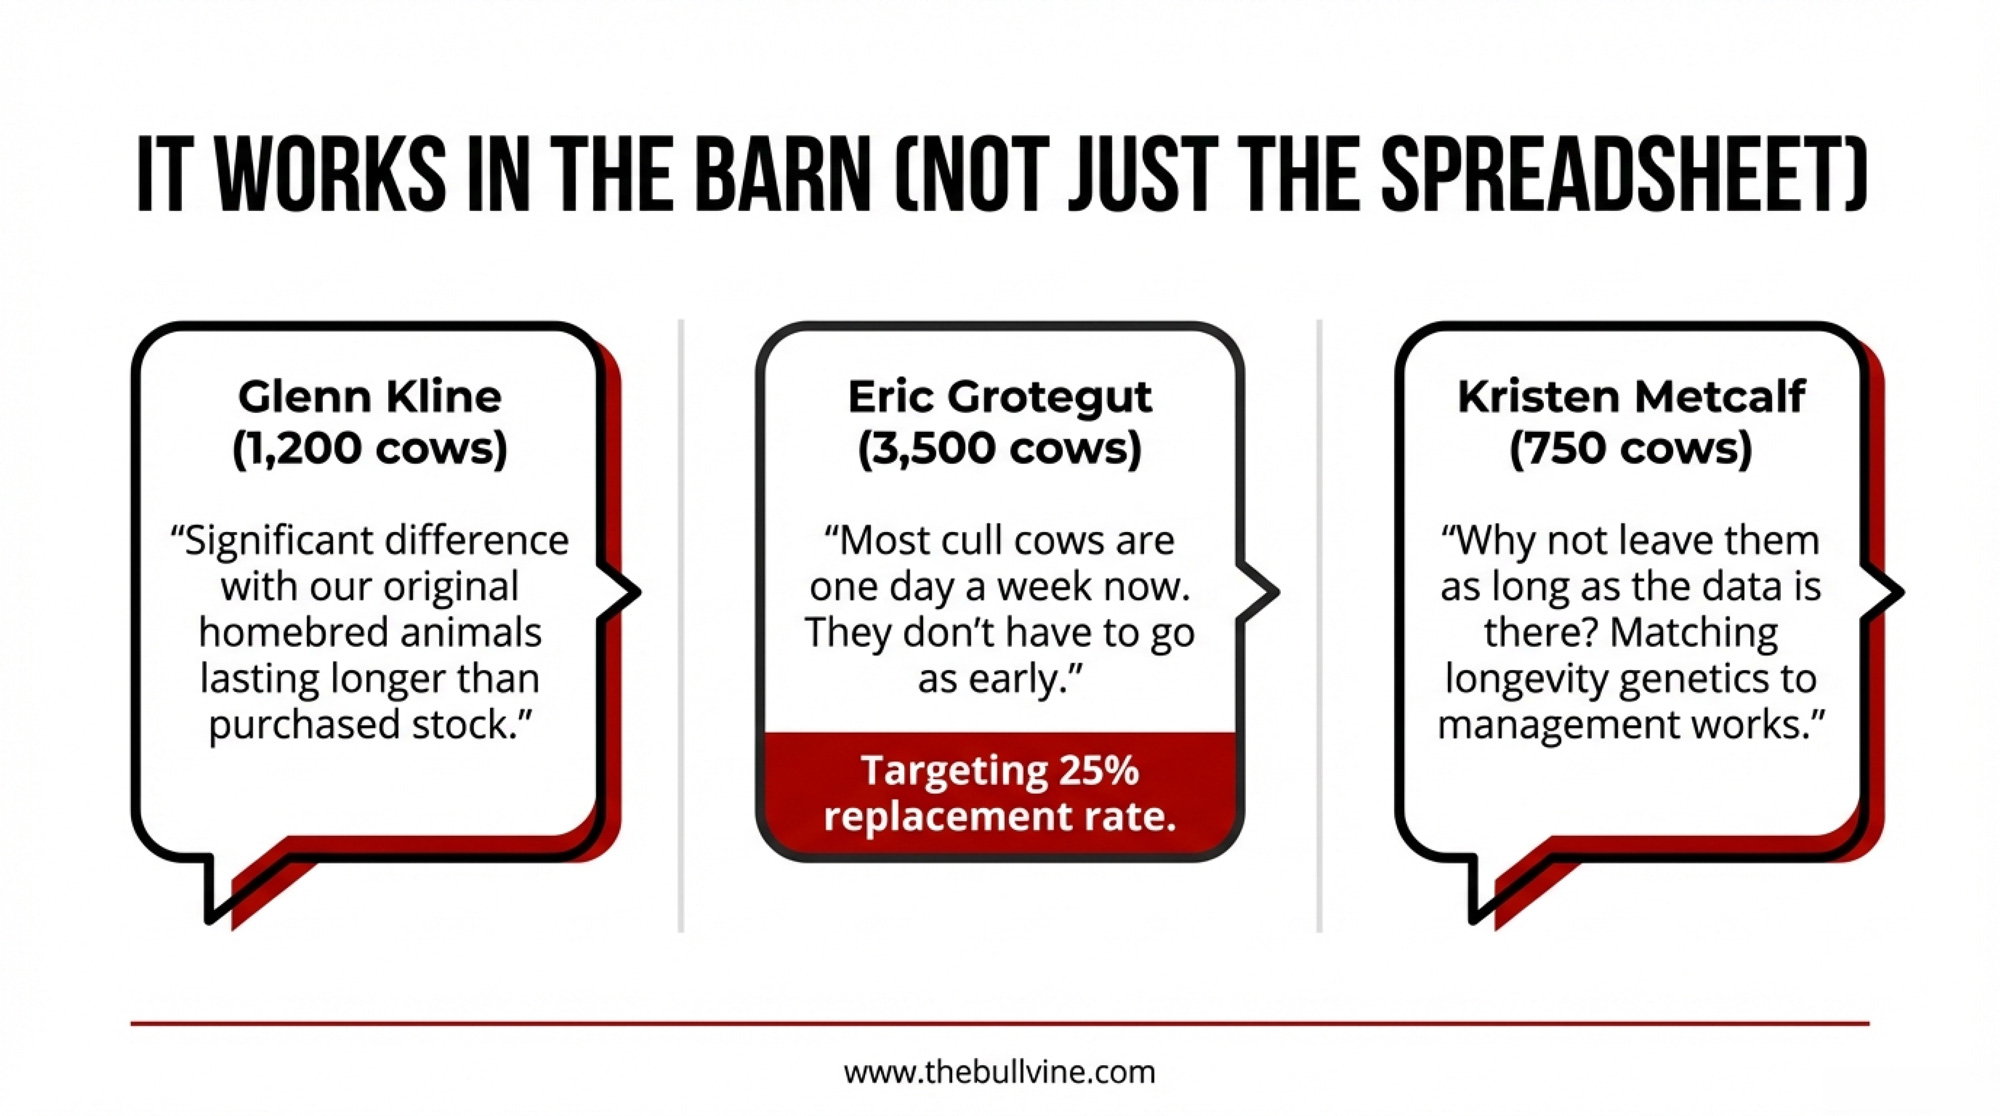
Last fall’s CDCB Industry Meeting at World Dairy Expo drew nearly 600 attendees in person and online. At the October 1, 2025, panel “Cows Can Live Longer — Are We Letting Them? ” three producers brought the receipts:
Glenn Kline — Y Run Farms, Troy, Pennsylvania — 1,200 cows. His family started genomic testing in 2011, and Kline credits that as the single farm change that most impacted longevity. When the farm expanded three years ago and bought outside animals, the homebred vs. purchased gap was impossible to ignore: “Boy, that’s made a huge difference in our herd. We did expand here three years ago, and we had to buy some animals in. There was really a significant difference with our original animals lasting longer.”
Eric Grotegut — Grotegut Dairy, Newton, Wisconsin — 3,500 cows. Named IDFA and Dairy Herd Managementmagazine’s 2025 Innovative Dairy Farmer of the Year, he’s targeting a 25% replacement rate. “Fifteen to 25 years ago, it seemed like I was selling cows every day; lameness, mastitis, and pneumonia… there was something all the time. Now, most cull cows are one day a week. They don’t have to go [as early].”
Kristen Metcalf — Glacier Edge Dairy, Milton, Wisconsin — approximately 750 cows, predominantly registered Jerseys. The Metcalfs built the farm from scratch in 2017, starting with 300 Jerseys and doubling the herd after completing a barn expansion in October 2023. Metcalf stresses matching longevity genetics to each farm’s management: “We have different dairy farms, we have different preferences, and we have these great new technologies and tools that let us filter for the traits we want. Why not leave them as long as the data is there?”
Three different operations — 750 to 3,500 cows, Jerseys and Holsteins, Pennsylvania and Wisconsin. None of them talked about stature. All of them talked about functional traits and management.
The Replacement Math That Makes This Urgent
The cost of getting longevity wrong has never been higher.
Lactanet mapped the “lifetime profit curve” for the typical Canadian Holstein. According to Allison Fleming and Brian Van Doormaal, the average Holstein reached breakeven — complete repayment of all costs incurred from birth — at 40 months of age, typically during her second lactation. Every lactation after that is where the money stacks.
Pro$ data makes the sire-selection piece concrete. Relative to daughters of middle-ranked sires, 7.4% more daughters of top Pro$ sires stayed in the herd for six years, while 6.0% fewer daughters of bottom Pro$ sires made it that far.
Among surviving daughters, the top group generated an extra $1,300 in accumulated profit compared to the average. The bottom group earned $1,200 less. A $2,500 swing — top to bottom — from one generation of sire decisions.
And replacement costs? In Wisconsin, dairy replacement prices jumped sharply from October 2023 to October 2024, moving from $1,990 to $2,850, according to USDA data. By July 2025, USDA’s Agricultural Prices data tracked by CoBank showed the national average had climbed to $3,010 per head — a 164% jump from the April 2019 low of $1,140.
Top dairy heifers in California and Minnesota auction barns were bringing upward of $4,000. Penn State Extension’s heifer cost analysis (2016–2021 FINBIN data) found average rearing costs of $1,709 per head for Midwest farms and $2,034 for Pennsylvania farms, with a range of $1,411 to $2,301 depending on efficiency.
The Barn Math: What Half a Lactation Is Worth
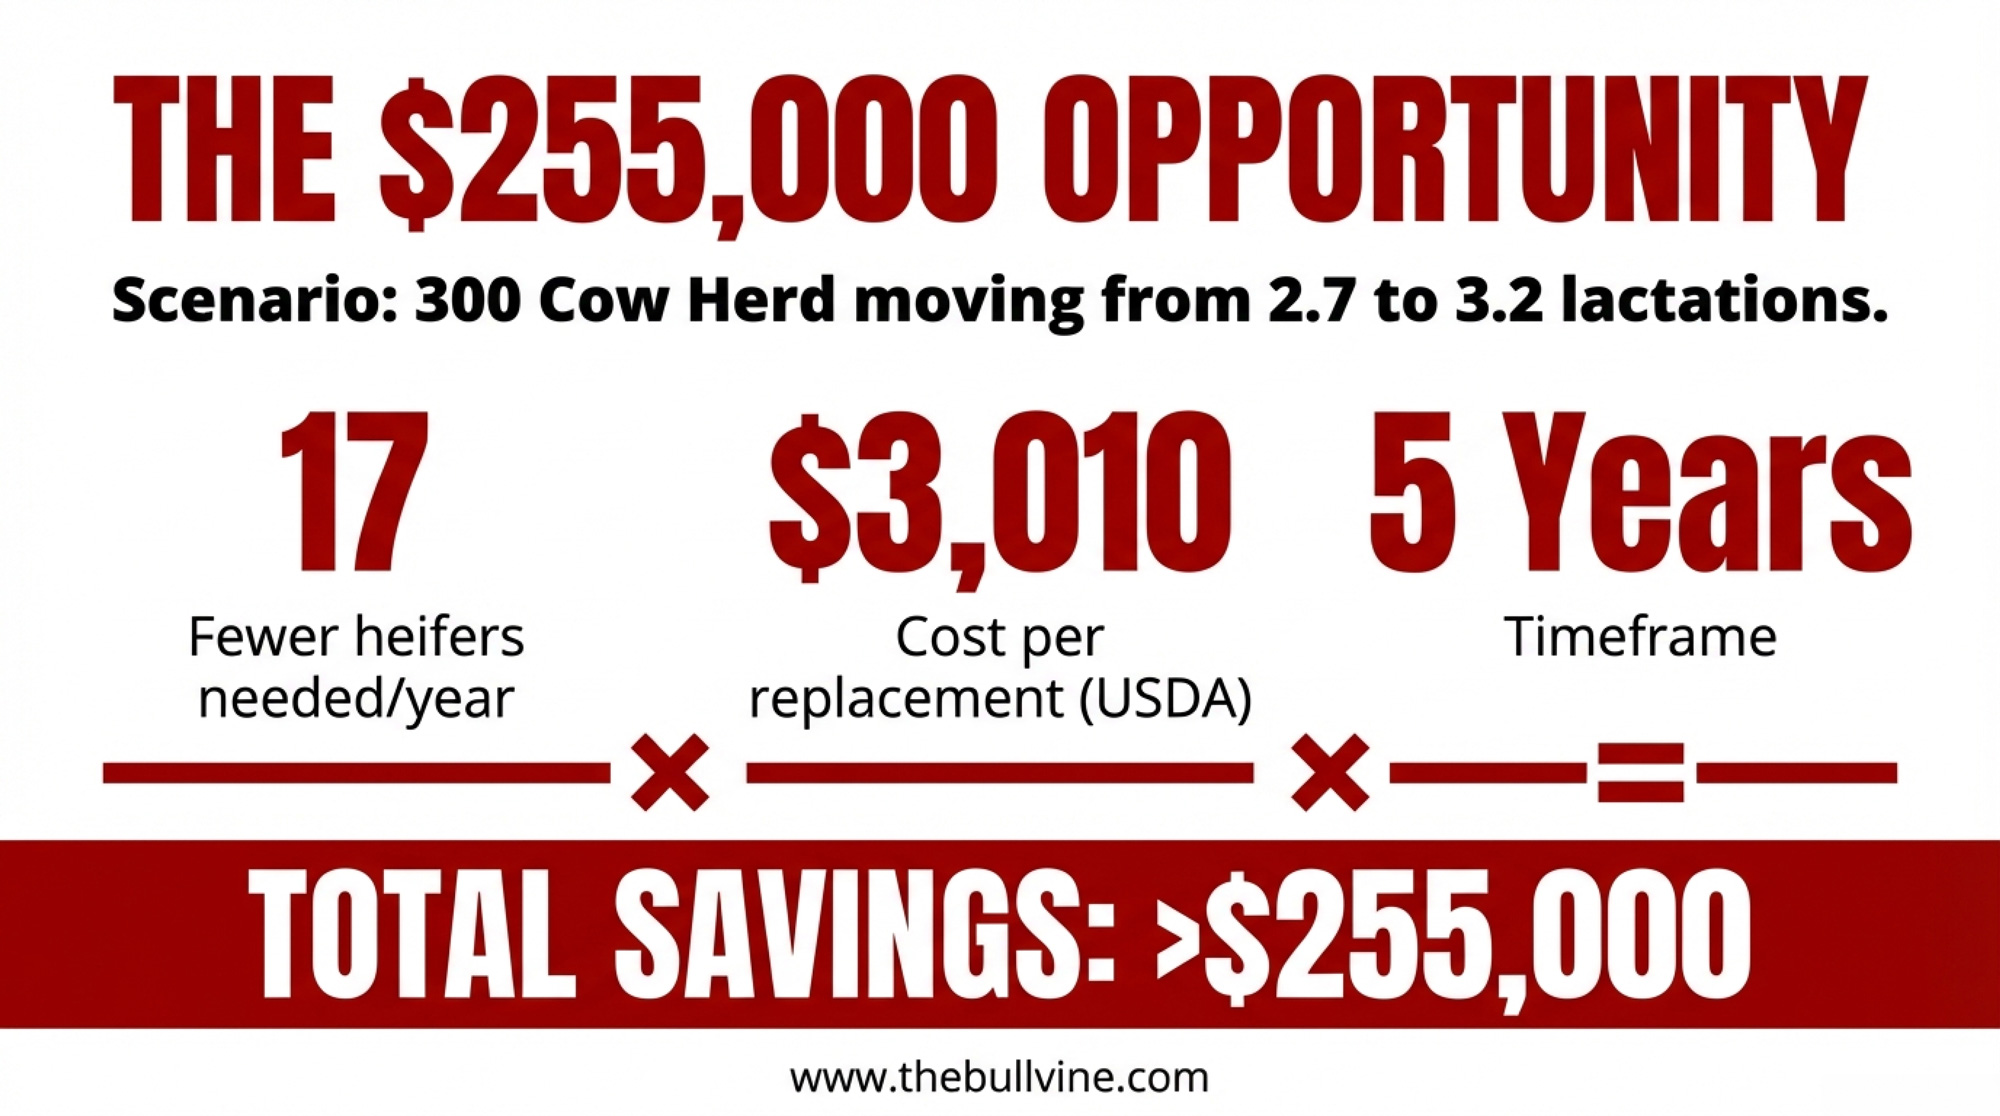
| Metric | Before | After | Difference |
| Herd size | 300 cows | 300 cows | — |
| Average lactations | 2.7 | 3.2 (+0.5) | — |
| Annual replacements needed | ~111 head | ~94 head | ~17 fewer/year |
| 5-year replacement savings (at $3,010/head, per USDA July 2025) | — | — | >$255,000 |
| Extra mature-cow milk revenue | — | — | Additional — not counted above |
That’s roughly 17 fewer heifers to buy or raise every year. Over five years, approximately 85 fewer replacements. At $3,010 per head, you’re looking at more than $255,000 in avoided replacement purchases — and that doesn’t touch the extra milk revenue from cows producing in their higher-yielding third and fourth lactations.
Grotegut’s 25% replacement target is exactly this math in action.
The Dutch show what a national commitment to longevity looks like at scale. In CRV’s 2022–2023 milk recording statistics, culled Dutch herdbook cows averaged 38,327 kg (84,500 lb) of lifetime milk with a lifespan of 2,255 days— both record highs.
Can a VG-87 Cow Outproduce an EX-90?
The Holstein USA study didn’t say type doesn’t matter — it said the opposite. Functional conformation is directly tied to lifetime production. Classification works.
But the industry has a stature addiction. Two cows can both classify VG-85 and have completely different longevity prospects, depending on whether their points came from udder depth and strong attachments or from stature and angularity.
Your classification summary tells you the final score. It doesn’t tell you where the score came from — and for longevity, the source matters more than the total.
The major indexes have been shifting in this direction. The April 2025 NM$ revision boosted Feed Saved to 17.8% of total emphasis and increased fat to 31.8%. Canada’s Pro$ was designed from the start to maximize daughter profit to six years of age. Lactanet incorporated feed efficiency into LPI and Pro$ in December 2022.
The indexes aren’t perfectly aligned with the research yet — stature’s pull on composites persists — but the trajectory is clear.
Ed Bos’s approach to the semen tank is blunt: “I always use the best bulls available. The cheapest money you can invest is buying good semen.” But he’s particular about which bulls. “We will rarely use a bull that does not have a daughter proof. It takes many generations to build up a good breeding cow family, and too much is sacrificed by using a lower reliability bull.”
It’s a conservative approach. Genomic young sires offer faster genetic gain at lower cost. But Bosdale’s 415 Excellent cows and three Master Breeder shields suggest that patience pays off for herds building multi-generational cow familieslike the Portrait and Barbie lines.
If speed of genetic gain is your priority, genomics is the play. If you’re building a cow family where every generation needs to hold up, the Bos approach makes sense.
What This Means for Your Operation
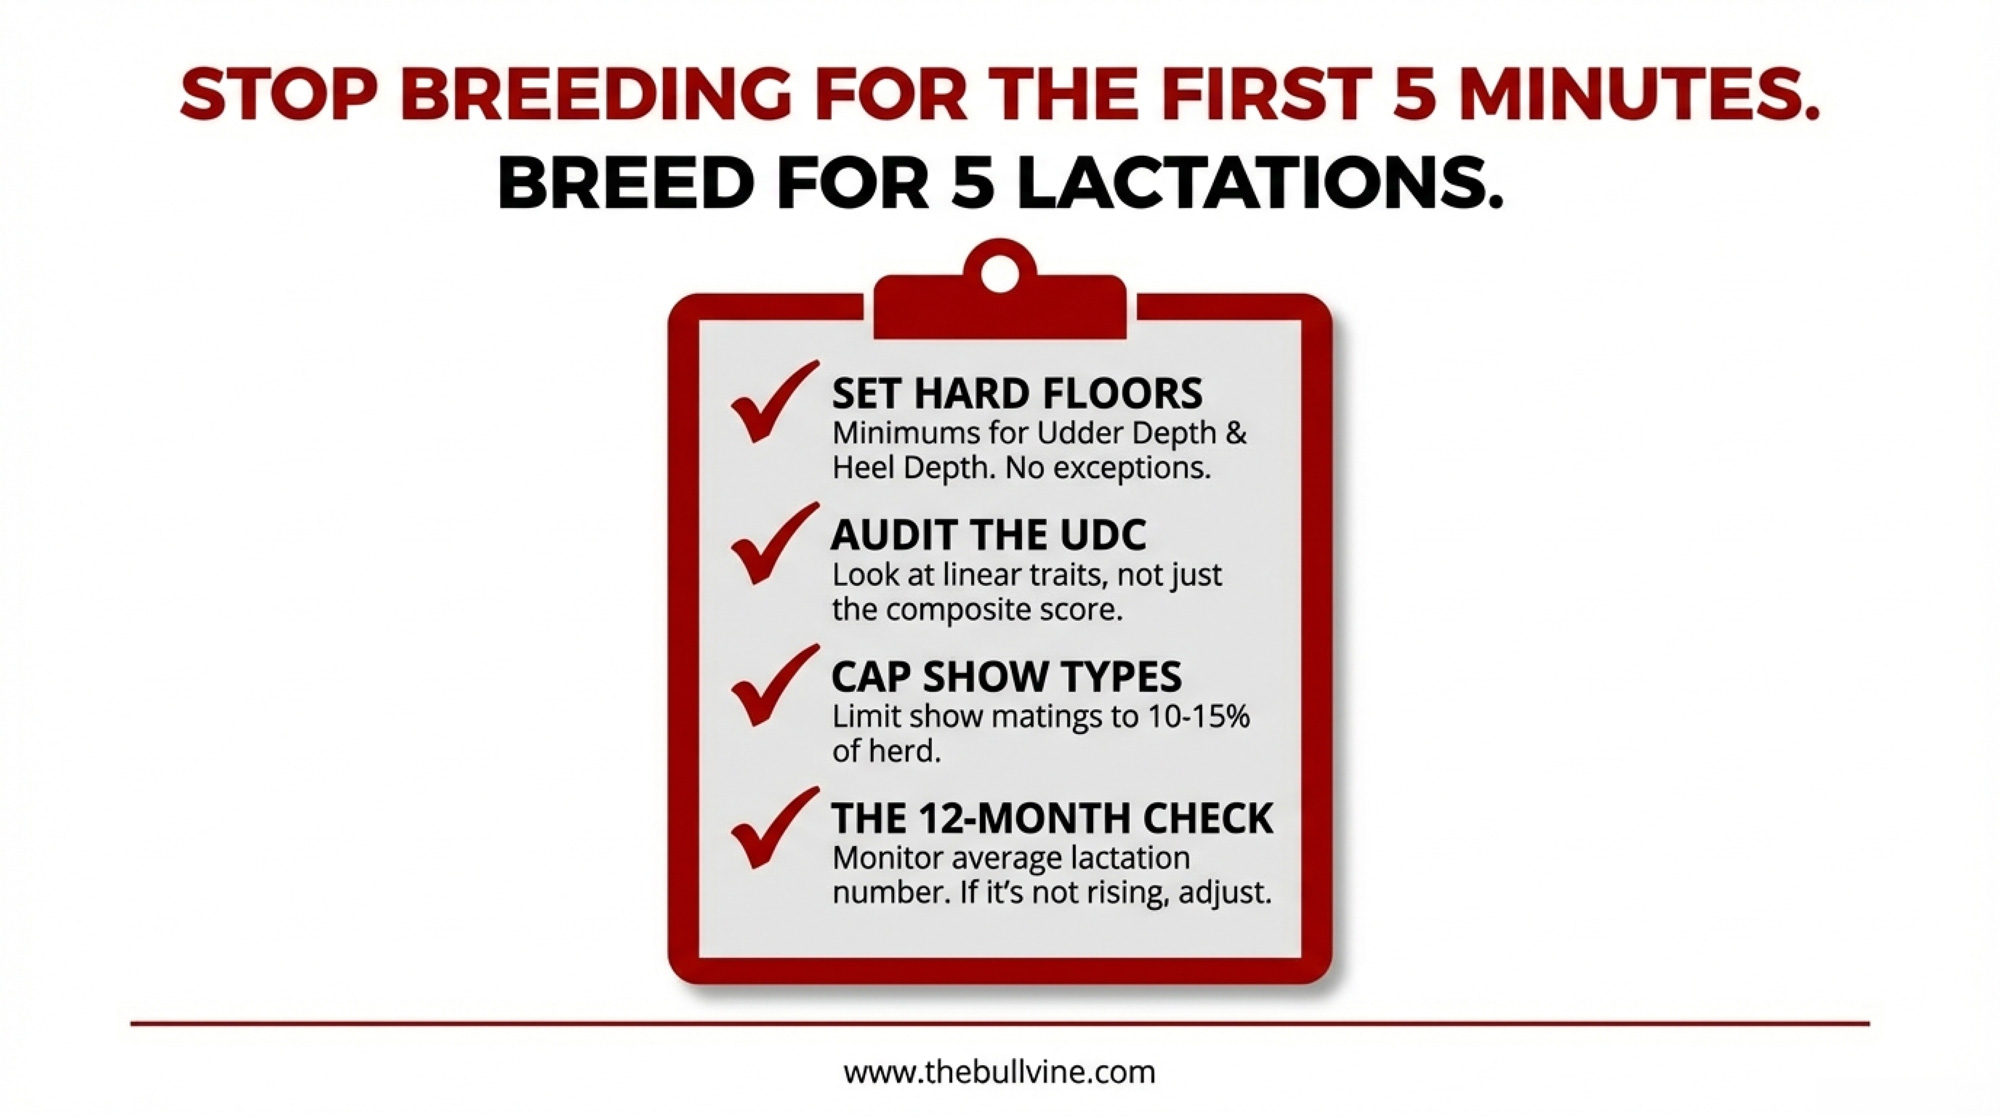
- Set functional floors on every sire order — and don’t waive them. Before your next breeding cycle, establish minimums for udder depth, fore attachment, heel depth, and productive life. Don’t break them for stature or dairy character, no matter how good the index looks. The trade-off is real: pulling apart composites adds complexity to sire selection. Most of us use UDC precisely because it simplifies things. But simplicity that masks functional weakness isn’t simplicity — it’s a blind spot.
- If you sell breeding stock, run both lenses. You may need some show-type sires for marketable females — but even those bulls should carry acceptable udder depth, fore attachment, and PL above 3.0. Limit that portion to 10–15% of matings and resist the drift toward letting it take over.
- If you’re building cow families, Bosdale’s 50-year record was built on udders, feet, legs, and rumps — not stature. Genomic testing can accelerate that timeline. Kline’s Y Run Farms has seen it since 2011.
- Your 30-day action: Pull your most recent classification summary this week. Identify where your UDC and FLC averages are really coming from — stature inflation or genuine functional quality. Set minimum thresholds on your next sire order based on what you find.
- Your 90-day check: Compare your new sire shortlist to last year’s. Did your average udder depth and heel depth PTAs actually move — or did you talk yourself back into stature?
- Your 12-month audit: Compare your herd’s average lactation number this time next year. Did it move? If not, revisit your sire thresholds and ask whether the traits you’re selecting for are the ones that should disqualify bulls from your shortlist.
Key Takeaways
- If your UDC looks great but cows leave early, stature is masking weak udders and feet. Start reading the linear traits first.
- If your herd averages under 3.0 lactations, adding just half a lactation can be worth >$255,000 over five years on 300 cows.
- If you’re still chasing body depth in sire proofs, you’re paying for it twice — once in Pro$ and again in replacement costs.
- If you want banners and cows that last, cap show-type matings at 10–15% and put hard floors under udder depth, heel depth, and PL.
The Bottom Line
Ed Bos didn’t need a million-cow study to tell him what a profitable cow looks like — he just needed to look at who was still in the barn at age ten. The data has caught up to the master breeders. The question for the rest of us: Are we breeding cows for the first five minutes in the show ring, or for the five lactations that actually pay the bills?
Complete references and supporting documentation are available upon request by contacting the editorial team at editor@thebullvine.com.
Learn More
- The Traits That Should Disqualify Bulls But Often Don’t: How Genomic Selection Changed the Rules of Knockout Traits – Stop wasting capital on “paper” bulls that fail your real-world environment. This guide delivers a ruthless knockout system for sire selection, arming you with the filters needed to prioritize longevity and functional health over inflated genomic averages.
- 9.57 Million Cows, 3.9 Million Replacements: Genetics Built This Dairy Herd Paradox – and 2027 Ends It – High heifer prices aren’t a temporary spike; they’re a structural shift. This analysis breaks down the economics of the replacement paradox and reveals how to position your operation for maximum equity as 2027 approaches.
- The $8,100 Gamble on Missy, 198 Dragged Genes, and the 20-Year Breeding Blind Spot Hiding in Your Herd – Every genetic gain carries a hidden tax. This deep dive exposes how decades of milk selection accidentally “dragged” fertility genes sideways and reveals the new metrics industry mavericks use to find the high-profit cows genomics missed.
 The Sunday Read Dairy Professionals Don’t Skip.
 The Sunday Read Dairy Professionals Don’t Skip.
Every week, thousands of producers, breeders, and industry insiders open Bullvine Weekly for genetics insights, market shifts, and profit strategies they won’t find anywhere else. One email. Five minutes. Smarter decisions all week.


