


The same genetics cost one farm $190,000/year and make another farm $57,000. The difference? Market alignment.

Here’s something I’ve been thinking about quite a bit lately. After spending time reviewing proof sheets and talking with dairy farmers from Wisconsin to California, I keep coming back to the same observation: there’s a growing gap between what the catalogs celebrate and what actually drives profitability on individual farms.
Don’t get me wrong—the numbers look impressive. Genetic progress is accelerating. Index values keep climbing. But sit down with producers who’ve been making these decisions for two or three decades, and they’ll share something the marketing materials tend to leave out: genetics that work beautifully on one operation can quietly underperform on another.
What’s interesting here isn’t that some bulls are better than others. It’s that every elite sire represents a specific vision of where dairy is headed—and whether that vision aligns with your milk market, your management approach, and your economic reality is really the question worth exploring.
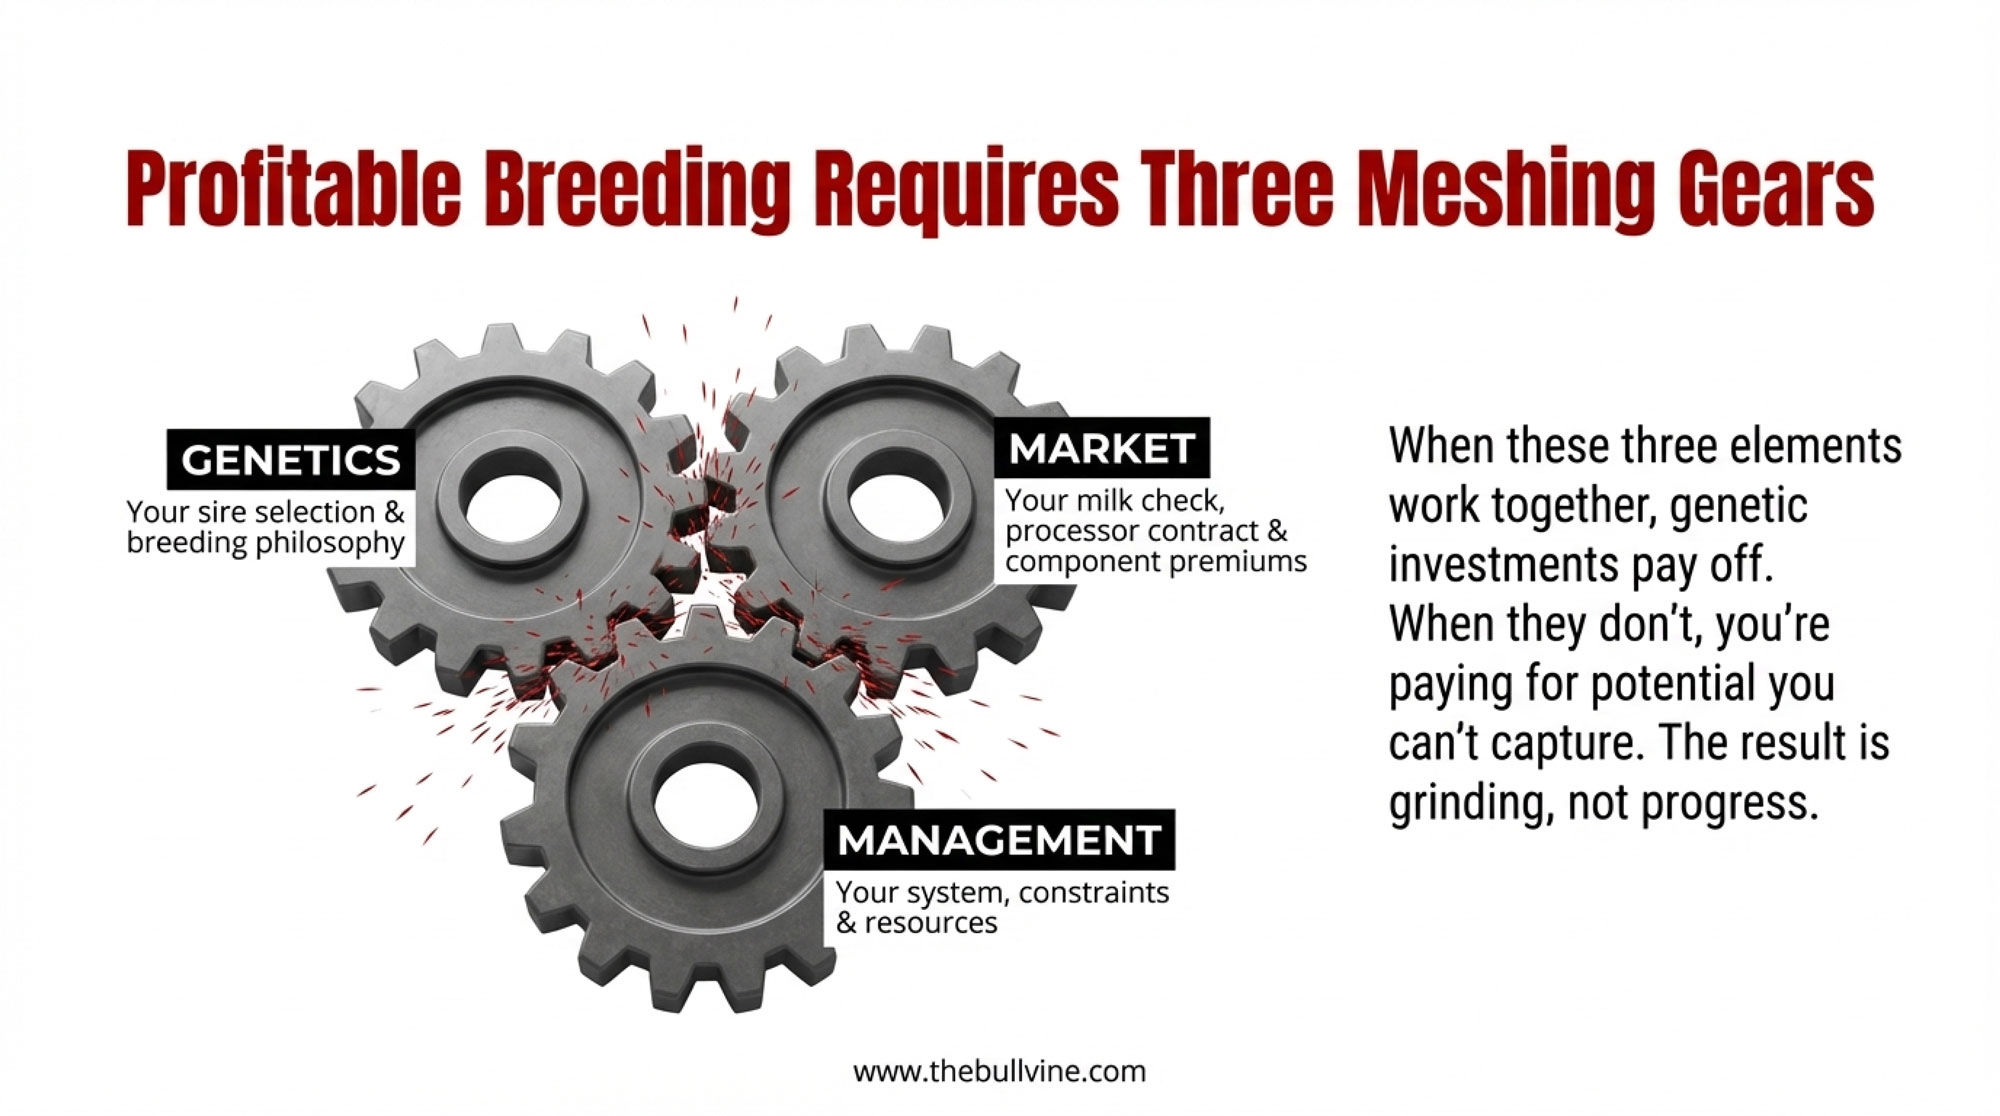
The Three Gears That Must Mesh
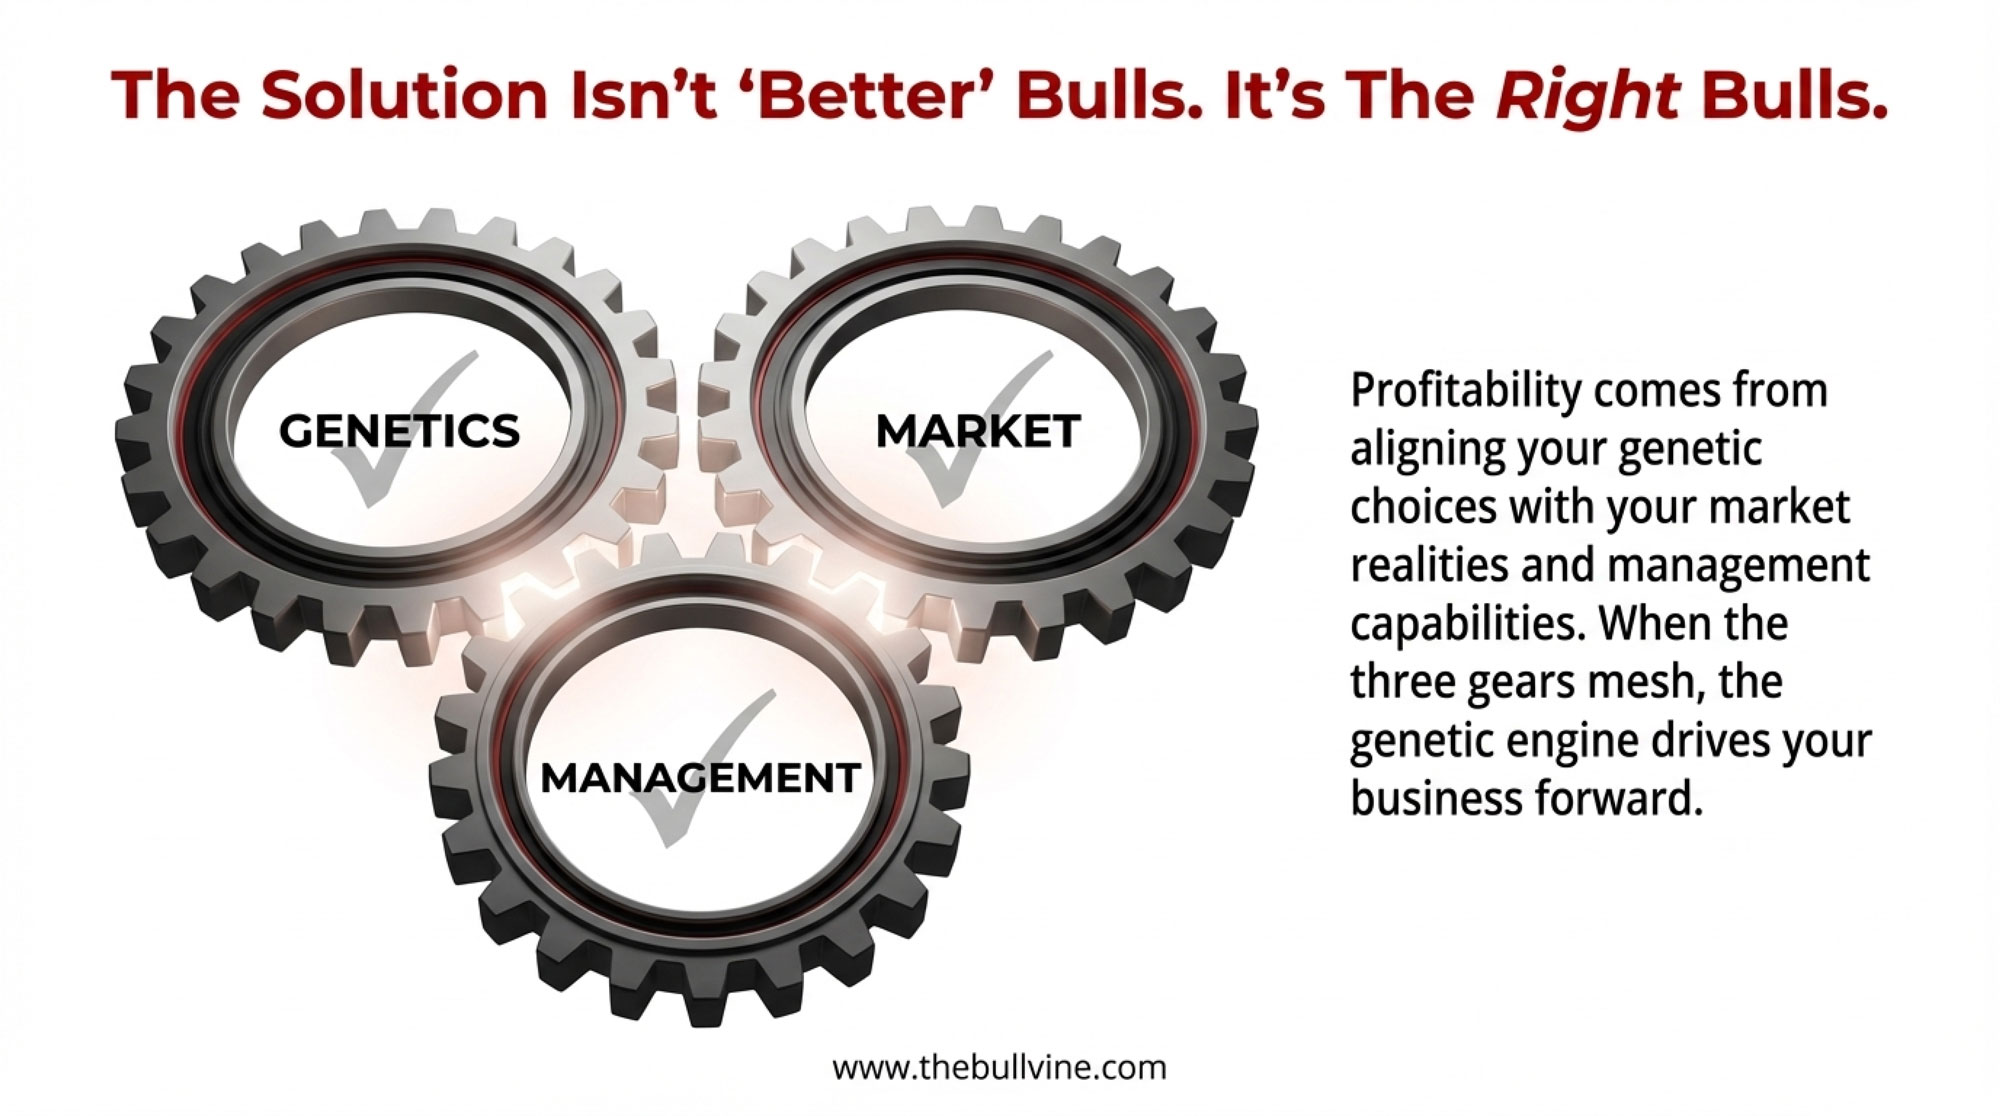
Think of profitable breeding decisions as three interlocking gears: Genetics, Market, and Management. When these gears mesh smoothly, genetic investments translate into income over feed cost and long-term herd health. When they don’t—when you’re selecting for traits your market doesn’t reward or your management can’t support—you’re essentially paying for genetic potential you can’t capture.
As many of us have seen, that’s how you end up with cows that look great on paper but don’t quite pay their way in your specific system.
The visual is simple enough to sketch on a napkin: three gears touching. Genetics turns Market turns Management. If one gear is spinning in the wrong direction—or sized wrong for the others—you get grinding instead of progress.
Gear Misalignment Example
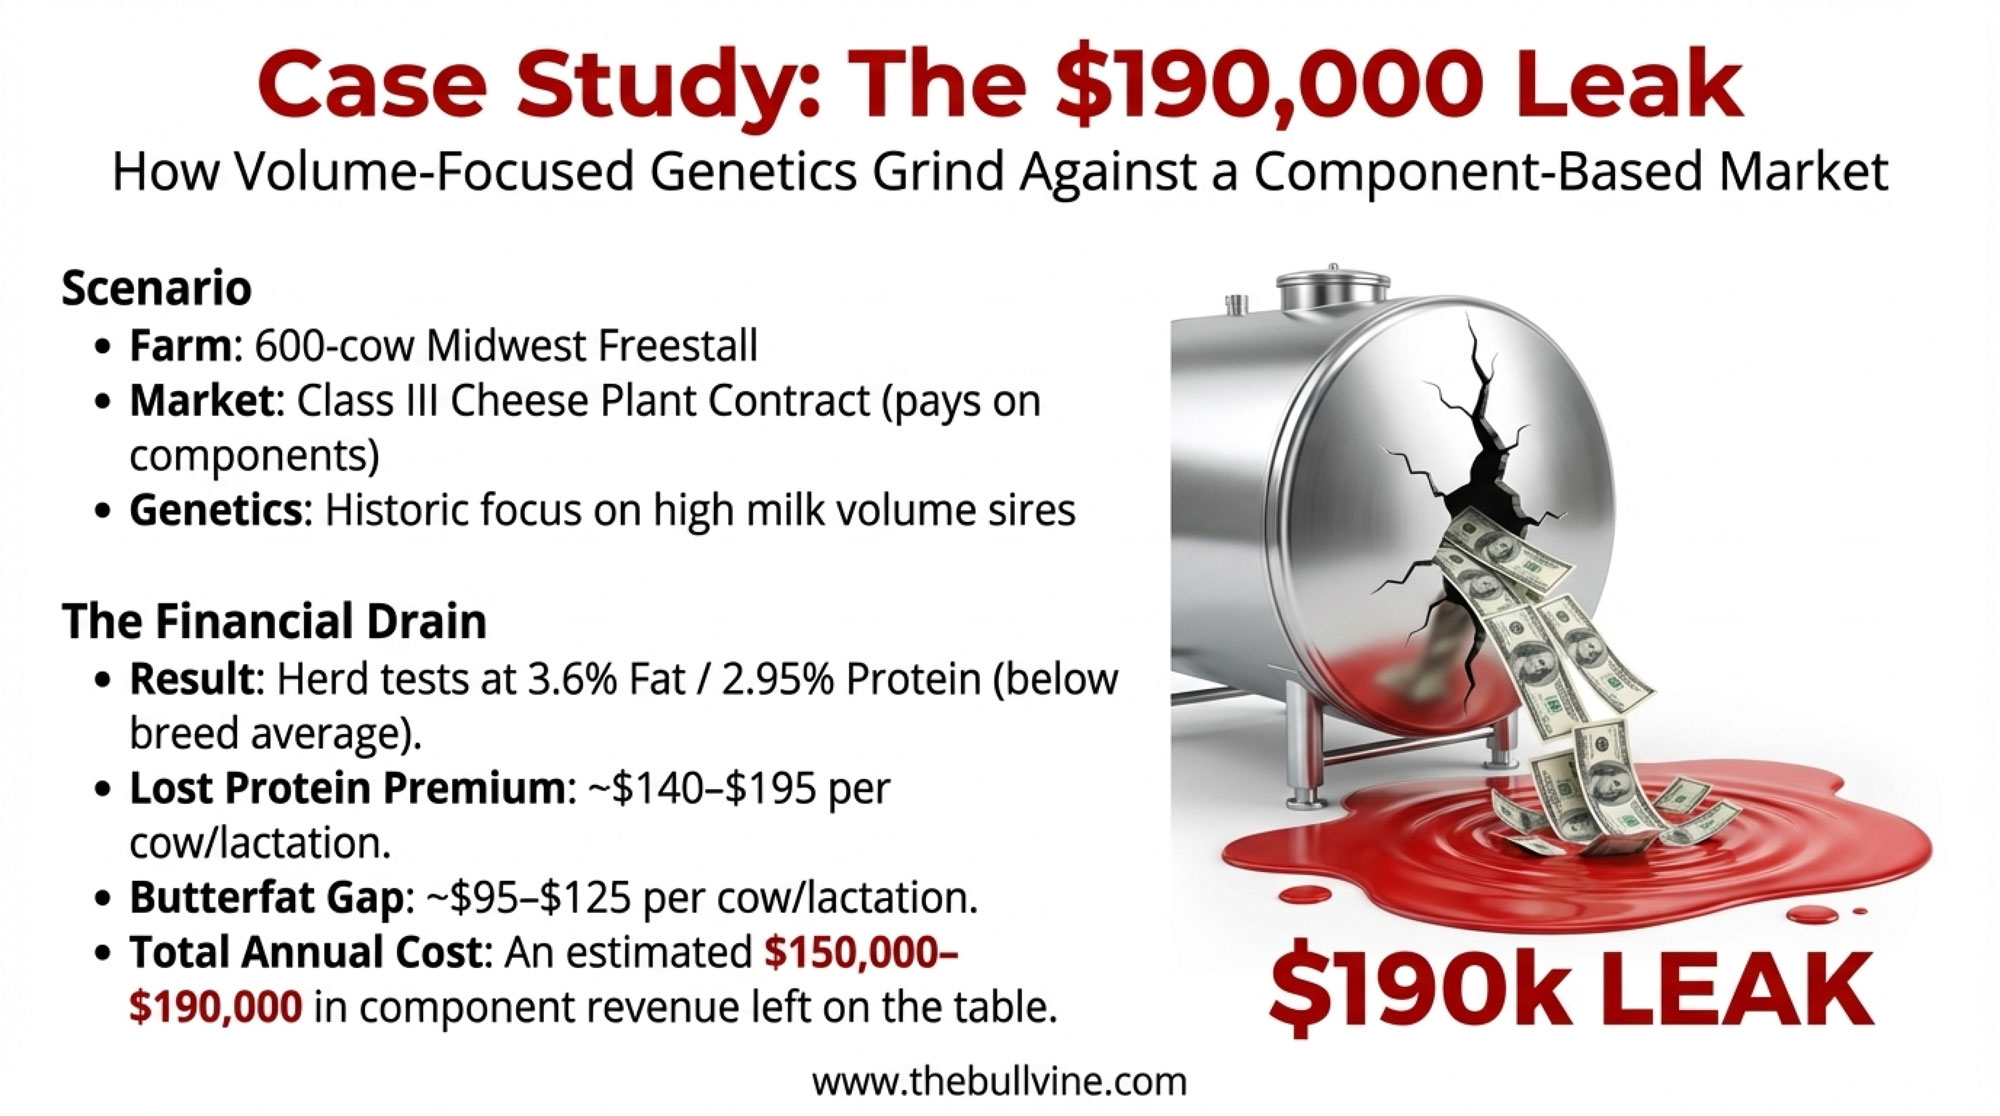
Midwest Freestall — Class III Cheese Plant Contract — Volume-Focused Genetics
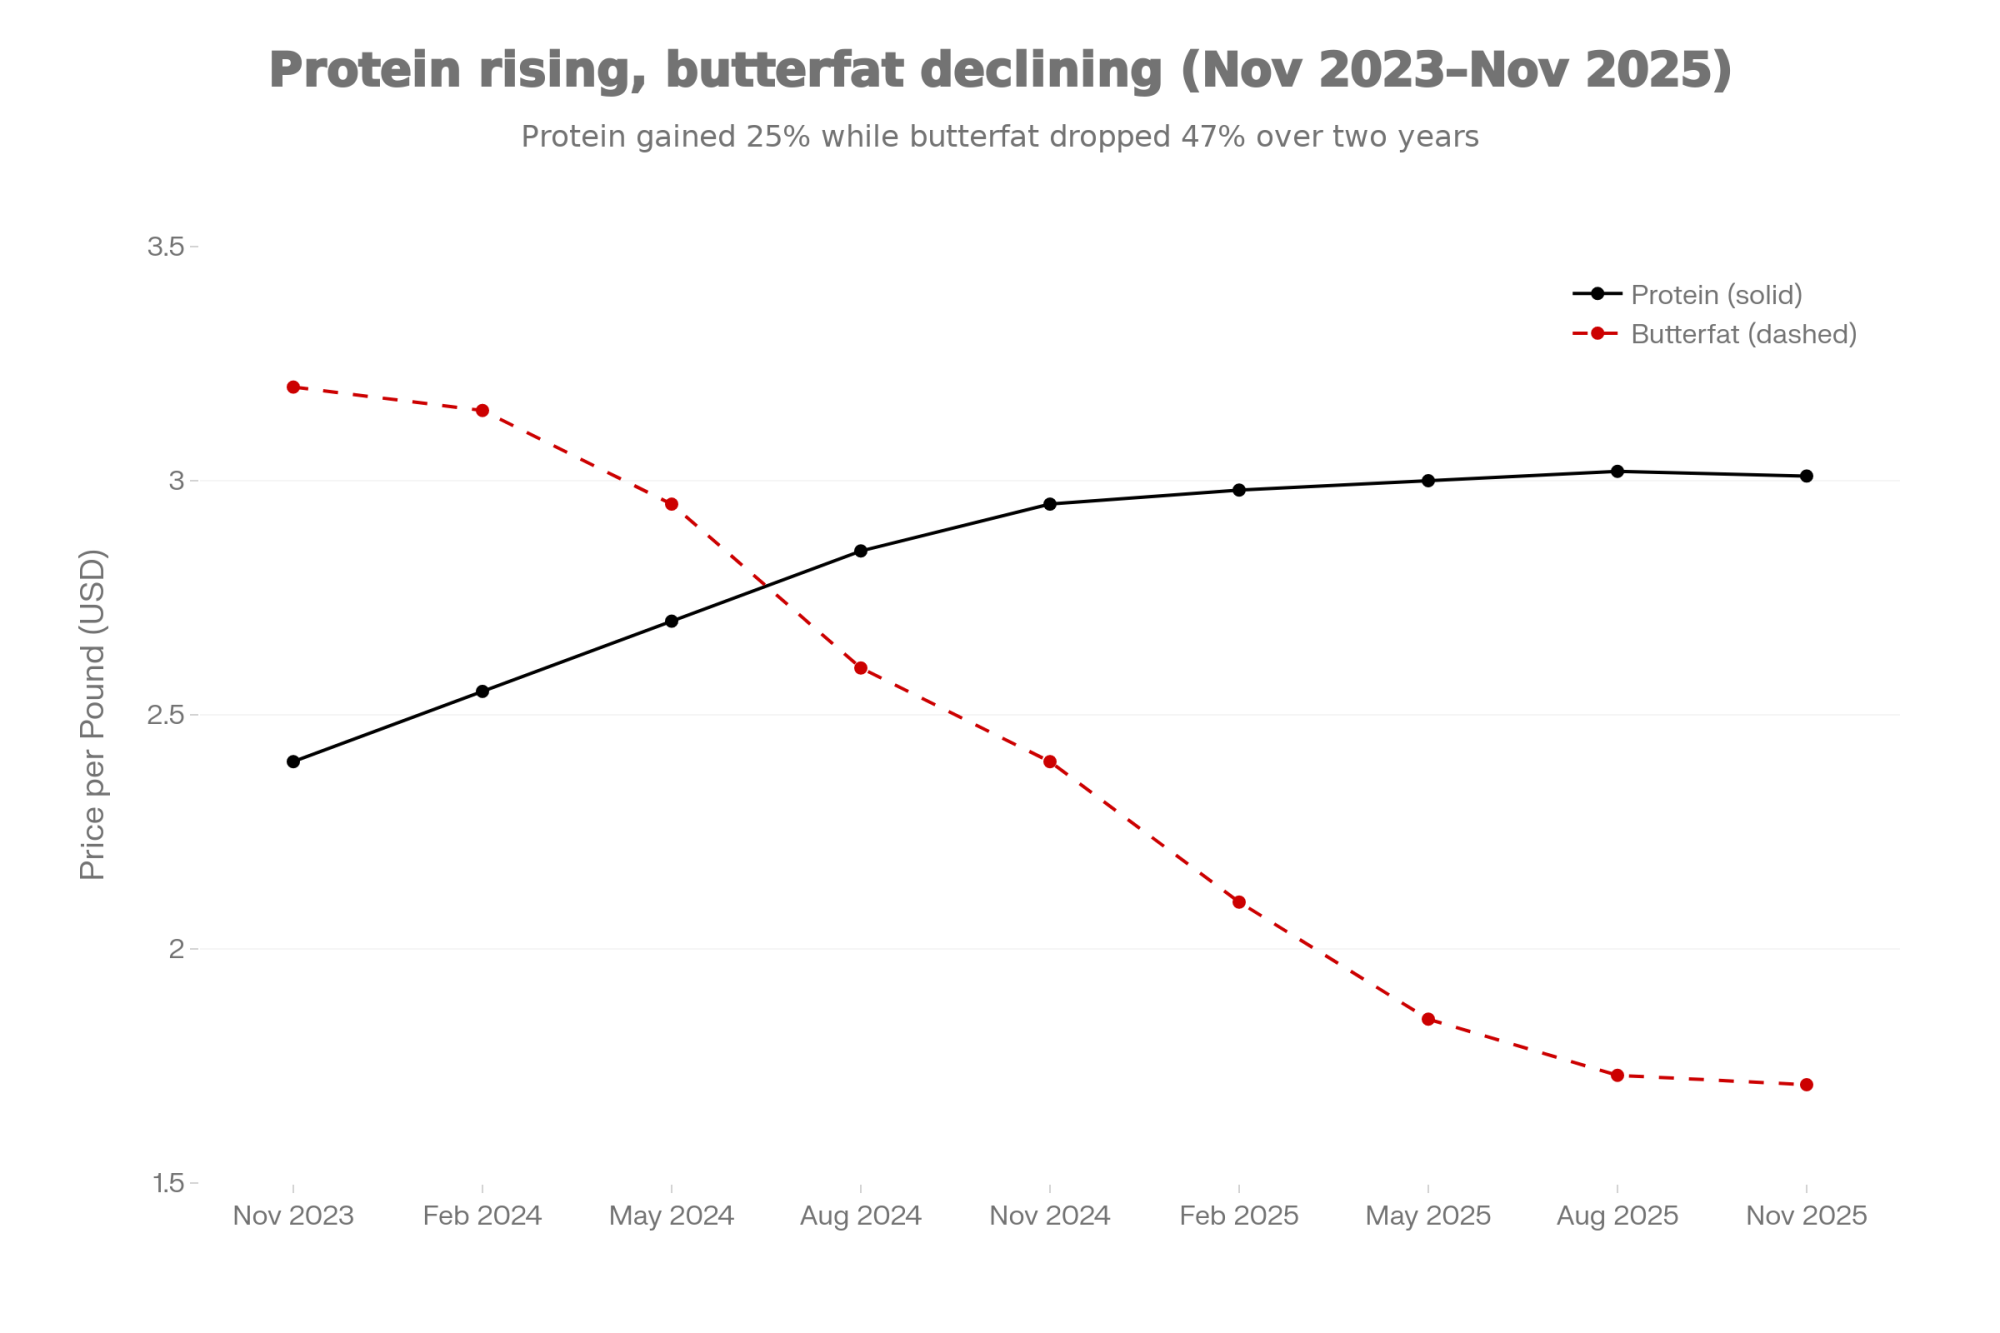
Picture a 600-cow Midwest freestall operation shipping exclusively to a cheese plant on a Class III contract. The processor pays heavily on components—protein especially, since that’s what drives cheese yield. At current prices, protein is worth $3.01 per pound and butterfat $1.71 per pound.
The breeding program, though, has been chasing milk volume for years. High-production sires. Big milk numbers. The tank is full, but the tests are running 3.6% fat and 2.95% protein—below the current Holstein breed average of 4.15% fat and 3.36% protein, according to the Canadian Dairy Information Centre’s 2024 data.
Where money leaks out:
Lost protein premium: At 2.95% protein instead of 3.2–3.3%, this herd leaves roughly $0.75–$0.90 per cwt on the table compared to a component-focused herd at similar production levels. On 60 lbs/cow/day, that’s $140–$195 per cow per lactation in foregone protein revenue alone.
Butterfat gap: The 0.3–0.4% fat test difference adds another $95–$125 per cow per year in missed premiums.
Feed efficiency drag: High-volume, low-component cows often require more DMI per pound of milk solids produced. Using USDA’s NM$ 2025 values, moving that extra water through the system costs feed dollars without generating proportional component revenue.
Estimated annual cost for this 600-cow herd: Approximately $150,000–$190,000 in component revenue the cheese plant would have paid—if the genetics matched the market.
The cows aren’t “bad.” The bulk tank isn’t empty. But the breeding program was optimized for a fluid milk check that no longer exists. The Genetics gear is turning toward volume. The Market gear is turning toward components. They’re grinding against each other instead of working together.
Understanding What You’re Actually Buying
Looking at three sires that represent distinctly different breeding philosophies helps make this concrete.
Denovo 2776 Leeds from ABS is built on a premise that resonates with many operations right now: labor is expensive and increasingly difficult to find, so invest in genetics that reduce calving interventions. His pedigree runs through Sandy-Valley Laker back to the De-Su Frazzled 6984 cow family—the same family that gave us Gateway, Hercules, Ajax, and Skeet, according to ABS pedigree records. With essentially flat components, Leeds isn’t designed to transform your butterfat levels. His value proposition centers on strong calving-ease and a solid productive life from a family known for commercial functionality.
Denovo 6856 Hotshot takes a completely different approach. His pedigree traces through Pine-Tree Shadow to the Bomaz Perfect-P line—part of what ABS describes as “one of the premier cow families of the breed for longevity.” Hotshot isn’t positioned as a production leader. He’s built around health, livability, and keeping cows productive through the transition period and beyond.
Urzokari from Synetics represents yet another direction—explicit optimization for robotic milking systems. Emphasizing teat position, udder balance, and locomotion traits that influence whether cows visit the robot voluntarily or need fetching.
Producers are discovering that none of these bulls represents a universally optimal choice. Each makes excellent sense for some operations and may quietly cost money on others. The question isn’t which bull is “best,” but which breeding philosophy fits your particular three gears.
Where NM$ and TPI Fit—And Where They Don’t
Before we go further, it’s worth talking about how this framework relates to Net Merit and TPI, since that’s how most of us were taught to think about genetics.
The April 2025 NM$ revision—documented in detail by Paul VanRaden and colleagues at USDA’s Animal Genomics and Improvement Laboratory—now places 31.8% emphasis on butterfat, 13% on protein, and a combined 17.8% on Feed Saved, which includes body weight composite and residual feed intake. The remaining emphasis spreads across productive life, health, fertility, calving, and conformation traits.
Here’s what’s important to understand: NM$ is designed to maximize lifetime profit for an average U.S. Holstein herd selling into average market conditions. It’s a remarkably well-constructed tool for that purpose. Canadian producers working with LPI or Pro$ face similar considerations—different weightings, different assumptions, same fundamental question of whether those assumptions match your operation.
How the Major Indexes Compare
The differences between selection indexes reflect different market realities and breeding priorities:
- NM$ (U.S.) places heavy emphasis on components—31.8% on butterfat alone in the 2025 revision—reflecting the cheese-heavy U.S. processing sector. Feed efficiency gets significant weight at 17.8% combined.
- TPI (U.S.) weights production, type, and health traits differently, placing greater emphasis on conformation. Operations selling breeding stock or show cattle often weight TPI more heavily.
- Pro$ (Canada) incorporates Canadian market conditions and pricing structures. The formula accounts for Canadian component pricing ratios, which—as we’ll see—are shifting significantly.
- LPI (Canada) takes a different approach to balancing production, durability, and health traits within the Canadian context.
The point isn’t that one index is “right,” and others are wrong. It’s that each embeds assumptions about markets, management, and priorities that may or may not match your operation.
A Global Trend, Not Just a North American One
This isn’t just a North American consideration. Globally, component emphasis is intensifying—and the herds that have been selecting for it are pulling ahead.
In Ireland, milk fat content reached 4.51% and protein hit 3.58% in January 2025, according to the Central Statistics Office—both up from the prior year. New Zealand’s Fonterra bases its milk price calculations on standardized 4.2% fat and 3.4% protein, as documented in the Commerce Commission’s September 2025 review—benchmarks that reflect decades of component-focused breeding in pasture-based systems. And across the EU, butter prices hit record highs in early 2025, reaching €7,422 per metric ton in January according to CLAL data—a 36.5% increase over the same month in 2024. Industry analysts describe the fat premium as becoming “structural, not some temporary blip.”
The takeaway? Market alignment isn’t a U.S. phenomenon. It’s a global reality that’s reshaping which genetics deliver returns, regardless of where you farm.

When “Average” Doesn’t Describe Your Situation
But “average” may not describe your situation. If you’re shipping Class III milk to a cheese plant with strong component premiums, NM$ may actually underweight the traits driving your revenue. If you’re in a fluid market with minimal component pay, the 31.8% butterfat emphasis in NM$ could be steering you toward genetics that don’t match your milk check.
The framework in this article doesn’t replace NM$ or TPI—it complements them by asking: Does this index’s assumptions match my actual market, management, and constraints?
Think of NM$ as an excellent starting filter. But the final selection—especially for your top sires getting heavy use—benefits from the three-gear alignment check.
The Concentration Question Worth Understanding
Looking at this trend at the breed level, something jumps out that doesn’t get nearly enough airtime.
Multiple studies have estimated the effective population size of Holsteins—a measure of genetic diversity based on how animals are actually related—at 66-79 animals, despite millions of Holstein cows walking into parlors around the world. Geneticists generally view an effective population size below 50 as the line where long-term adaptability becomes a serious concern, so we’re not over that cliff—but we’re closer than many would guess.
Dr. Chad Dechow, Associate Professor of Dairy Cattle Genetics at Penn State University, has been writing and speaking about this for years. His work shows that genomic selection—for all its tremendous benefits in accelerating genetic improvement—has also sped up how quickly we concentrate genetics in fewer lines.
Why does this matter for your next semen order?
Because the bulls marketed as “outcrosses” today often trace back to the same handful of influential sires, once you unfold the pedigree far enough. And the economic bite of that concentration isn’t theoretical—it’s been quantified.
The Mogul Example: When Success Creates Its Own Risk
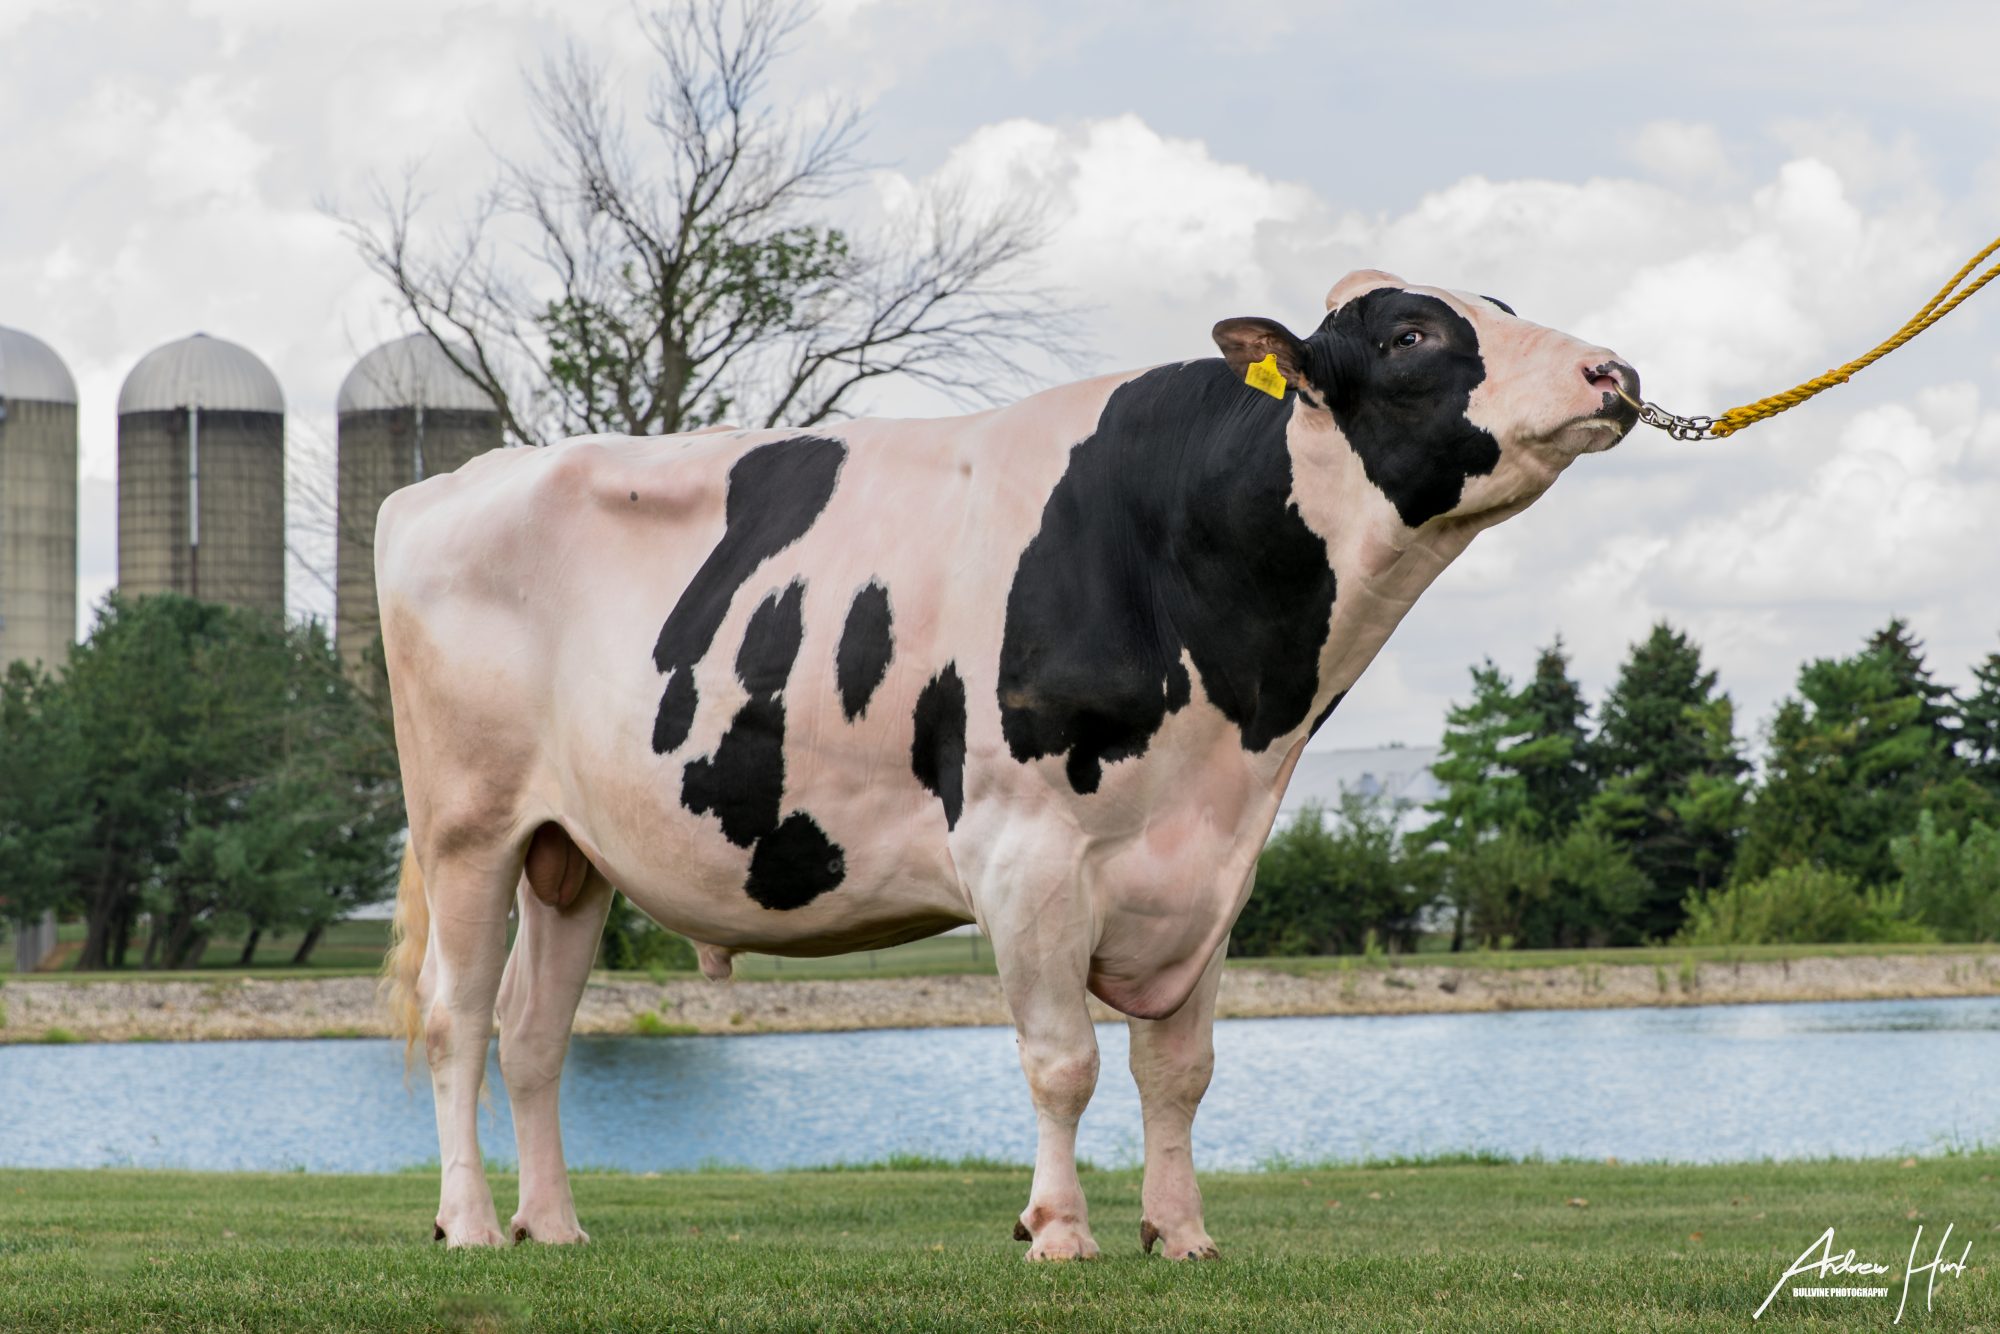
Mountfield SSI Dcy Mogul is one of the most influential Holstein sires in breed history. Select Sires announced in September 2017 that he’d exceeded 1 million units sold at just seven years of age, making him the youngest bull to reach that milestone. His impact as a foundation sire for subsequent generations has been enormous.
That success wasn’t accidental. Mogul daughters delivered. But the sheer scale of his use means his genetics now appear in a substantial percentage of the breed’s pedigrees—often multiple times per animal when you trace back six or seven generations.
The concern isn’t that Mogul was a poor bull. He wasn’t. The concern is that when any sire achieves that level of market penetration, finding genuinely unrelated genetics becomes progressively harder. Research by Doublet and colleagues, published in 2019, documented annual inbreeding rates rising to 0.55% per year in the genomic era—roughly double the rate considered sustainable in the long term.
For individual herds, this means that selecting a “new” high-ranking bull may actually be deepening your connection to Mogul, O-Man, Planet, or Supersire rather than diversifying away from them. Checking kinship data isn’t paranoia—it’s due diligence.
What Inbreeding Actually Costs
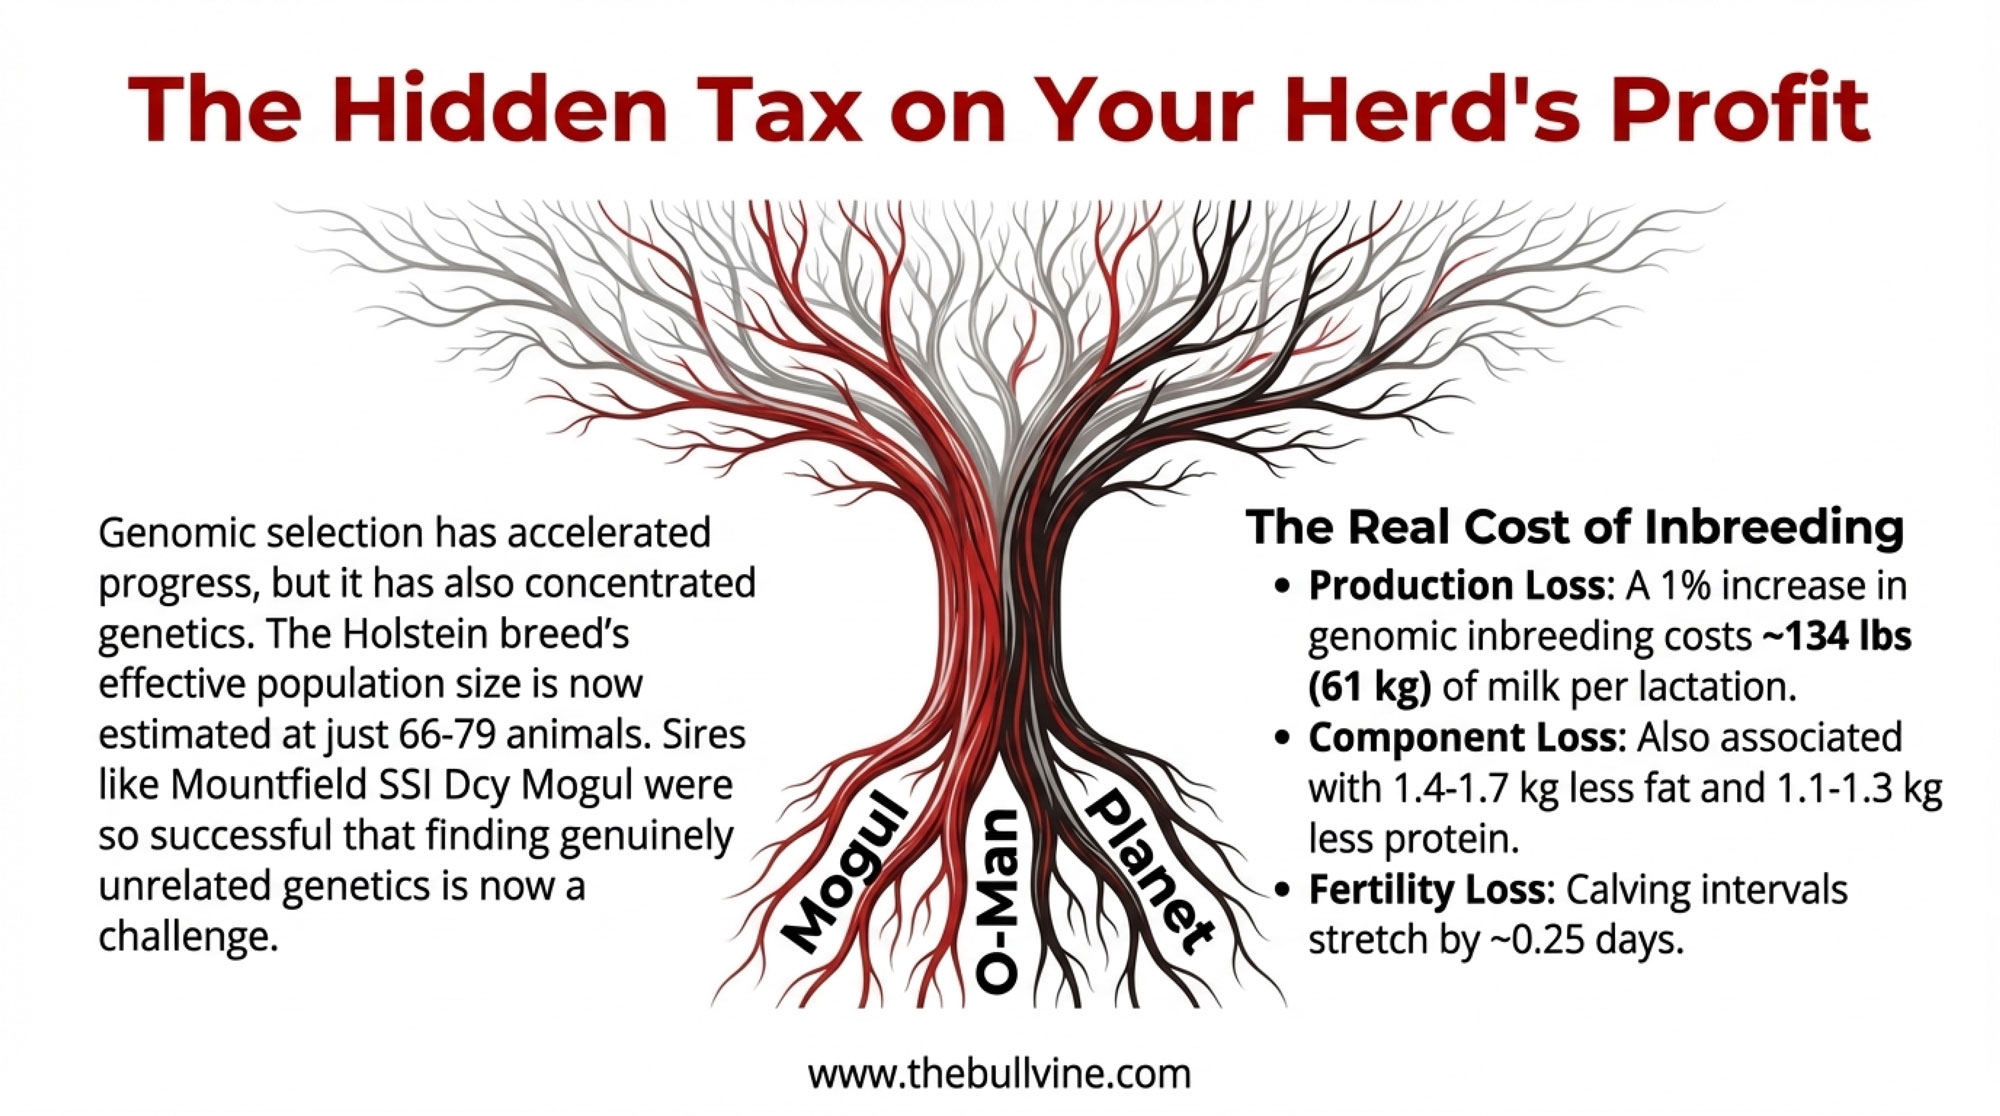
Italian research from Ablondi and colleagues, published in the Journal of Animal Science in 2023, found that a 1% increase in genomic inbreeding—specifically measured via runs of homozygosity (FROH), which captures actual stretches of identical DNA—is associated with about 134 pounds (61 kg) less milk over a 305-day lactation, along with lower fat and protein yields.
German work from Mugambe and colleagues in the Journal of Dairy Science in 2024 found similar patterns:
- 32–41 kg less milk per 1% increase
- 1.4–1.7 kg less fat
- 1.1–1.3 kg less protein
- Calving intervals stretched by roughly a quarter-day per 1% increase
I recently talked with a Wisconsin producer milking about 400 cows who’s been tracking inbreeding and performance for a decade. His take was pretty straightforward: “The daughters are producing more milk than their dams, so the genetic progress is real. But conception rates and feet-and-leg issues have gotten harder to manage. I’m not sure the net gain is as large as the proof sheets suggest.”
The Component Premium Question
The shift toward component-focused genetics has really picked up speed in recent years, especially with the 2025 NM$ revision, which placed 31.8% emphasis on butterfat alone. On paper, that makes a lot of sense given recent price trends. In practice, it depends heavily on where your milk check comes from.
The November 2025 USDA Agricultural Marketing Service announcement showed protein at $3.0143 per pound and butterfat at $1.7061 per pound—a very different picture from a year earlier, when butterfat was over $3.00 a pound. Class III settled at $17.18 per hundredweight. Those relationships move, sometimes dramatically.
Processor Contracts Are Tightening
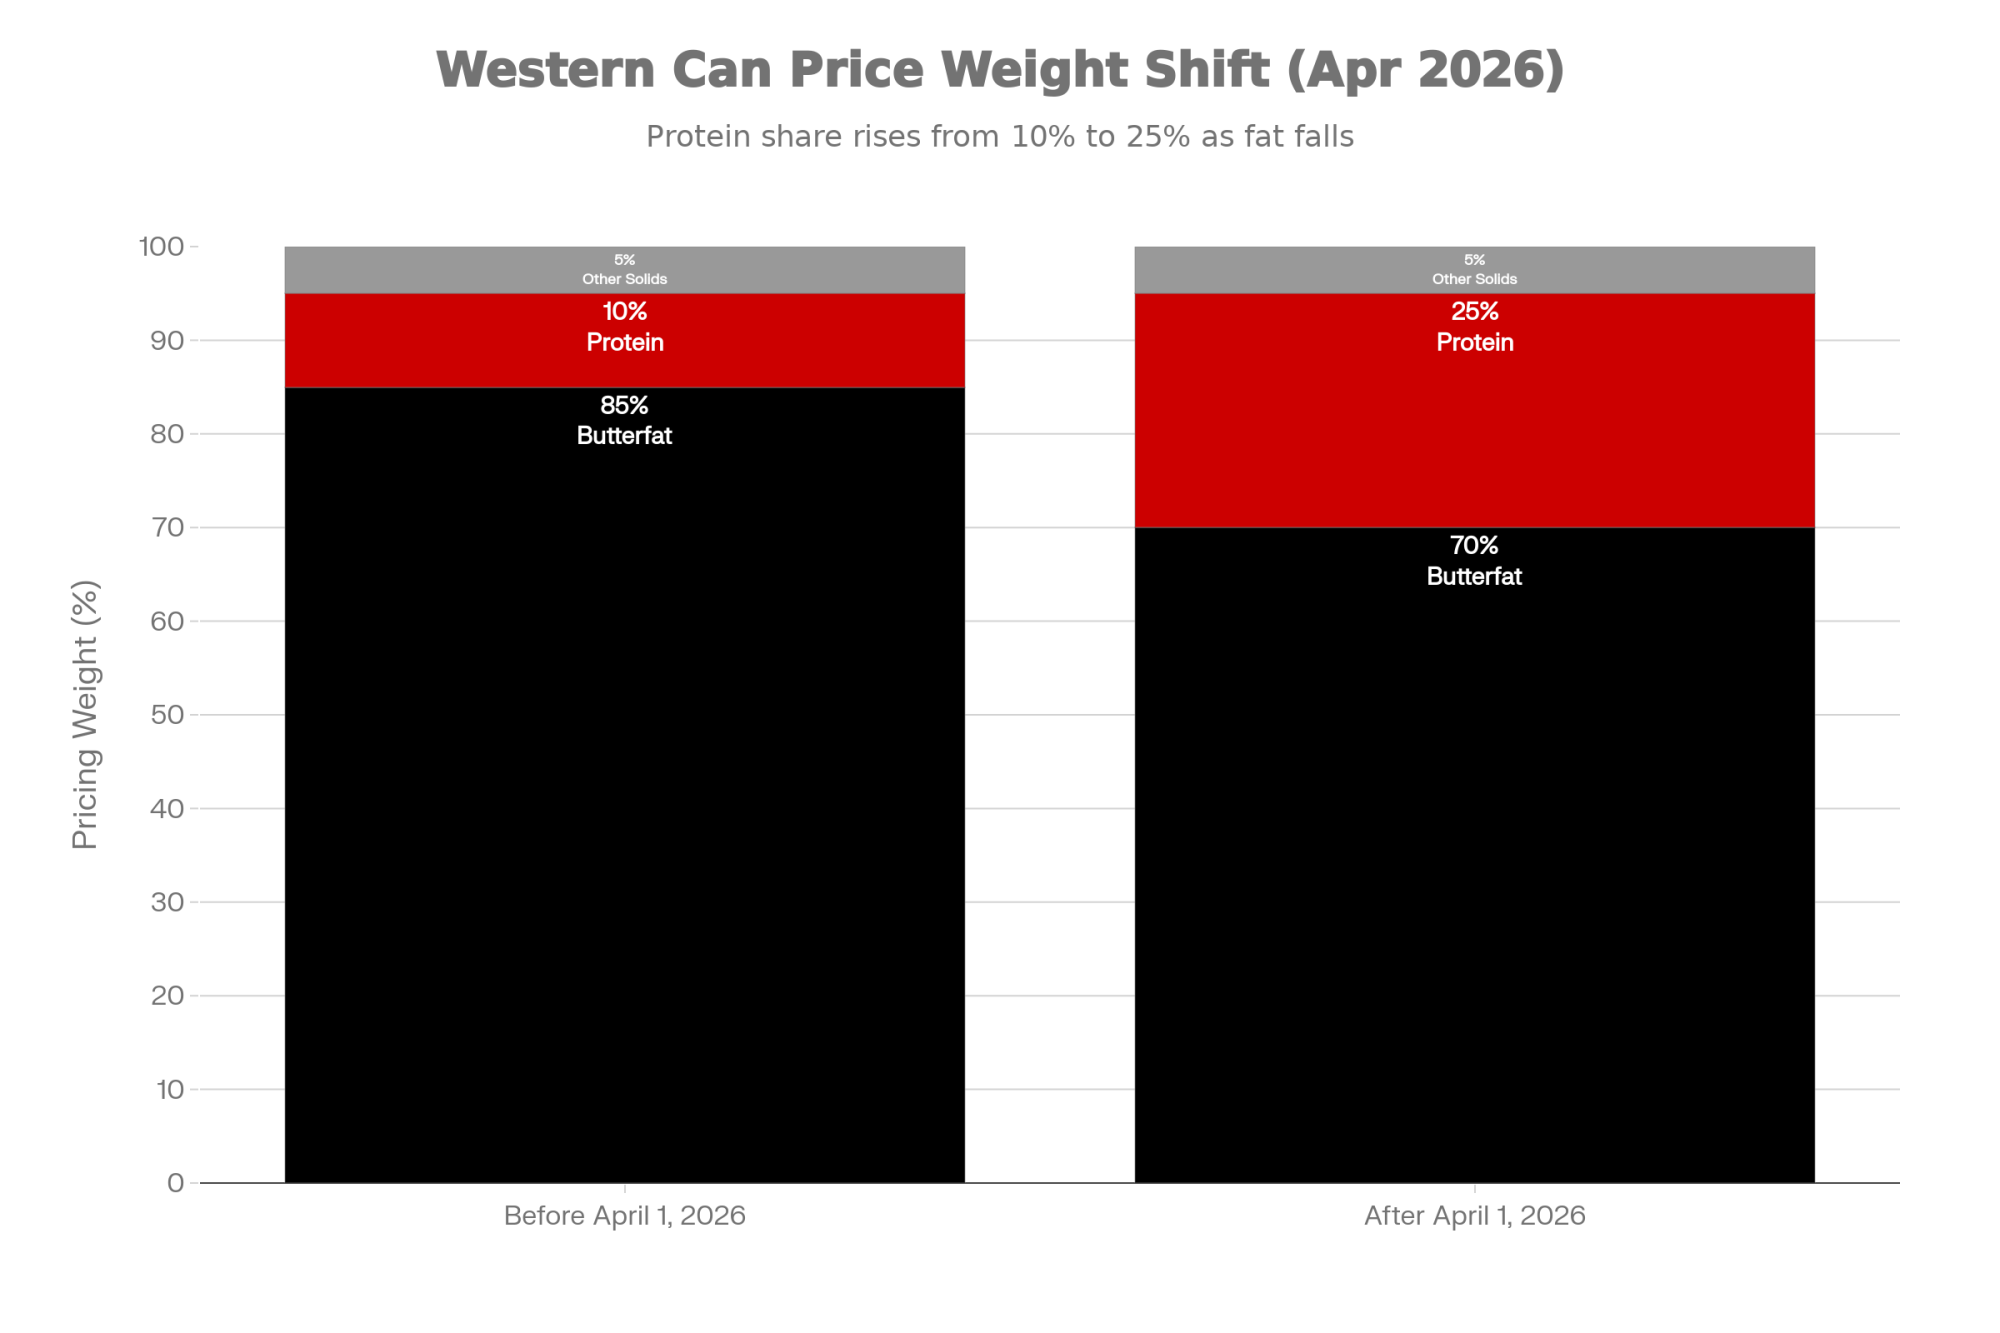
And processor expectations are tightening—that’s something worth paying attention to. Western Canadian provinces—British Columbia, Alberta, Saskatchewan, and Manitoba—announced through the BC Milk Marketing Board a major component pricing ratio shift effective April 1, 2026, moving from 85% butterfat / 10% protein / 5% other solids to 70% butterfat / 25% protein / 5% other solids. That’s a significant rebalancing toward protein that will reward herds already selecting for it and penalize those who aren’t.
In the U.S., the story is similar. New processing capacity often comes with stricter contract requirements. Today’s direct contracts increasingly expect consistent volume, protein tests above 3.2%, and premium somatic cell counts. If your genetics have been drifting away from protein while you’ve been chasing other traits, the next contract renewal window may deliver an unwelcome surprise.
Quick Math Check: What’s Your Component Revenue Share?
Pull your last six milk checks. Add up the component premiums (fat + protein payments above base). Divide by total milk revenue.
- Above 25%: Component genetics is likely paying well for you. The 2025 NM$ emphasis on butterfat aligns with your market.
- 15–25%: Mixed picture. Component genetics help, but don’t over-rotate away from production.
- Below 15%: You may be over-investing in component genetics. Consider whether volume-focused or balanced sires deliver better returns in your specific market.
This 5-minute exercise can save thousands in misaligned genetic decisions.
Red Flag Checklist: 5 Warning Signs Your Genetics Don’t Match Your Market
- Your fat or protein test has dropped 0.2%+ over 3 years while selecting high-NM$ bulls. NM$ emphasizes components, so if your tests are declining despite following index rankings, something in your selection isn’t translating to your tank.
- Your component revenue share (from the Quick Math Check) is under 20%, but you’re heavily using component-focused sires. You may be paying for genetic potential your market doesn’t reward.
- You can’t find a prospective sire with less than 8% relationship to your herd. Genetic concentration has narrowed your options more than you realize—time to seek outcross genetics actively.
- Your processor has mentioned tightening component thresholds or premium structures in recent communications. With Western Canadian provinces shifting to 70/25/5 (fat/protein/other) pricing in April 2026 and U.S. processors increasingly requiring 3.2%+ protein for premium contracts, genetic decisions made today need to anticipate tomorrow’s standards.
- You’re using beef genetics on more than 40% of your herd but haven’t genomic-tested to identify your true top-tier replacements. With dairy heifer inventories at 20-year lows—2.5 million head as of January 2025, according to HighGround Dairy—the cows you keep replacements from matter more than ever.
If you checked two or more: Your three gears may be grinding. Consider a formal review of your breeding program’s alignment with your current market before your next semen order.
The Feed Efficiency Factor
There’s another dimension to this calculation that’s getting more attention in 2025: feed efficiency. The April 2025 NM$ revision now includes 17.8% combined emphasis on Feed Saved, which incorporates both body weight composite and residual feed intake—a significant increase from previous versions.
Here’s what the research tells us: residual feed intake has moderate heritability, typically estimated between 0.15-0.25 in Holstein populations, making it a meaningful selection target over time. And USDA research used in the NM$ calculations shows that feed costs average about 58% of milk income, broken down into 39% for production costs and 19% for maintenance. That’s not “a big part” of the budget; it’s often the biggest lever you have.
Detailed Per-Cow, Per-Lactation Example
Let’s put real numbers to a side-by-side comparison using November 2025 Class III prices and the economic values from the 2025 NM$ revision.
Scenario: Two cows in the same 500-cow Midwest Class III herd
| Factor | Cow A (Volume-Focused) | Cow B (Component-Aligned) |
| Daily milk | 62 lbs | 56 lbs |
| Fat test | 3.7% | 4.2% |
| Protein test | 3.0% | 3.3% |
| 305-day milk | 18,910 lbs | 17,080 lbs |
| 305-day fat | 700 lbs | 717 lbs |
| 305-day protein | 567 lbs | 564 lbs |
Revenue calculation (Class III component pricing):
- Cow A: Fat (700 × $1.71) + Protein (567 × $3.01) + Other solids ≈ $2,904
- Cow B: Fat (717 × $1.71) + Protein (564 × $3.01) + Other solids ≈ $2,927
Component advantage for Cow B: ~$23/lactation
Feed cost calculation (using USDA’s NM$ 2025 values of $0.13/lb DMI and requirements of 0.10 lbs DMI per pound of milk, 8.0 lbs per pound of fat, and 6.5 lbs per pound of protein):
- Cow A DMI: (18,910 × 0.10) + (700 × 8.0) + (567 × 6.5) = 11,185 lbs
- Cow B DMI: (17,080 × 0.10) + (717 × 8.0) + (564 × 6.5) = 10,810 lbs
Feed cost difference: 375 lbs × $0.13 = $49/lactation advantage for Cow B
If Cow B also has 3% better residual feed intake (genetic feed efficiency): Additional savings: ~325 lbs DMI × $0.13 = $42/lactation
Total advantage for component-aligned Cow B in Class III market: $23 (components) + $49 (baseline feed) + $42 (RFI) = ~$114/lactation
Over a 500-cow herd: That’s roughly $57,000/year in additional margin from aligned genetics—not from buying “better” bulls, but from buying bulls that fit the operation’s market and management.
In a fluid market with minimal component premiums, this math reverses. Cow A’s extra 1,830 lbs of milk volume generates more revenue, and the feed efficiency advantage shrinks because you’re not capturing the component value. The same genetics, completely different financial outcome.
What Specialization Actually Costs
Every specialized sire carries trade-offs embedded in his genetic package. The proof sheet highlights the specialization; it doesn’t spell out what you’re giving up.
Leeds’ calving-ease strength comes from specific physical characteristics—smaller, finer skeletal structure, lower birth weight calves, and reduced pelvic dimensions. For operations genuinely struggling with calving difficulty—assisted births over 18–20%—the trade-off often pencils out. For herds where calving assistance is already well-managed, the structural compromise might cost more than the calving-ease saves.
Hotshot’s emphasis on longevity reveals a different dynamic. His moderate milk proof looks more like a genetic ceiling than a starting point. When bred heifers bring $4,000 or more at auction, and raising costs run around $1,700–$2,400 per head, keeping cows in the herd for more lactations makes sense on paper. But if those cows are giving 6–8 lbs/day less than alternatives, whether longevity genetics pay off depends on your culling rate, replacement strategy, and feed costs.
A Northeast grazing operation I spent time with last spring leaned into longevity-focused genetics five years earlier and were genuinely happy with the outcome. “The per-cow production dropped some,” the producer told me, “but with lower replacement costs and better cow health, we’re actually keeping more of what we make.”
| Sire Type | Intended Benefit | Hidden Trade-Off | Best Fit | Expensive Misfit |
|---|---|---|---|---|
| Calving-Ease (e.g., Leeds) | Lower assisted births, reduced labor during calving, fewer injury losses | Smaller frame, reduced mature size, often comes with 6-8 lbs/day lower lifetime production | First-calf heifers; herds with assisted calvings >18%; operations with limited labor for calving supervision | Well-managed herds with <10% assisted births; operations where replacement heifers cost $4,000+ and production matters more than calving ease |
| Longevity-Focused (e.g., Hotshot) | Extended productive life, lower replacement costs, better transition cow health | Moderate milk proofs often represent genetic ceiling, not starting point; slower genetic progress on production traits | High replacement costs ($2,200+ per heifer); grazing operations; herds targeting 3.5+ lactations; limited heifer inventory | Operations with strong cull cow markets; herds breeding beef-on-dairy on bottom 40%; processors paying volume bonuses; low feed costs favoring higher production |
| Robotic-Optimized (e.g., Urzokari) | Improved voluntary robot visits, better teat positioning, reduced fetch time | Emphasis on udder/teat traits may sacrifice component genetics or production potential; value only captured if robots utilized efficiently | Robotic dairies; operations struggling with fetch rates >15%; herds prioritizing labor efficiency over per-cow production | Conventional parlor operations; herds with no robot plans; component-paying markets where udder traits matter less than tests |
When Realignment Pays Off: A Recovery Story
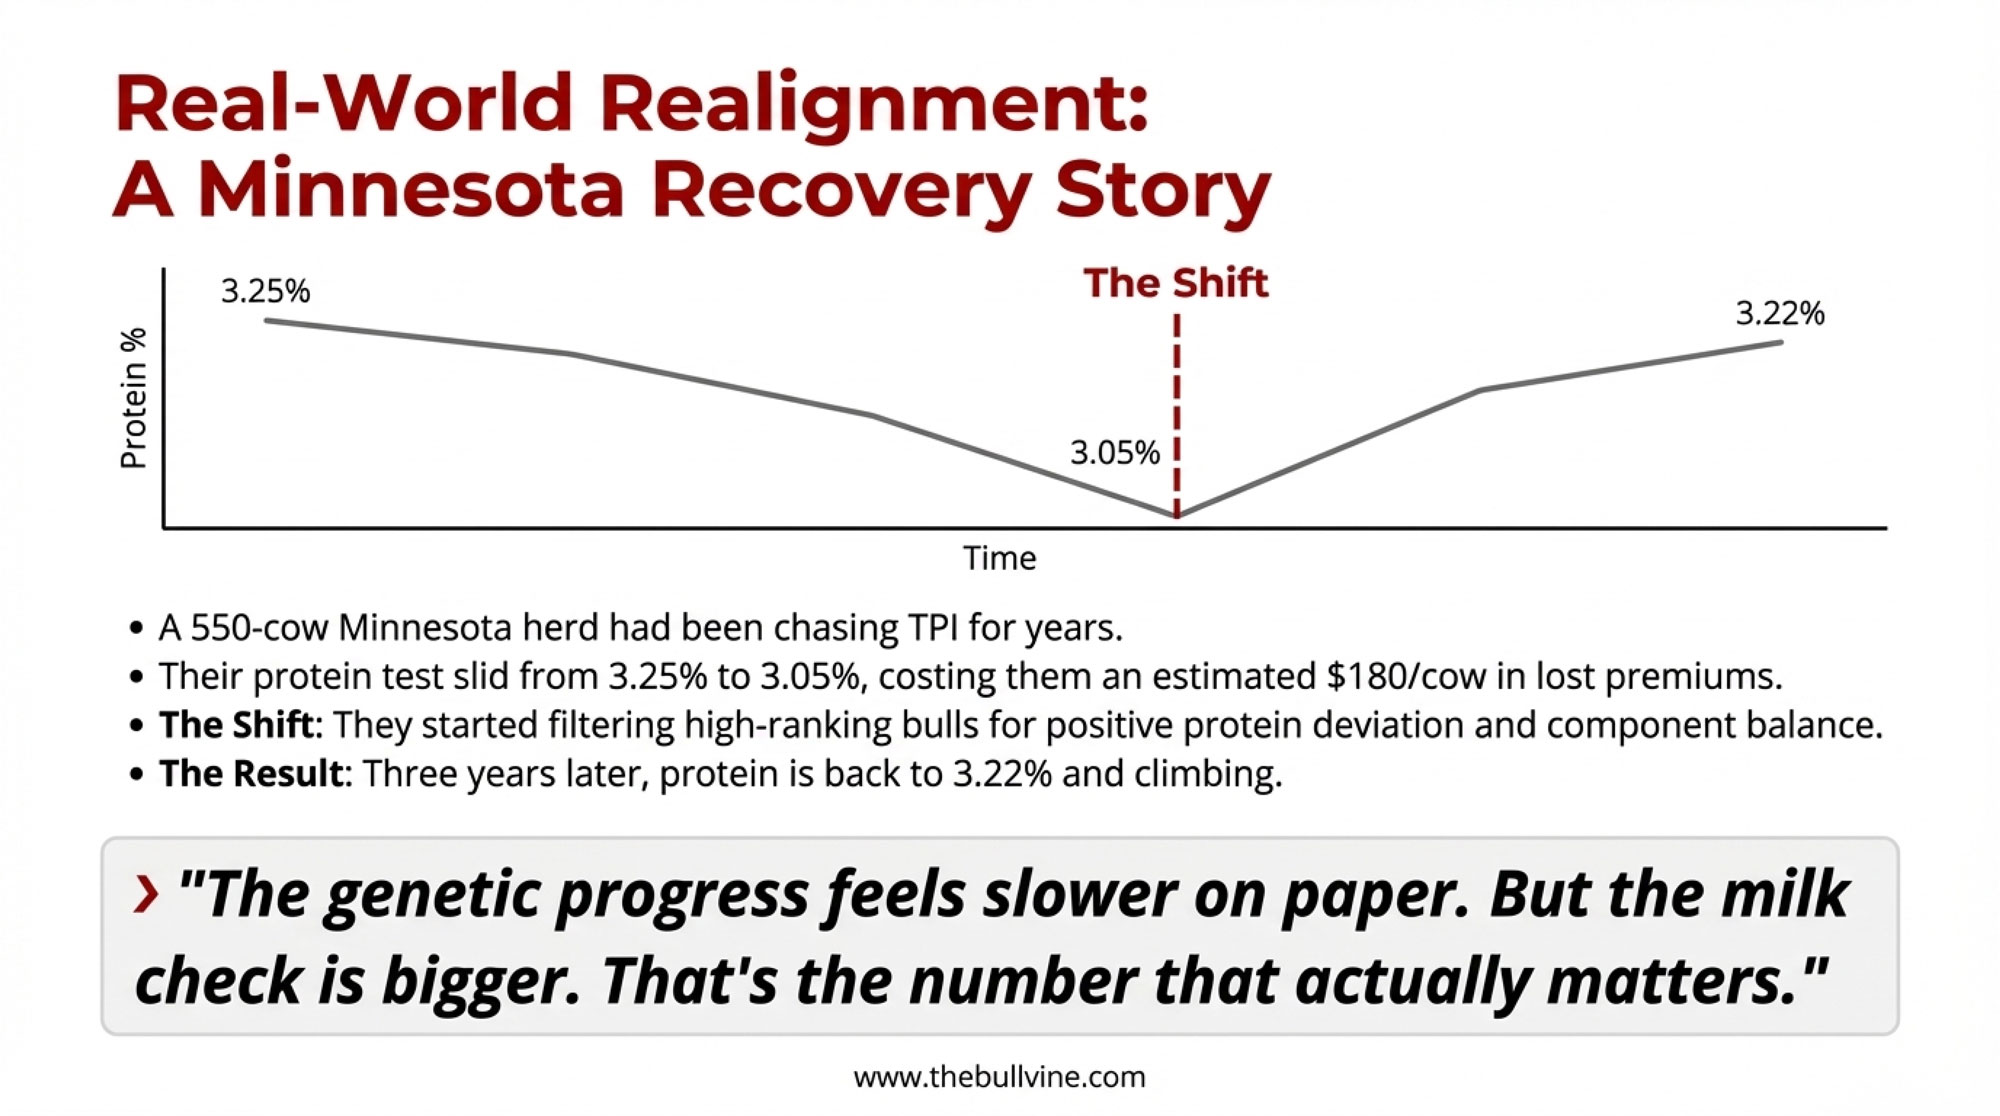
What happens when a producer recognizes the mismatch and corrects course? I talked with a 550-cow operation in central Minnesota that went through exactly that process.
“We’d been chasing TPI for about eight years,” the herd manager explained. “Good bulls, good genomics, no complaints about the genetics themselves. But we were shipping to a cheese plant, and our protein test just kept sliding—went from 3.25% down to 3.05% over that stretch. Meanwhile, the premiums for protein kept going up.”
When they ran the numbers in 2022, they realized they were leaving close to $180 per cow in component revenue on the table annually. “That’s when it clicked. We weren’t using bad genetics. We were using the wrong genetics for our market.”
They shifted their sire selection criteria—still using high-ranking bulls, but filtering hard for positive protein deviation and component balance. Three years later, their protein test is back to 3.22% and climbing.
“The genetic progress feels slower on paper,” he admitted. “But the milk check is bigger. That’s the number that actually matters.”
Regional Considerations
Where you farm changes these calculations more than most proof sheets acknowledge.
In the Southeast and Southwest, producers dealing with persistent heat stress often find that moderate production with stronger health and fertility traits out-earns elite production genetics that struggle through extended summers. In the Upper Midwest and Northeast, grazing-heavy systems face different realities—a cow built for a California dry lot isn’t always the cow you want walking hillsides in Vermont.
The Beef-on-Dairy Connection
The three-gear framework applies to more than just which dairy sires you’re using—it also shapes your beef-on-dairy strategy.
The 2024 NAAB semen sales report shows 7.9 million beef semen units flowing into U.S. dairy operations, representing over 80% of all beef semen sales. Meanwhile, dairy heifer inventories expected to calve dropped to 2.5 million head as of January 2025—the lowest level since USDA began tracking this data, according to HighGround Dairy analysis. CoBank research projects 357,490 fewer dairy heifers for 2025 compared to the prior year, driven largely by beef-on-dairy breeding decisions.
Here’s where the gears mesh—or grind: If you’re using beef genetics on your bottom-tier cows, you’ve already made a three-gear decision. You’re saying those animals don’t fit your Genetics goals (not worth keeping daughters from), don’t justify the Management investment of raising replacements, and the Market for beef calves currently rewards that choice.
But the framework cuts both ways. With heifer supplies this tight, the cows you do keep replacements from matter more than ever. Beef Magazine’s November 2025 report notes that beef-on-dairy cattle now represent 12–15% of all fed slaughter—the crossbreds have become an indispensable part of the beef supply chain. That’s fine, as long as your top-end genetics are truly aligned with your dairy operation’s market and management. Using beef on low-merit cows makes sense; accidentally breeding beef on cows that should be producing your next generation of high-component replacements is a costly mistake that compounds over time.
Finding Genuine Genetic Diversity
While genetic gains have more than doubled in the genomic era, breeding for diversity inside Holsteins now takes real effort.
For Purebred Holstein Operations
Seek out niche Holstein lines. Legacy maternal lines like Hanover-Hill, Landmark, Meteor, Durham, or Elegant, which were prominent 20–30 years ago but don’t dominate today’s rankings, can bring different genetics to the table.
Request genomic kinship data. Most major AI companies can show you how closely a prospective sire is related to your herd’s core cow families. CDCB offers inbreeding tools as well. For operations that haven’t genomic-tested their cows yet, current testing runs around $40–50 per head—a worthwhile investment if you’re serious about managing inbreeding across your herd.
Unfold pedigrees further back. Many so-called outcross sires look different in the first three generations, then converge on Mogul, O-Man, Planet, or Supersire once you get back to generation six or eight.
Consider the National Animal Germplasm Program. USDA’s germplasm program maintains semen and embryos from older, less-represented lines to preserve genetic diversity for long-term breed health.
“I’ve stopped looking at the top 10 TPI list entirely. If a bull doesn’t have positive deviation for protein and decent feet-and-legs, he doesn’t enter my tank, regardless of his rank. The proof sheets tell you what a bull can do genetically. They don’t tell you whether those genetics fit your parlor, your market, or your management. That’s the part you have to figure out yourself.”
— Wisconsin producer, 650-cow operation
A Framework for Matching Genetics to Your Operation
Five Questions Before You Pick a Bull
1. What’s my actual milk market? How much of your check comes from components versus volume?
2. What’s my primary constraint? Is involuntary culling above 25%? Are assisted calvings over 18%? Is production lagging?
3. Does this sire truly address that constraint? If calving isn’t a major issue, calving-ease sires might just be giving away production.
4. How closely is this bull related to my herd? Check genomic kinship or pedigree overlap.
5. What does the five-year math look like? Account for production, components, feed costs, replacements, and health.
The Larger Perspective
When you put all of this together, what’s interesting is how much breeding has shifted from “Which bull is best?” to “Which bull best fits what I’m actually trying to do here?”
The Holsteins that maximize returns on a 3,000-cow California dry lot shipping Class III milk are not the same Holsteins that fit a 200-cow Wisconsin grazing herd shipping mostly fluid milk. Both operations might reasonably use bulls like Leeds or Hotshot—but in very different proportions, for very different reasons, and with very different expectations.
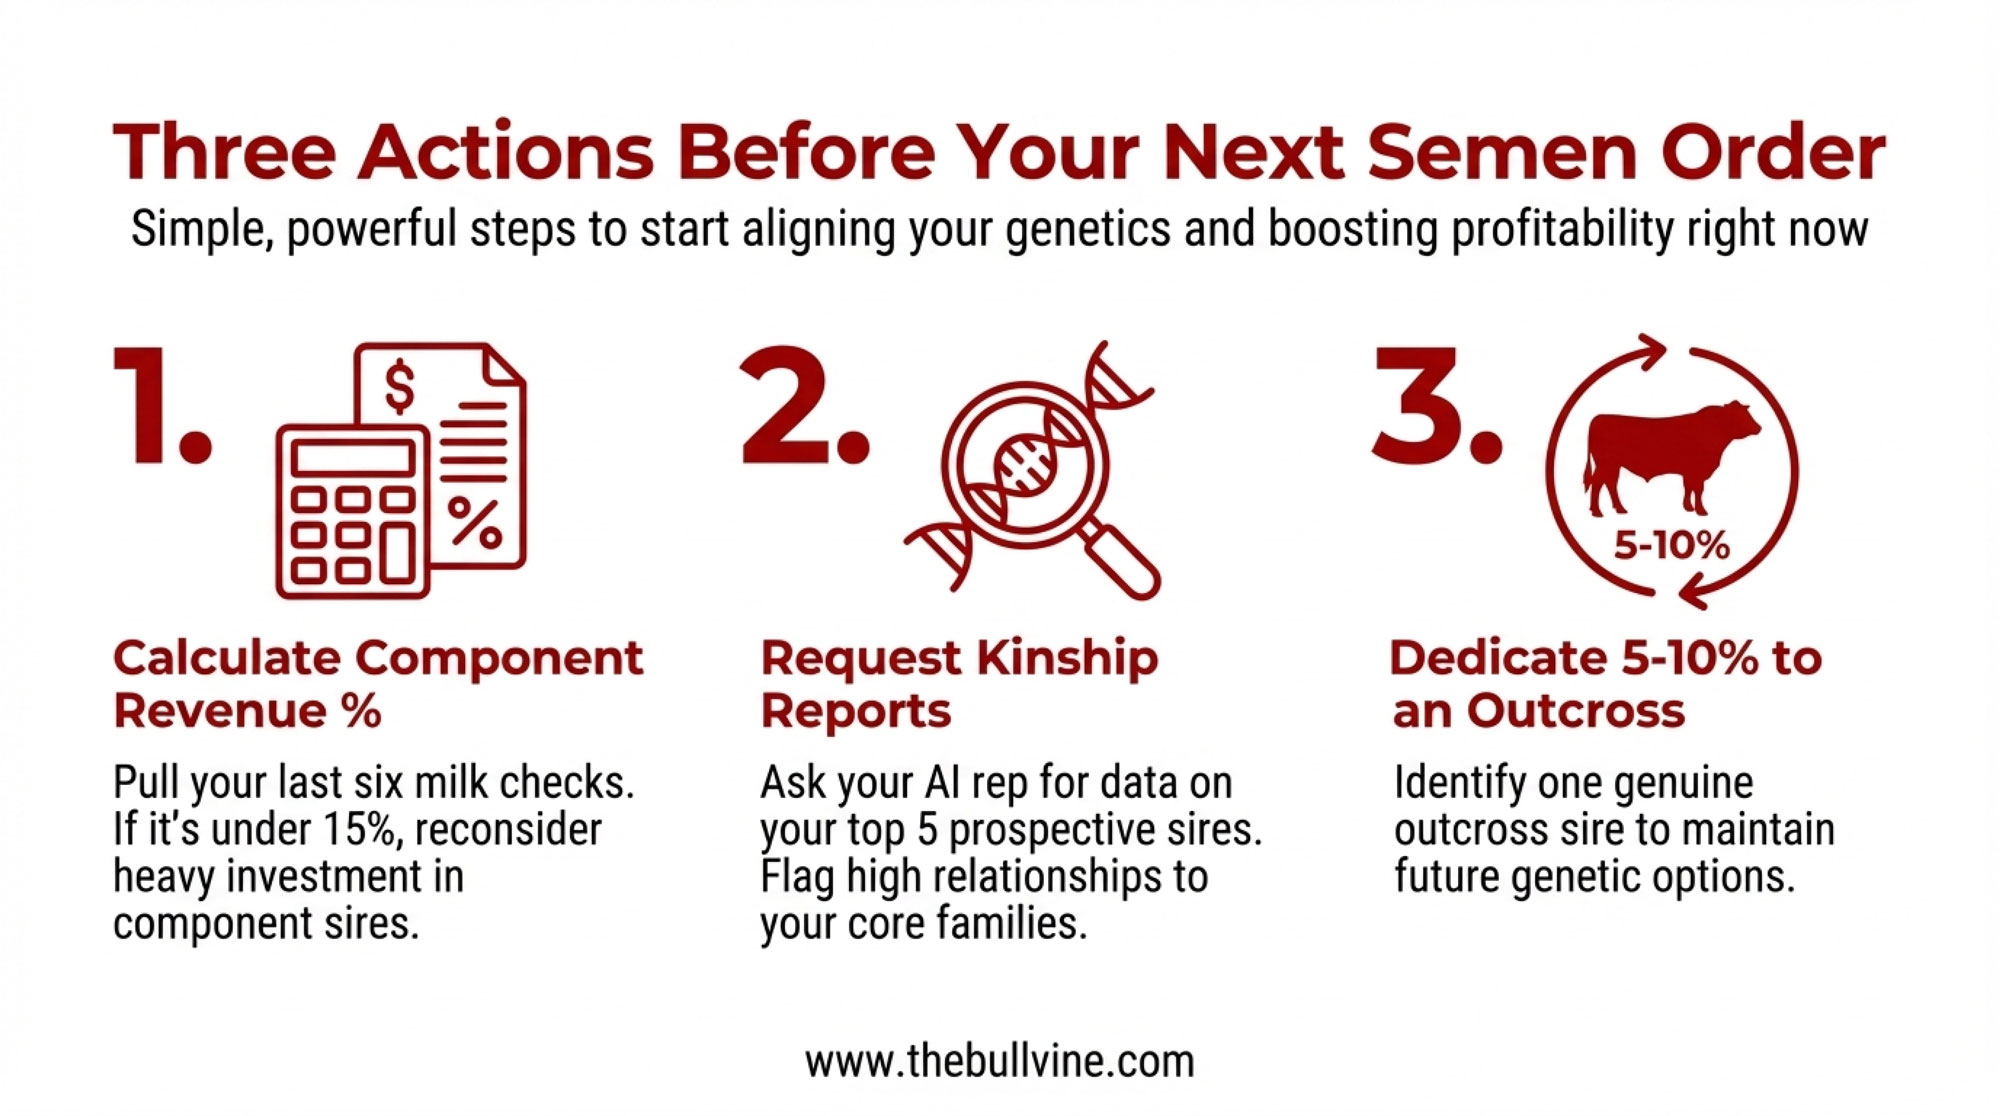
Three Actions Before Your Next Semen Order
- Calculate your component revenue percentage from your last six milk checks. If it’s under 15%, reconsider heavy use of component-focused sires.
- Request kinship reports on your top 5 prospective sires from your AI representative. Flag any showing an elevated relationship to your existing cow families or heavy Mogul/O-Man/Planet ancestry.
- Identify one genuine outcross sire from an underrepresented maternal line for 5–10% of your matings—not to chase diversity for its own sake, but to maintain options as the breed continues to concentrate.
The tools to make smarter, more aligned decisions exist—genomic kinship, feed efficiency data, inbreeding metrics, and diverse sire options. The challenge, and the opportunity, is taking the time to line those tools up with the reality of your own farm.
The Bottom Line
What’s been your experience with specialized genetics? Have calving-ease, longevity-focused, or component-heavy sires delivered the returns their proofs suggested under your conditions? The most useful lessons often come from comparing what the proofs promised with what actually showed up in the bulk tank and the balance sheet.
Key Takeaways
- Fit beats rank. The same genetics can cost one farm $190,000/year and add $57,000 to another—the difference is market alignment, not genetic quality.
- Misalignment drains profit quietly. Volume genetics in a cheese market can leave $150,000–$190,000 annually on the table, even when production looks strong.
- NM$ is designed for the average herd. The 2025 revision puts 31.8% emphasis on butterfat. If your market doesn’t reward components, you’re paying for genetic potential you can’t capture.
- Inbreeding costs compound. Each 1% increase means ~134 lbs less milk plus weaker fertility—and at 0.55% annually, the breed is accumulating it faster than ever.
- Before your next semen order: Calculate your component revenue share (5 minutes), request kinship data on prospective sires, and reserve 5–10% of matings for genuine outcrosses.
EXECUTIVE SUMMARY:
The same genetics can cost one operation $190,000 a year and add $57,000 to another. The difference isn’t genetic quality—it’s market alignment. This article introduces a three-gear framework (Genetics, Market, Management) that helps producers evaluate whether their breeding program actually fits their milk check. Drawing on USDA’s April 2025 NM$ revision and peer-reviewed research, it demonstrates how misaligned genetics can quietly drain profitability even when production looks strong. Practical tools include a 5-minute component revenue analysis, five questions to ask before selecting any sire, and strategies for finding genuine diversity as the breed concentrates. The goal isn’t finding “better” bulls—it’s finding bulls that fit your operation.
Complete references and supporting documentation are available upon request by contacting the editorial team at editor@thebullvine.com.
Learn More
- 2025 Genetic Reset: How Rigid Bull Selection Could Cost Your Herd $147000 – Stop losing money on the 2025 genetic reset. This article exposes the $147,000 risk of rigid bull thresholds and delivers an adaptive blueprint to capture a 37% profit boost through smarter, custom index strategies.
- Breeding Into a Moving Market: What Butterfat’s Crash Reveals About Dairy’s Genetic Timing Problem – Don’t get caught in the five-year “timing gap.” By analyzing the recent butterfat crash, this piece reveals how to build a flexible herd that remains profitable even when commodity prices flip overnight.
- BANNs CRUSH Traditional Models: The AI Secret Weapon Reshaping Dairy Genetics – Is your genomic data lying to you? Discover how Biologically Annotated Neural Networks are crushing traditional models, boosting accuracy by 7% and redefining what’s possible for your operation’s future health and milk yield.
 Join the Revolution!
 Join the Revolution!
Join over 30,000 successful dairy professionals who rely on Bullvine Weekly for their competitive edge. Delivered directly to your inbox each week, our exclusive industry insights help you make smarter decisions while saving precious hours every week. Never miss critical updates on milk production trends, breakthrough technologies, and profit-boosting strategies that top producers are already implementing. Subscribe now to transform your dairy operation’s efficiency and profitability—your future success is just one click away.


