$225K from beef‑on‑dairy, $6M digesters in the red, and 10-year permits on offer. This isn’t theory — it’s where herds are actually moving.
Executive Summary: South Dakota has become dairy’s new magnet, adding 25,000 cows in a year to hit 240,000 head by January 2026, while California Dairies Inc. shut a 99‑year‑old plant in Los Banos. The piece shows how that kind of dairy farm relocation is being driven by 10‑year CAFO permits, nine‑figure cheese investments, and genetics built for component pricing on the I‑29 corridor — and by rising water, labor, and methane‑rule friction in the West. It puts real faces on the shift: David Lemstra leaving California after 40 years to build Dakota Line Dairy in South Dakota, and California producers like Jared Fernandes and Simon Vander Woude staying put but flipping genetics, forage use, and beef‑on‑dairy strategy to make the math work. On the income side, beef‑on‑dairy crosses that bring $80–90 a head over Holsteins can add about $225,000 a year to a 2,000‑cow herd; on the cost side, $6‑million digesters and LCFS credits falling from $200 to ~$60/ton have turned many “green” projects into long‑shot paybacks. From there, it lays out three concrete paths — relocate, stay and adapt, or cash out — backed by specific rules of thumb like a $0.75/cwt 3‑year basis trigger, a 7–10‑year relocation payback window, and a 20% 21‑day pregnancy rate threshold for sexed‑on‑top/beef‑on‑bottom programs. The takeaway for 2026 is blunt: sitting in the middle — too big for niche, too small for true scale, stuck in a high‑friction state — is a choice, and probably the riskiest one on the table.
In January 2026, a load of Holstein springers from a top-tier herd — impeccable records, sexed-semen confirmation, premier genetics — sold for $3,300 a head. Two loads of heifers from custom raisers, with no birthdates, no records, and bred to natural-service Black Angus bulls, cleared $3,400. Jake Bettencourt of TLAY Dairy Video Sales, who witnessed the sale, put it plainly: “The main trend currently is, ‘What calf is a springer carrying?'”
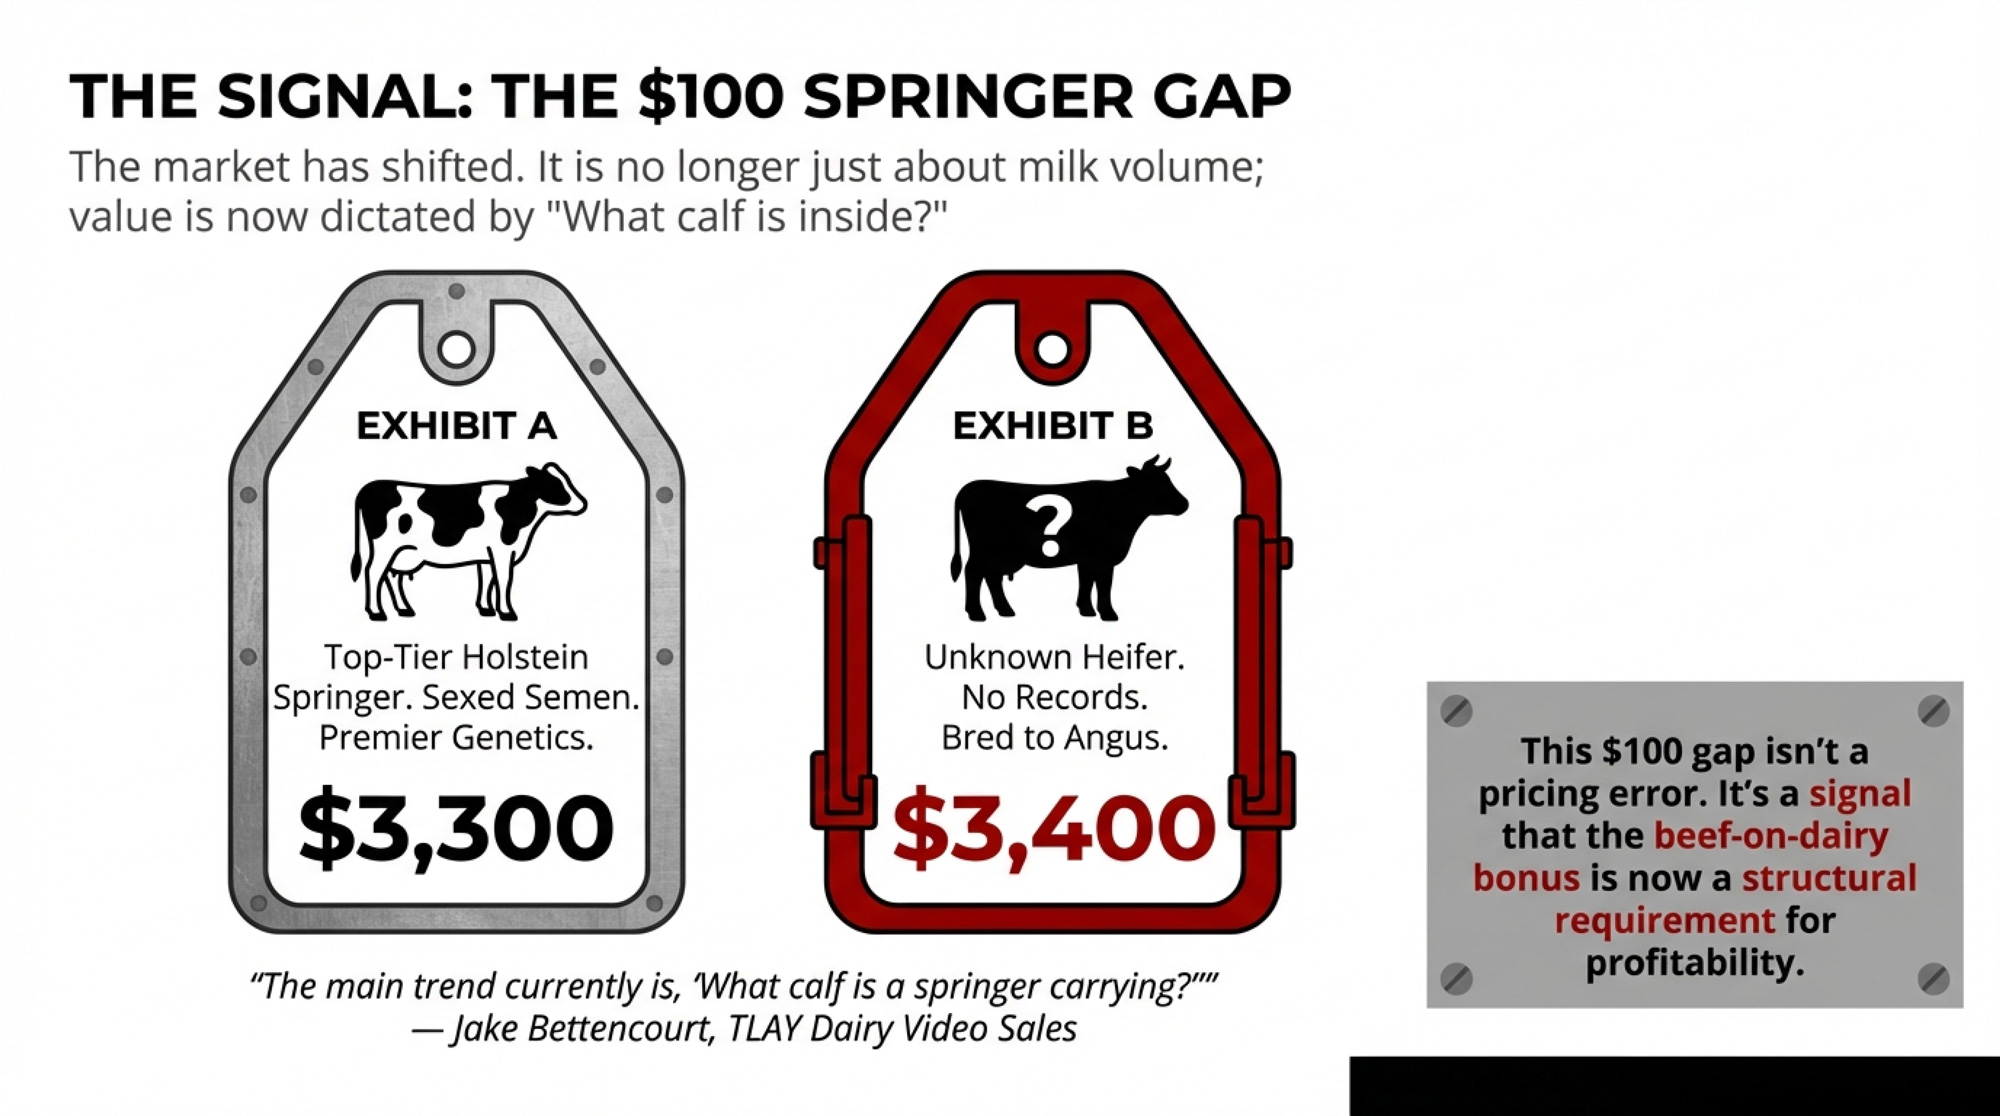
That $100 gap is a small number with a big message. This dairy migration — the relocation of dairy farms at an industrial scale — isn’t just about geography. It’s about which regions built systems where every piece of the profit equation works together, and which ones quietly stacked friction until producers started loading trucks.
88,000 Cows in Five Years — and 25,000 More Right Behind Them
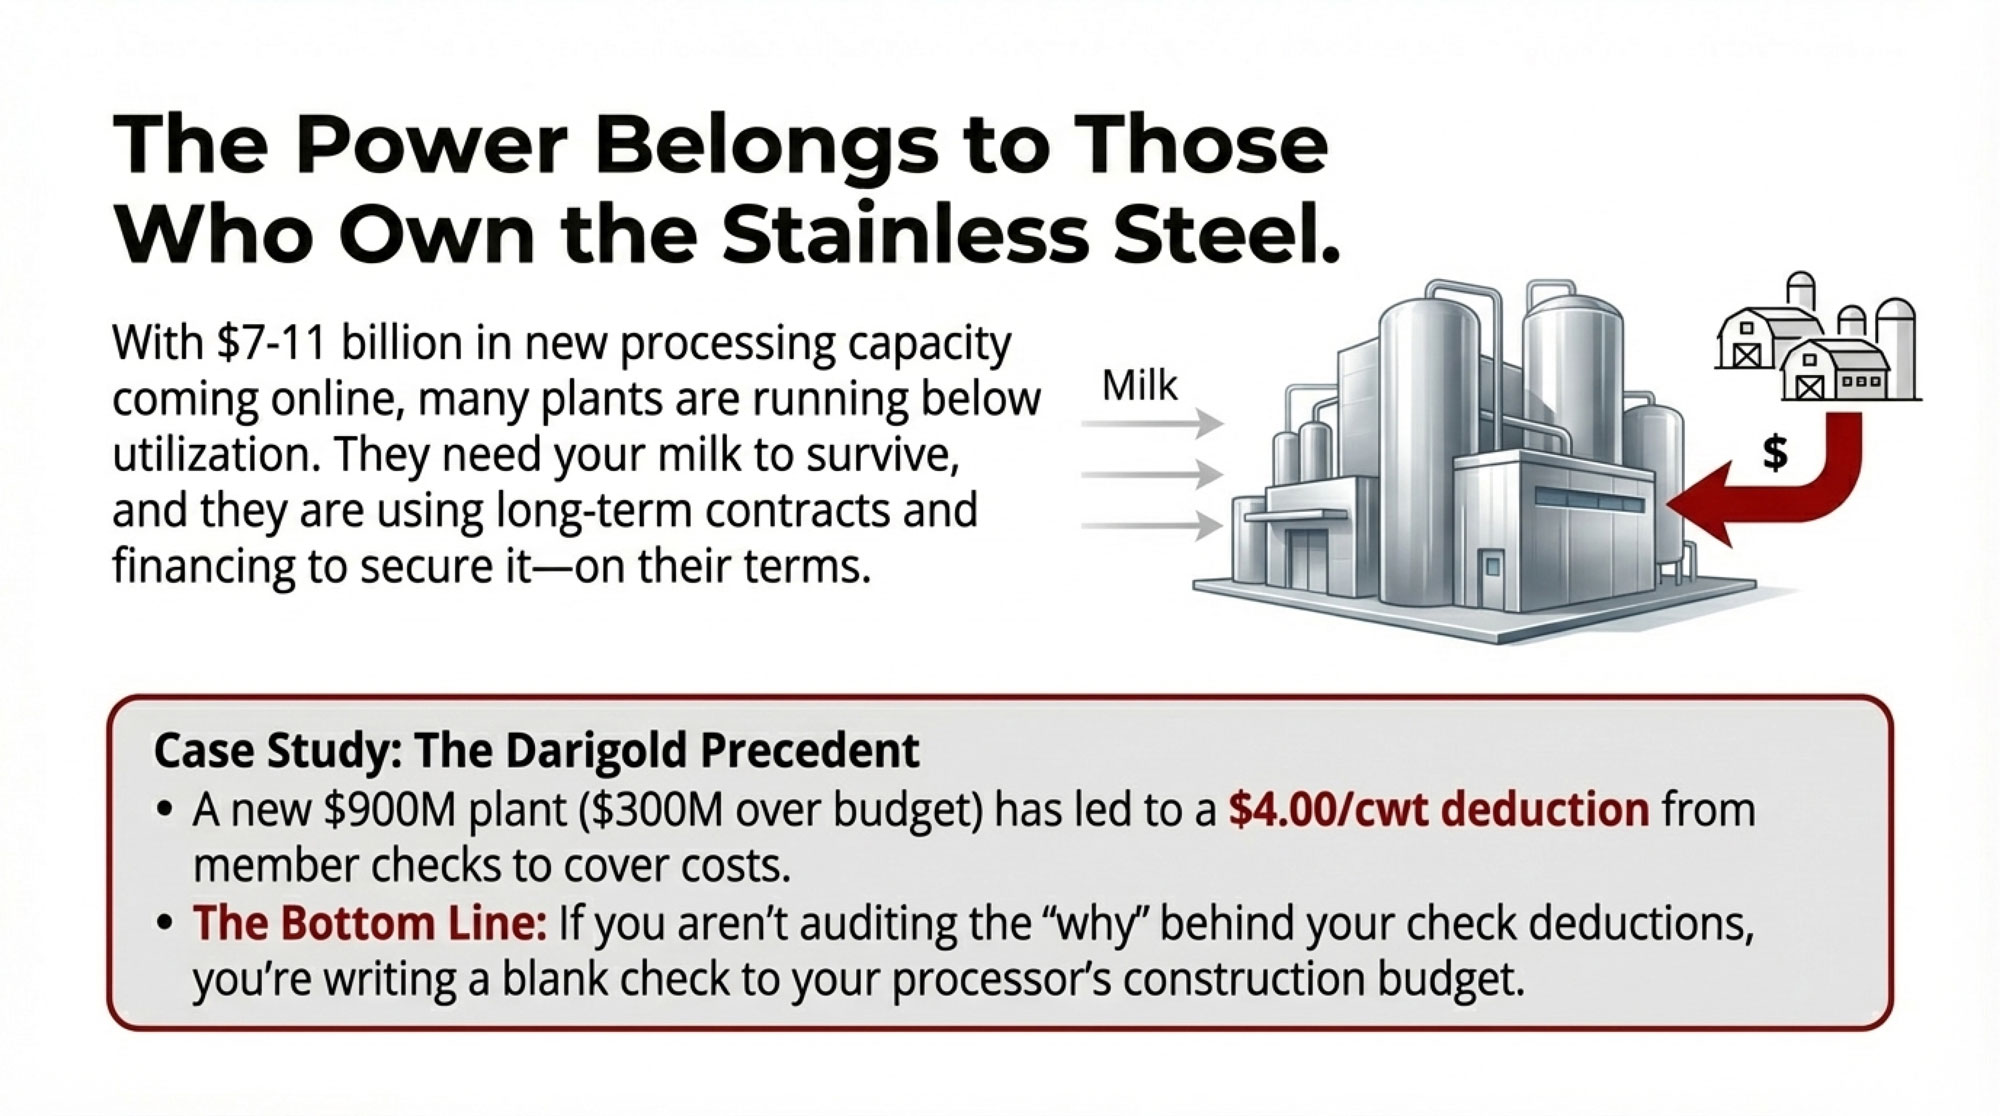
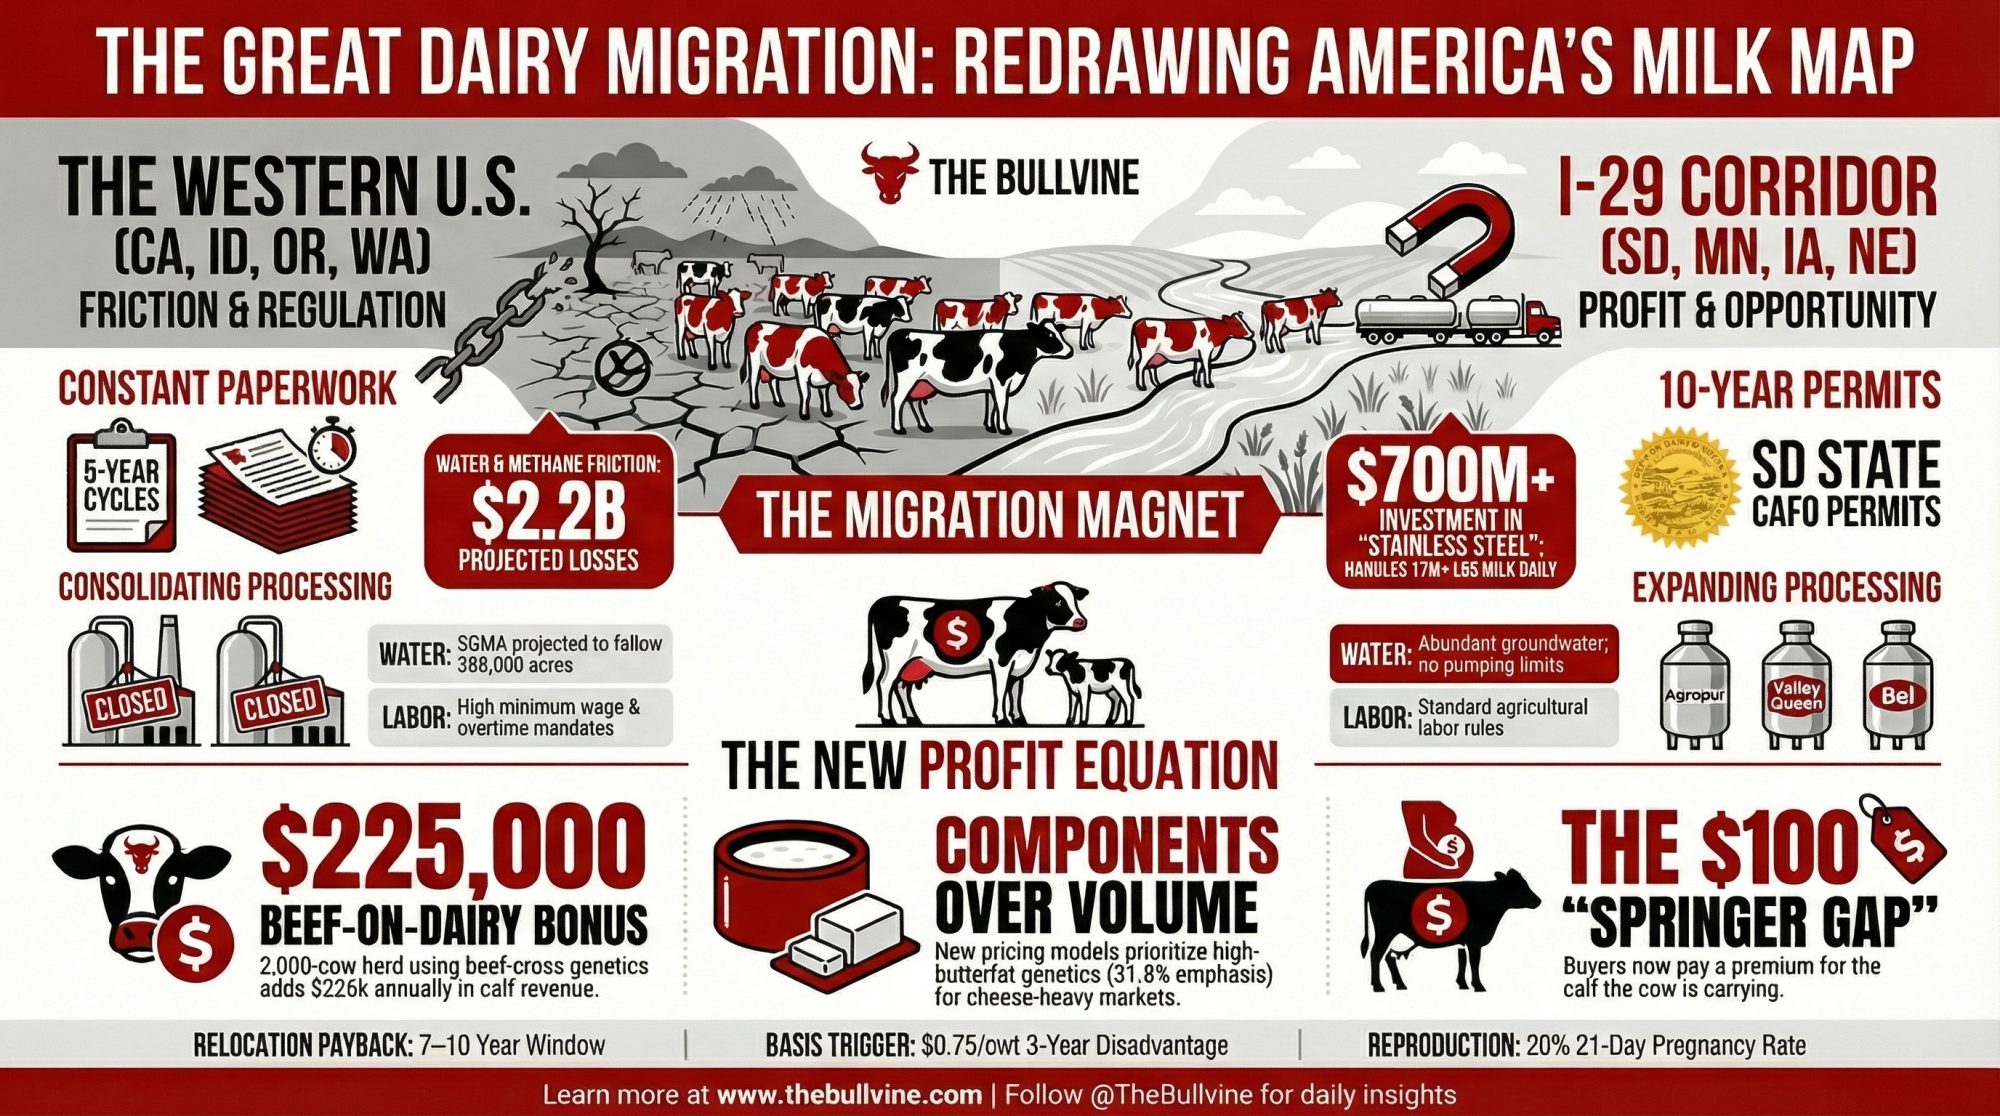
The I-29 and I-90 corridors running through South Dakota, Minnesota, Iowa, and Nebraska have become the primary growth engine for U.S. milk production. The reason isn’t abstract. It’s stainless steel.
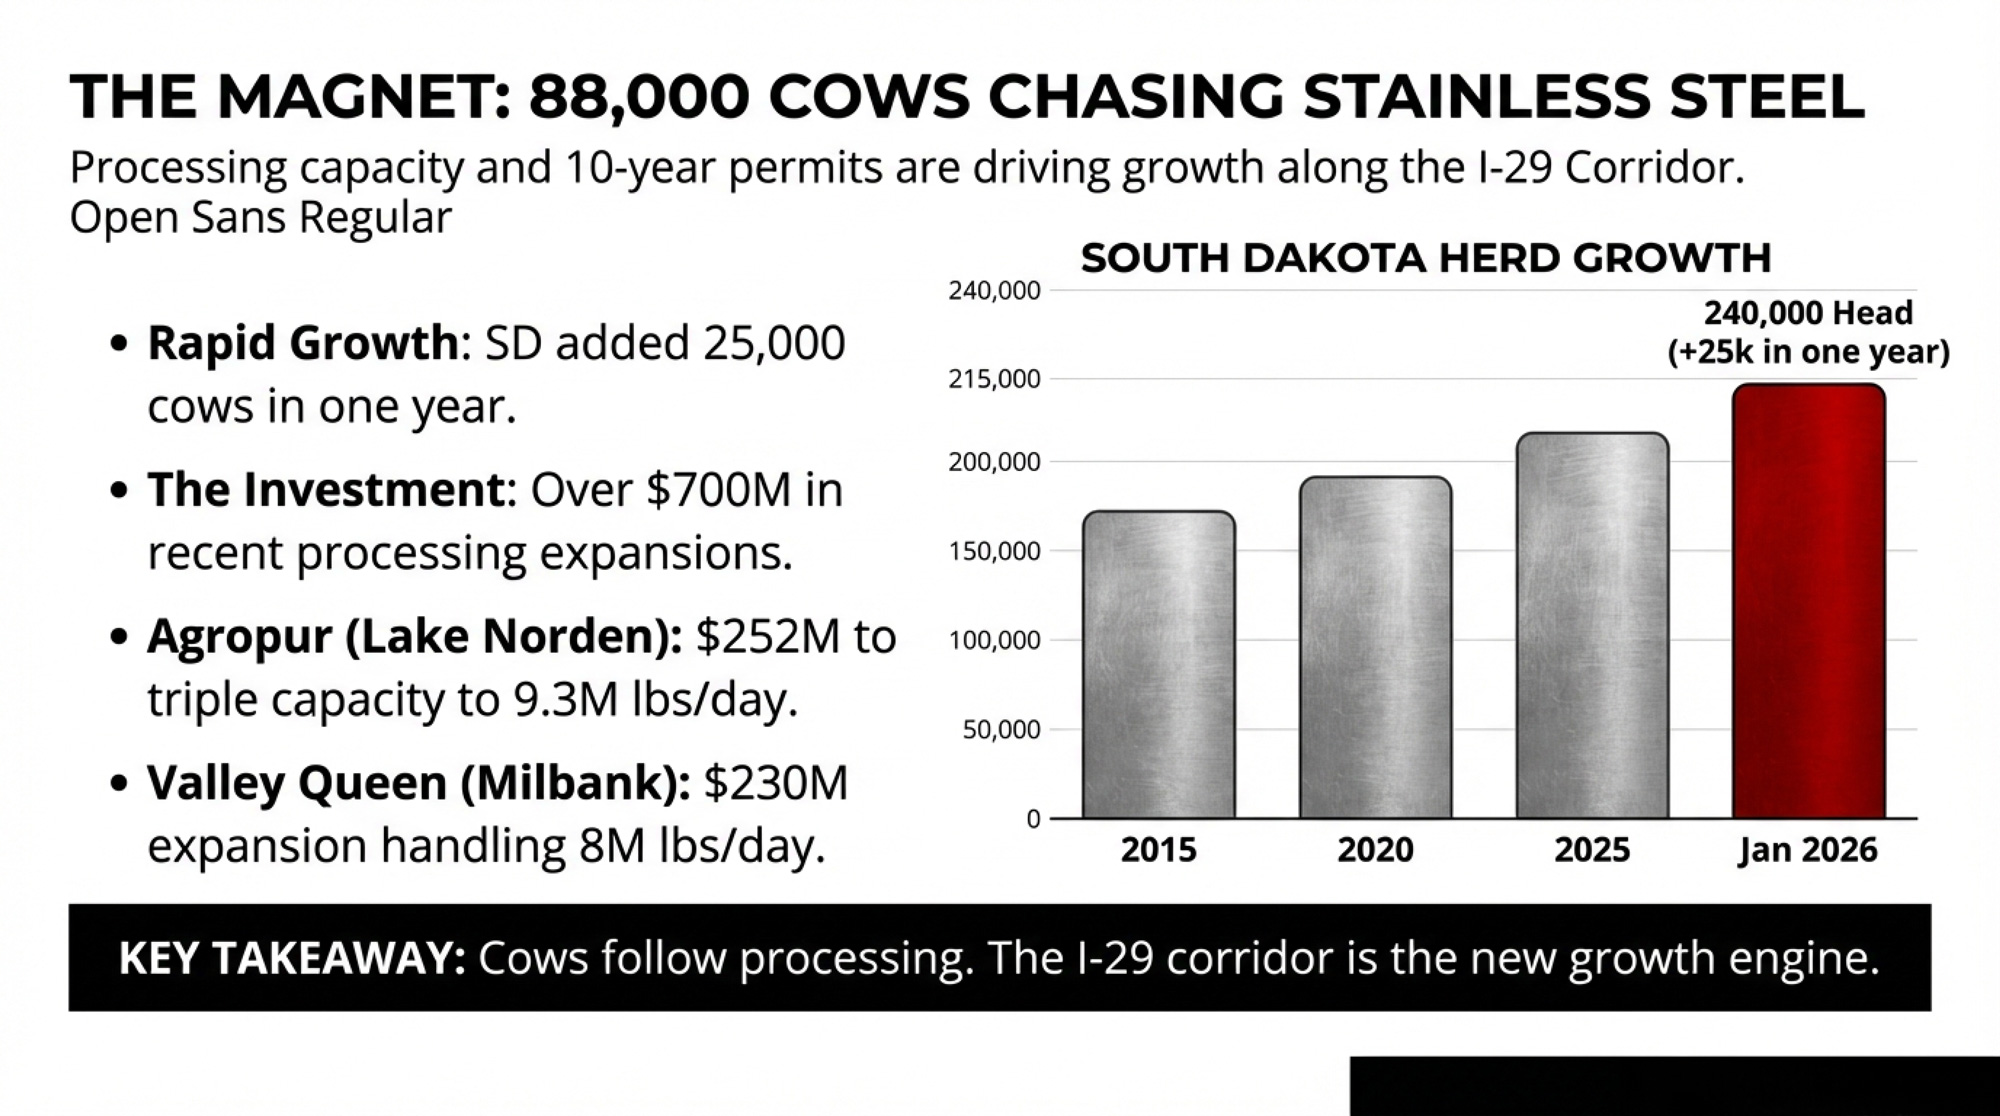
Three processor expansions tell the story. Agropur invested $252 million to nearly triple capacity at its Lake Norden, South Dakota, plant, going from 3.3 million to 9.3 million pounds of milk per day. Valley Queen Cheese in Milbank broke ground on what was originally announced in 2022 as a $195 million expansion, its largest in 93 years. That project came in at $230 million and by late 2025 was handling 8 million pounds of milk daily. Bel Brands launched its Brookings facility, adding still more demand.
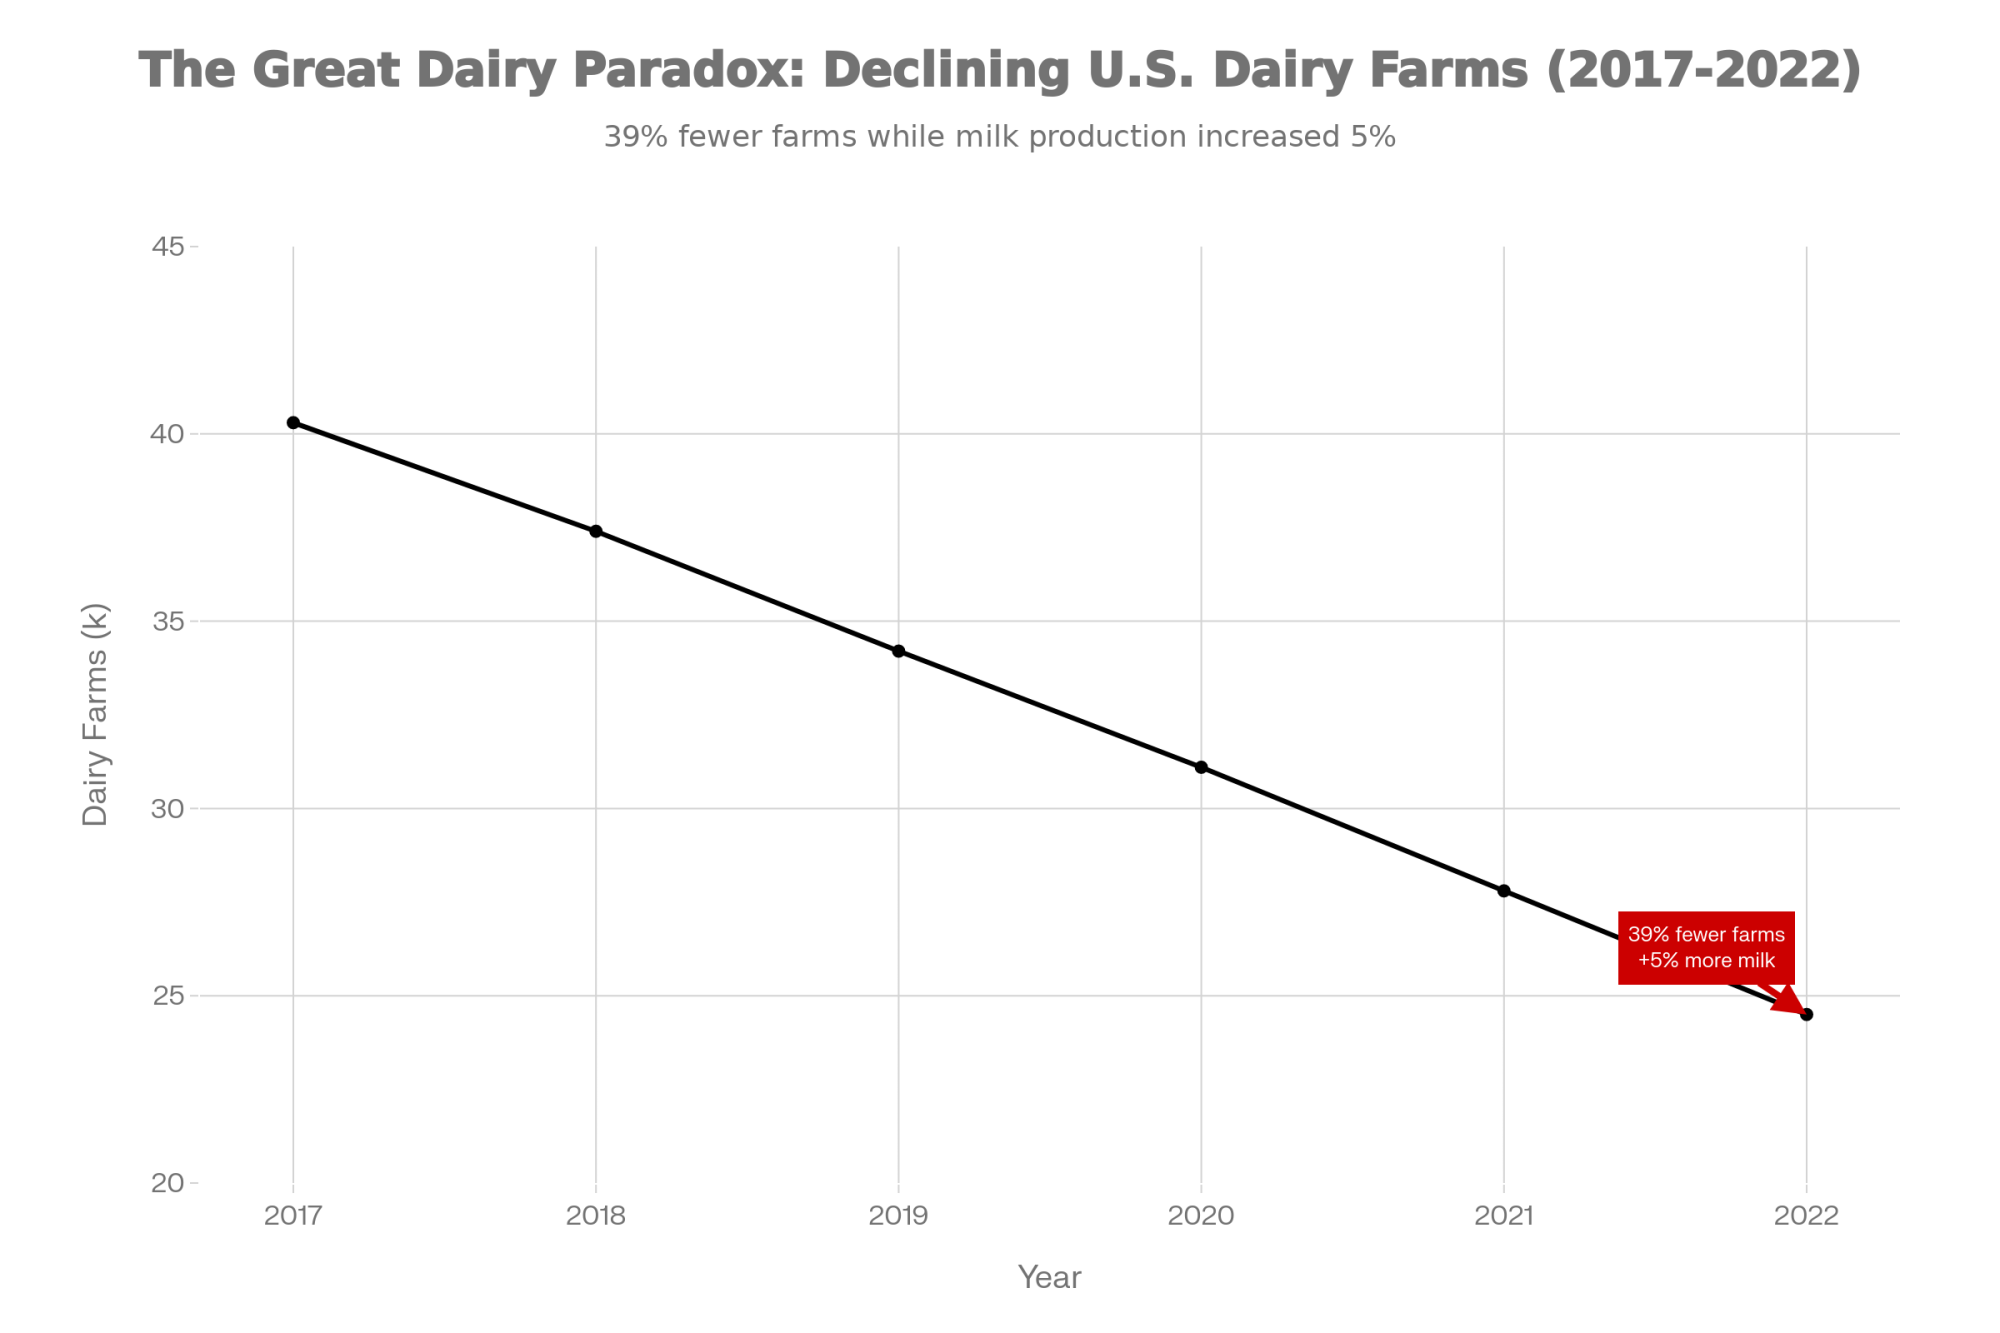
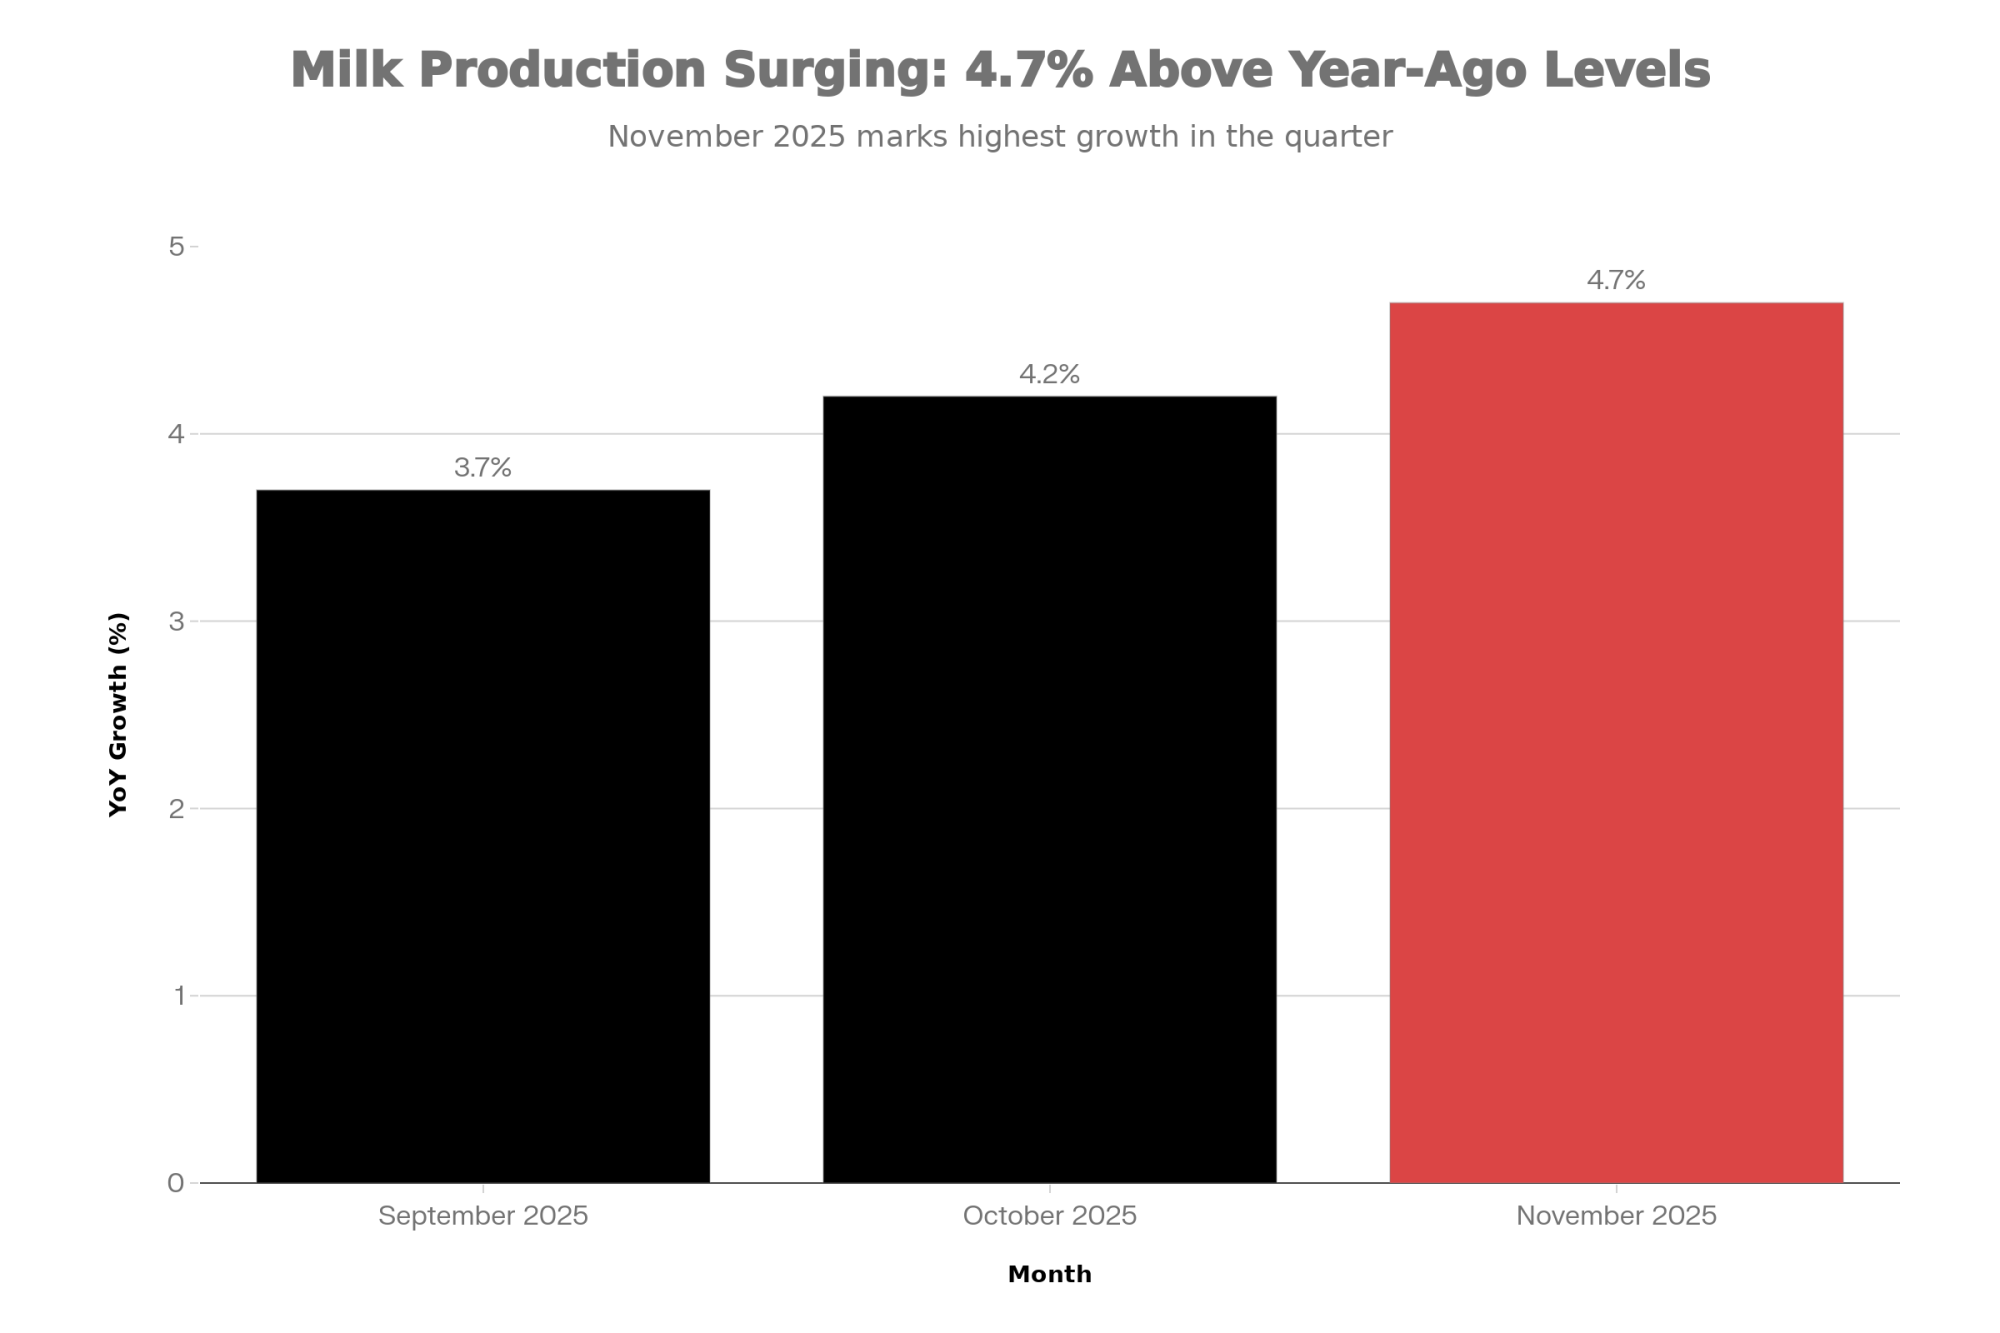
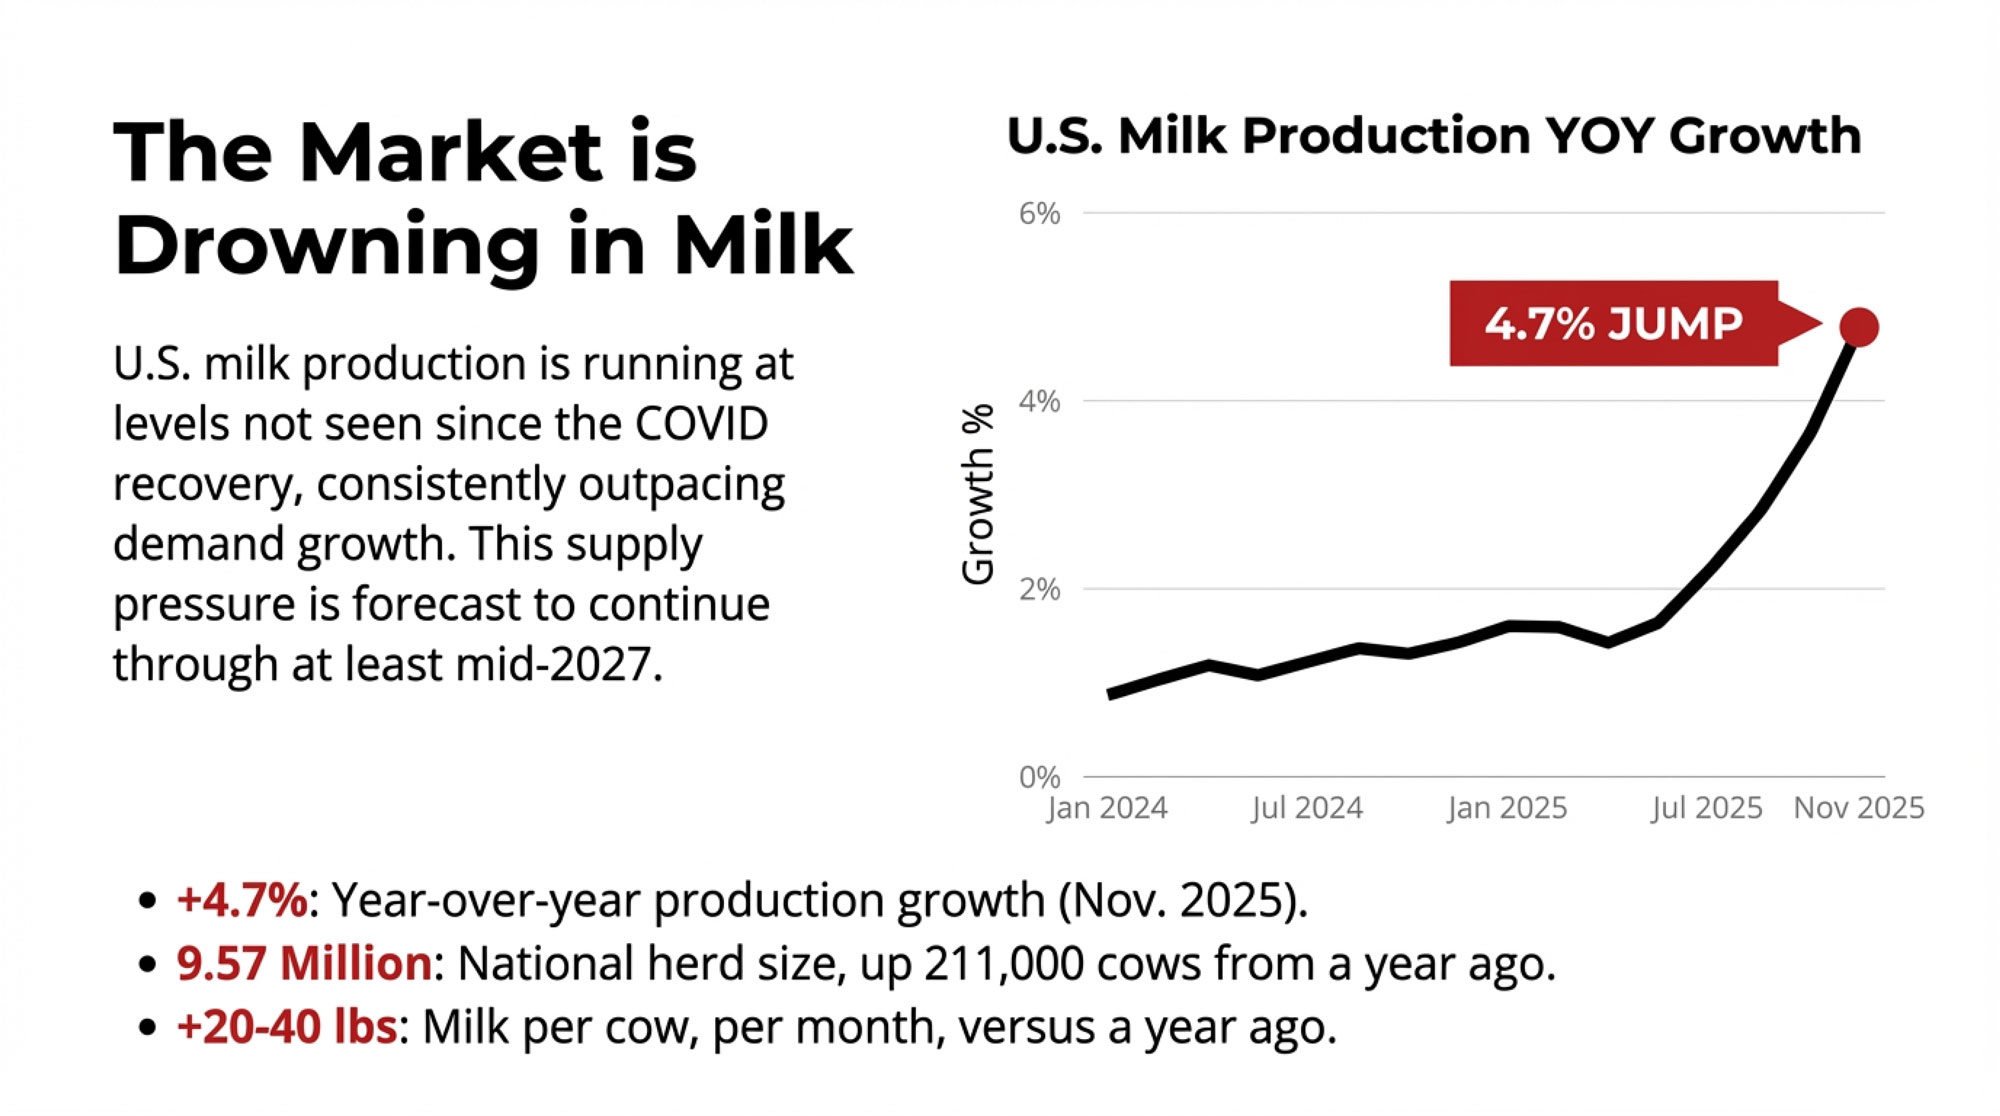
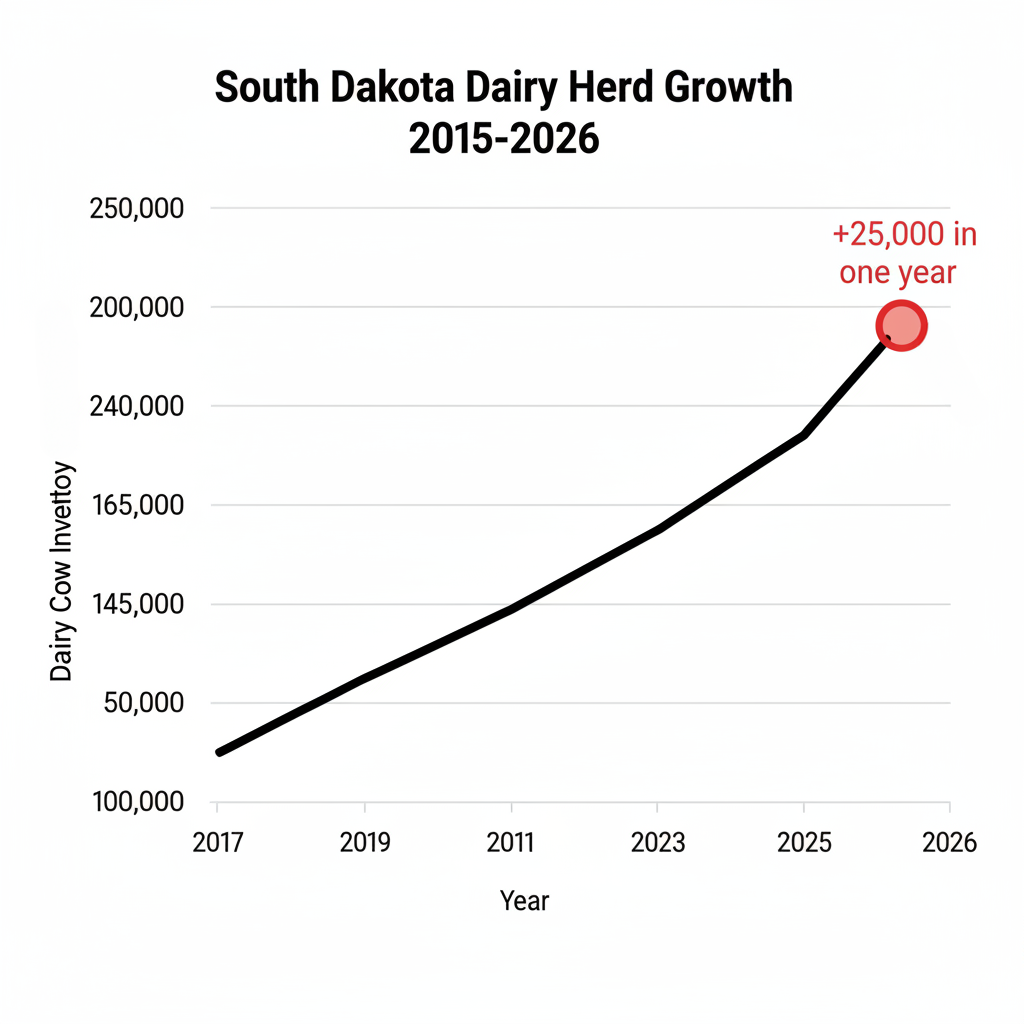
The cows came — fast. South Dakota’s milk cow population reached 215,000 as of January 1, 2025 — more than doubling in a decade, a gain of 117% that leads the nation. Some 88,000 of those cows arrived in just five years, a 69% jump. Then it kept going. USDA NASS confirms the state’s dairy herd reached 240,000 head as of January 1, 2026 — exactly the 25,000 additional cows Valley Queen’s Evan Grong had projected. South Dakota’s December 2025 milk production ran more than 11% above the prior year, the biggest increase among the 24 major dairy states — in a national herd of 9.57 million, South Dakota punched well above its weight.
Tom Peterson, executive director of South Dakota Dairy Producers, describes a deliberate effort: “About 20 years ago, South Dakota leaders and stakeholders came together with farmers and milk processors to develop a plan to not only ensure dairy industry survival in the state, but with aspirations of creating a dairy destination”. GOED Commissioner Chris Schilken estimated in early 2024 that the economic impact of 118,000 additional cows was “nearly $4 billion annually”. With 25,000 more since then, that number has only climbed.
A Genetics Gap Is Emerging
Here’s a dimension of this migration that gets overlooked: the cows moving east aren’t just changing zip codes. They’re changing what gets selected for.
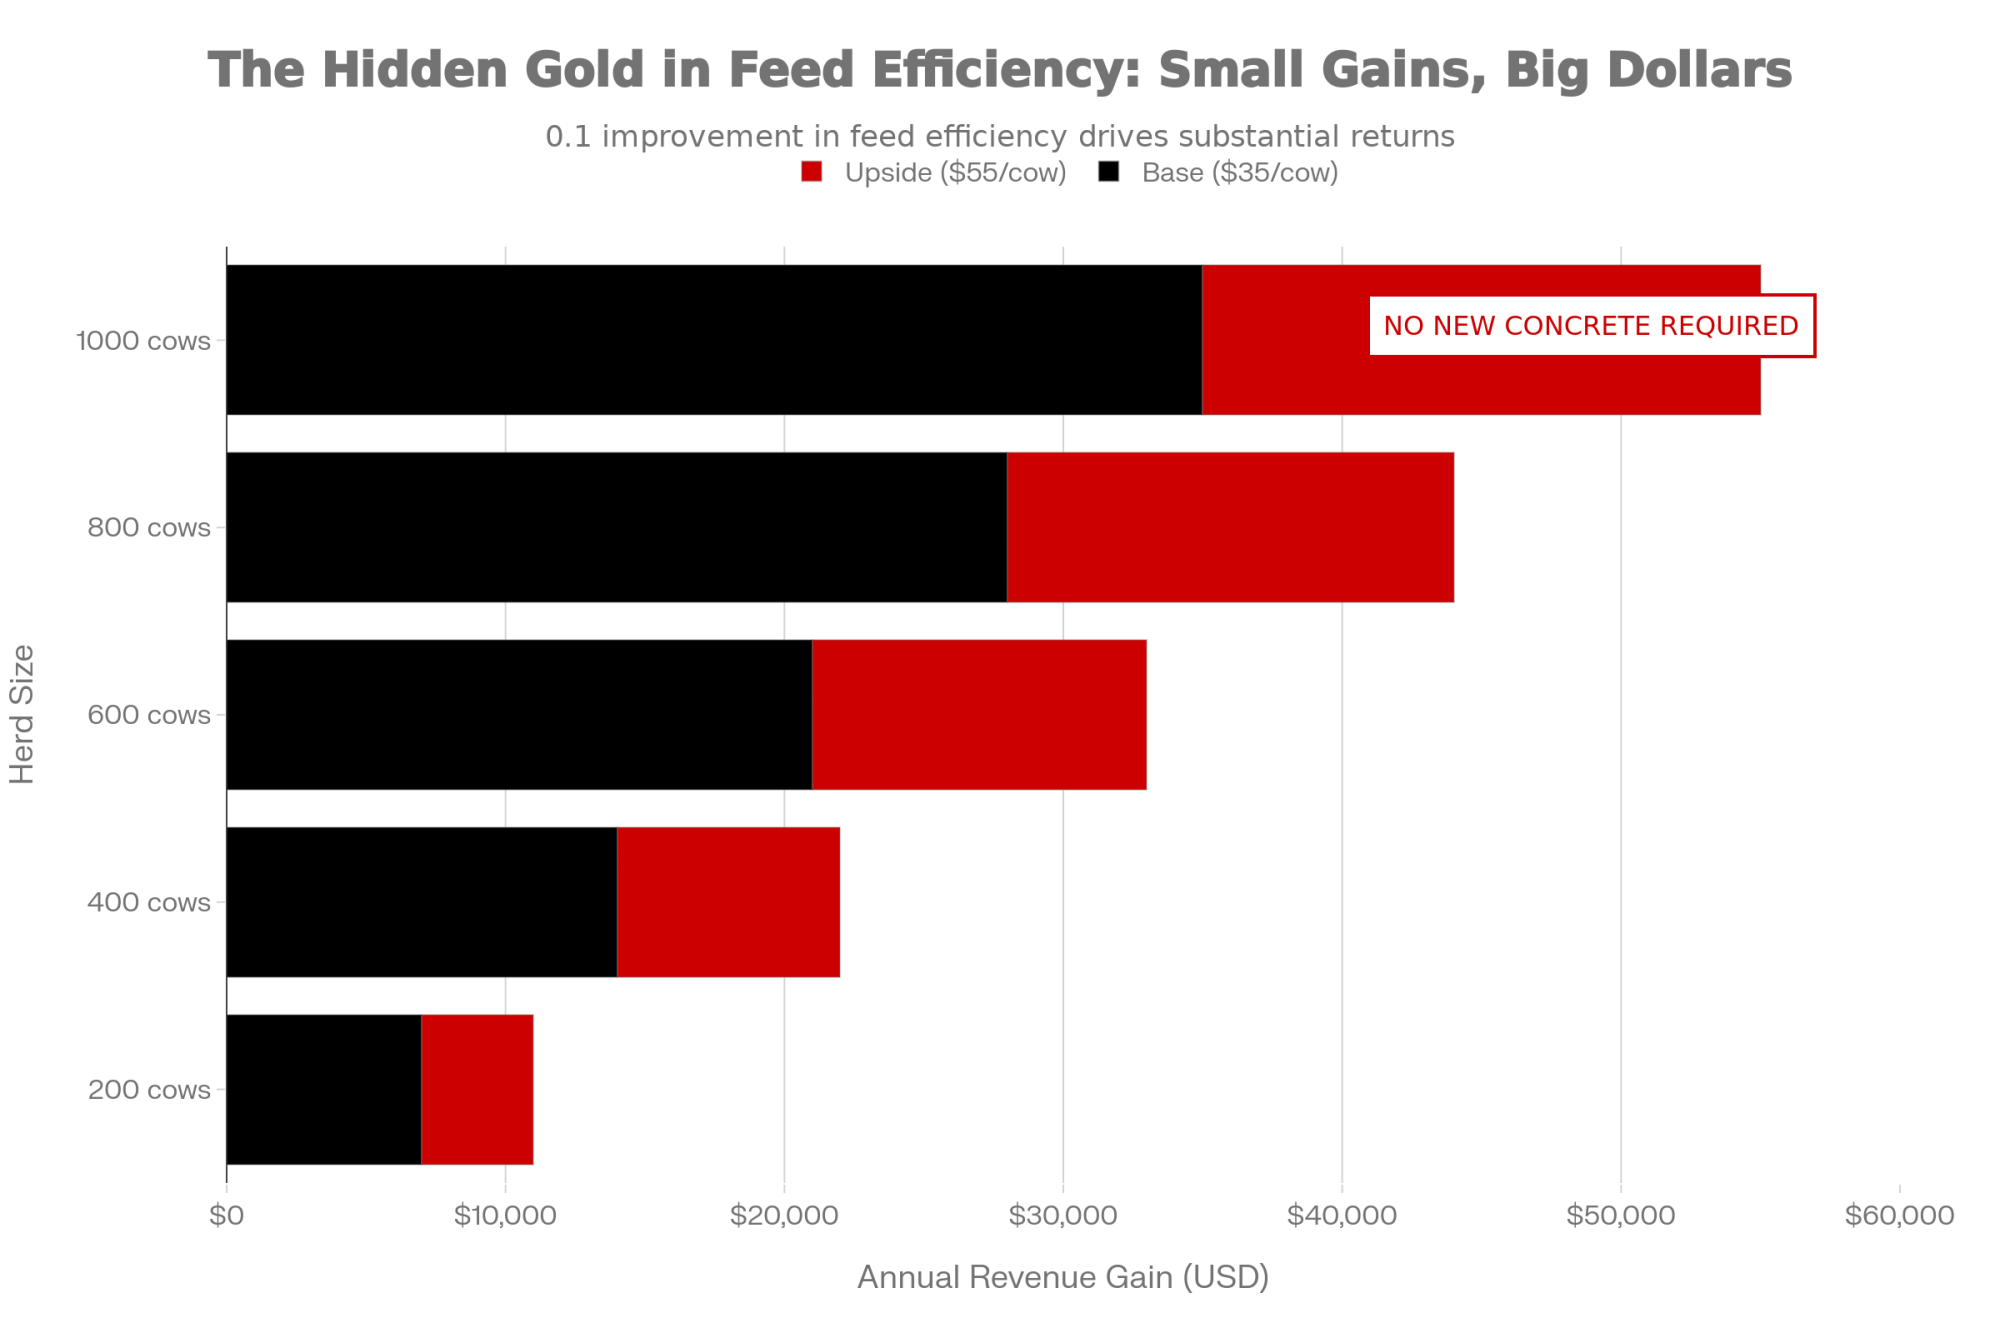
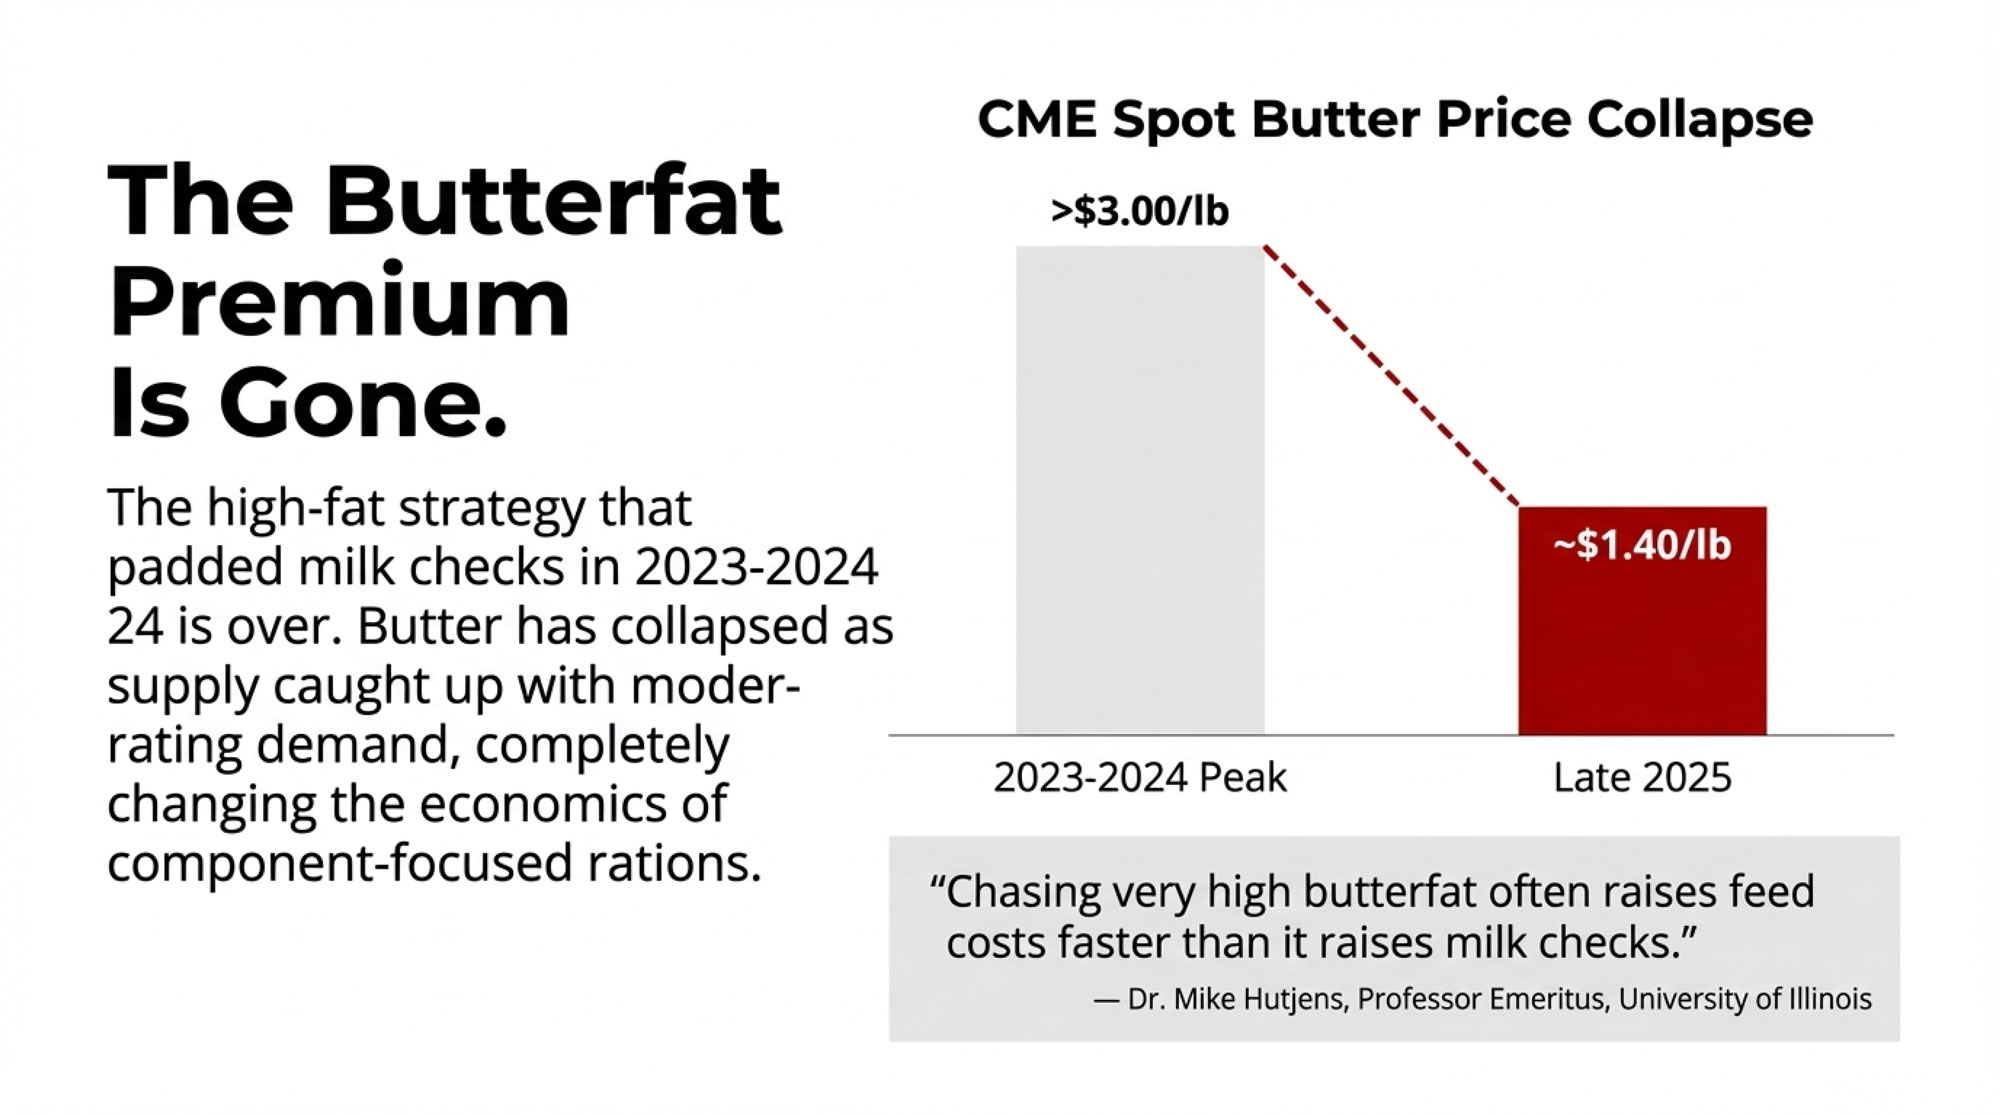
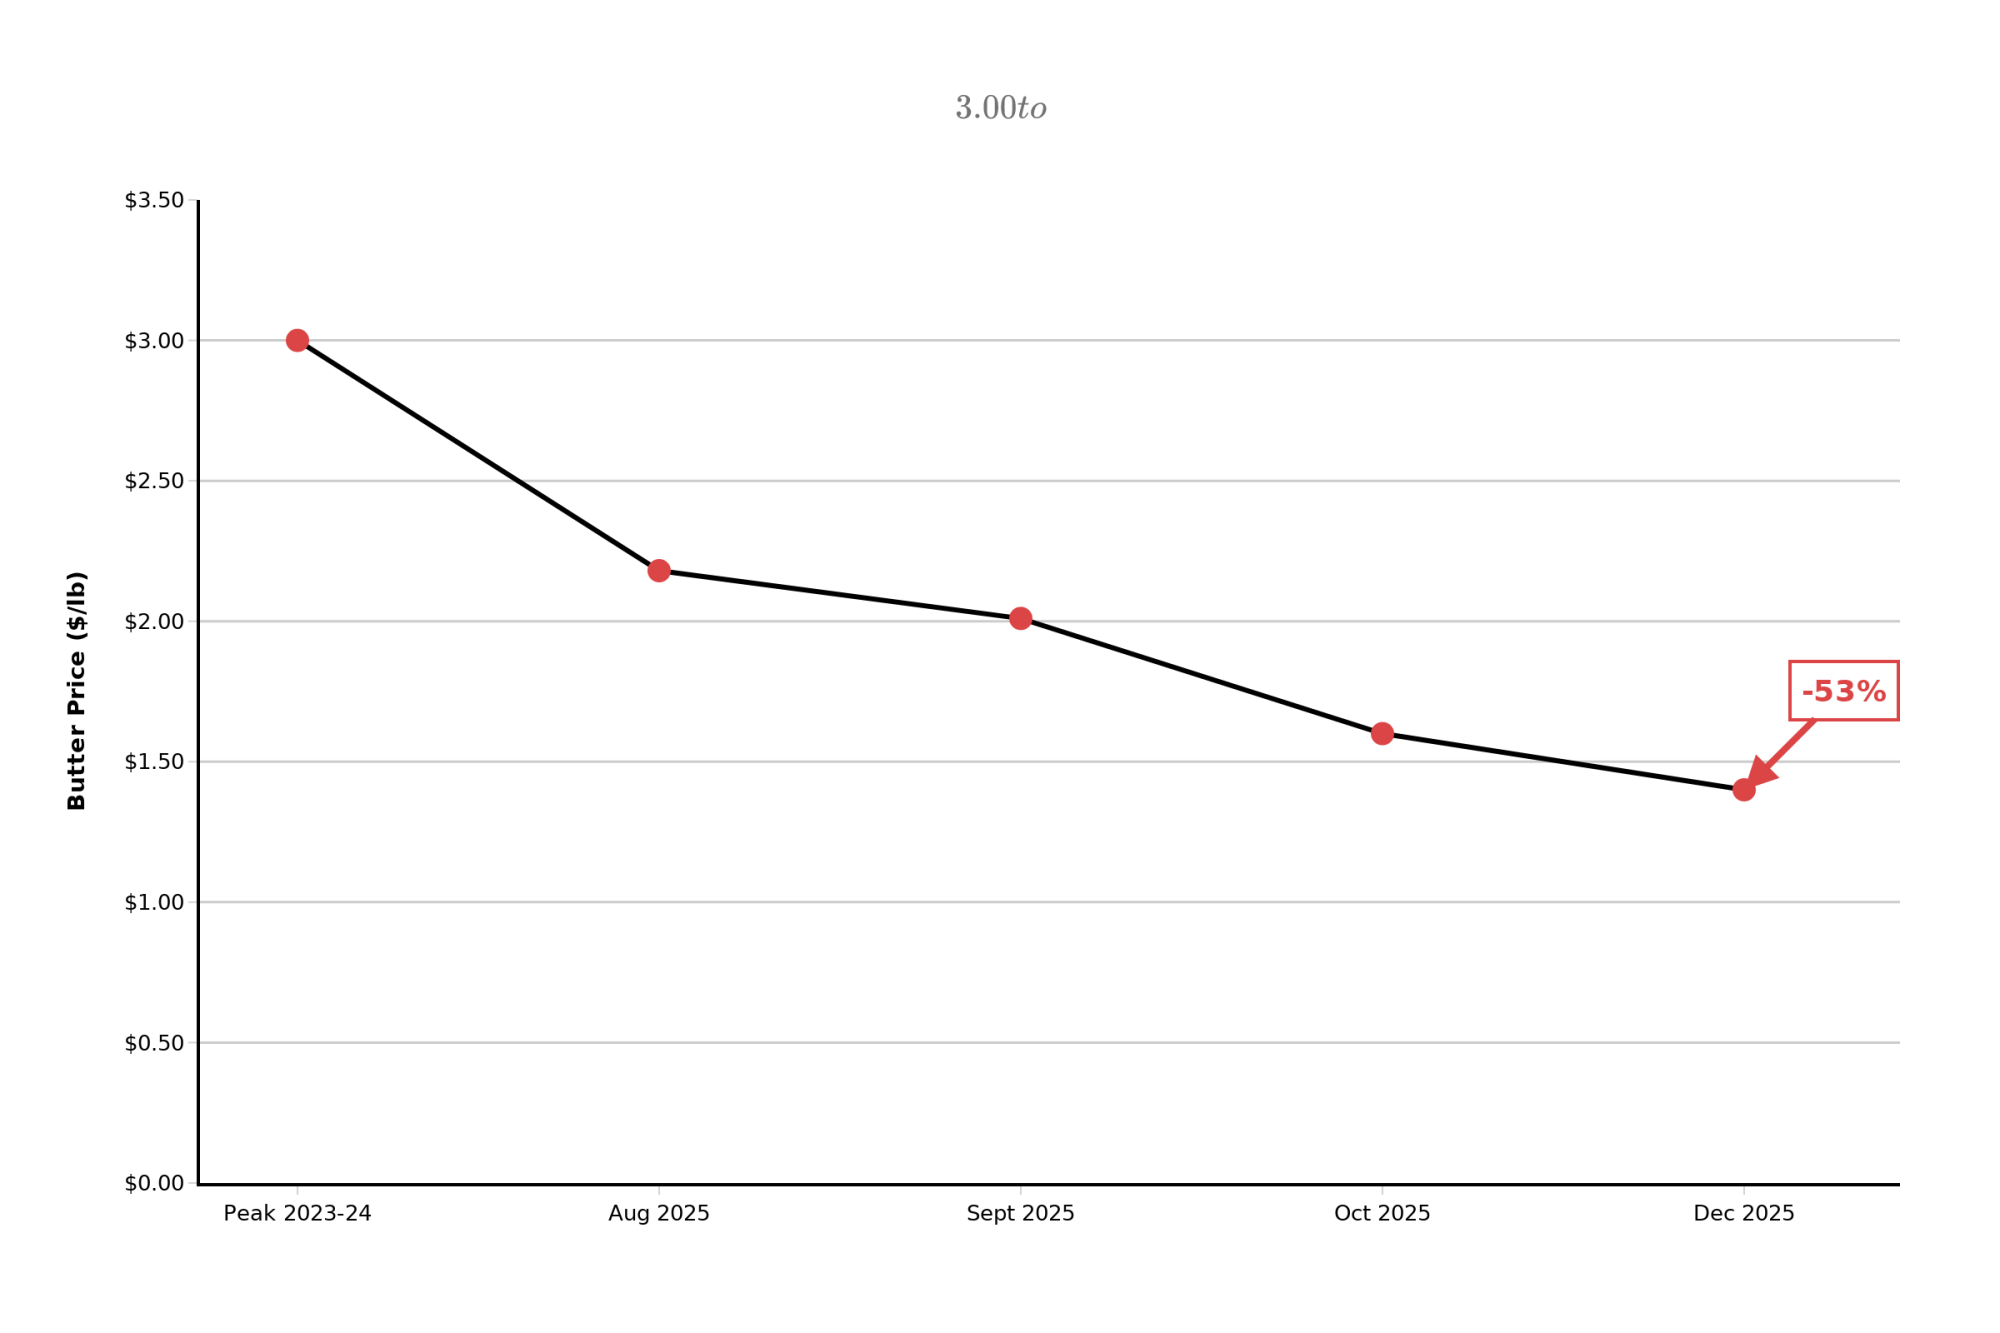
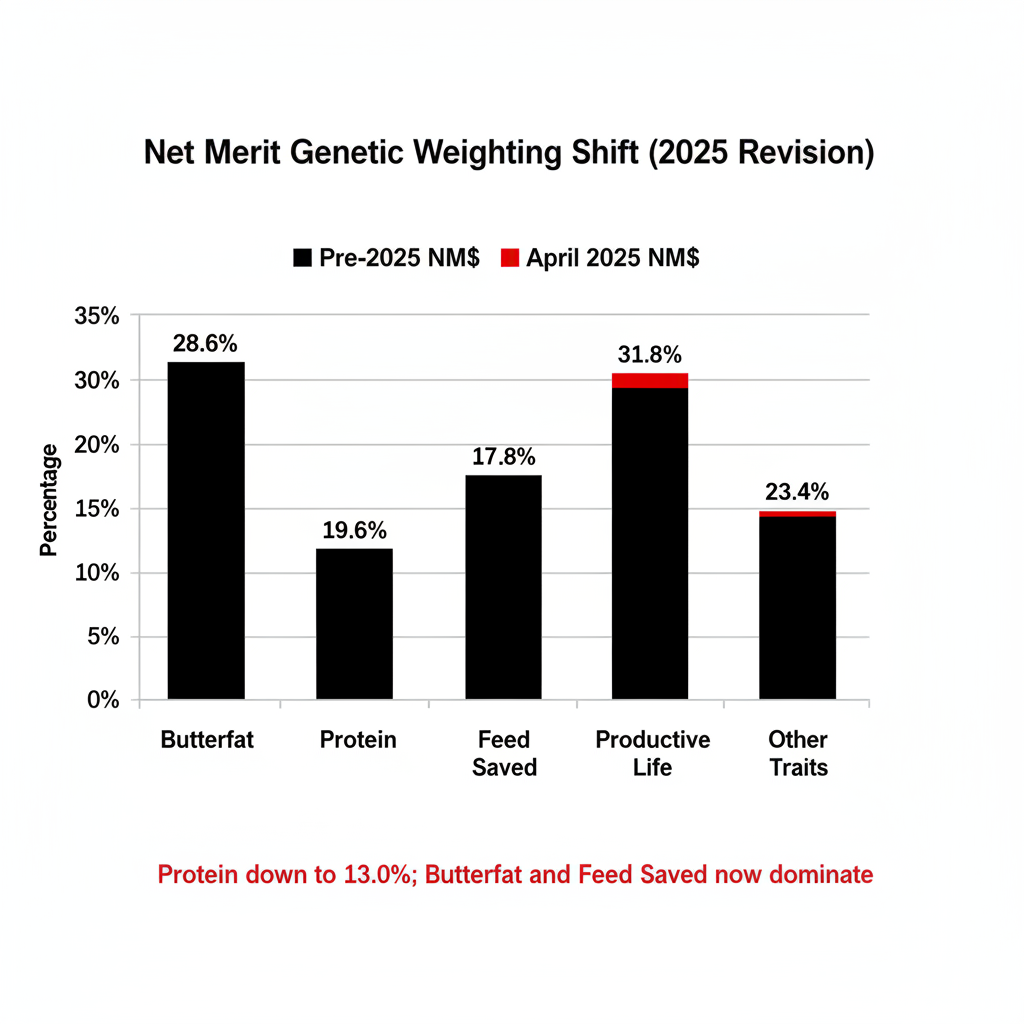
The Upper Midwest model is built around cheese vats. Valley Queen, Agropur, Bel Brands: component-driven processors. That means the genetics flowing into the I-29 corridor increasingly prioritize high-butterfat, high-component cattle that fit Cheese Merit profiles — and component pricing rewards them for it. The April 2025 Net Merit revision tells the same story nationally: CDCB bumped butterfat emphasis to 31.8% (up from 28.6%) while dropping protein from 19.6% to 13.0%, and pushed Feed Saved to 17.8%. Holstein butterfat hit a national average of 4.23% in 2024, per CoBank’s Corey Geiger. Under the revised NM$ weightings, a cow with top-decile butterfat and Feed Saved genetics delivers meaningfully more lifetime profit than a volume-only counterpart — the exact dollar advantage varies by herd and market, but the directional shift is unmistakable.
For I‑29 shippers, CM$ often beats NM$ as your main index, because plants like Valley Queen and Agropur pay you on components, not volume.
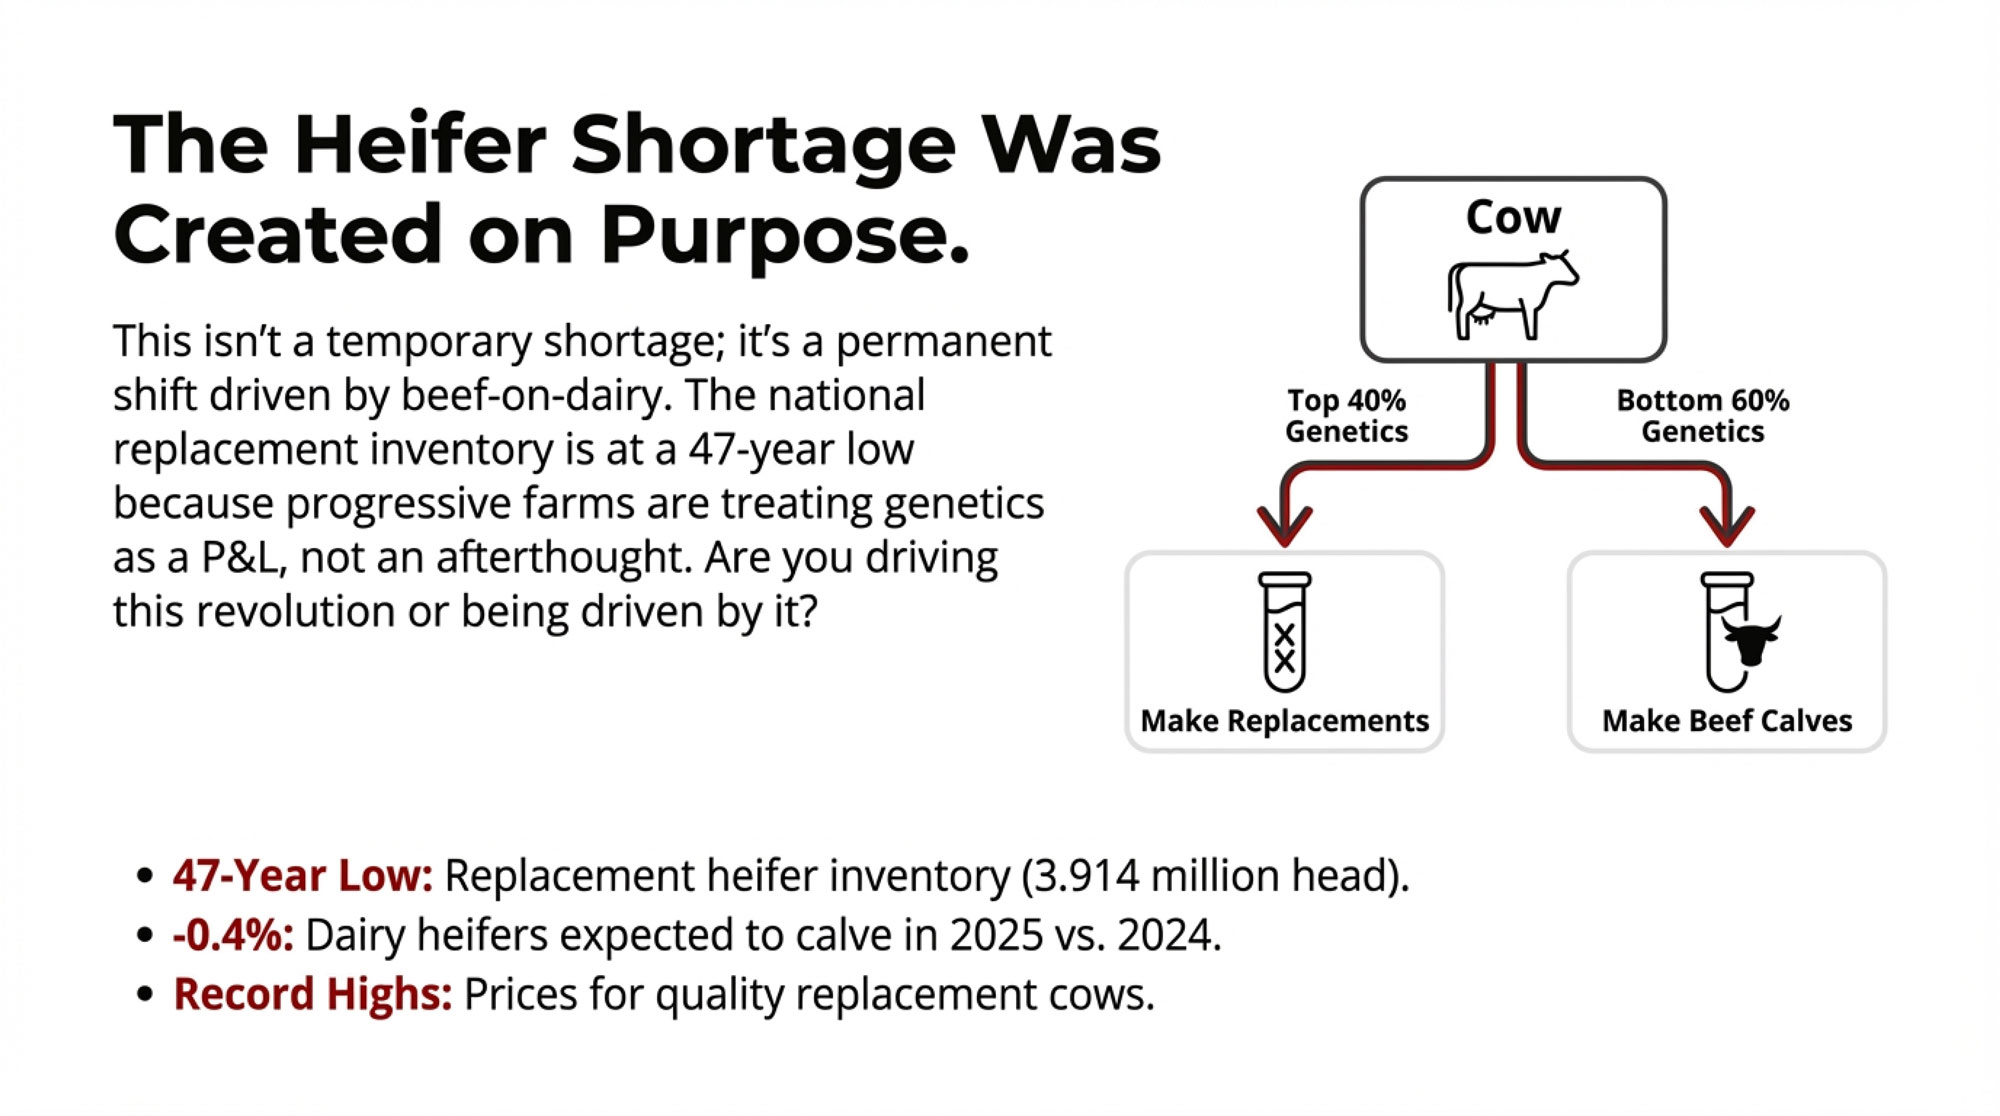
The Western model may need a different genetic profile entirely. Jared Fernandes at Legacy Ranches in Tulare County made that call: he switched from Holsteins to Jerseys, cutting forage consumption by 30% and reducing water use on a 4,500-cow operation facing tight water supplies. In Merced County, Simon Vander Woude took a different approach: genomic testing since 2012, beef-on-dairy crosses on 60% of calvings, cull rate around 30%, and average lactations pushed to 2.7 — up from 2.2 when he started. “We are creating more milk with fewer cows, more components in the milk with fewer cows,” Vander Woude said. “That’s fewer mouths eating, fewer heifers”.
Dairy Migration: Two Systems, Two Sets of Friction
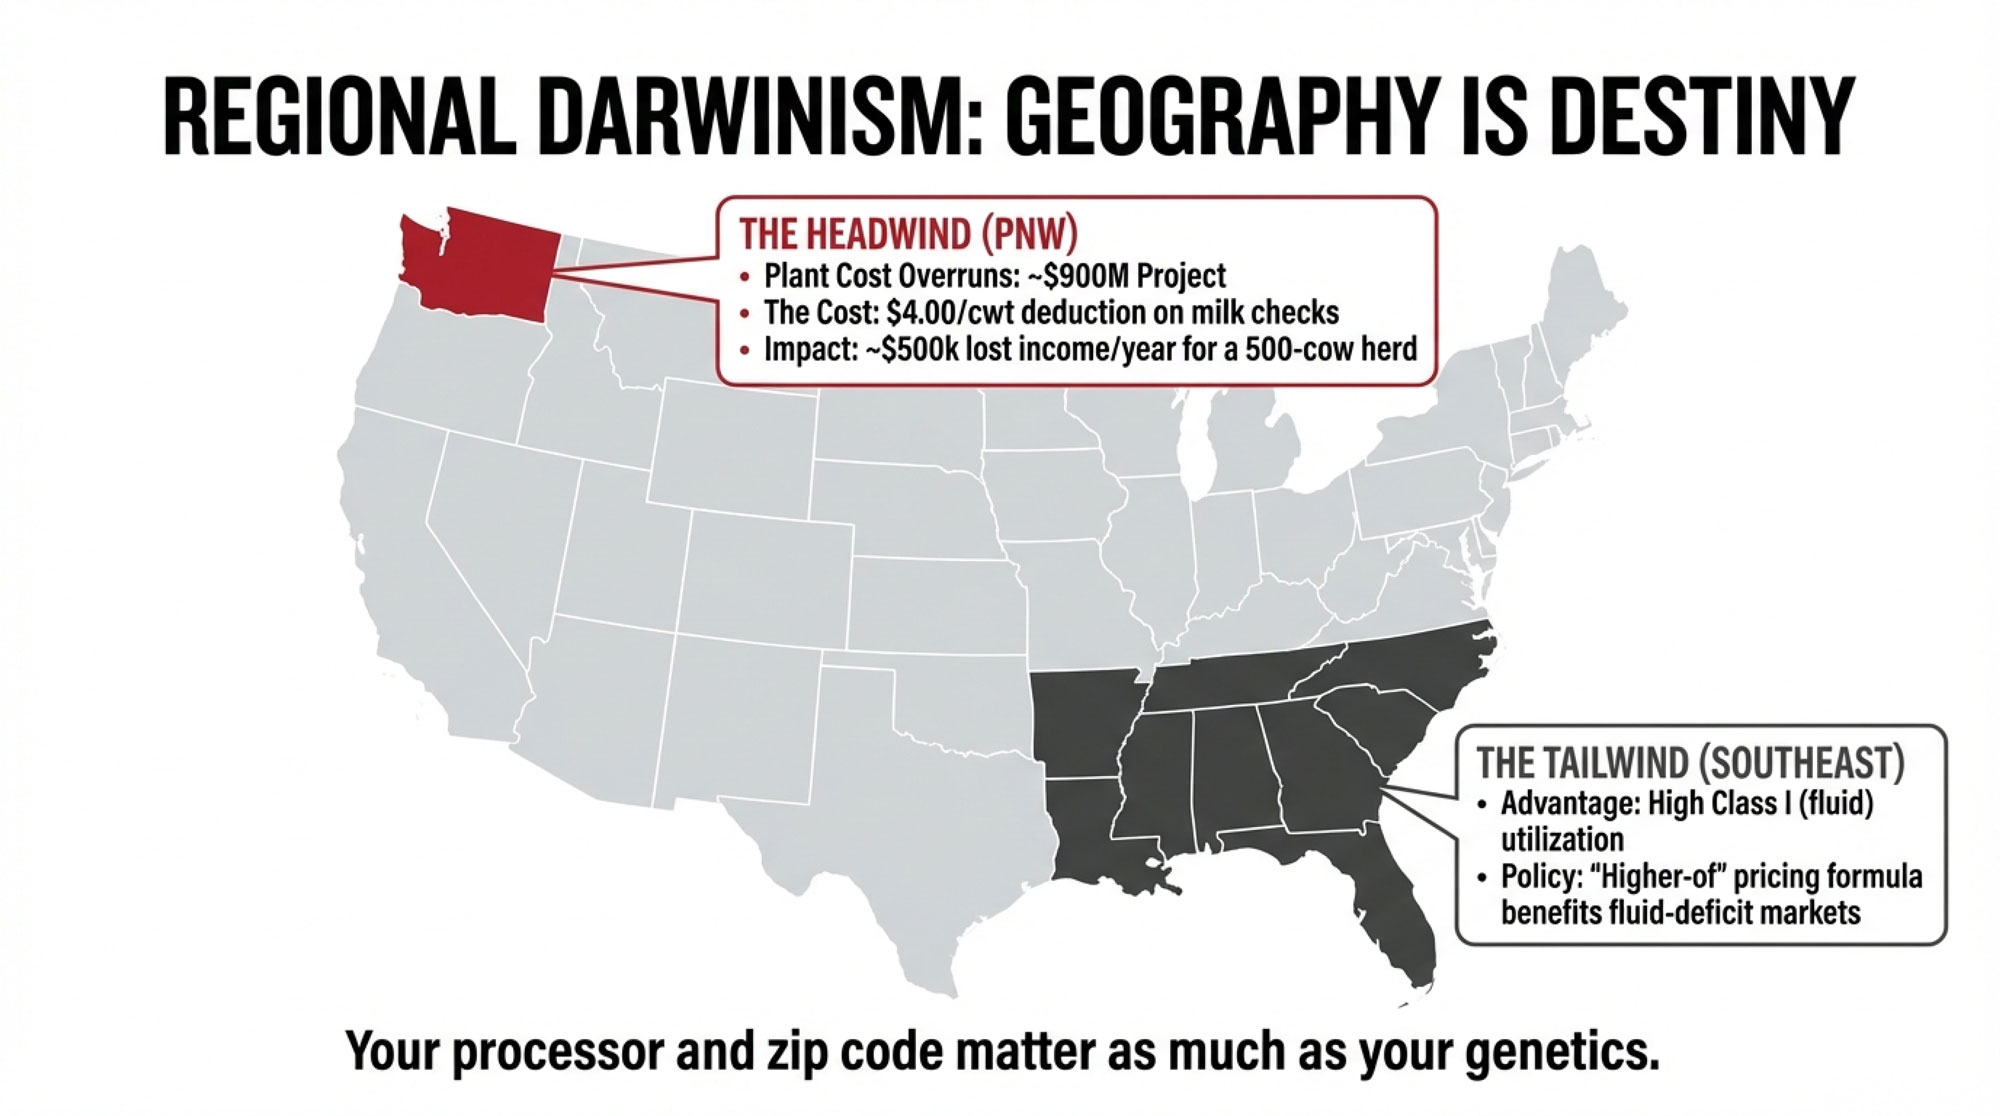
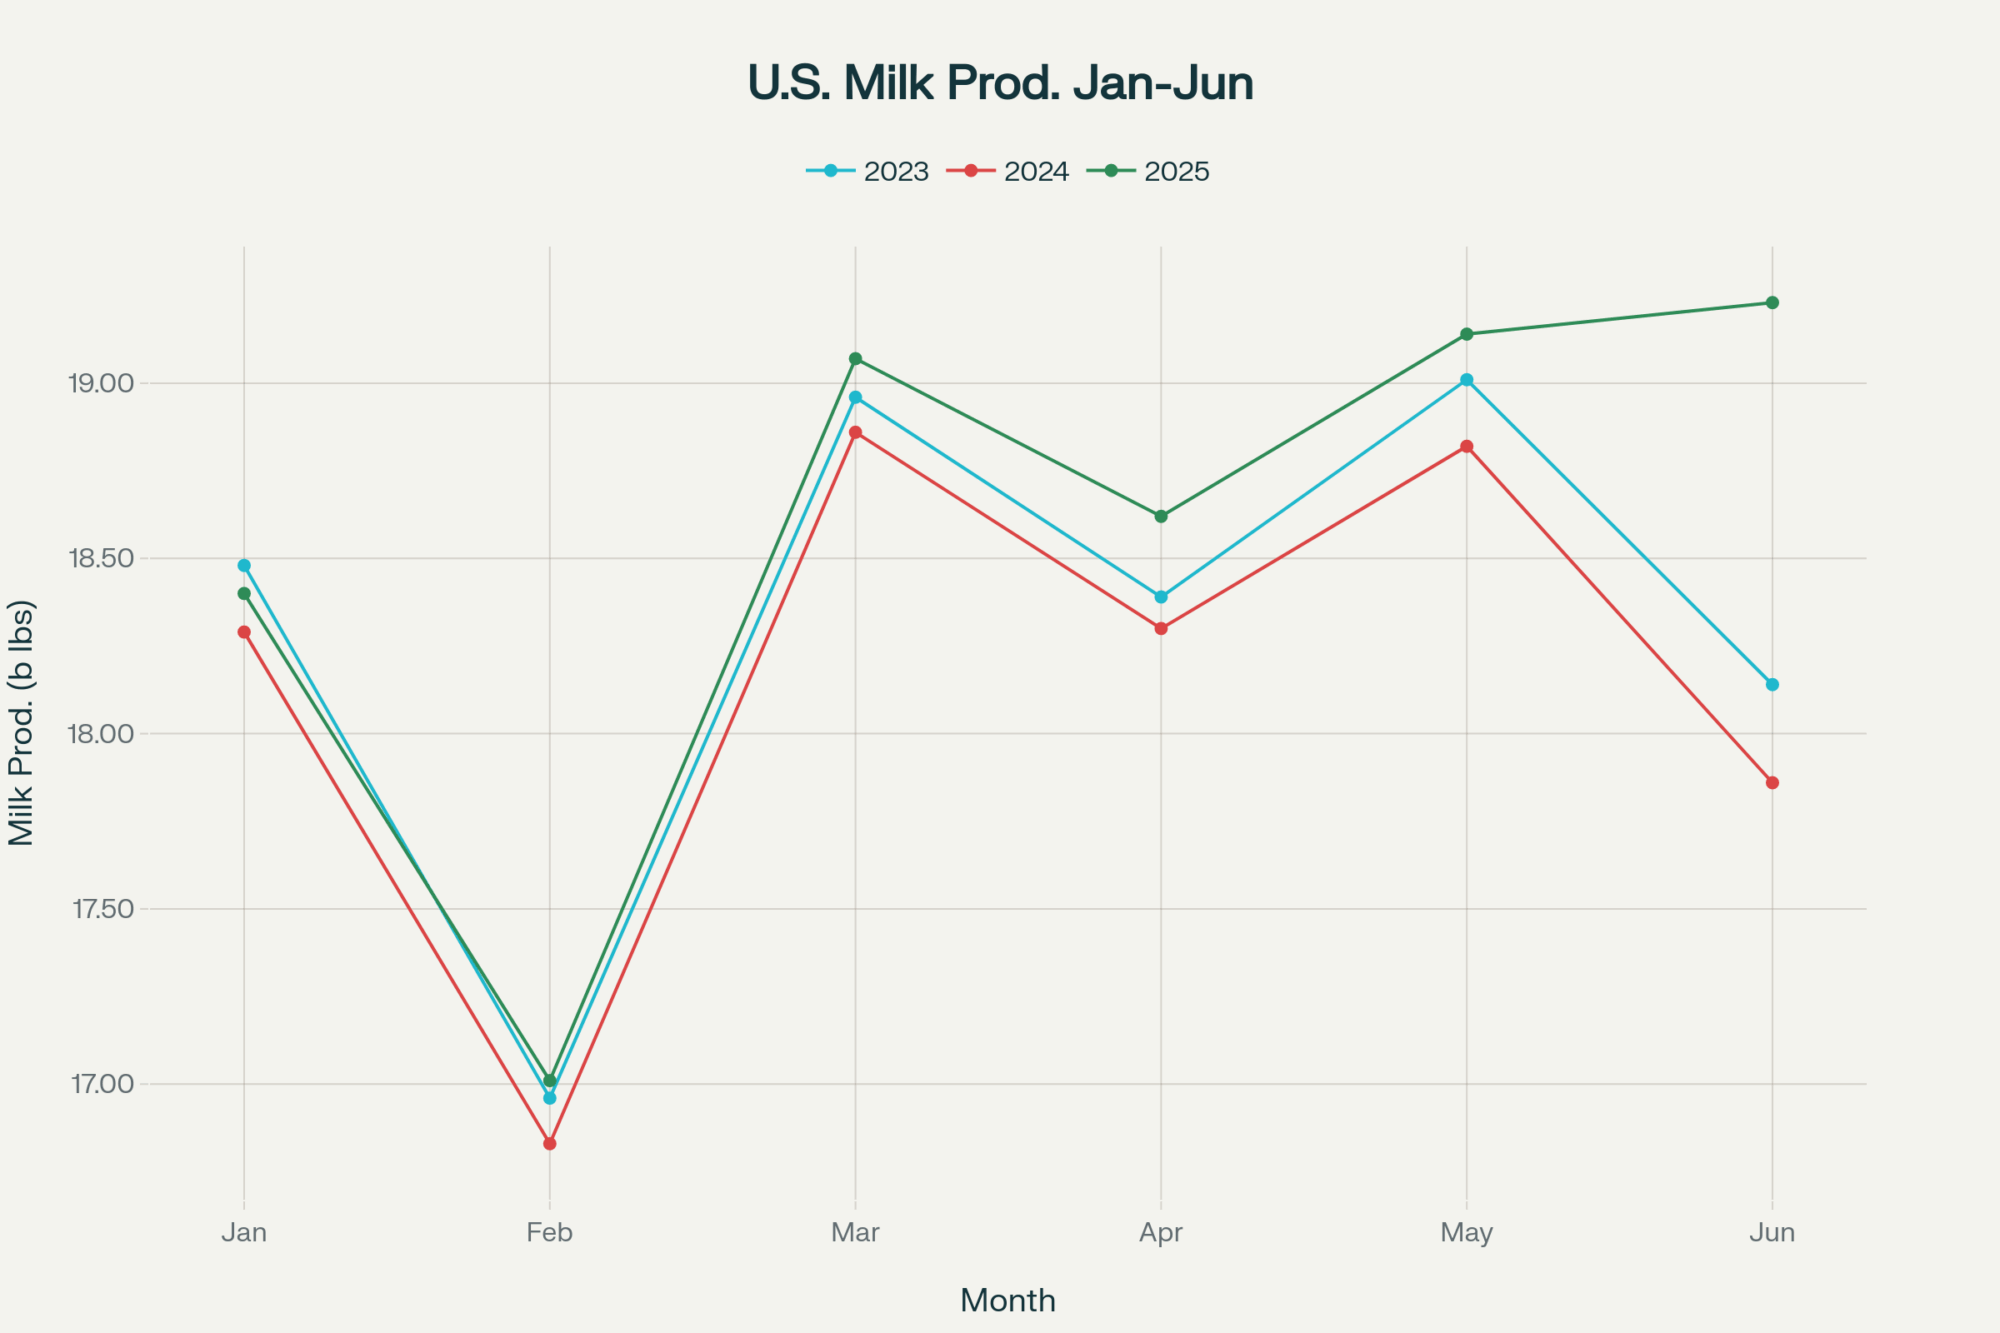
California’s December 2024 milk production fell 6.8% year over year — the state’s steepest monthly drop in roughly 20 years, heavily amplified by HPAI, which hit 747 of approximately 950 dairy farms. California recovered by mid-2025 — production up 2.7% in June versus 2024 —, but the episode exposed structural vulnerabilities that predate the outbreak. Idaho’s Rick Naerebout reported the cost of production “above $18.50 per hundredweight and still around $20 for many.” Oregon’s John Van Dam: “staying above water but not going anywhere”.
| Upper Midwest (I-29 Corridor) | Western U.S. (CA, ID, OR, WA) | |
| CAFO Permits | 10-year state permits (SD DANR) | 5-year federal NPDES cycle; annual state layers |
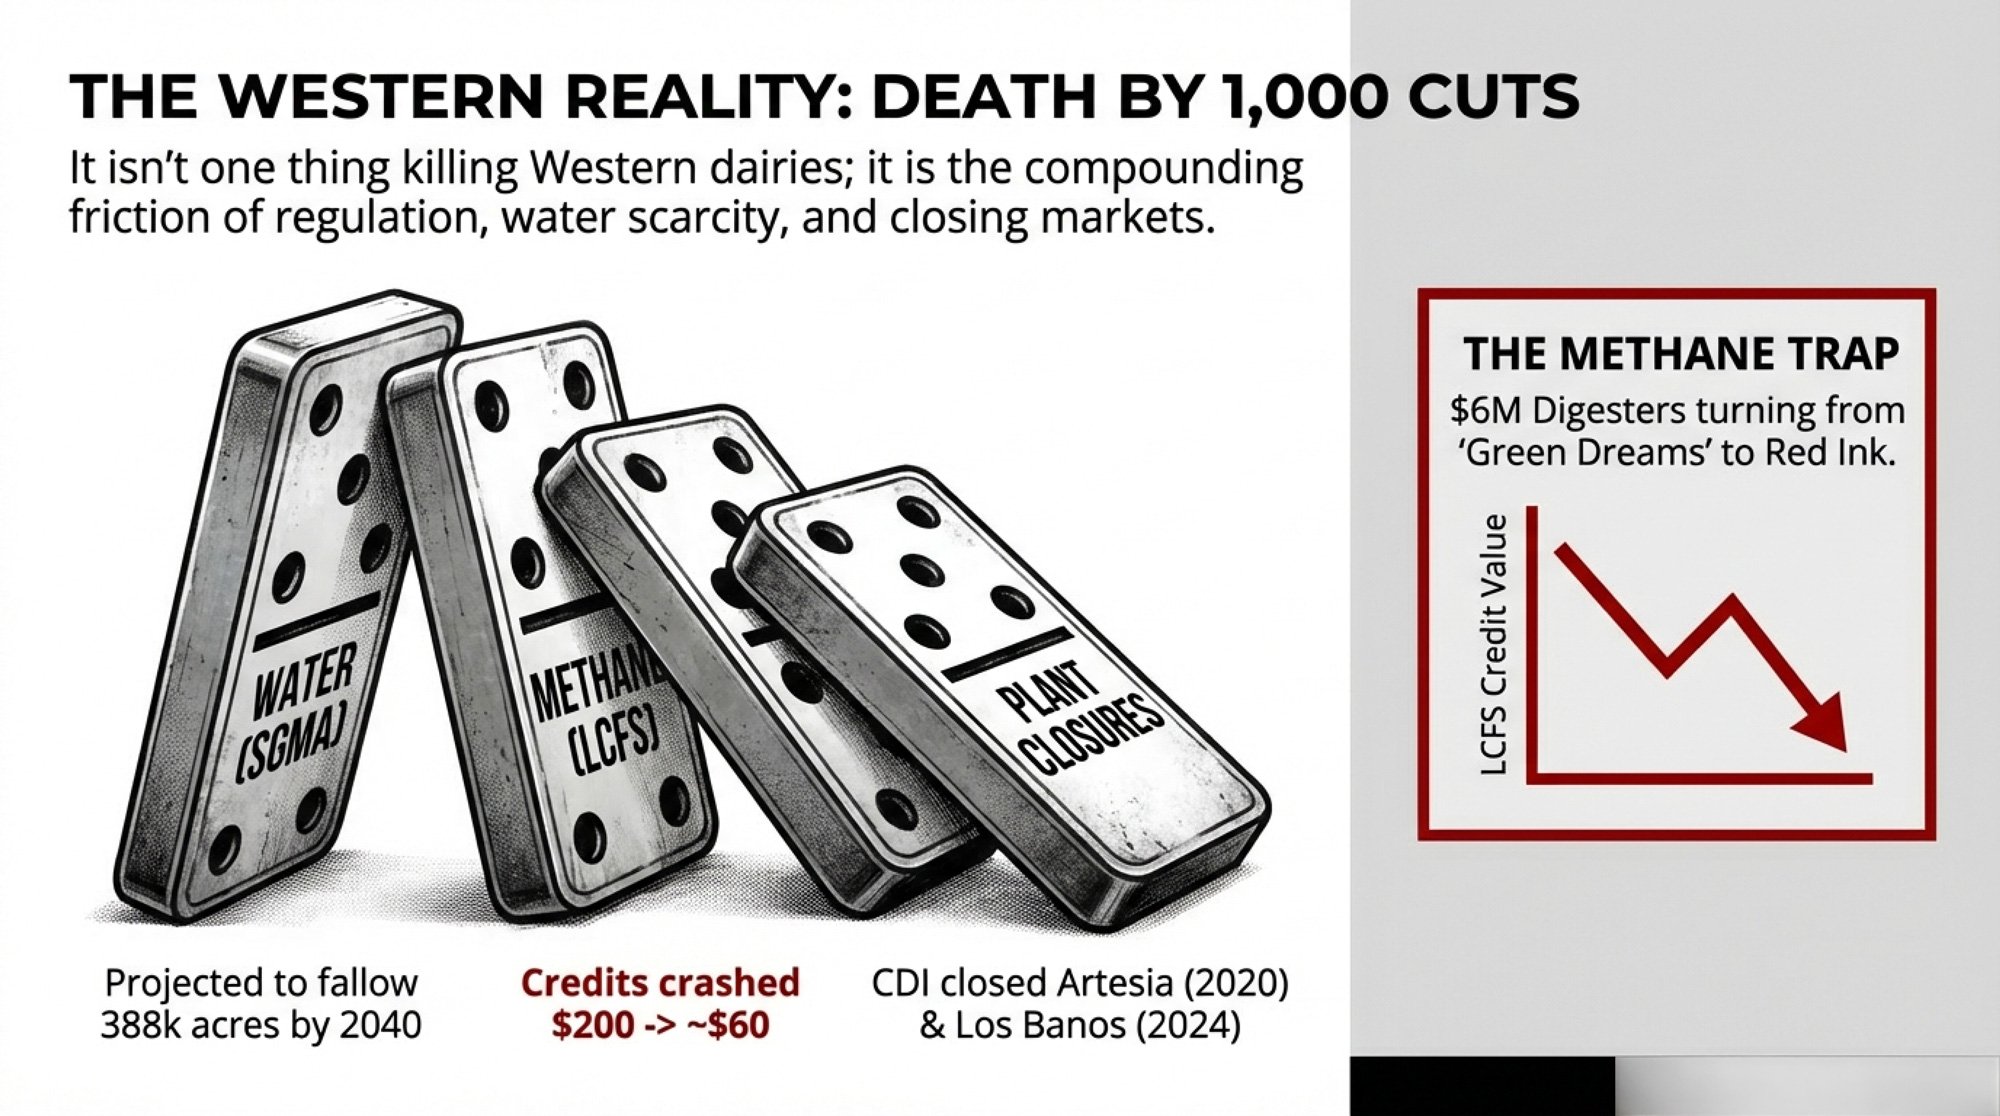
| Processing | $700M+ invested 2019–2025; coordinated with cow growth | CDI closed Artesia (2020) and Los Banos (Oct. 2024) — two plants in four years |
| Water | Abundant groundwater; no pumping restrictions | SGMA projected to fallow 388,000 acres, cut dairy output $2.2B by 2040 |
| Methane Rules | Minimal state mandates | $300–$675M/year in projected losses under direct regulation |
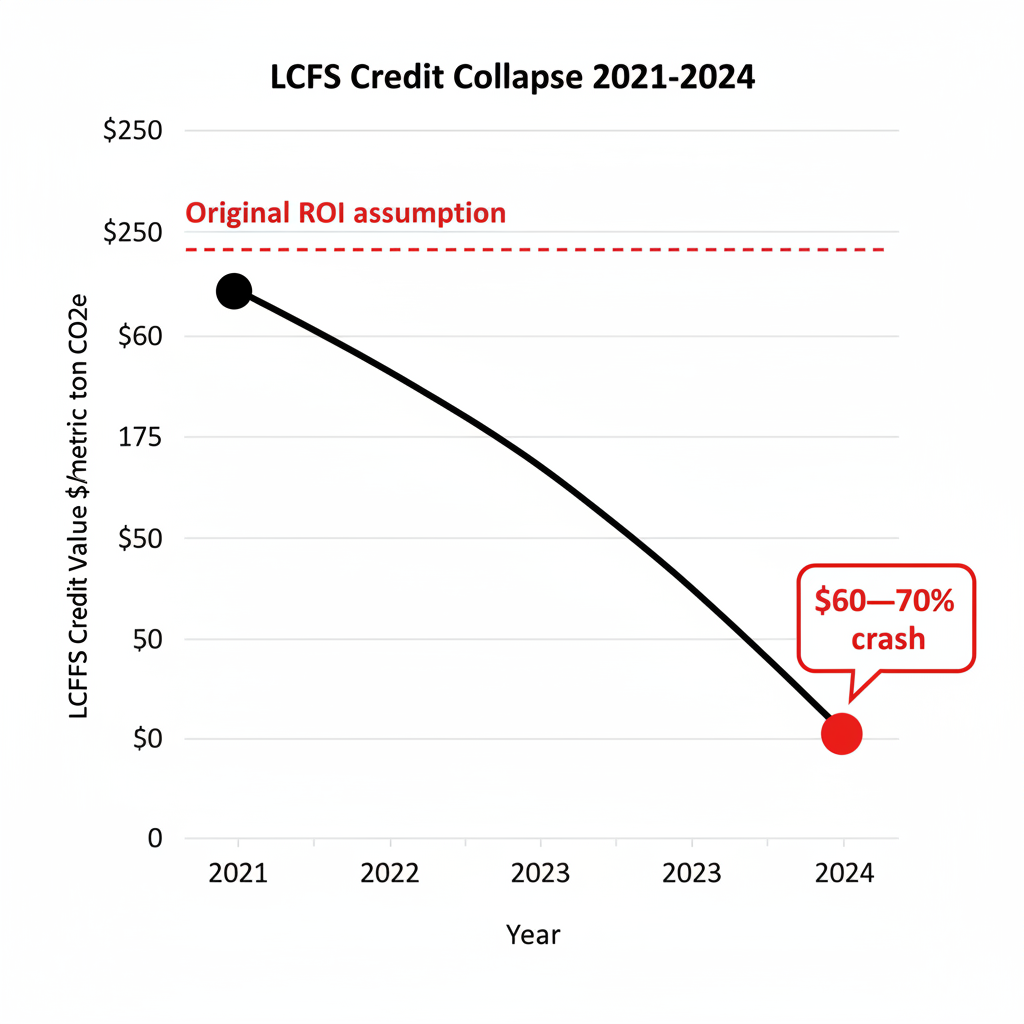
| Digester Economics | N/A (not required) | $6M+ per unit; LCFS credits crashed from $200 to ~$60/MT (2021–2024) |
| Labor | Standard ag labor rules | CA/WA: highest minimum wages + ag overtime mandates |
| Legislative | Pro-dairy incentive programs (GOED) | 25 anti-dairy bills killed cumulatively through 2023 |
| Genetics | Component-driven (CM$); fits cheese processing | Under pressure to shift — Fernandes (Jersey pivot) and Vander Woude (genomic efficiency) lead |
The LCFS column deserves a closer look. Digester construction averages over $6 million per unit. Those investments were supposed to pencil on strong carbon credit revenue. Instead, the green dream turned into a red-ink reality for many Western digesters. UC Berkeley professor Aaron Smith found dairy digester developers need approximately 10 years to achieve ROI on avoided methane credits — and that’s if credit values hold, which they haven’t. Anja Raudabaugh, CEO of Western United Dairies, noted that producers face “years of delay for approval and additional years of waiting for the actual money to show up”.
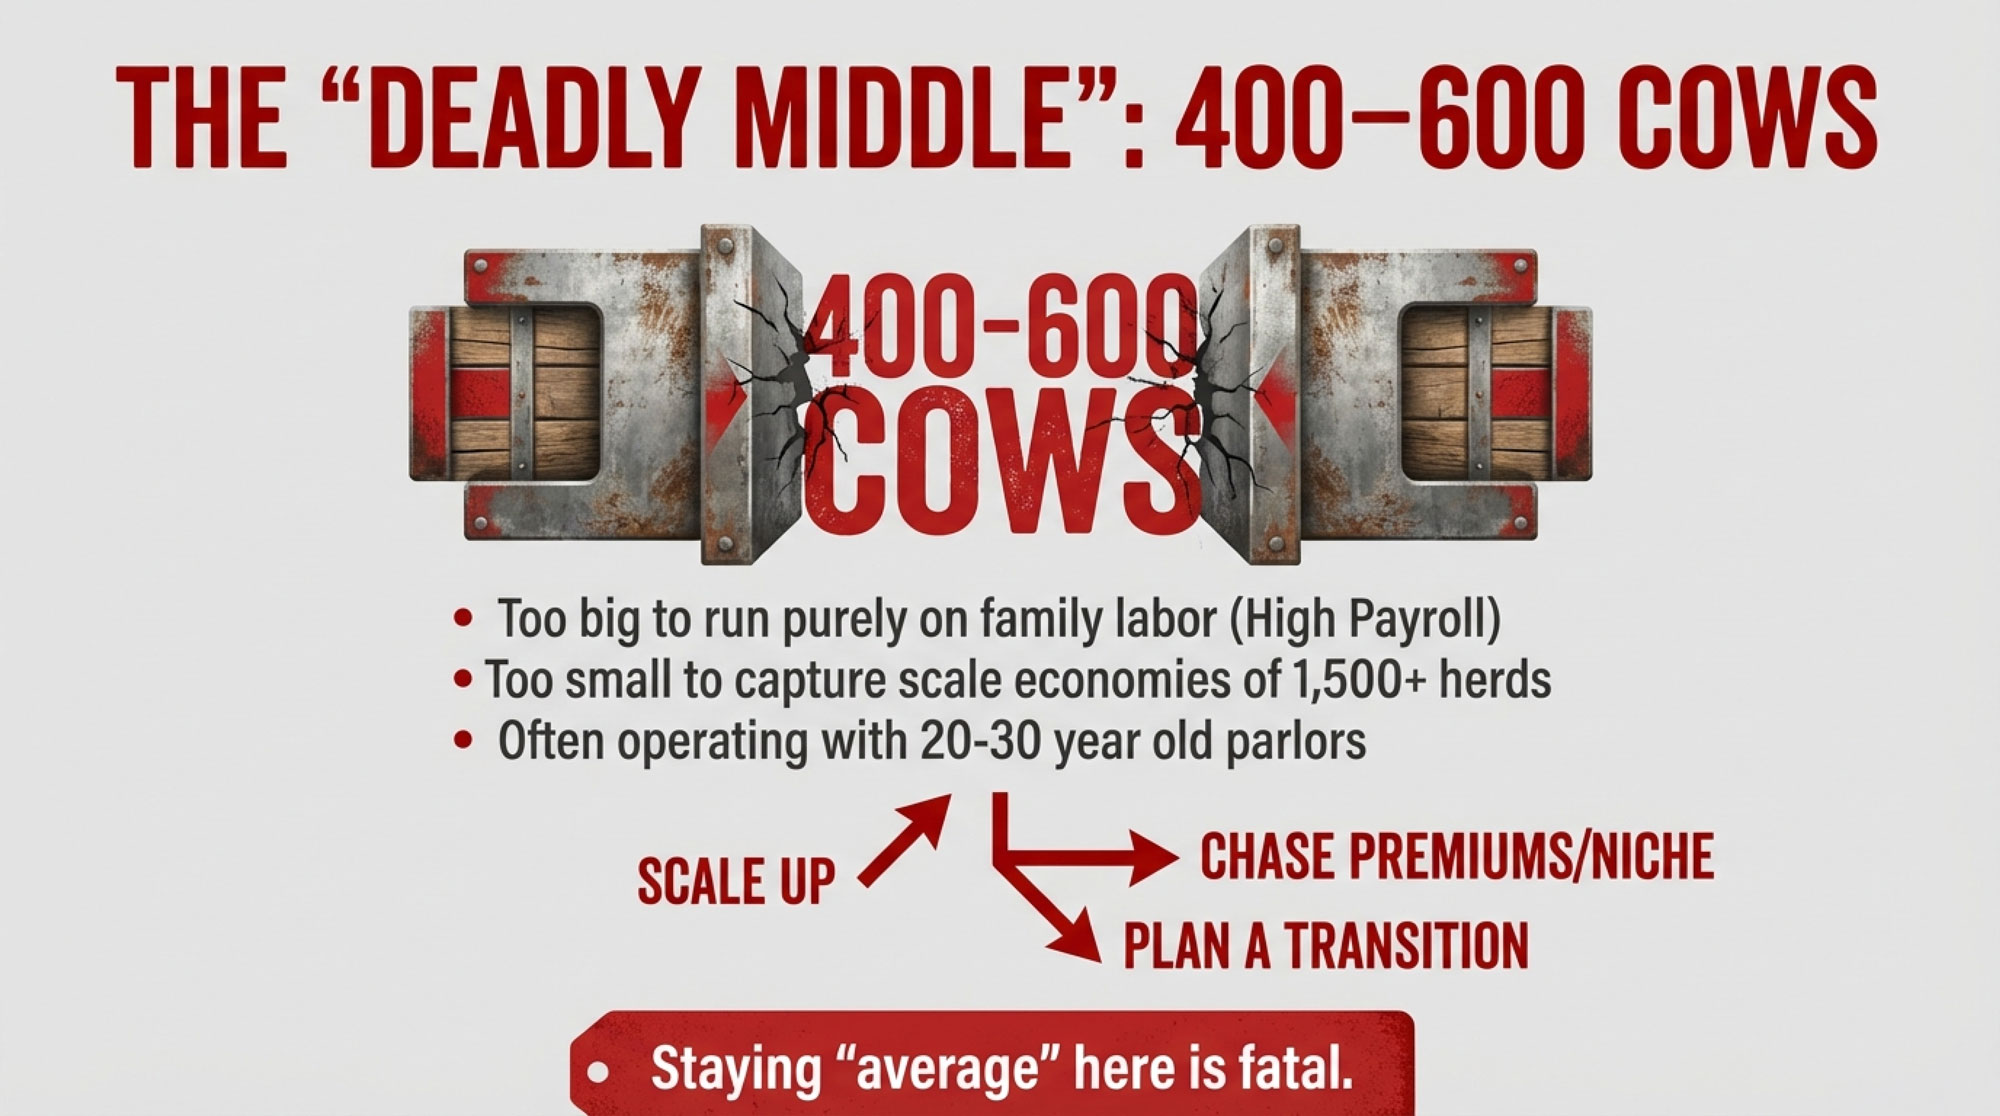
ERA Economics’ February 2023 analysis projects a 130,000-head reduction in California’s herd by 2040 under SGMA. A separate ERA report from September 2024 estimates 20–25% of small dairies could exit under direct methane regulation. These aren’t one-time hits. They compound annually — and they fall hardest on mid-sized commodity operations too large for niche premiums and too small to absorb six- and seven-figure regulatory overhead.
The Beef-on-Dairy Premium: A Profit Engine That Follows the Truck
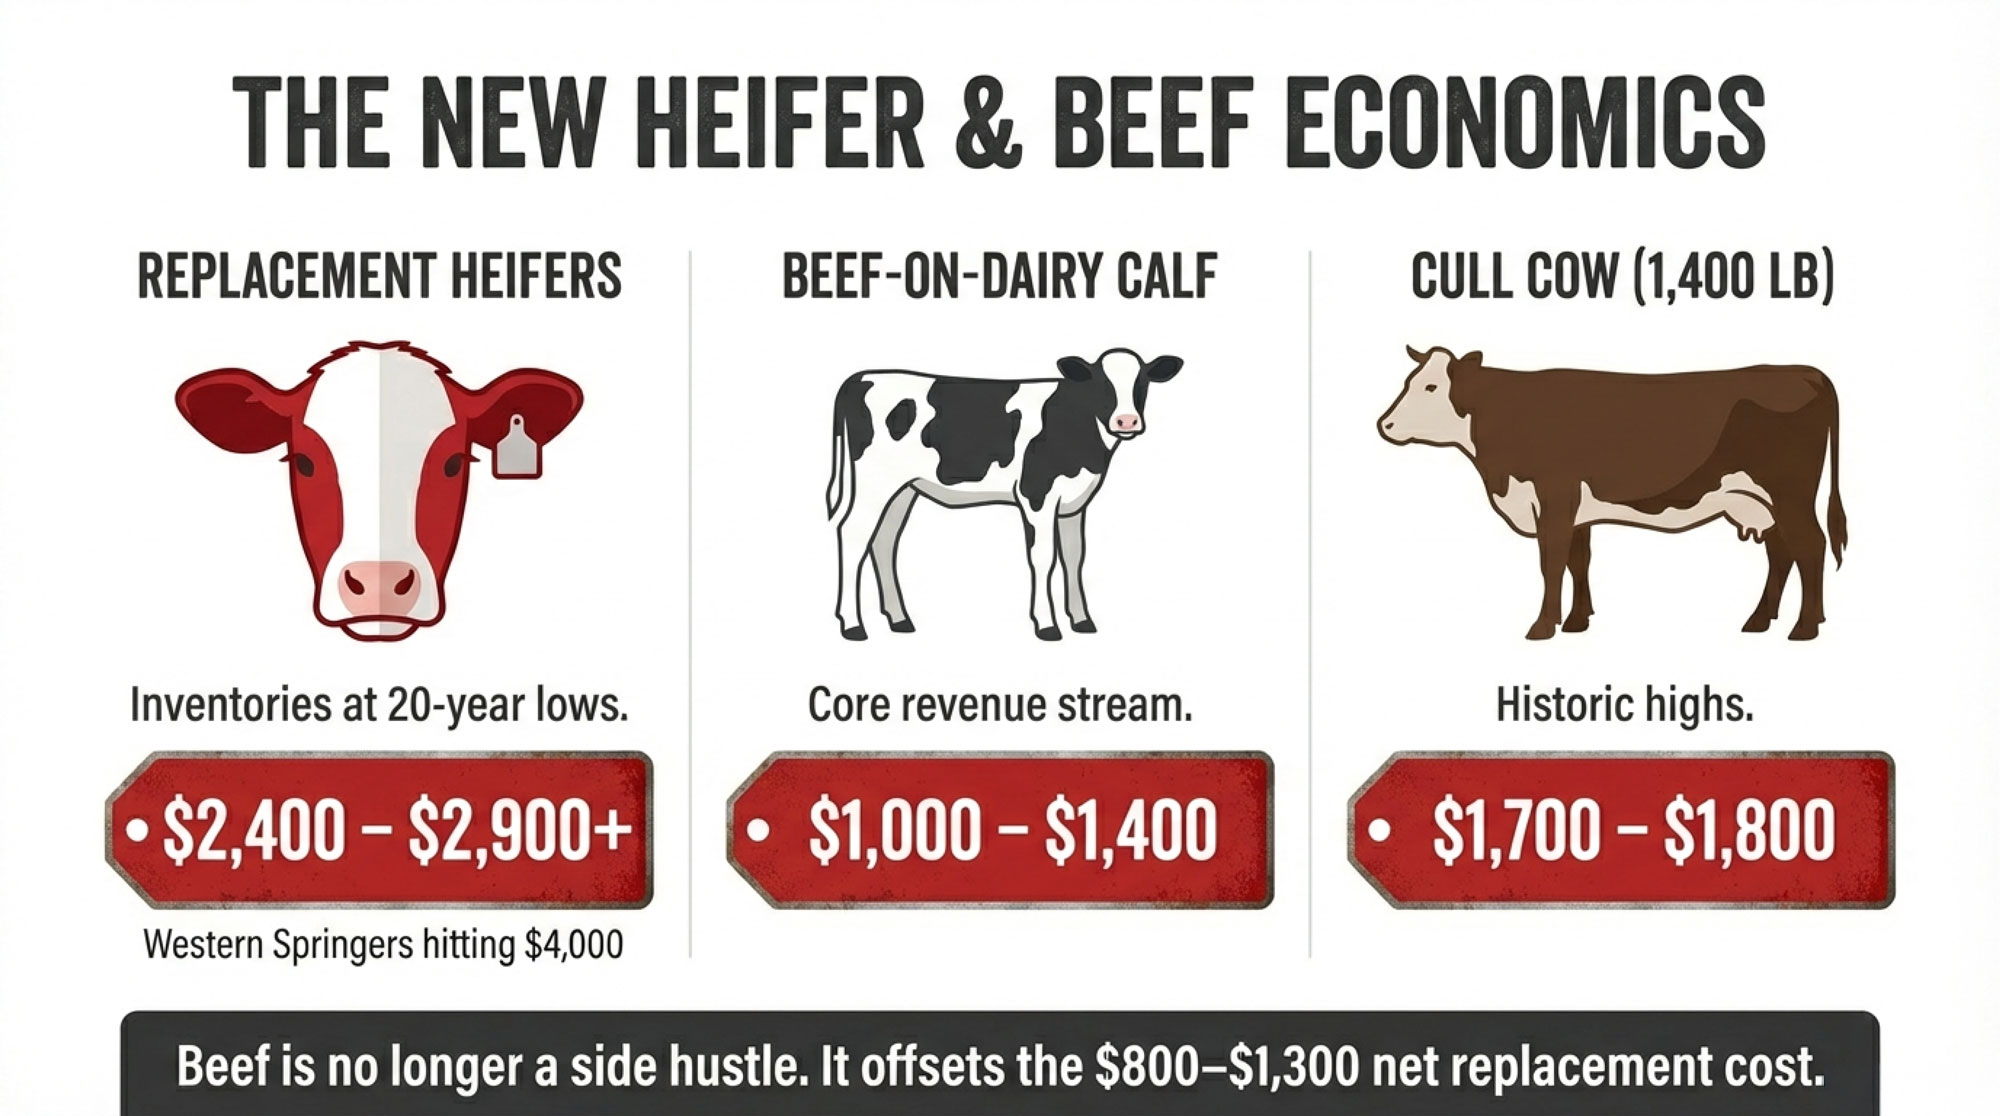
The $100 springer gap Bettencourt described is the visible edge of a much larger shift. Kansas State University researchers, analyzing 14,075 feeder steer lots through Superior Livestock (2020–2021), found beef-on-dairy crosses at 550–600 pounds bringing roughly $80–90 per head more than straight Holstein steers. UF dairy economist Albert De Vries found that when 21-day pregnancy rates exceed 20%, a sexed-on-top, beef-on-bottom strategy maximizes calf income while still generating enough replacements. Below that threshold, you may not be making enough heifers to sustain the replacement pipeline.
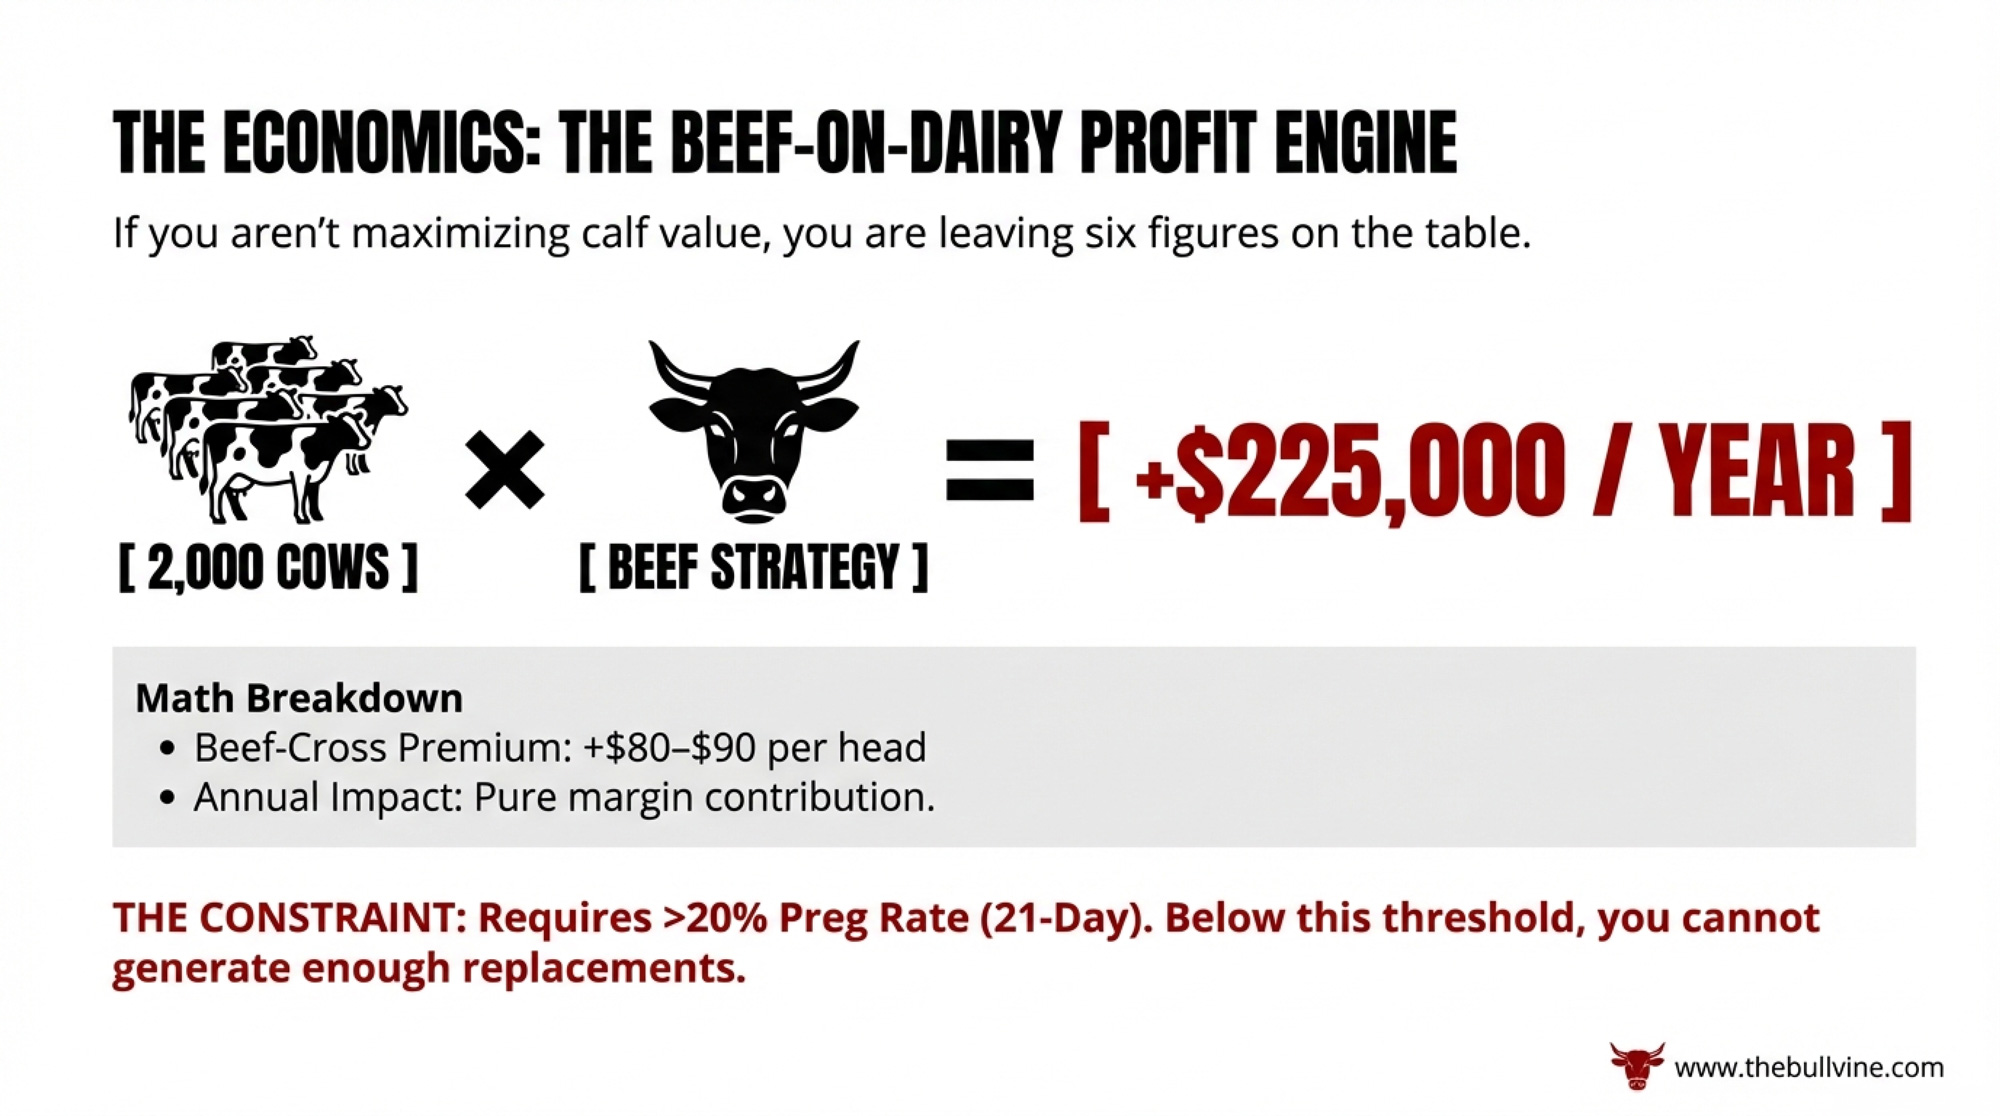
Scale it: a 2,000-cow herd producing roughly 1,500 beef-cross calves annually at a conservative $150/head advantageworks out to $225,000 per year in extra calf revenue. That premium is location-sensitive — regions with established feedlots and packers set up for beef-on-dairy pay more consistently. The I-29 corridor has that infrastructure. And with the U.S. beef cattle inventory at a 75-year low of 86.2 million head as of January 2026, those premiums have structural support. But cattle cycles turn.
Three Paths Forward — and What Each One Costs
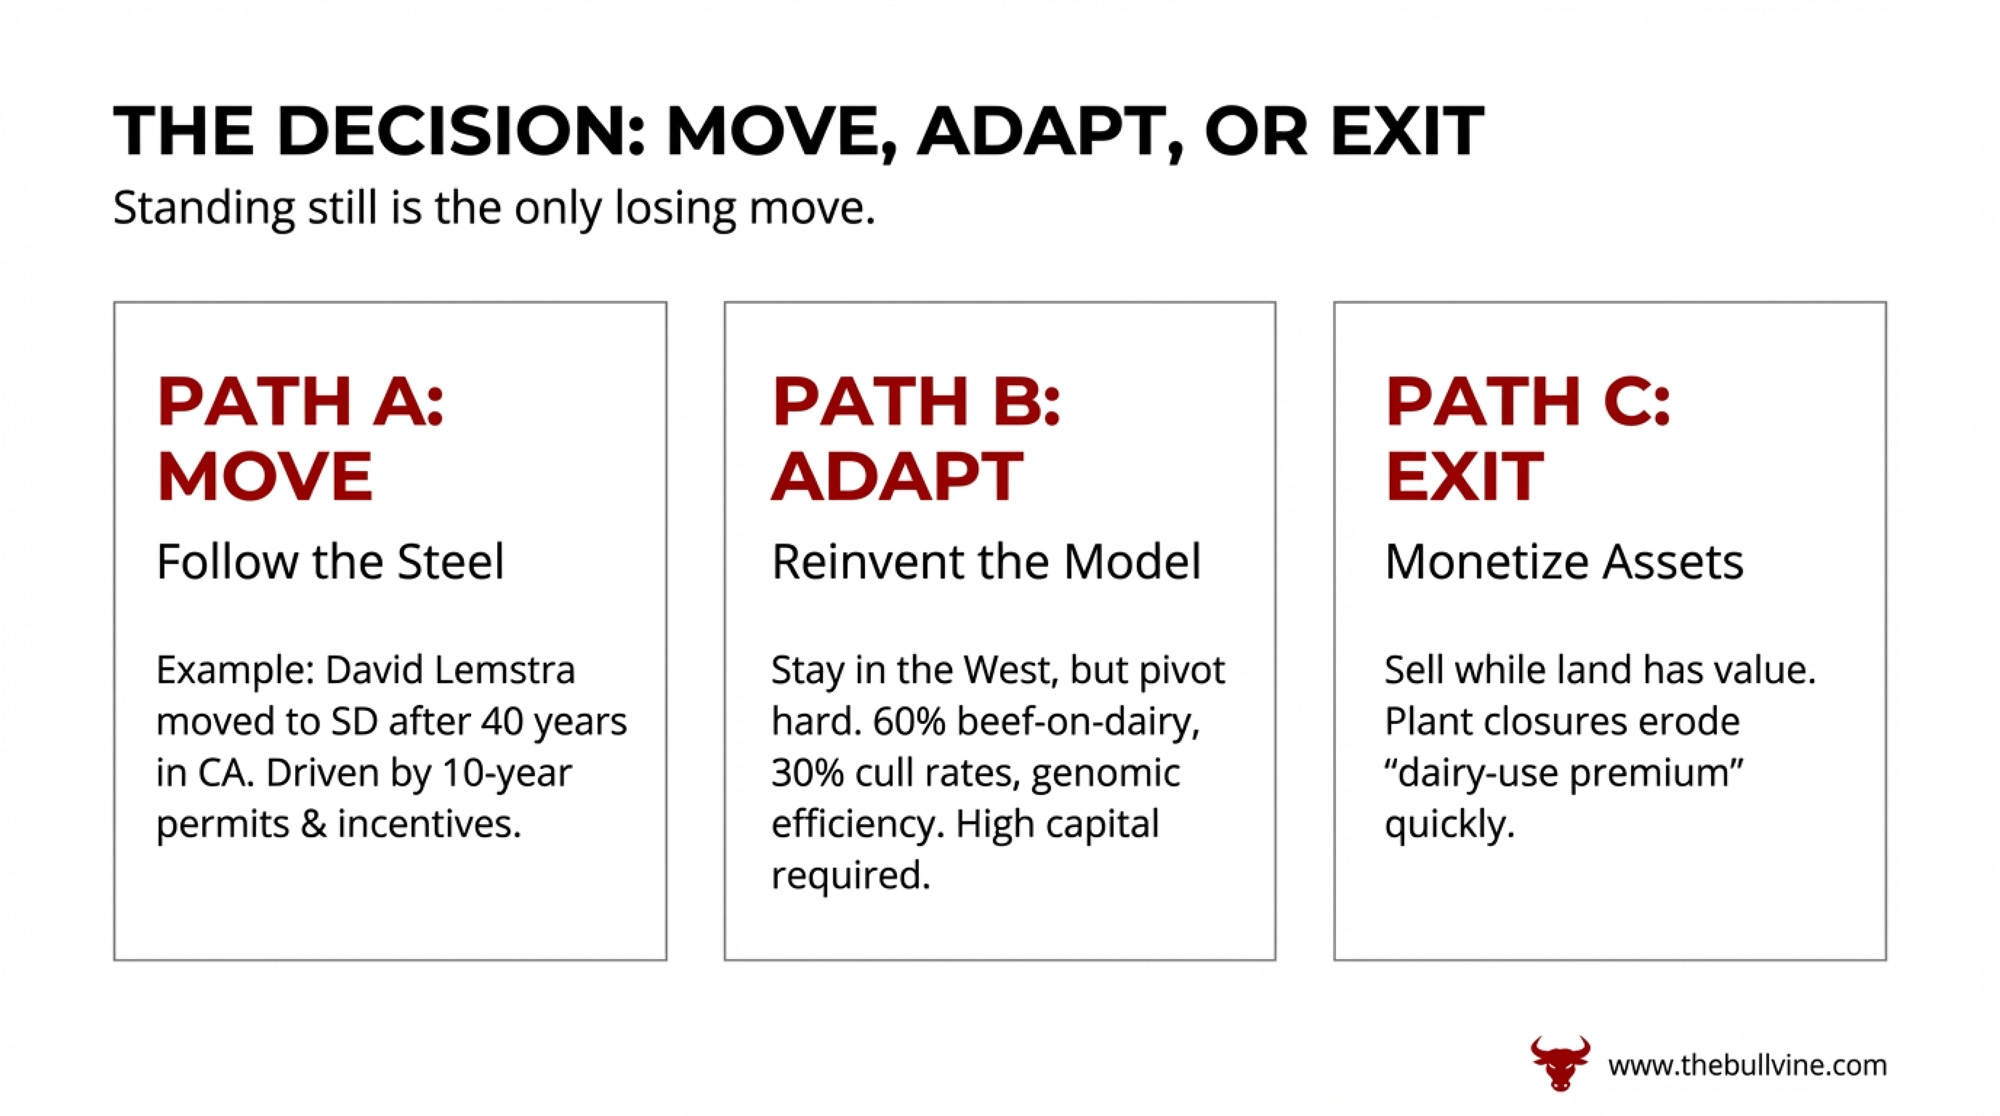
Path A: Move the cows to fit the system. David Lemstra did exactly this. After more than 40 years in central California, he spent nearly a decade researching alternatives before building Dakota Line Dairy in Humboldt, South Dakota. Today, the Lemstras milk 4,000 cows and ship to Agropur’s Lake Norden plant. Feed, permits, and processing” drove the move. He described leaving California as “death by 1,000 cuts”. Compare your 10-year “stay” cost to building in a growth corridor after selling your current assets. If the payback falls within 7–10 years, it pencils out. The risk: capital-intensive, and the best processor relationships won’t wait.
Path B: Change the model to fit the ground. Fernandes built a digester, went deep on regenerative ag, and made the genetic pivot to Jerseys. “We do a lot of things that you don’t hear about, that I think are sustainable,” he said at the 2025 California Dairy Sustainability Summit. Vander Woude kept Holsteins but used genomics to push average lactations from 2.2 to 2.7 while running 60% beef-on-dairy — more milk and more valuable calves from fewer animals. ERA Economics notes that digester revenue-share agreements typically provide $50–100 per cow per year, which is meaningful if volatile. The risk: heavy capital and regulatory tolerance required; niching down means brand-premium volatility.
Path C: Monetize the asset base. For operations where neither moving nor reinventing pencils, the honest option may be selling while assets still command value. ERA projects 388,000 acres could be fallowed in the San Joaquin Valley under SGMA. Selling from strength is a different negotiation than selling from distress.
| Path | A: Relocate to Growth Corridor | B: Reinvent In Place | C: Monetize & Exit |
| Description | Move cows to I-29 corridor; build on 10-yr permits, processor contracts | Digester + genetics pivot (Jersey/genomic efficiency) + regen ag | Sell assets while value remains; avoid distressed sale |
| Capital Required | $7–10M+ (new facility, herd move, infrastructure) | $6M+ digester + genetics transition + brand/regen investment | Minimal (brokerage, legal, transition planning) |
| Payback Window | 7–10 years (basis advantage + calf premium + water/compliance savings) | 10+ years (digester ROI alone ~10 yrs; genetics 3–5 yrs to see full shift) | Immediate liquidity; capital preservation |
| Key Risks | Capital-intensive; best processor relationships won’t wait; market timing | Heavy regulatory tolerance required; LCFS/SGMA volatility; brand-premium niche risk | Timing matters—asset values eroding as Western processing consolidates |
| Best Fit For… | 2,000+ cow herds with equity, rolling 3-yr basis drag >$0.75/cwt, appetite for scale | Established Western herds with strong brand access, regen ag commitment, high reproductive efficiency | Mid-size commodity herds: too big for niche, too small for scale, stuck in high-friction state |
Your 90-Day Decision Checklist
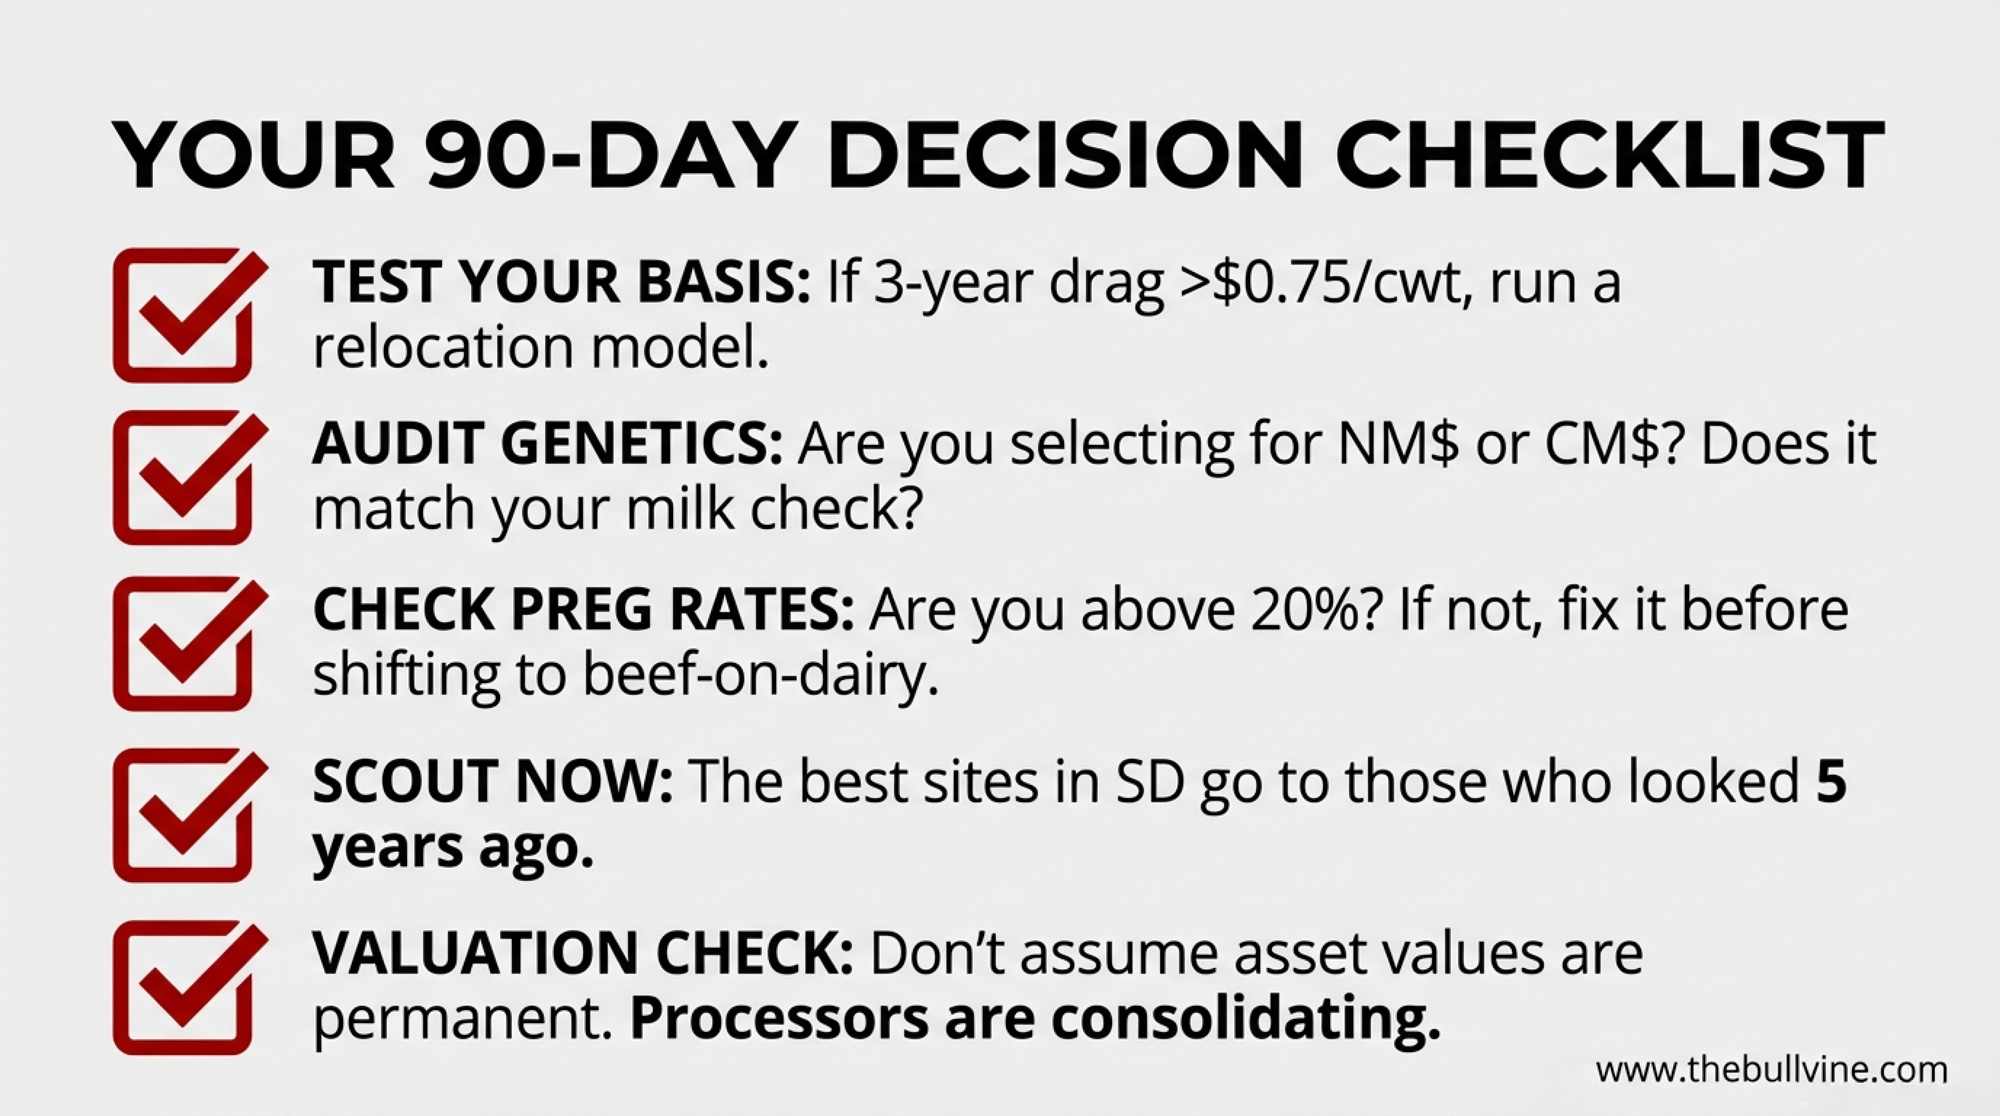
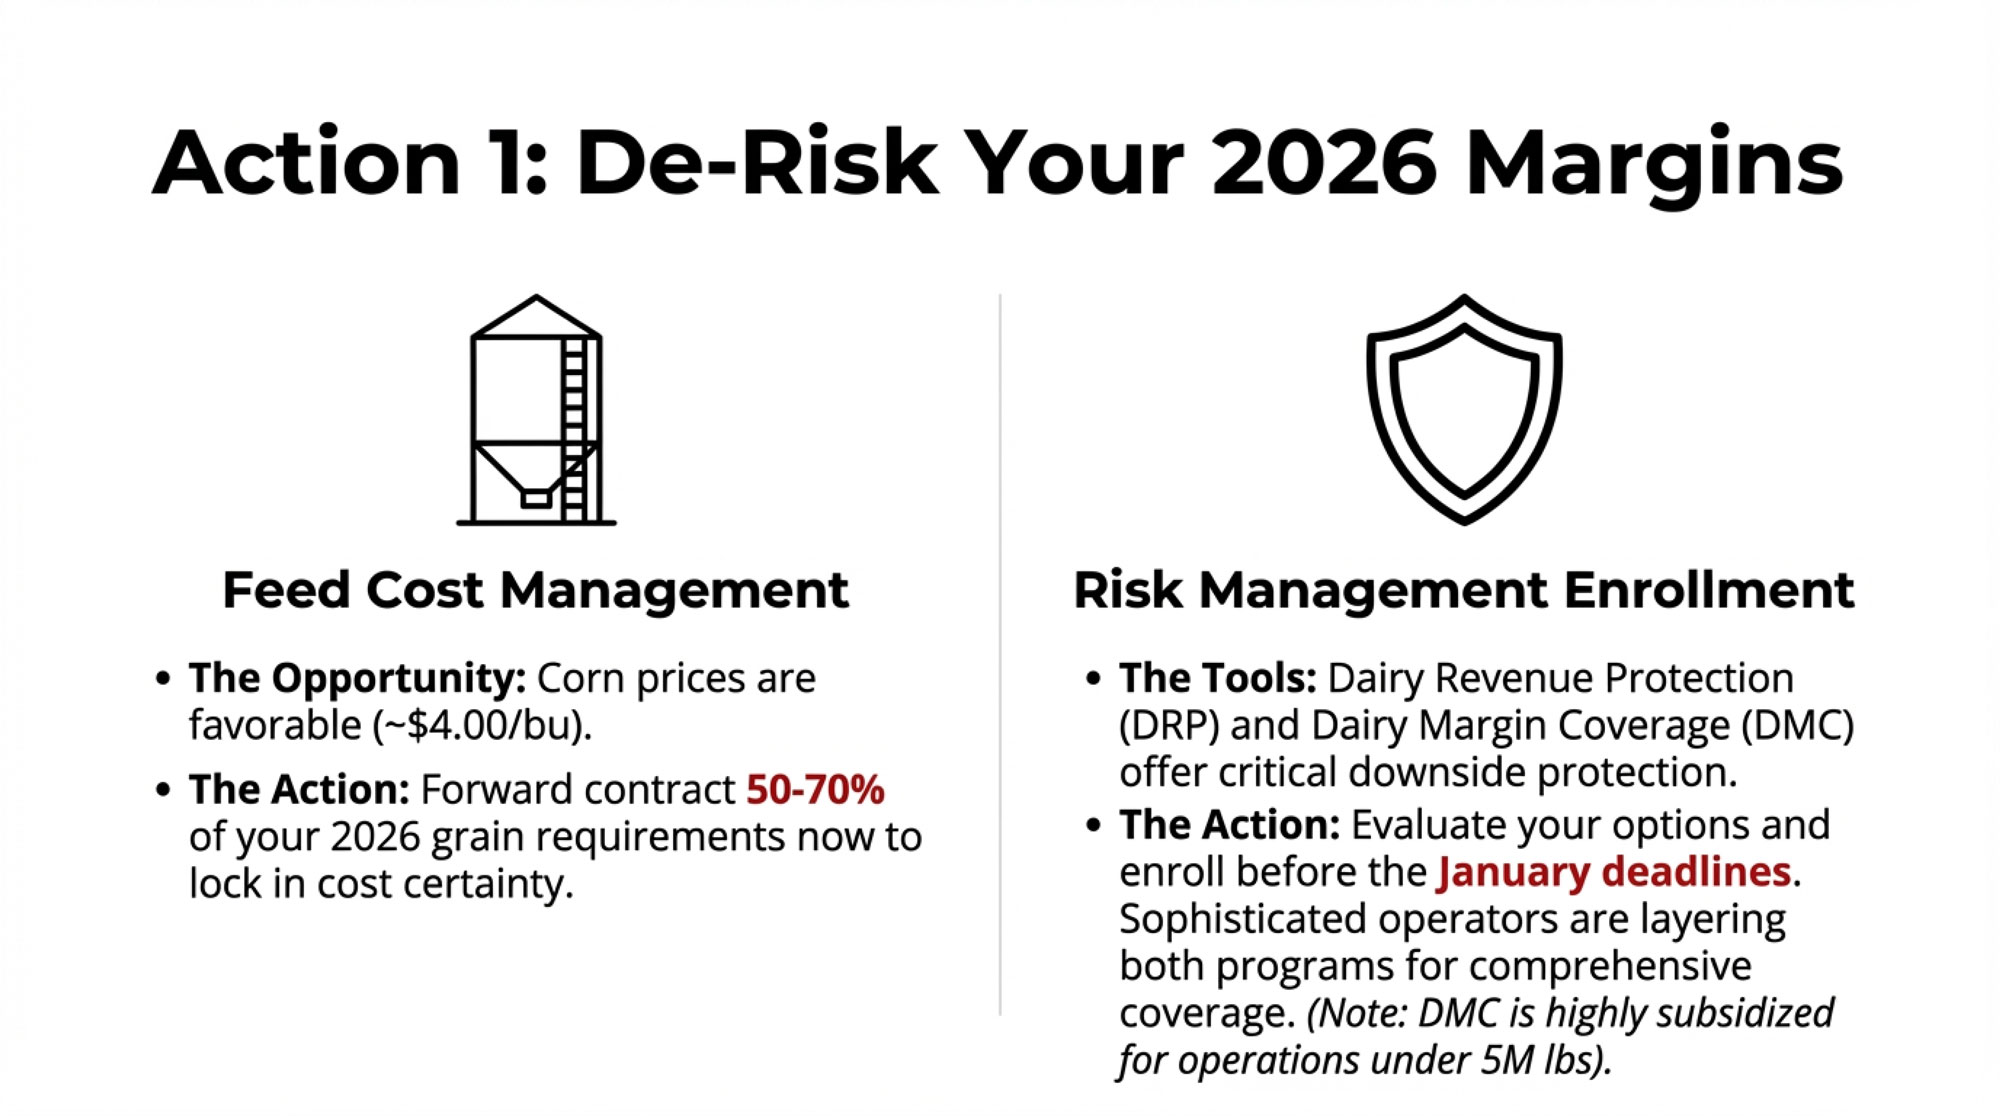
- Run your 10-year “stay” scenario. Pull your rolling 3-year basis versus the best alternative region. Add actual water and compliance cost trends. If the cumulative drag exceeds $400,000–$500,000 per year, relocation deserves a serious model.
- Test your basis trigger. A rolling 3-year disadvantage exceeding $0.75/cwt means $225,000 annually on a 2,000-cow herd shipping 300,000 cwt/year. Before water, compliance, or calf value.
- Audit your genetic alignment. Are you selecting for CM$ or NM$ to match your actual processor contract? The April 2025 NM$ revision puts butterfat at 31.8% — if you’re shipping into a fluid market, that may not be your index.
- Check your 21-day pregnancy rate against the De Vries threshold. Below 20%, a sexed-on-top/beef-on-bottom program may not generate enough replacement heifers.
- Scout destination regions before you need them. Lemstra spent nearly a decade researching before he moved. The best sites and processor relationships go to producers who are already known.
- Don’t assume your current asset values are permanent. CDI closed two California plants in four years — Artesia in 2020 and Los Banos in October 2024. If processors are consolidating around you, your land’s dairy-use premium may already be eroding.
Key Takeaways
- South Dakota’s dairy herd hit 240,000 cows as of January 1, 2026, adding 25,000 head in a single year — exactly matching Grong’s projection, built on 10-year CAFO permits, reinvestment incentives, and nine-figure processor expansions.
- The $100 springer premium for beef-cross calves signals that calf revenue belongs in the same strategic column as milk price, basis, and water cost. Beef herd at a 75-year low supports that premium — but cattle cycles turn.
- A genetics gap is emerging between component-driven Midwest herds (butterfat now 31.8% of NM$) and Western herds pivoting toward longevity and efficiency. Fernandes’s Jersey switch and Vander Woude’s genomic program show what that pivot looks like.
- Western producers face compounding threats: $2.2 billion in projected SGMA losses by 2040; $300–$675 million per year in methane regulation; LCFS credits crashing from $200 to $60; and CDI closing two plants in four years.
- Watch in 2026–2027: SGMA implementation deadlines, Midwest processor capacity utilization, and beef-cycle signals that could compress cross-calf premiums.
The Bottom Line
The middle ground — too big for niche, too small for scale, stuck in a high-friction state with genetics optimized for a pricing structure that’s shifting underneath you — is the most dangerous place to be in 2026. The producers hauling cattle east on I-90 have run the numbers long enough to know it. The ones staying, like Fernandes and Vander Woude, are reinventing their operations from the genetics up. Both are making active choices with their eyes open. The only losing move is standing still and hoping the spreadsheet doesn’t notice.
Complete references and supporting documentation are available upon request by contacting the editorial team at editor@thebullvine.com.
Learn More
- The 90-Day Dairy Pivot: Converting Beef Windfalls into Next Year’s Survival – Arms you with a tactical 90-day blueprint to convert temporary $1,000 beef-on-dairy windfalls into long-term resilience. Reveals how top-tier herds are stacking $266/cow in extra revenue to survive flat milk checks and rising fixed costs.
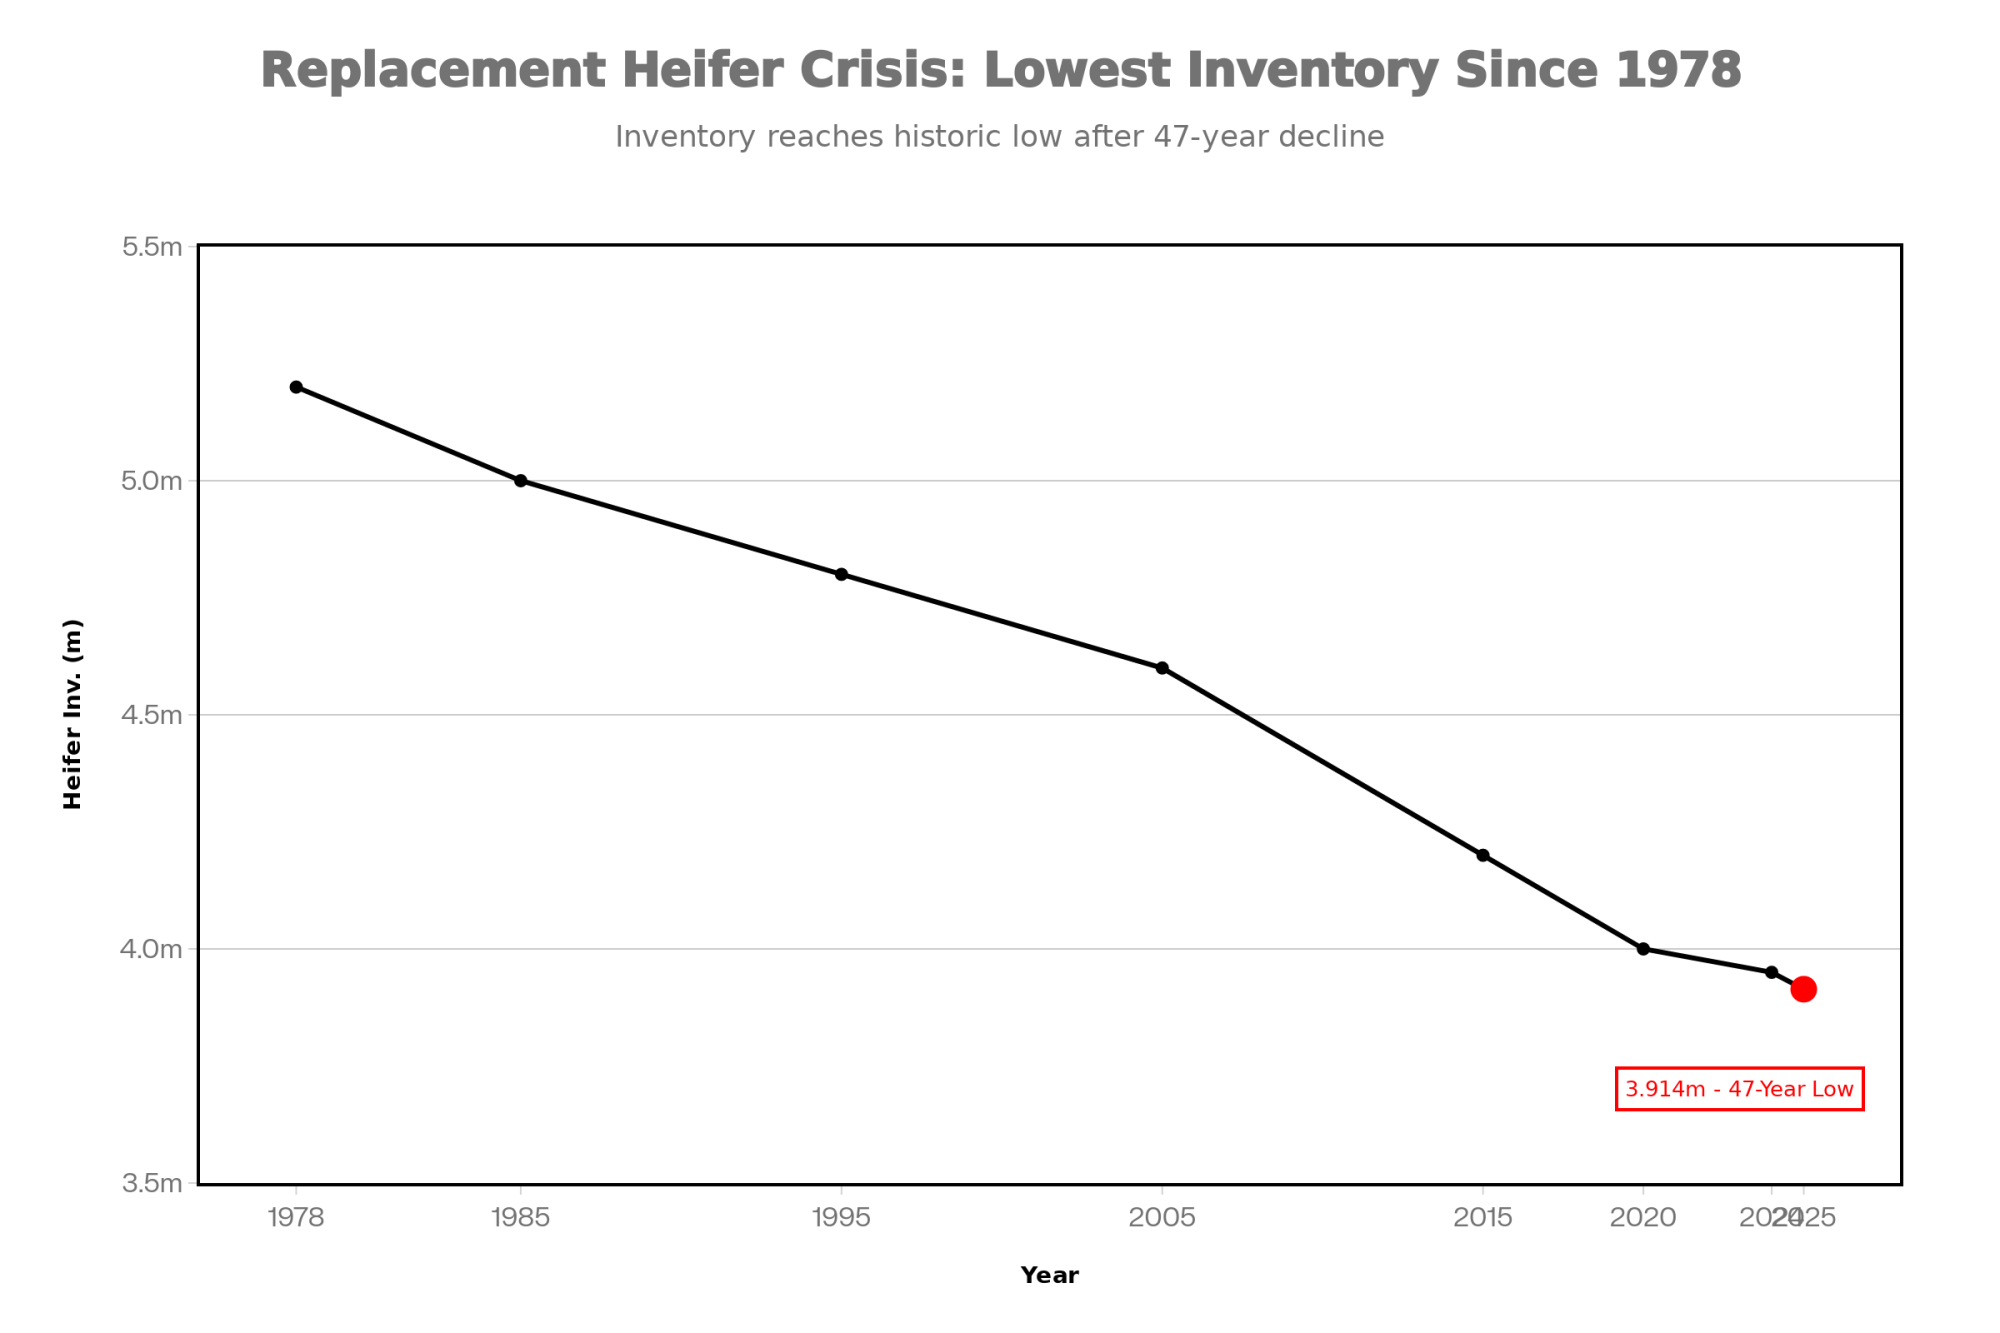
- 211,000 More Dairy Cows. Bleeding Margins. The 2026 Math That Won’t Wait. – Exposes the structural reset of 2026, where a 20-year heifer low meets $11 billion in new processing capacity. Breaks down the $19.80 “real” break-even math to help you position your operation for the upcoming margin squeeze.
- Genetic Correlations Upended: Why Sticking with Old Breeding Indices Could Cost Your Dairy $486 Per Cow – And What the Data Really Proves – Delivers a data-backed case for ditching conformation-heavy indices in favor of Net Merit 2025. Unlocks a $486-per-cow profit opportunity by realigning your breeding program with current component premiums and critical feed-saved efficiencies.
 The Sunday Read Dairy Professionals Don’t Skip.
 The Sunday Read Dairy Professionals Don’t Skip.
Every week, thousands of producers, breeders, and industry insiders open Bullvine Weekly for genetics insights, market shifts, and profit strategies they won’t find anywhere else. One email. Five minutes. Smarter decisions all week.