Is a $2 milk misread hiding a $150,000 hole in your 2026 budget? This is why USDA and futures don’t agree.
Executive Summary: USDA’s latest outlook has 2026 all‑milk in the high‑$18s, while Class III futures sit closer to the mid‑$16s—a $2–$3/cwt gap that can wreck a budget if you pick the wrong anchor. For a 300‑cow herd shipping about 75,000 cwt, that difference is a $150,000–$225,000 swing in annual revenue. At the same time, U.S. cheese and butterfat exports are hitting records only because we’re pricing below Europe and New Zealand, so strong export volume doesn’t automatically mean strong farm‑gate prices. Long‑term shifts in butterfat performance, protein levels, and roughly $10 billion in new processing capacity are changing what kind of milk plants want and how they reward components. Layer on 7–8% interest rates and tougher lender stress tests, and 2026 becomes a year where you can’t afford optimistic milk guesses or loose capital math. This feature gives you a five‑step playbook to budget off the right signals, lock in sensible feed margins, demand $17‑milk payback from new projects, tune components to your plant, and use risk tools that actually fit your herd size and region.

There’s a point every winter when you sit down with the books, look at that cash‑flow sheet, and think, “Alright… what does this year really look like?” Heading into 2026, that question carries a little more weight than usual.
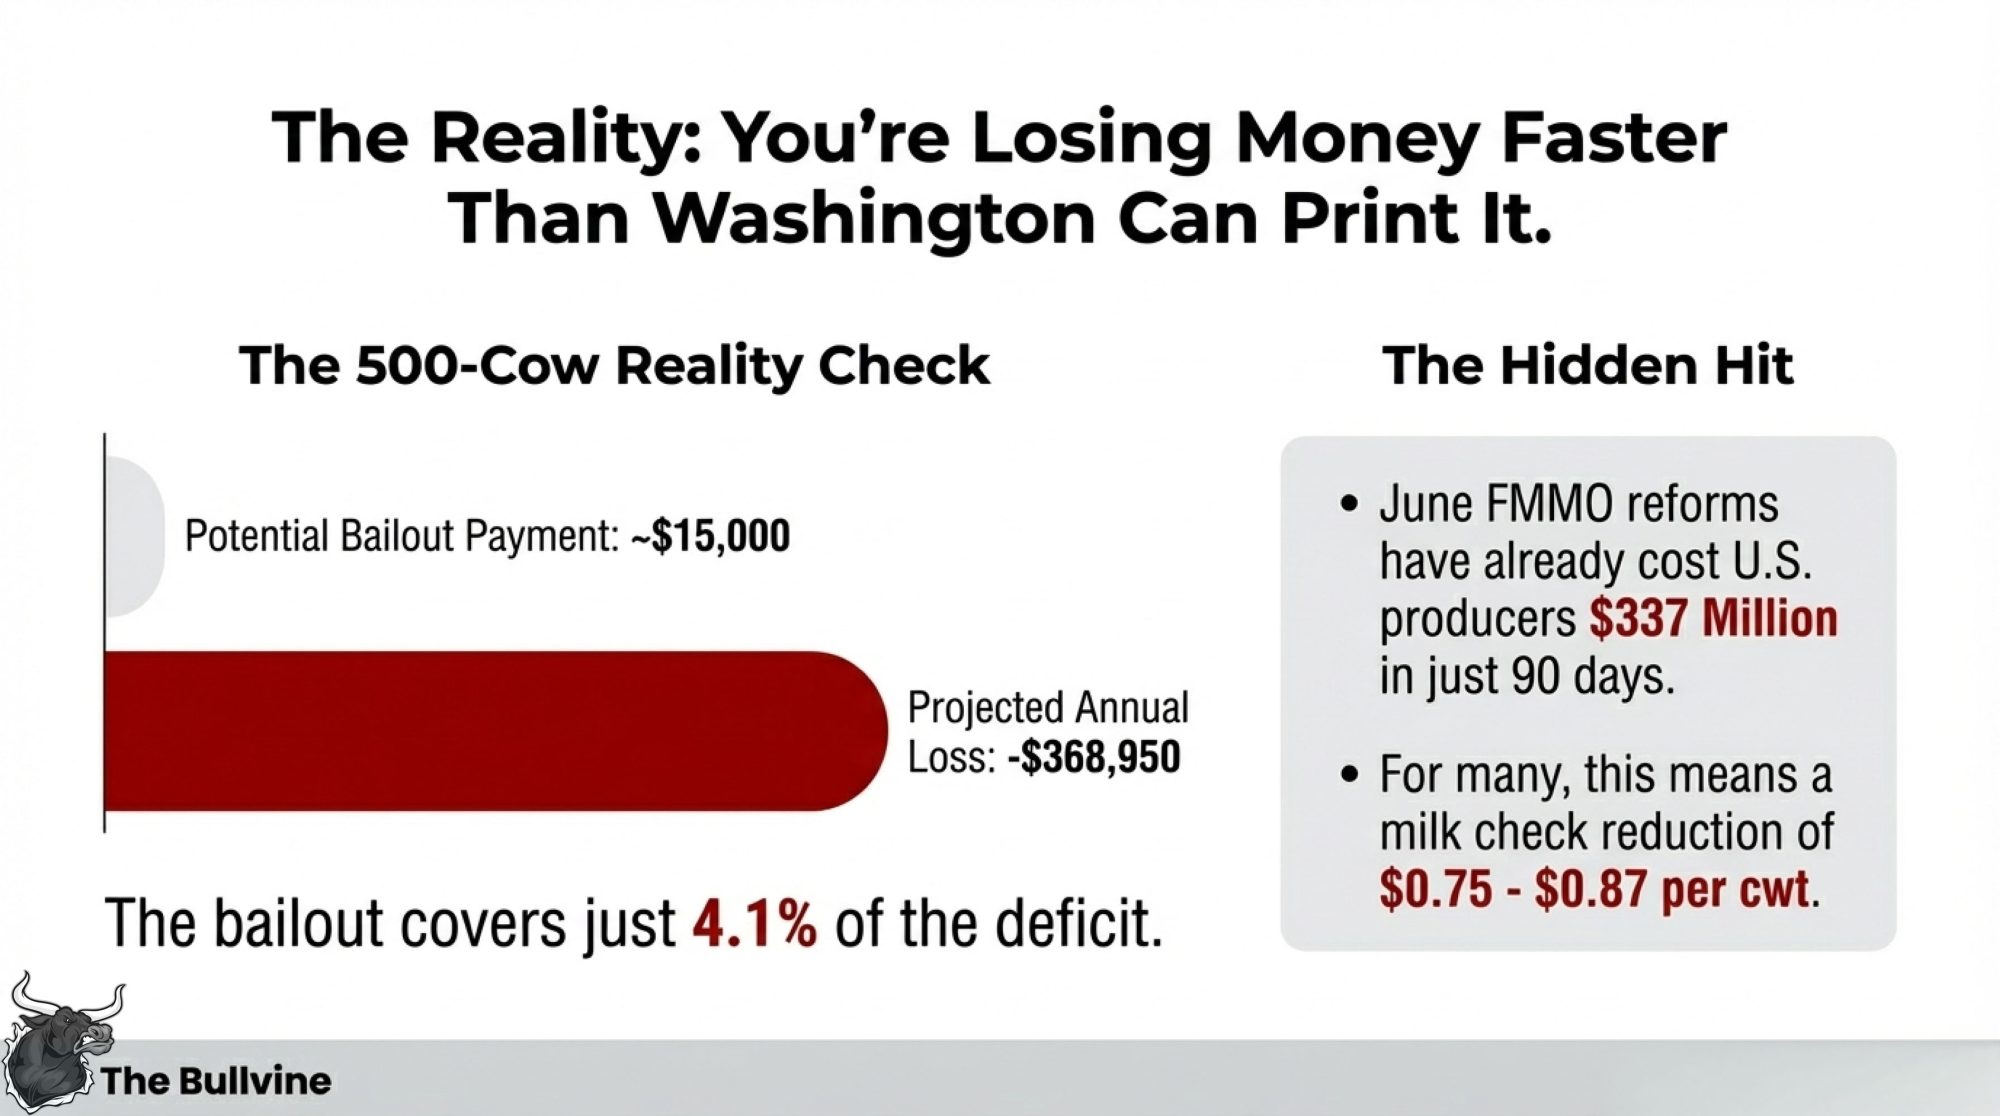
What’s interesting here is that, for a 300‑cow herd shipping roughly 7.5 million pounds a year—about 25,000 pounds per cow—that question isn’t theoretical at all. Turn that into hundredweights, and you’re sitting near 75,000 cwt. If one version of your plan leans on a mid‑$16 Class III milk check and another counts on something closer to a high‑$18 all‑milk average, you’re staring at roughly a $150,000 to $225,000 swing in annual revenue just from a $2–$3 per cwt difference in price.

For a family dairy—whether that’s in Grey‑Bruce, the St. Lawrence Valley, or central Wisconsin—that’s the difference between “we can finally fix some stuff” and “we’re just keeping the lights on.” So let’s walk through why the signals are so far apart, and more importantly, how to plan in a way that doesn’t bet the farm on any one forecast.
Looking at This Trend: USDA vs. the Futures Screen
On one side of the ledger, you’ve got USDA’s official outlooks. In the January 2026 World Agricultural Supply and Demand Estimates (WASDE), USDA pegs the 2025 all‑milk price at about $21.15 per cwt and the 2026 all‑milk price closer to $18.25 per cwt, tying that downgrade to softer cheese prices and slightly higher per‑cow production and overall output. Most analysts sum that picture up as higher milk supplies and somewhat softer prices by 2026.
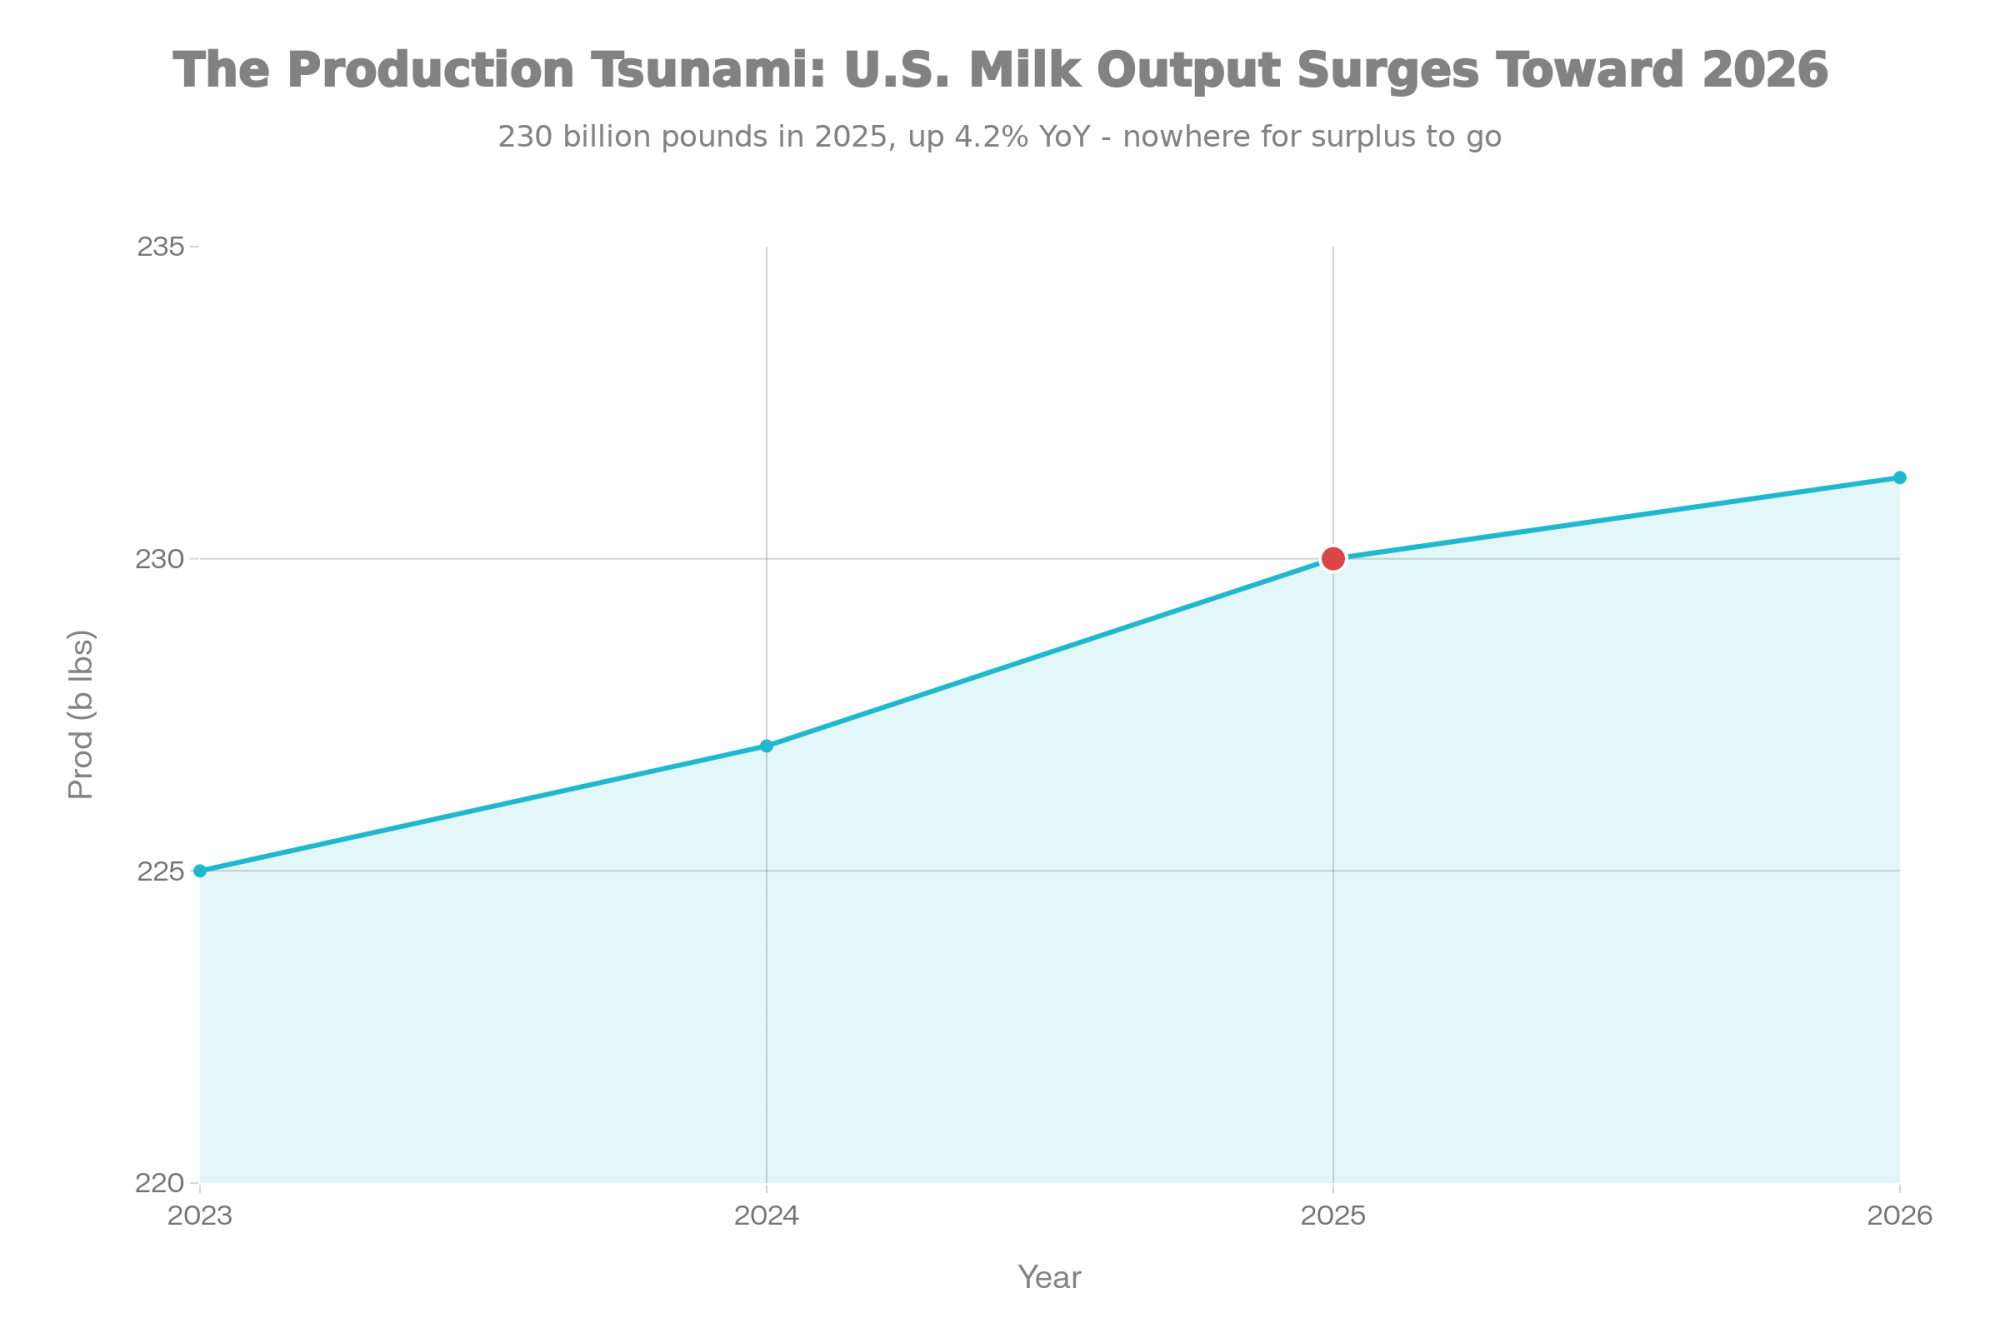
At the same time, USDA’s Livestock, Dairy, and Poultry Outlook projects U.S. milk production around 230.0 billion pounds in 2025 and 231.3 billion pounds in 2026, with modest gains in milk per cow pushing total output higher. That production path is part of why USDA trimmed its Class III and IV expectations later in 2025.
On the other side of your phone, you’ve got what buyers and sellers are actually trading.

| Month | USDA All-Milk | Class III Futures | Spread (USDA – Futures) |
| January | $18.25 | $15.85 | +$2.40 |
| February | $18.25 | $15.92 | +$2.33 |
| March | $18.25 | $16.10 | +$2.15 |
| April | $18.25 | $16.25 | +$2.00 |
| May | $18.25 | $16.15 | +$2.10 |
| June | $18.25 | $16.00 | +$2.25 |
| July | $18.25 | $15.95 | +$2.30 |
| August | $18.25 | $16.05 | +$2.20 |
| September | $18.25 | $16.20 | +$2.05 |
| October | $18.25 | $16.30 | +$1.95 |
| November | $18.25 | $16.15 | +$2.10 |
| December | $18.25 | $16.05 | +$2.20 |
If you pull up USDA Dairy Market News’ weekly report from early January 2026, you see Class III futures for many 2026 months hovering in the mid‑$16s, with some contracts slipping toward the mid‑$15s and others flirting with the upper‑$16s. In the same report, spot cheddar blocks are described in the low‑$1.30s per pound, a long way from the $2‑plus levels that showed up briefly in 2022.
So you’ve got two honest but different stories:
- USDA’s forecast world says: “Given our assumptions, all‑milk should average in the high‑$18 to low‑$20range in 2026.”
- The futures world says: “Given what participants are willing to lock in today, Class III looks more like the mid‑$16s, with plenty of caution baked in.”
Once you plug in your local basis and your butterfat performance and protein, that’s where the $2–$3 per cwt planning gap really shows up.
In barn after barn I walk through—from east coast tie‑stalls to Wisconsin freestalls and dry lot systems out west—I’m seeing a quiet but important shift. More conservative farms are starting to let the Class III strip anchor their budgetsand treat USDA’s all‑milk numbers as possible upside, not the default assumption. The bank account, after all, settles off cheques tied to real markets and pooling, not the top end of a forecast chart.
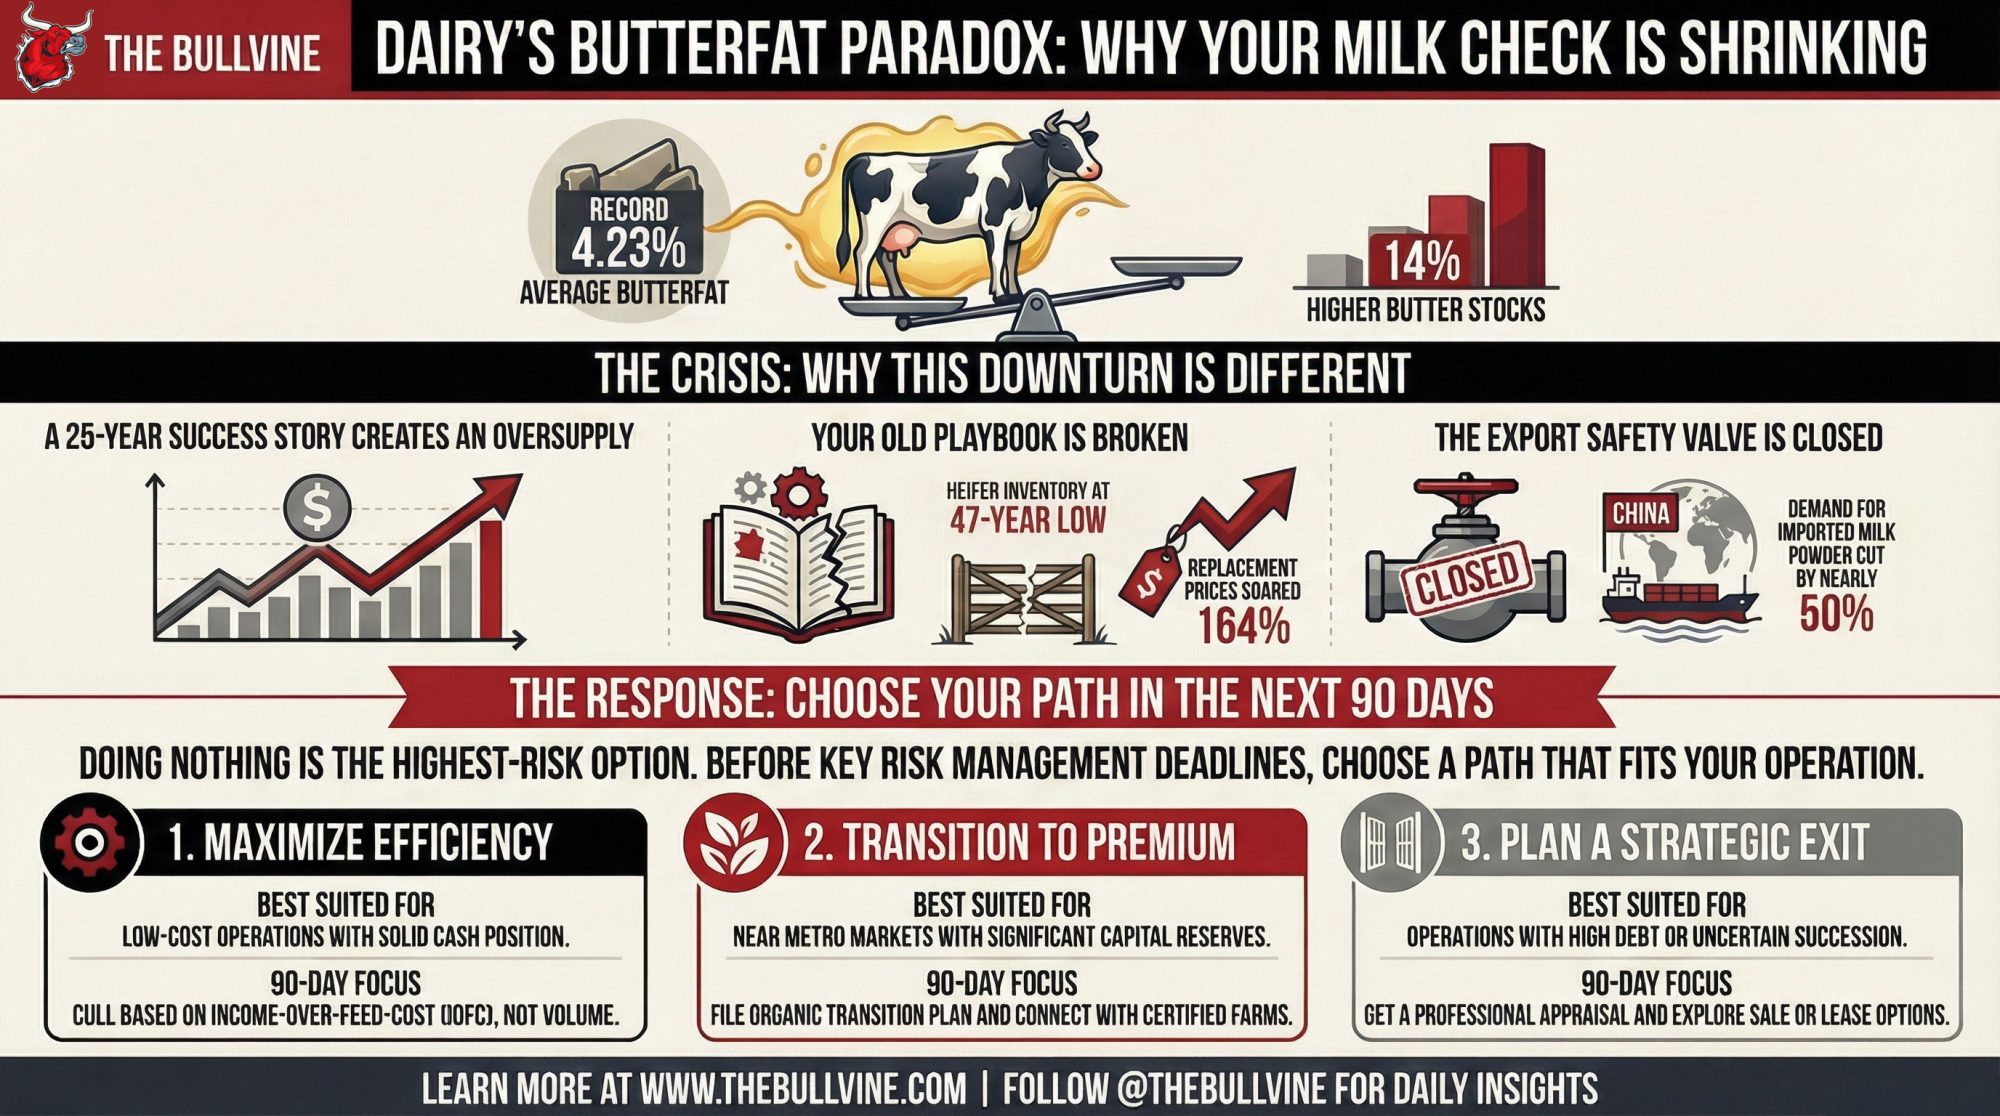
Exports on Fire: The Cheese and Butterfat Paradox
Now let’s slide over to exports, because they’re doing a lot of heavy lifting right now.
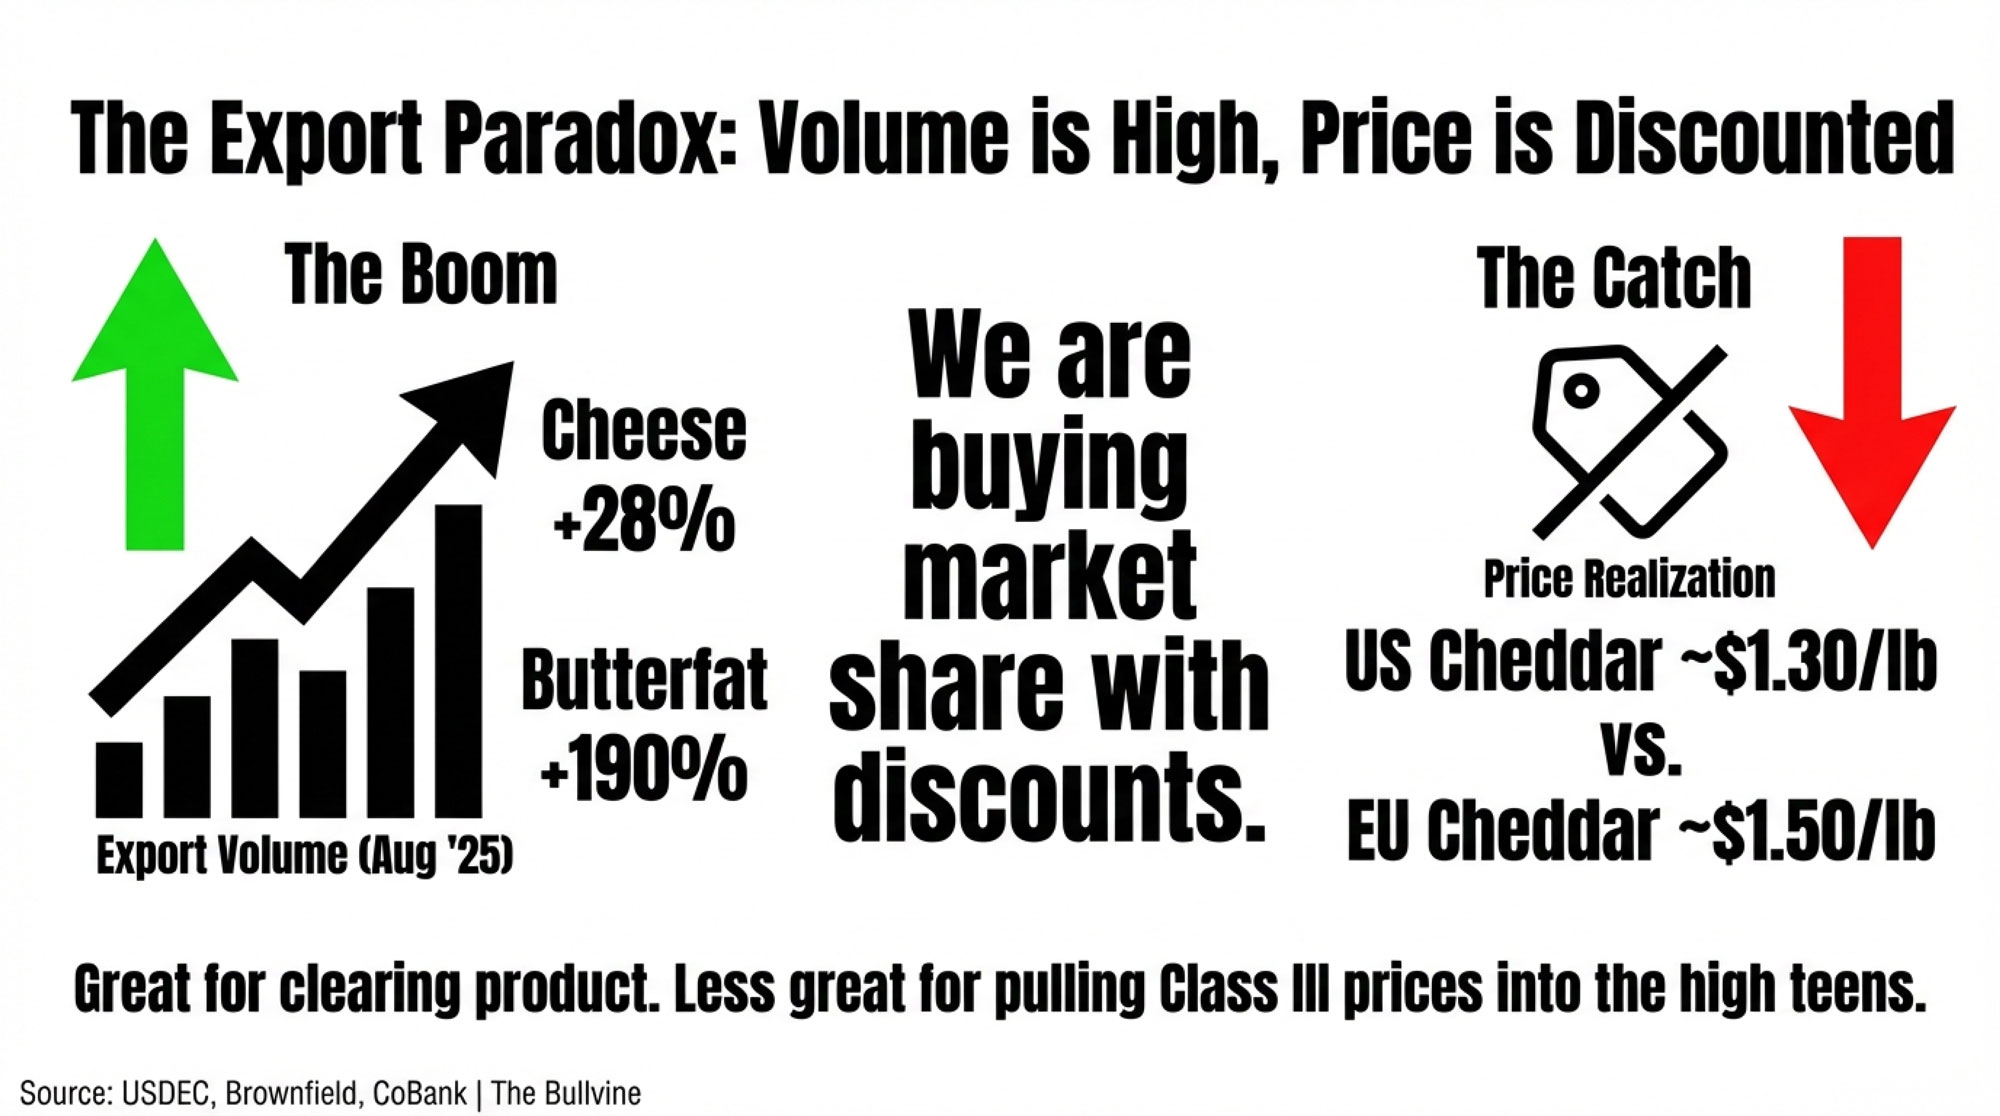
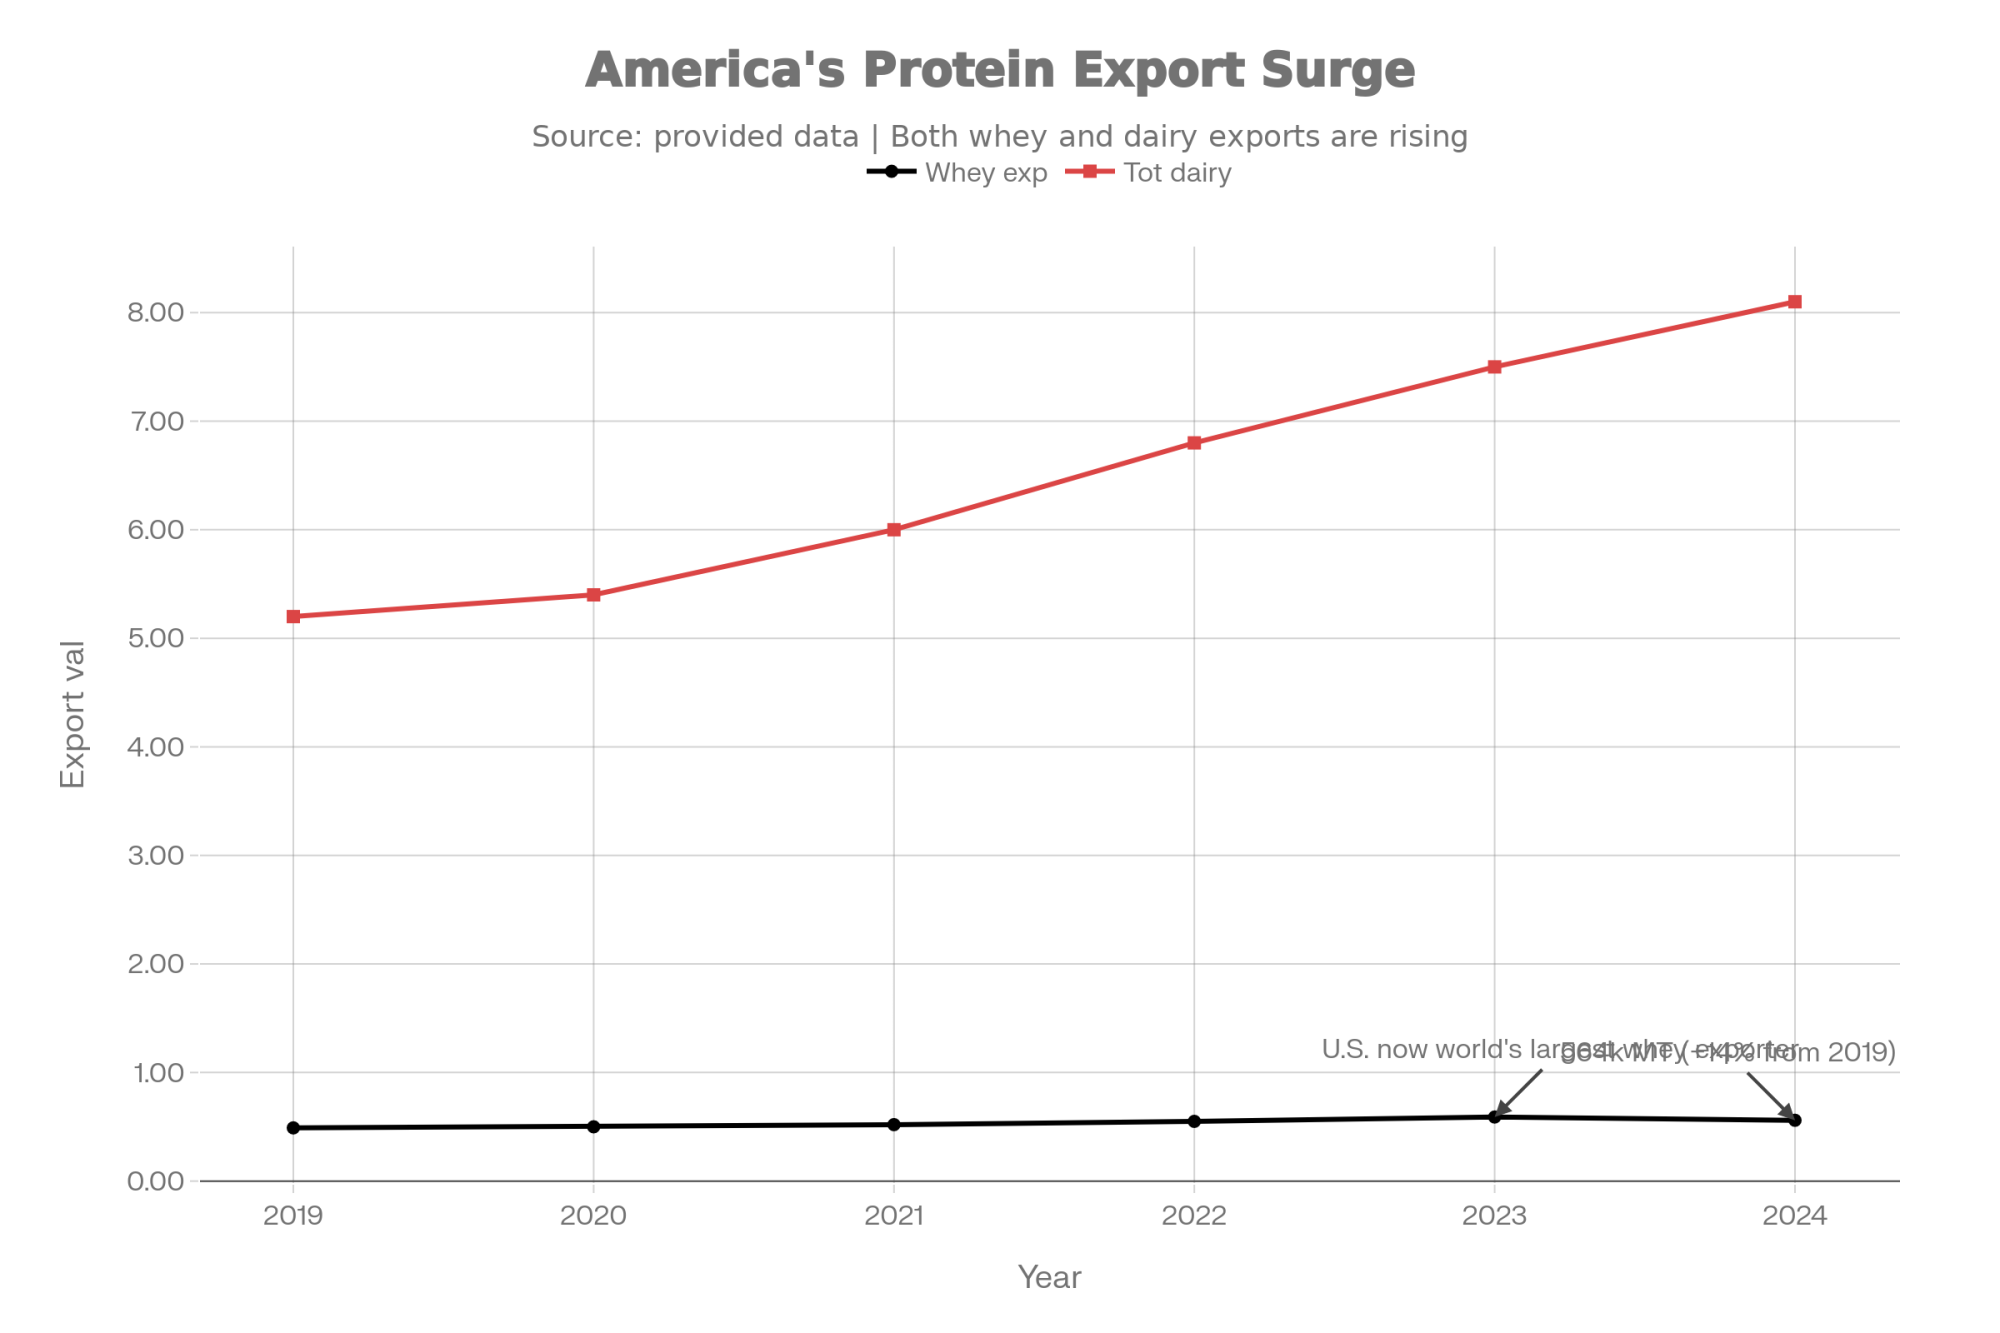
The U.S. Dairy Export Council (USDEC) reports that in August 2025, U.S. cheese exports were 28% higher than a year earlier, making it a record August for cheese shipments. Cheddar exports jumped roughly 140% compared to August 2024, helped by new cheese capacity and aggressive pricing. Every major region except Canada bought more U.S. cheese, with South Korea particularly strong.
Butterfat performance in exports has been even more dramatic. USDEC and Brownfield data show that:
- Butter exports were up about 190% year‑over‑year in August 2025.
- Anhydrous milkfat (AMF) exports climbed roughly 198% over the same period.
- Overall butterfat exports nearly tripled, with strong growth across Asia and the Middle East.
Total U.S. dairy export volume in August 2025 was up around 3%, while export value climbed about 17% to roughly $831.5 million.
In that Brownfield piece, William Loux, vice president of global trade analysis at USDEC, said, “We are in for probably almost certainly a record cheese year again here in 2025. We had a record year in 2024, we had a record year in 2022, so basically three out of the last four years we’ve set new records.” Hoard’s Dairyman and USDEC export reviews reinforce that U.S. cheese exports have surpassed 1 billion pounds in multiple recent years, underscoring our role as a long‑term global cheese supplier.
From one angle, that all looks fantastic. The catch is the price tag attached to those wins.
Farm Credit East’s 2025–26 dairy outlook notes that U.S. butter prices have often been discounted compared to EU and New Zealand butter, which draws buyers but keeps domestic butter prices on a shorter leash. CoBank’s dairy export commentary adds that U.S. cheese has likewise tended to trade below comparable EU and Oceania cheeses to capture and hold certain markets.
Corey Geiger, lead dairy economist for CoBank, explained that when European cheddar prices eased toward the equivalent of about $1.50 per pound in 2025, U.S. exporters often needed cheddar closer to $1.30 per pound to stay competitive in some export tenders. It’s not a fixed rule for every sale, but it captures the general spread.
So the export paradox looks like this: U.S. cheese and butterfat are setting volume records and keeping plants busy, but much of that demand is being bought at discount pricing, not at rich premiums. Great for clearing product and avoiding butter or powder mountains. Less great if you’re counting on exports alone to pull Class III into the high teens.

| Product | YoY Volume Increase | Price vs. EU Baseline | Price vs. NZ Baseline |
|---|---|---|---|
| Cheese | +28% | 87% (€1.30 vs €1.50) | 90% (€1.30 vs €1.44) |
| Butter | +190% | 85% ($1.42 vs $1.67) | 88% ($1.42 vs $1.61) |
| AMF | +198% | 83% ($1.38 vs $1.66) | 86% ($1.38 vs $1.61) |
| Powder | +12% | 91% ($0.88 vs $0.97) | 92% ($0.88 vs $0.96) |
Butterfat Performance, Protein, and What’s Really Changing in the Tank
Now let’s step out of the export office and back into the milkhouse.

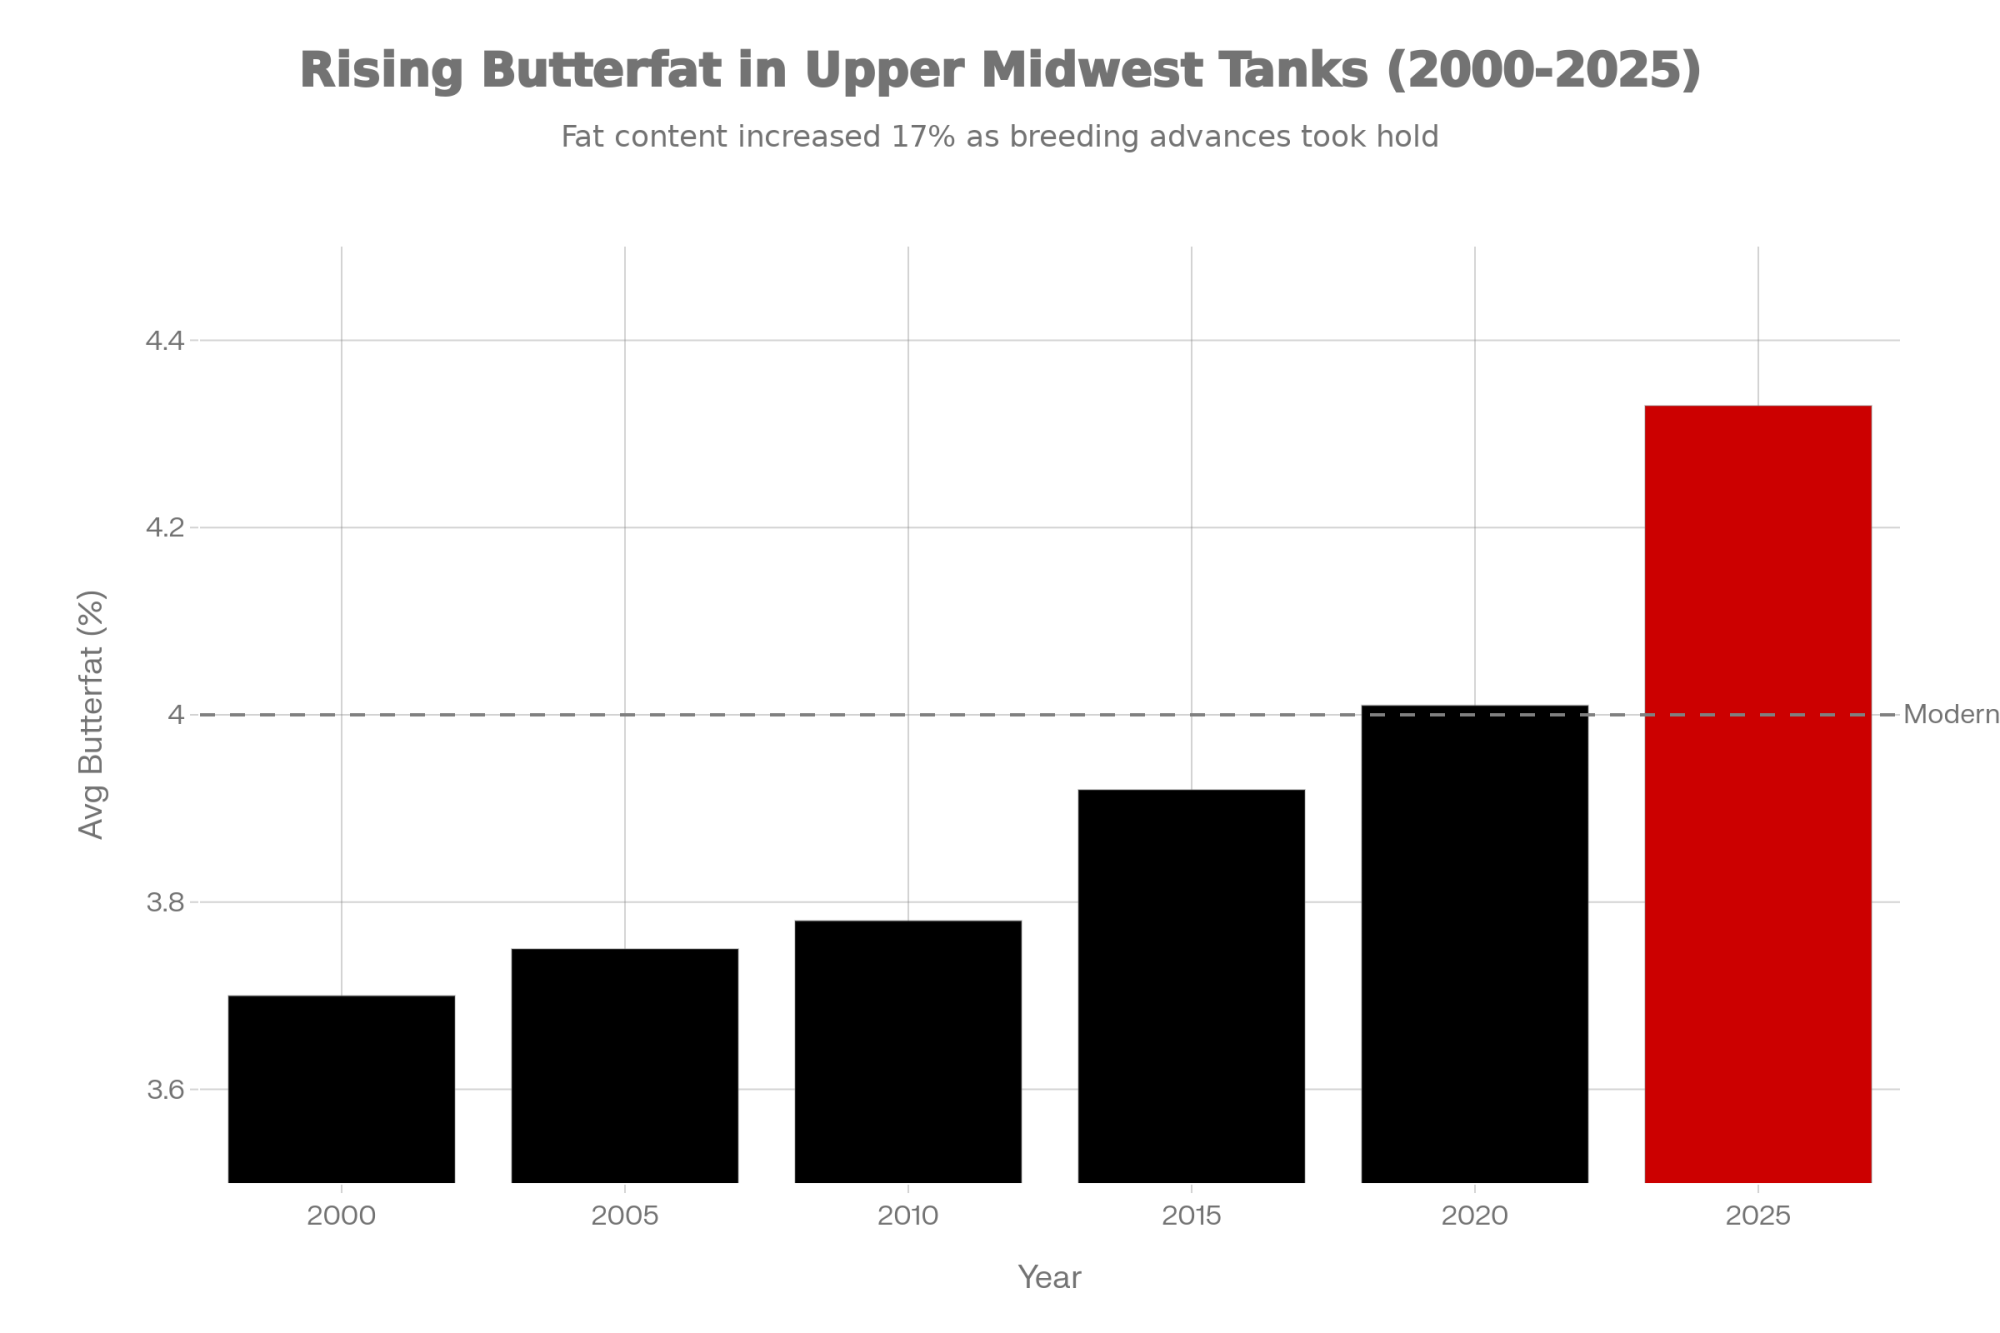
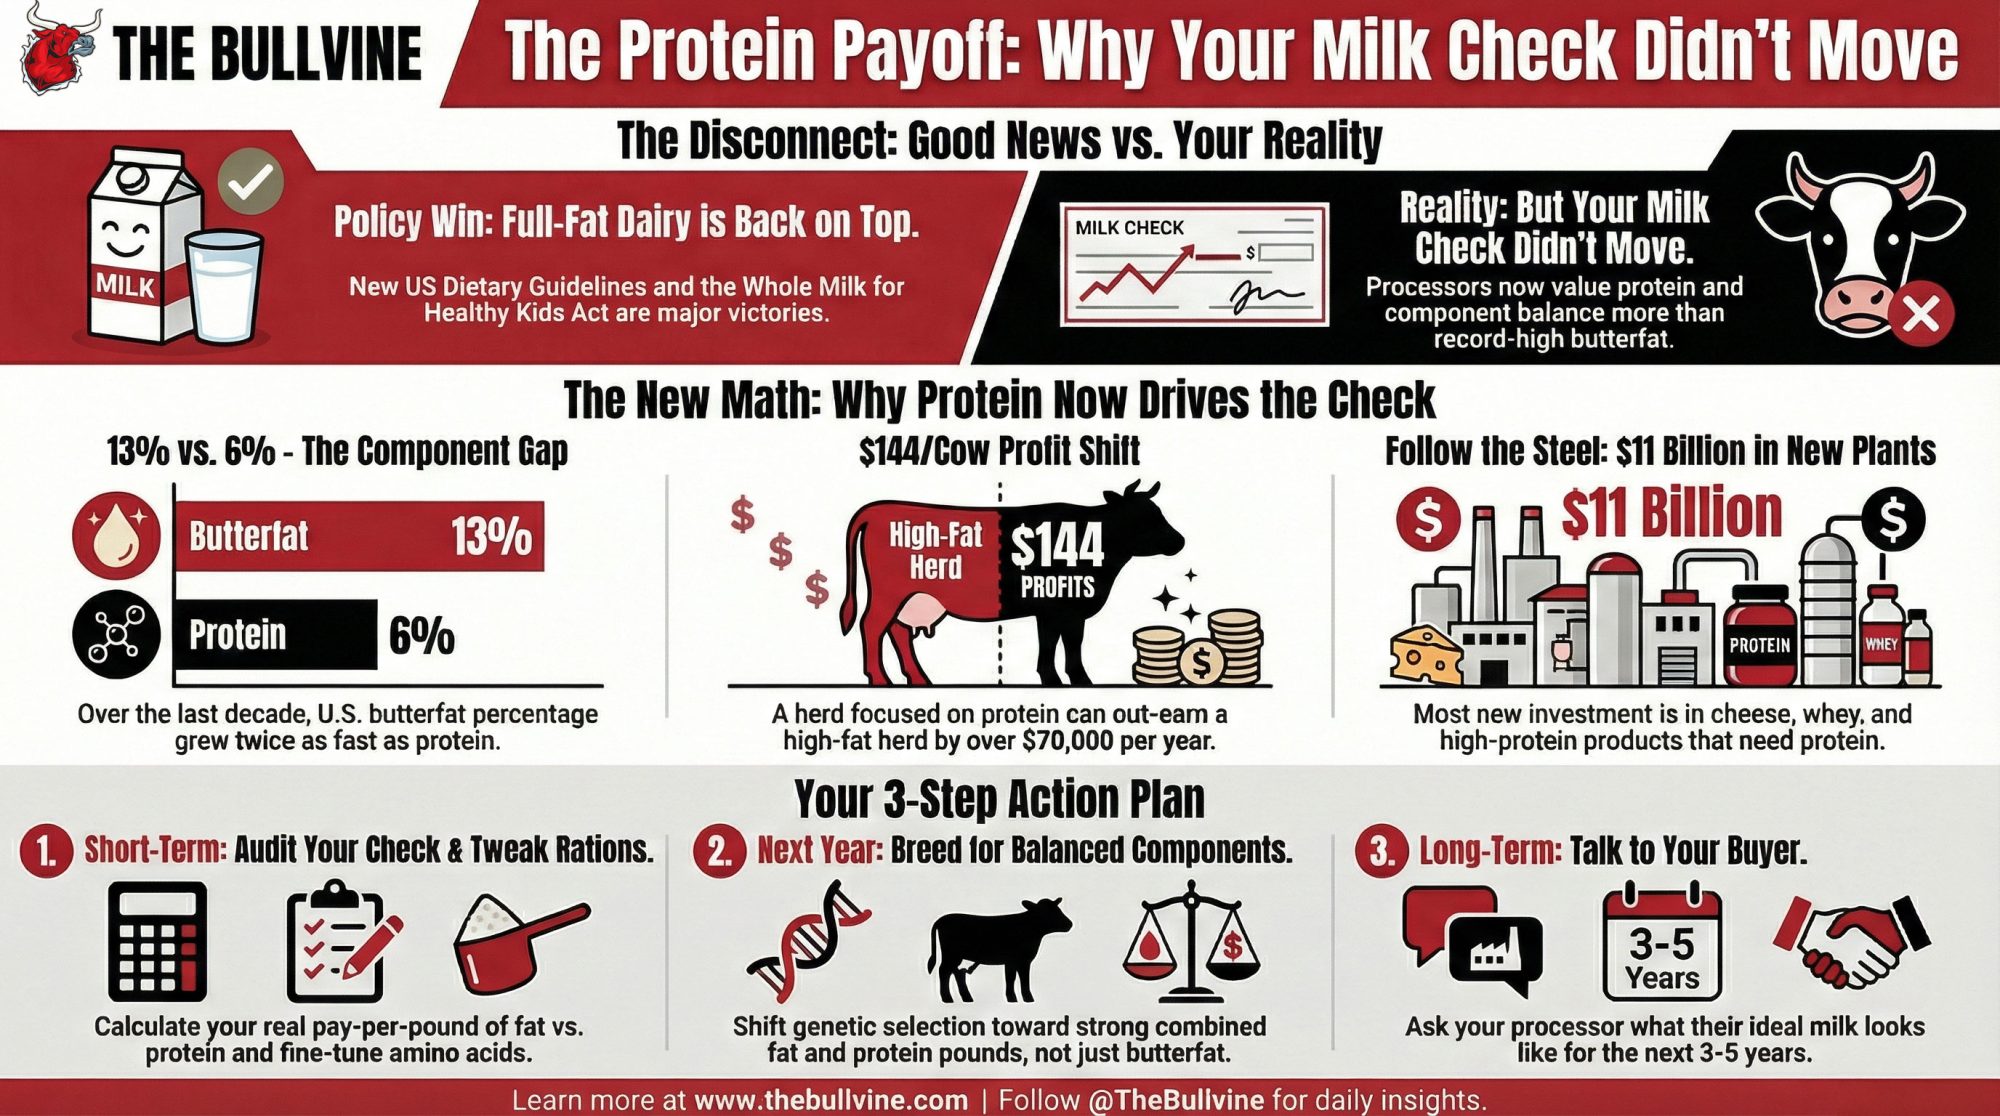
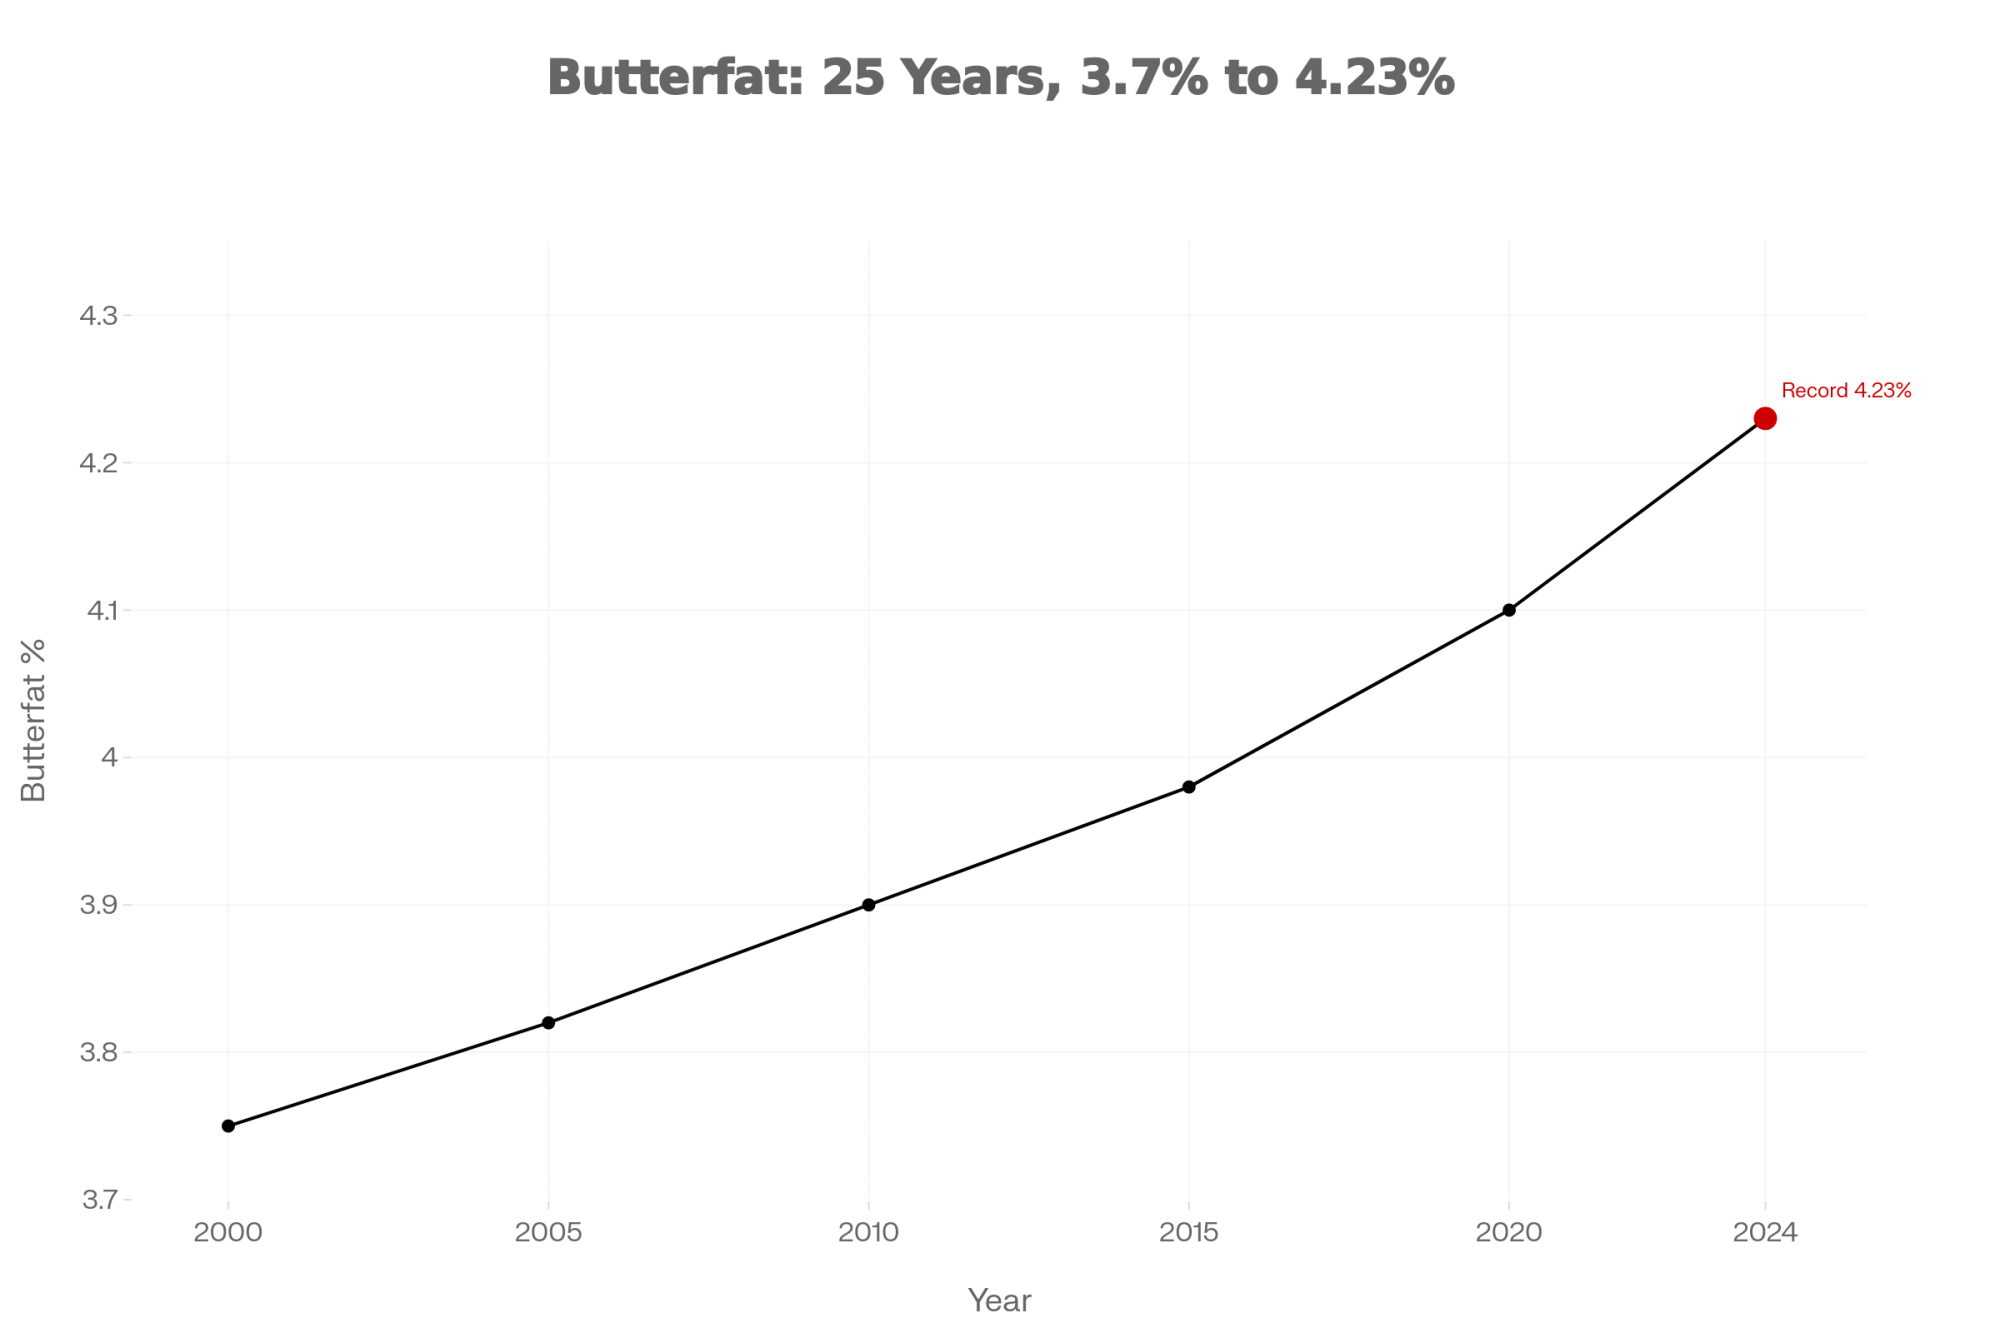
Looking at this trend over time, the component story on U.S. farms has been remarkable. Analysts’ pooled data show that from 2010 to 2024, total U.S. milk production in pounds grew by about 15.9%, while total butterfat pounds climbed by about 30.6%. Average butterfat tests moved from roughly 3.80% into the low‑4% range during that period.
By early 2025, butterfat production was running 3–4% higher year‑over‑year, even though total milk volume was up less than 1%. That’s a huge butterfat performance story.
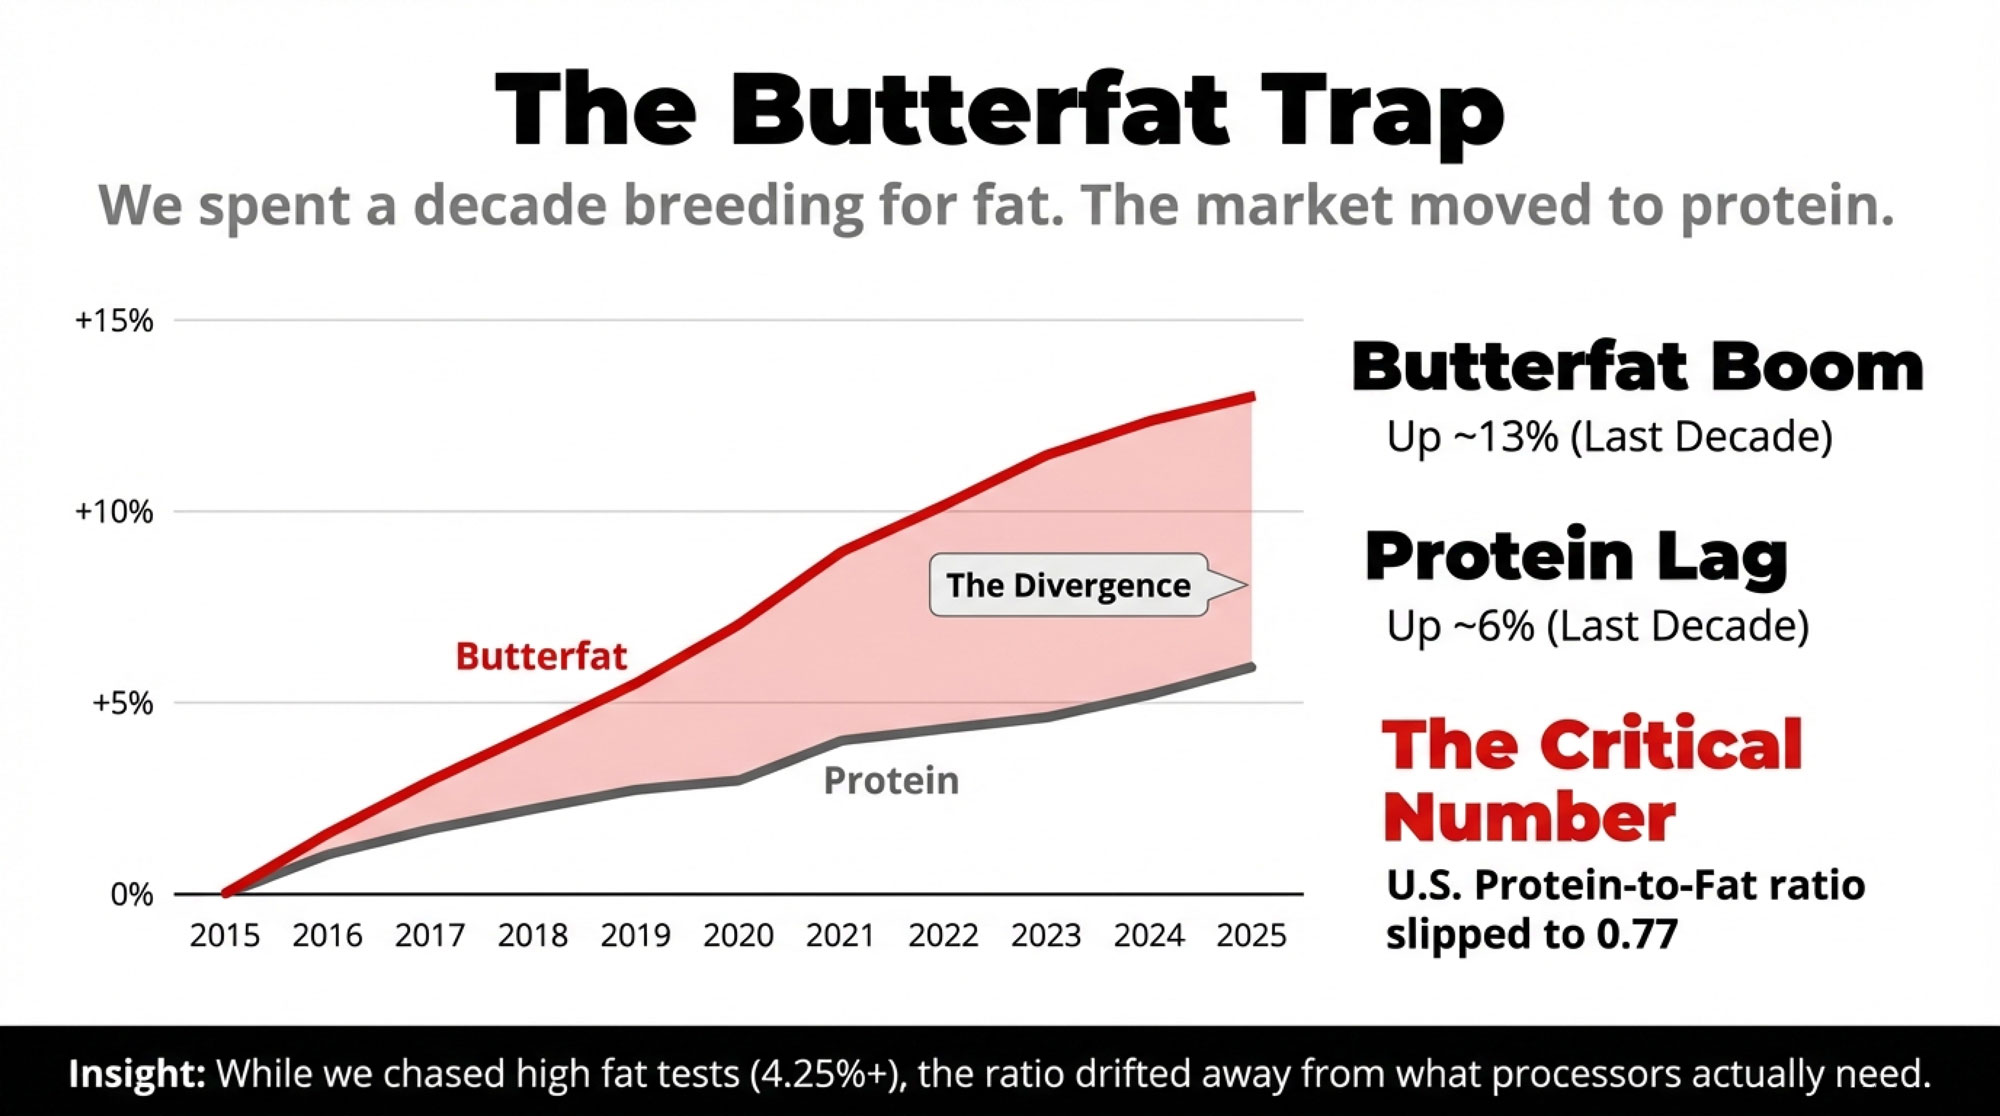
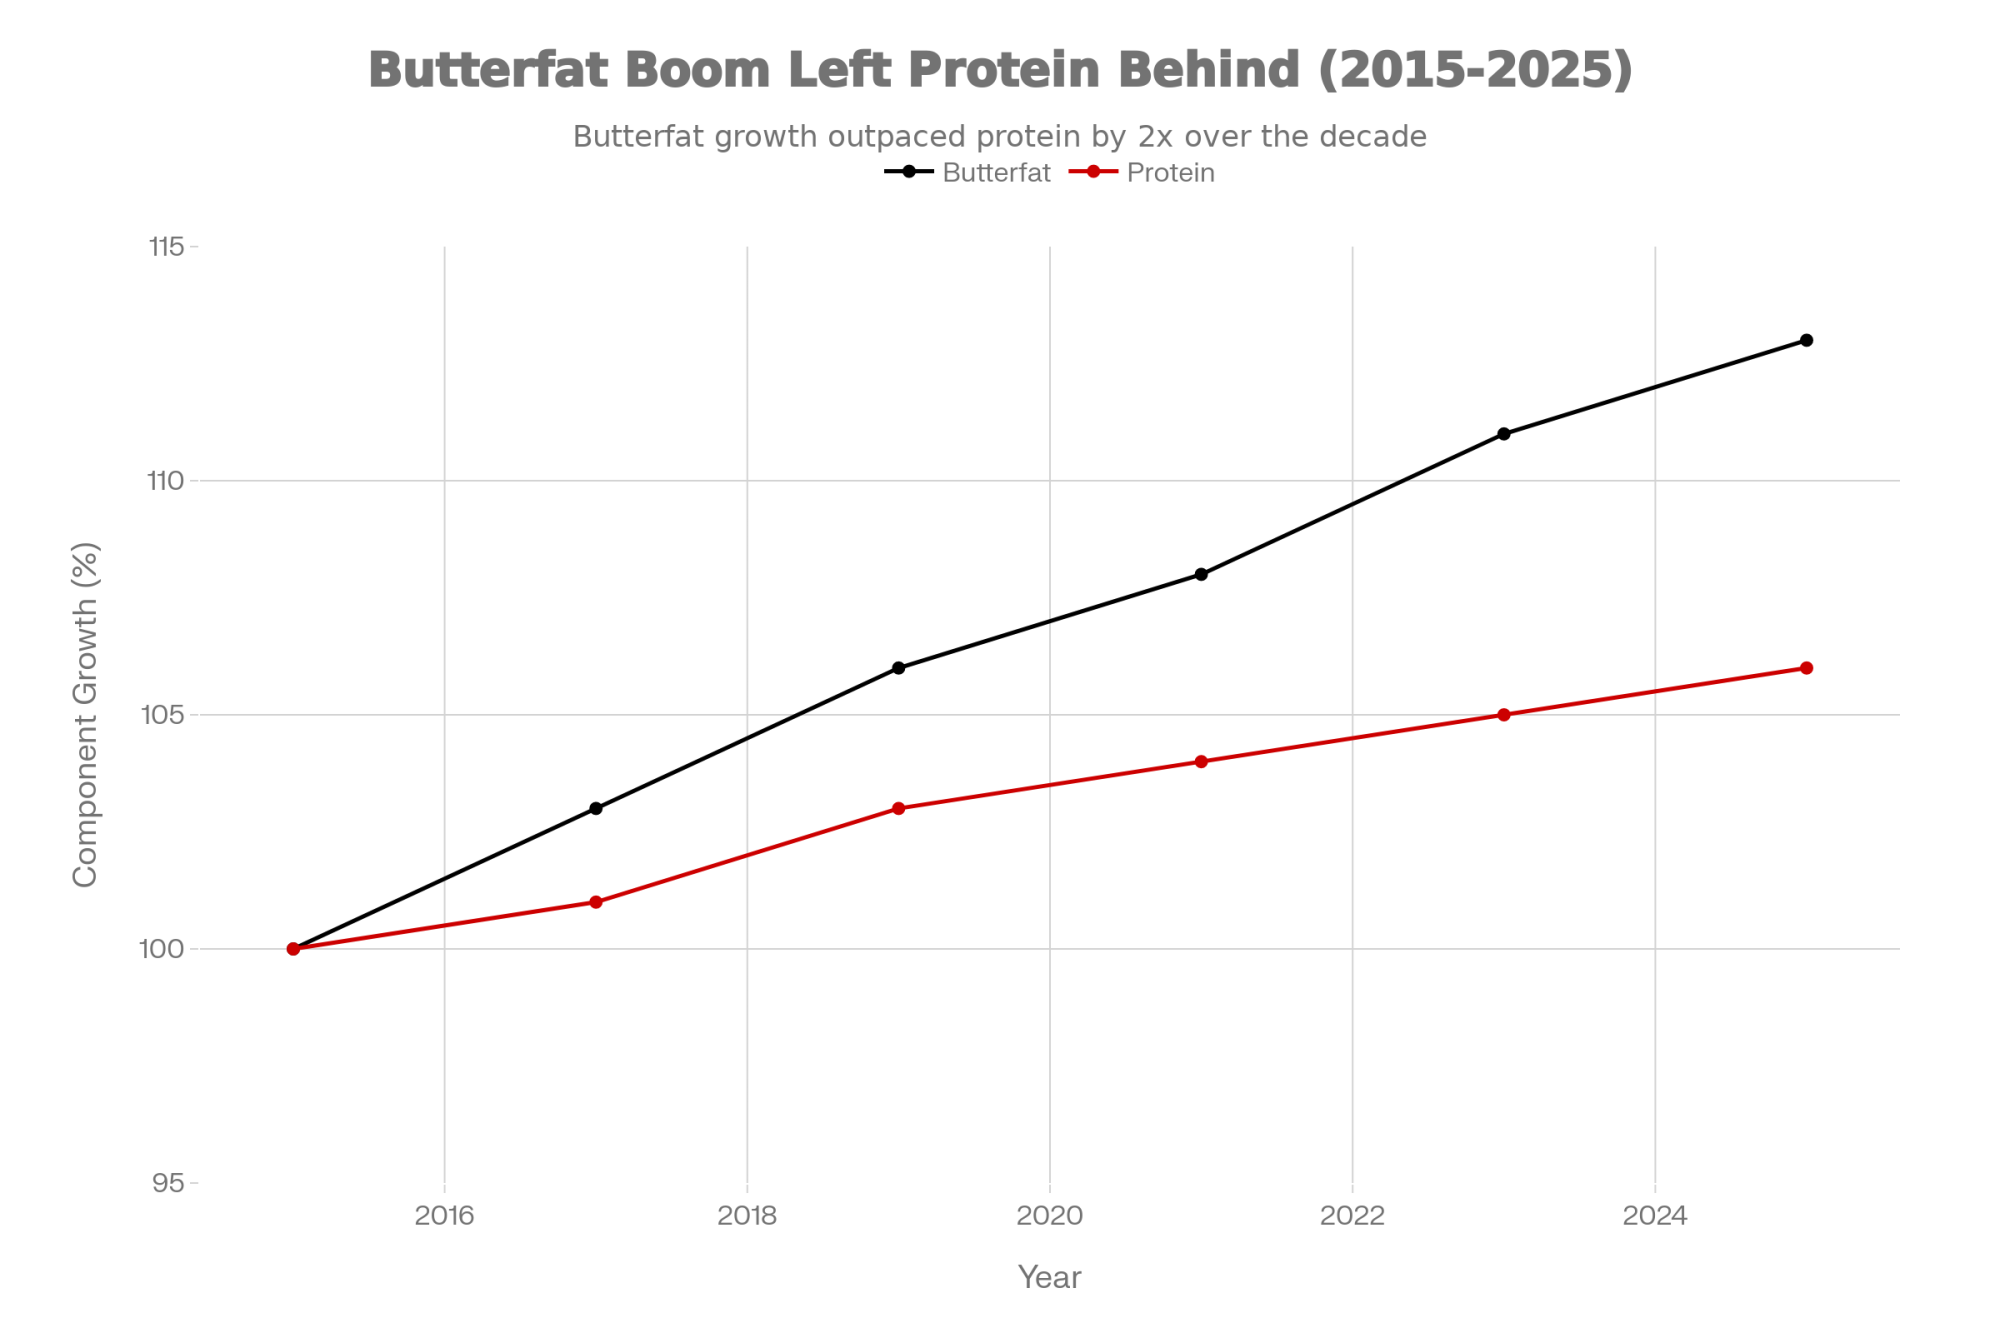
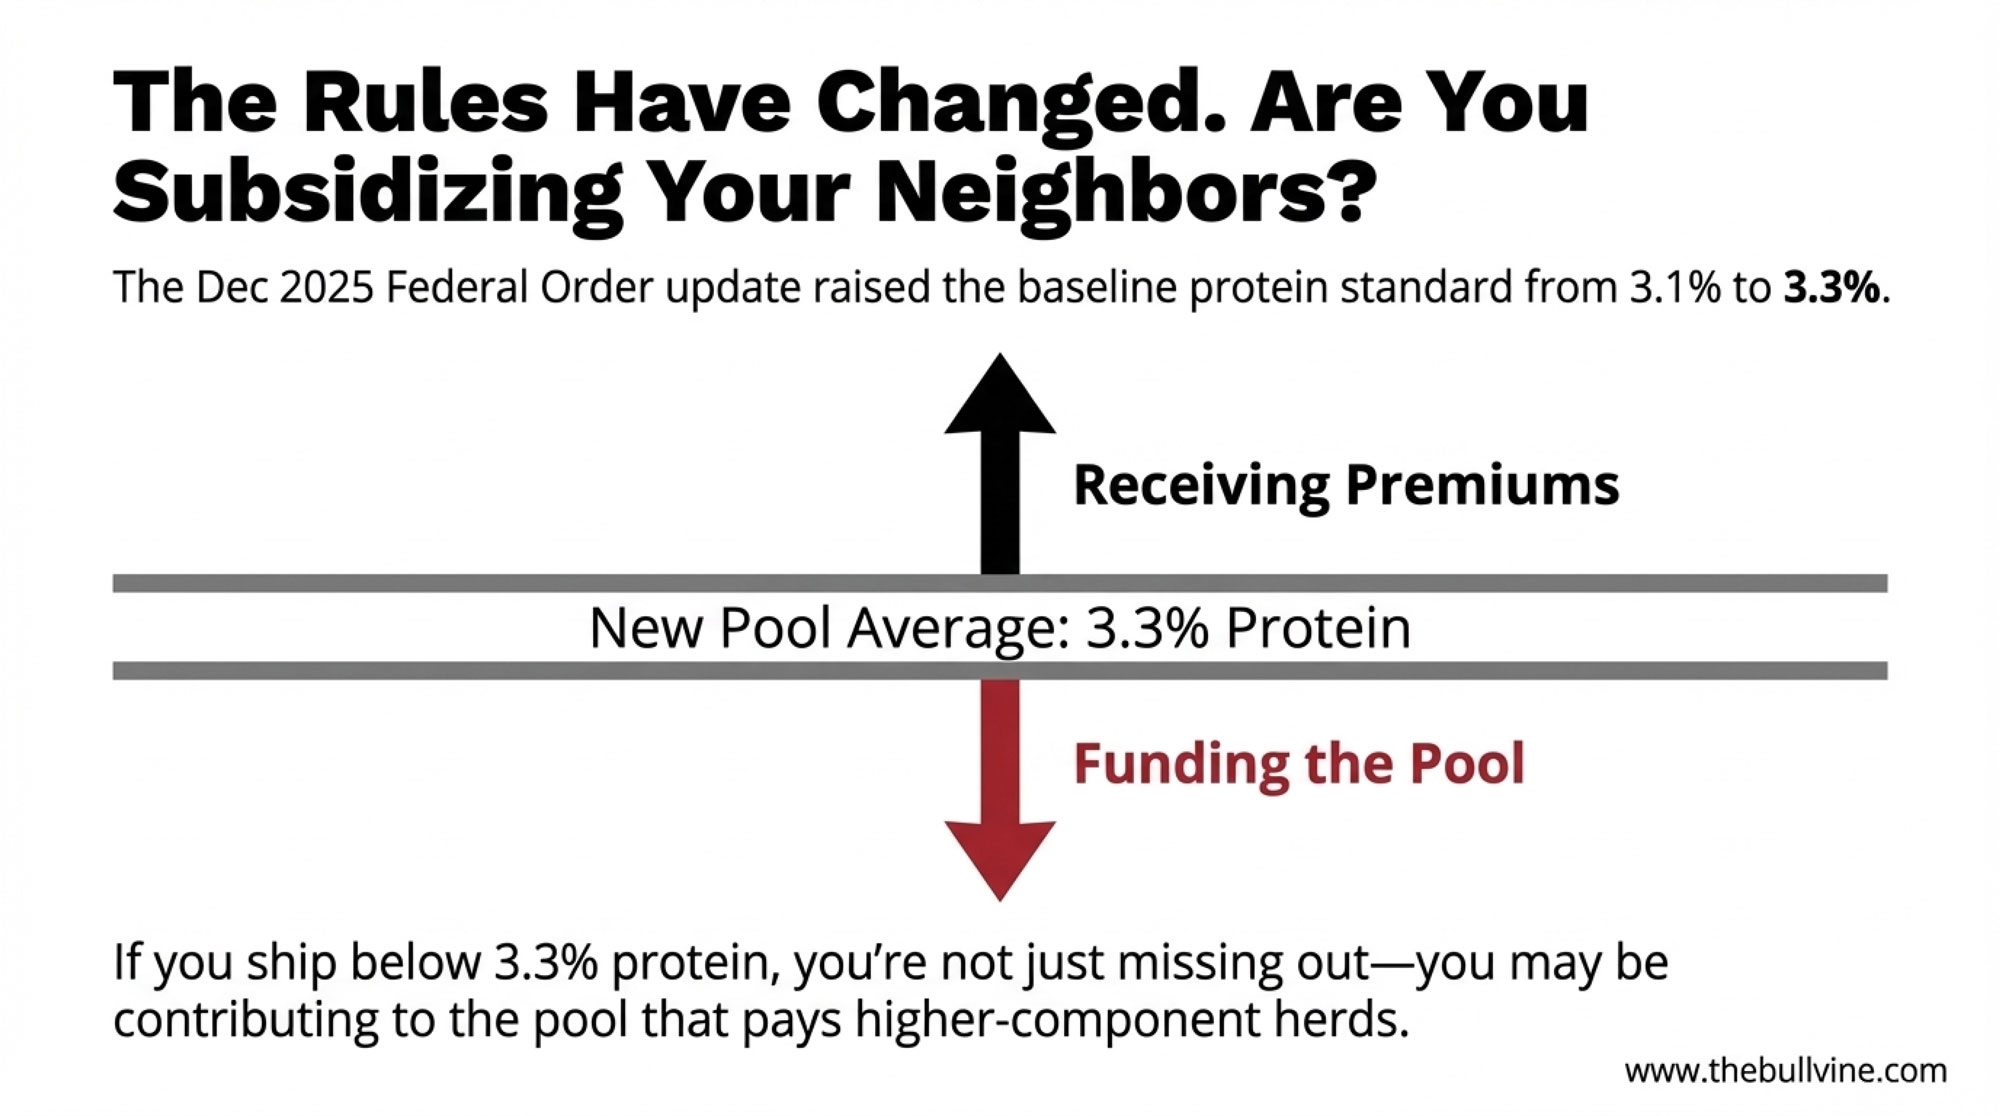
CoBank’s report “While U.S. Leads Milk Component Growth, Butterfat May Be Growing Too Fast” adds a global lens. It notes that over about a decade, U.S. butterfat levels increased roughly 13%, while comparable gains in the EU and New Zealand were closer to 2–3%. Over the same period, U.S. protein rose from just over 3.1% to about 3.29%, roughly a 6% bump.
The U.S. is growing components faster than many of our global competitors, and those components are increasingly what matter in dairy markets. That’s a genuine advantage for cheese, butter, and protein ingredients.
Here’s where it gets more complicated. CoBank points out that butterfat has led the milk check in eight of the last 10 years, creating what they call a “tremendous butterfat boom.” Genetics, nutrition, and even fresh cow managementhave been tuned to push fat as far as possible because, most years, it paid.
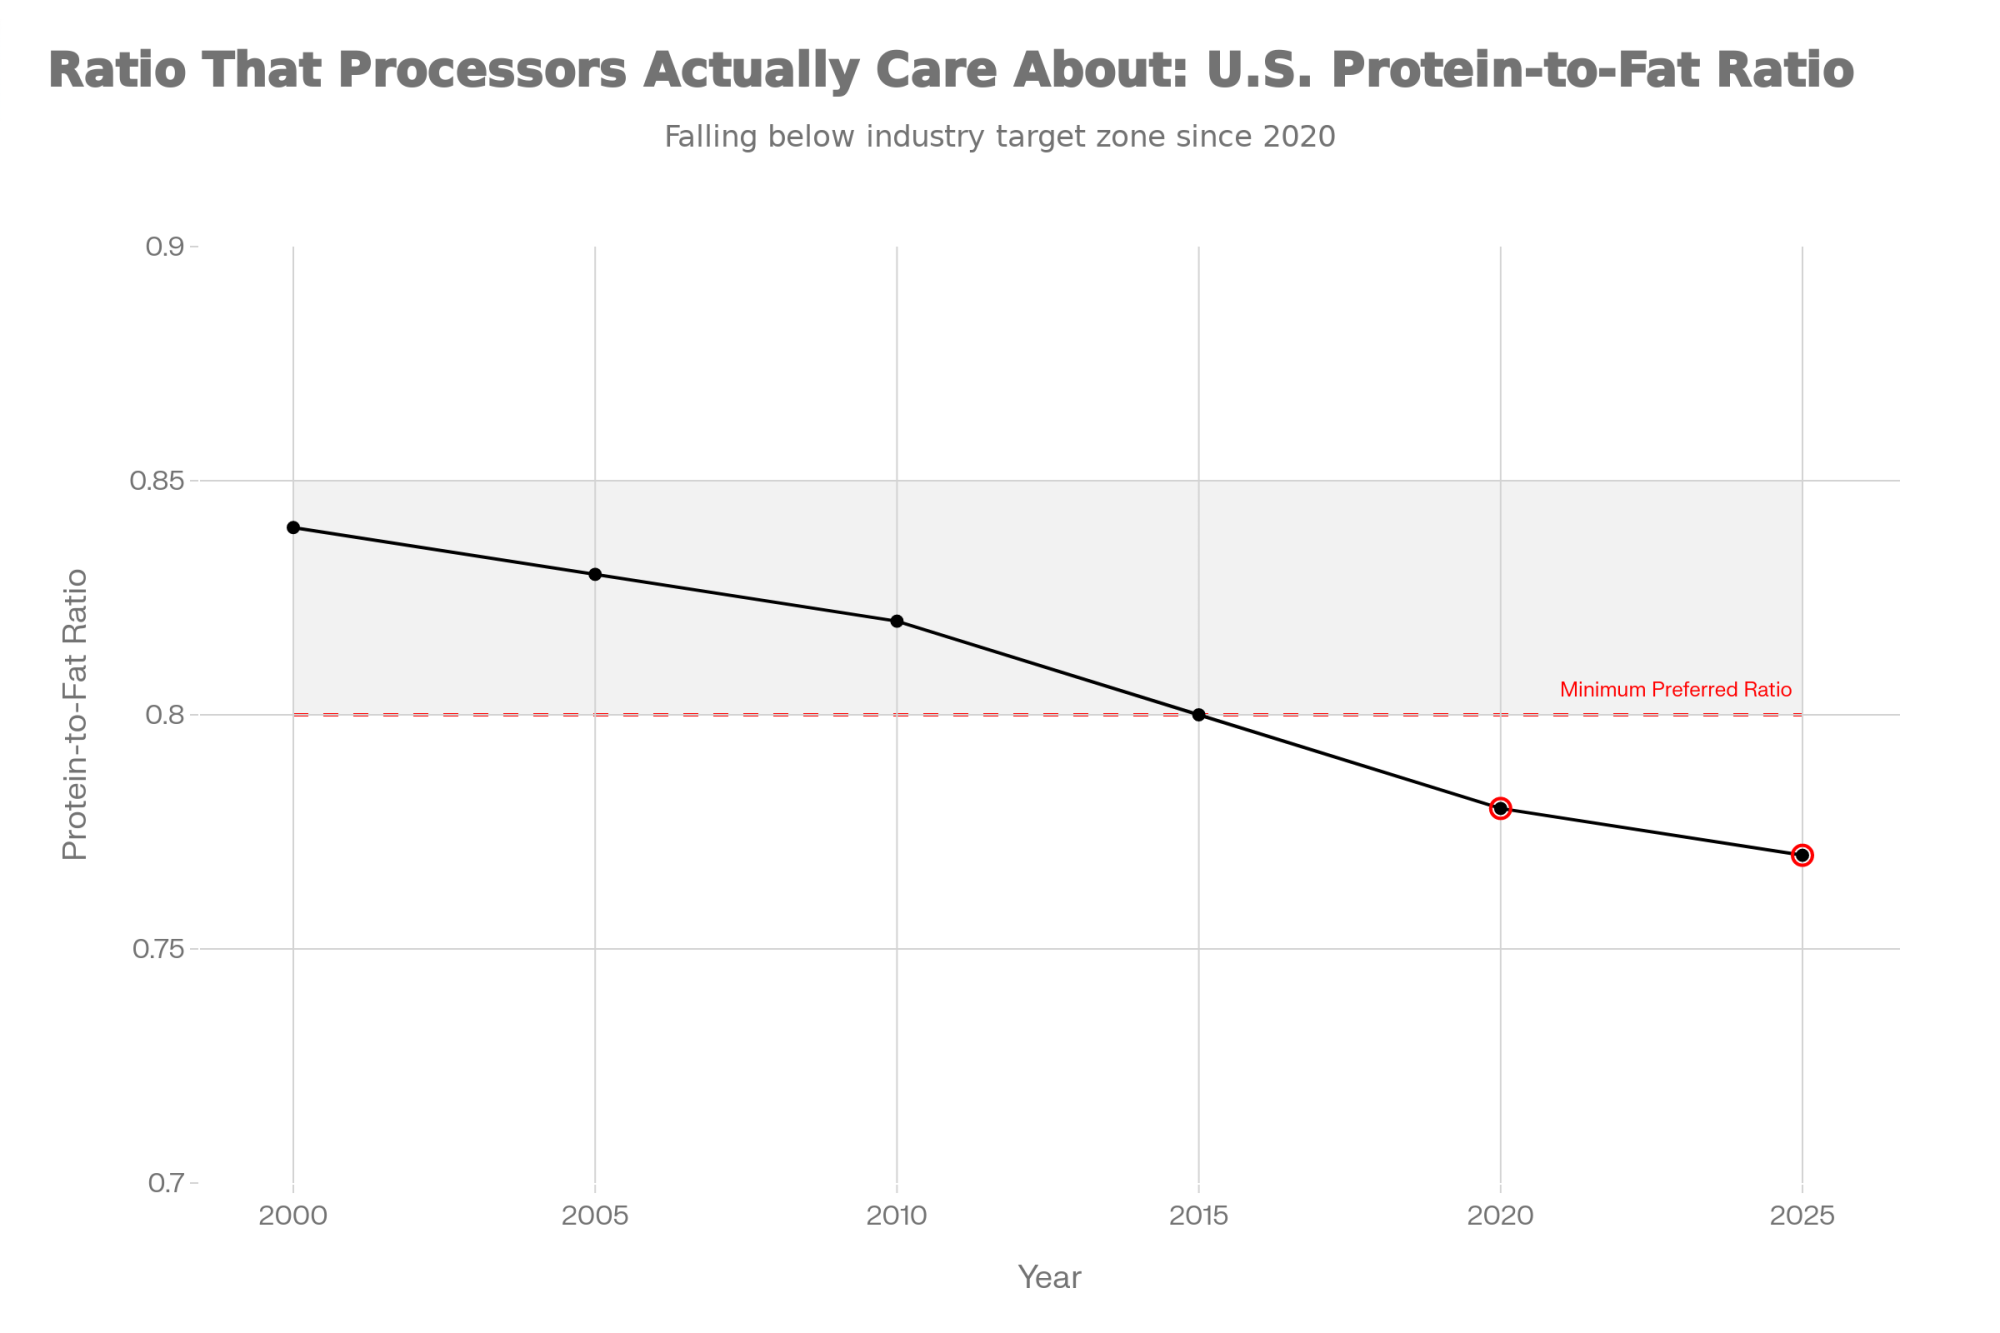
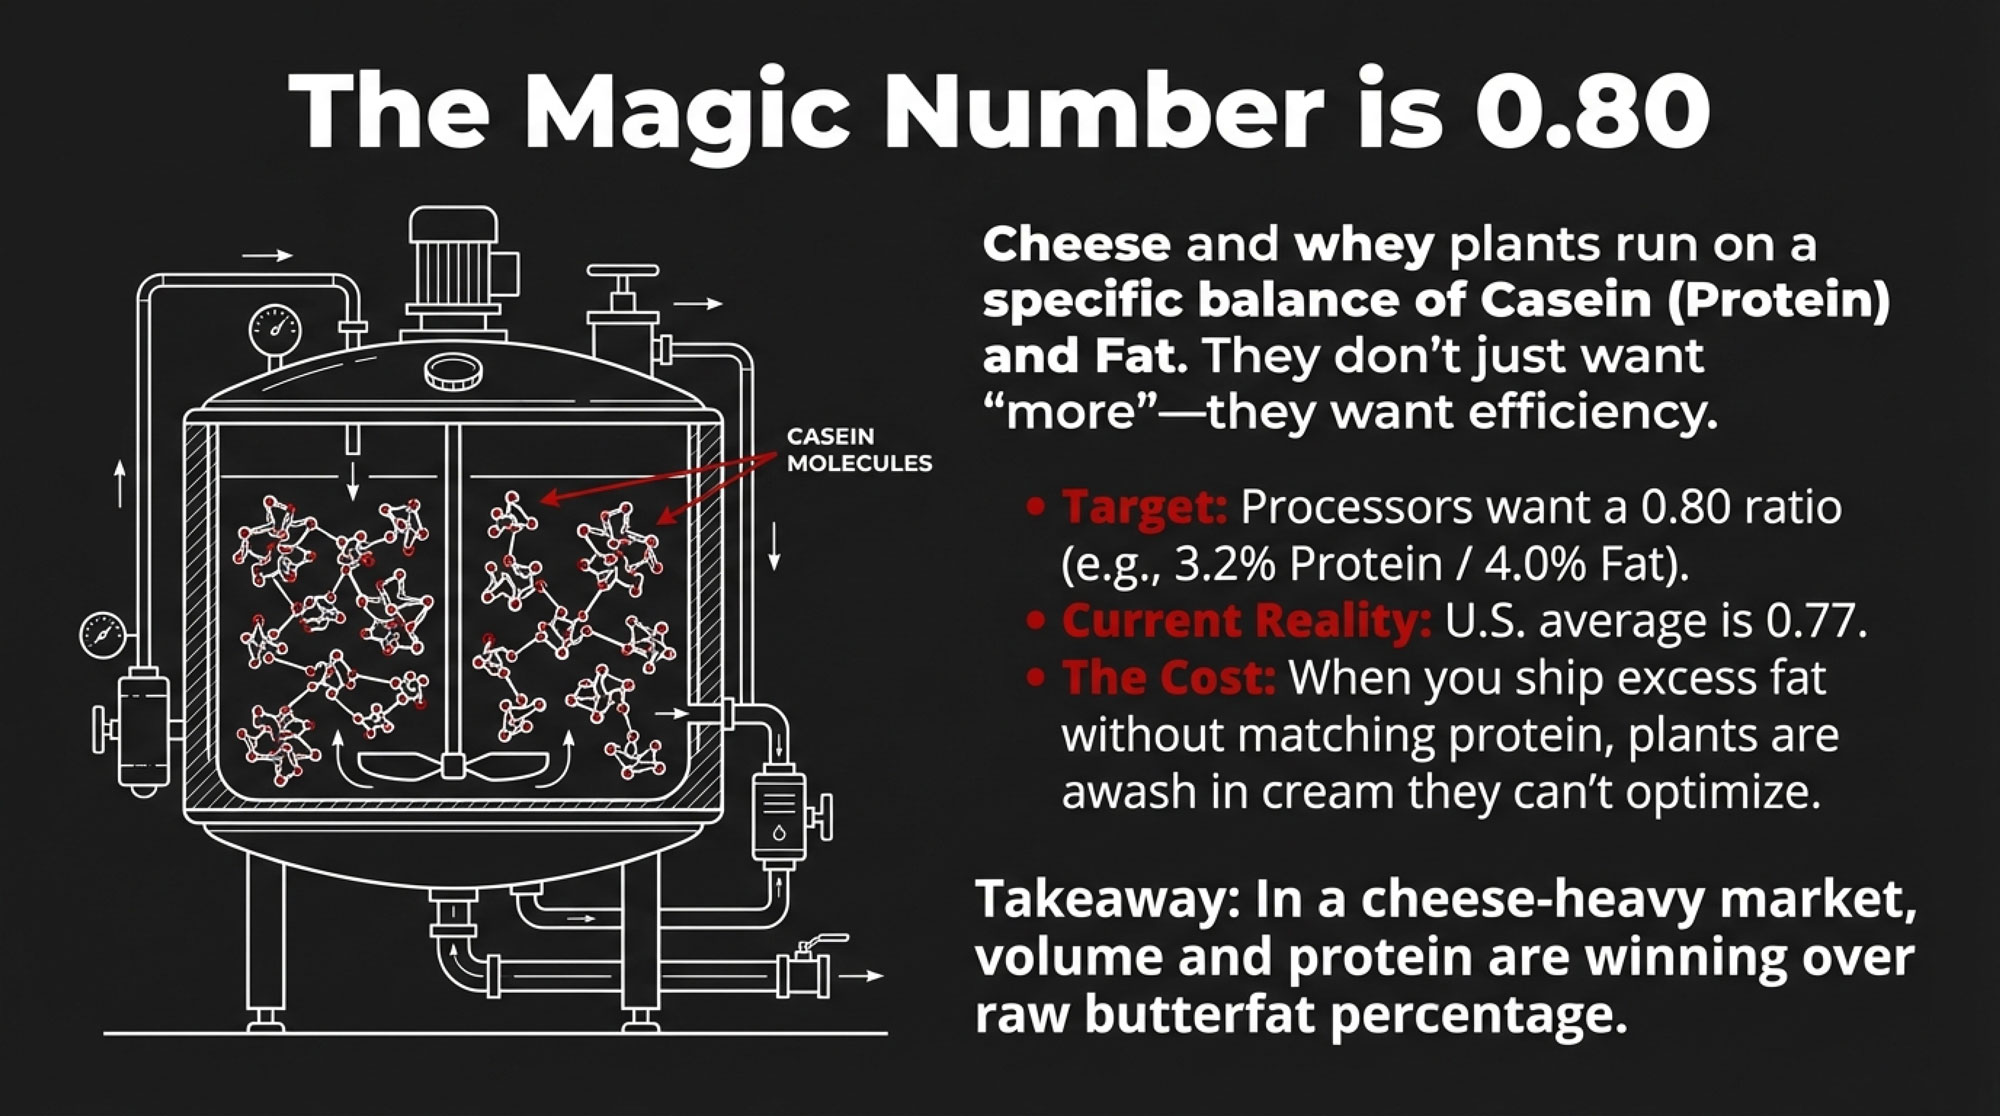
Now, CoBank and others are asking whether we might have overshot in some systems. Their report warns that if butterfat and protein keep growing at current rates, processors will face rising costs to either back extra fat out or add protein to meet cheese and ingredient specs, which “ultimately reduces competitiveness on the export front.” Geiger noted that in some markets “we’ve just got a little bit too much extra supply of butterfat,” which has helped pull butter prices down, even though consumption is still solid.
If you’re still breeding and feeding like butterfat is the only game in town, your plant’s pay grid and the export reality might be telling you a different story.
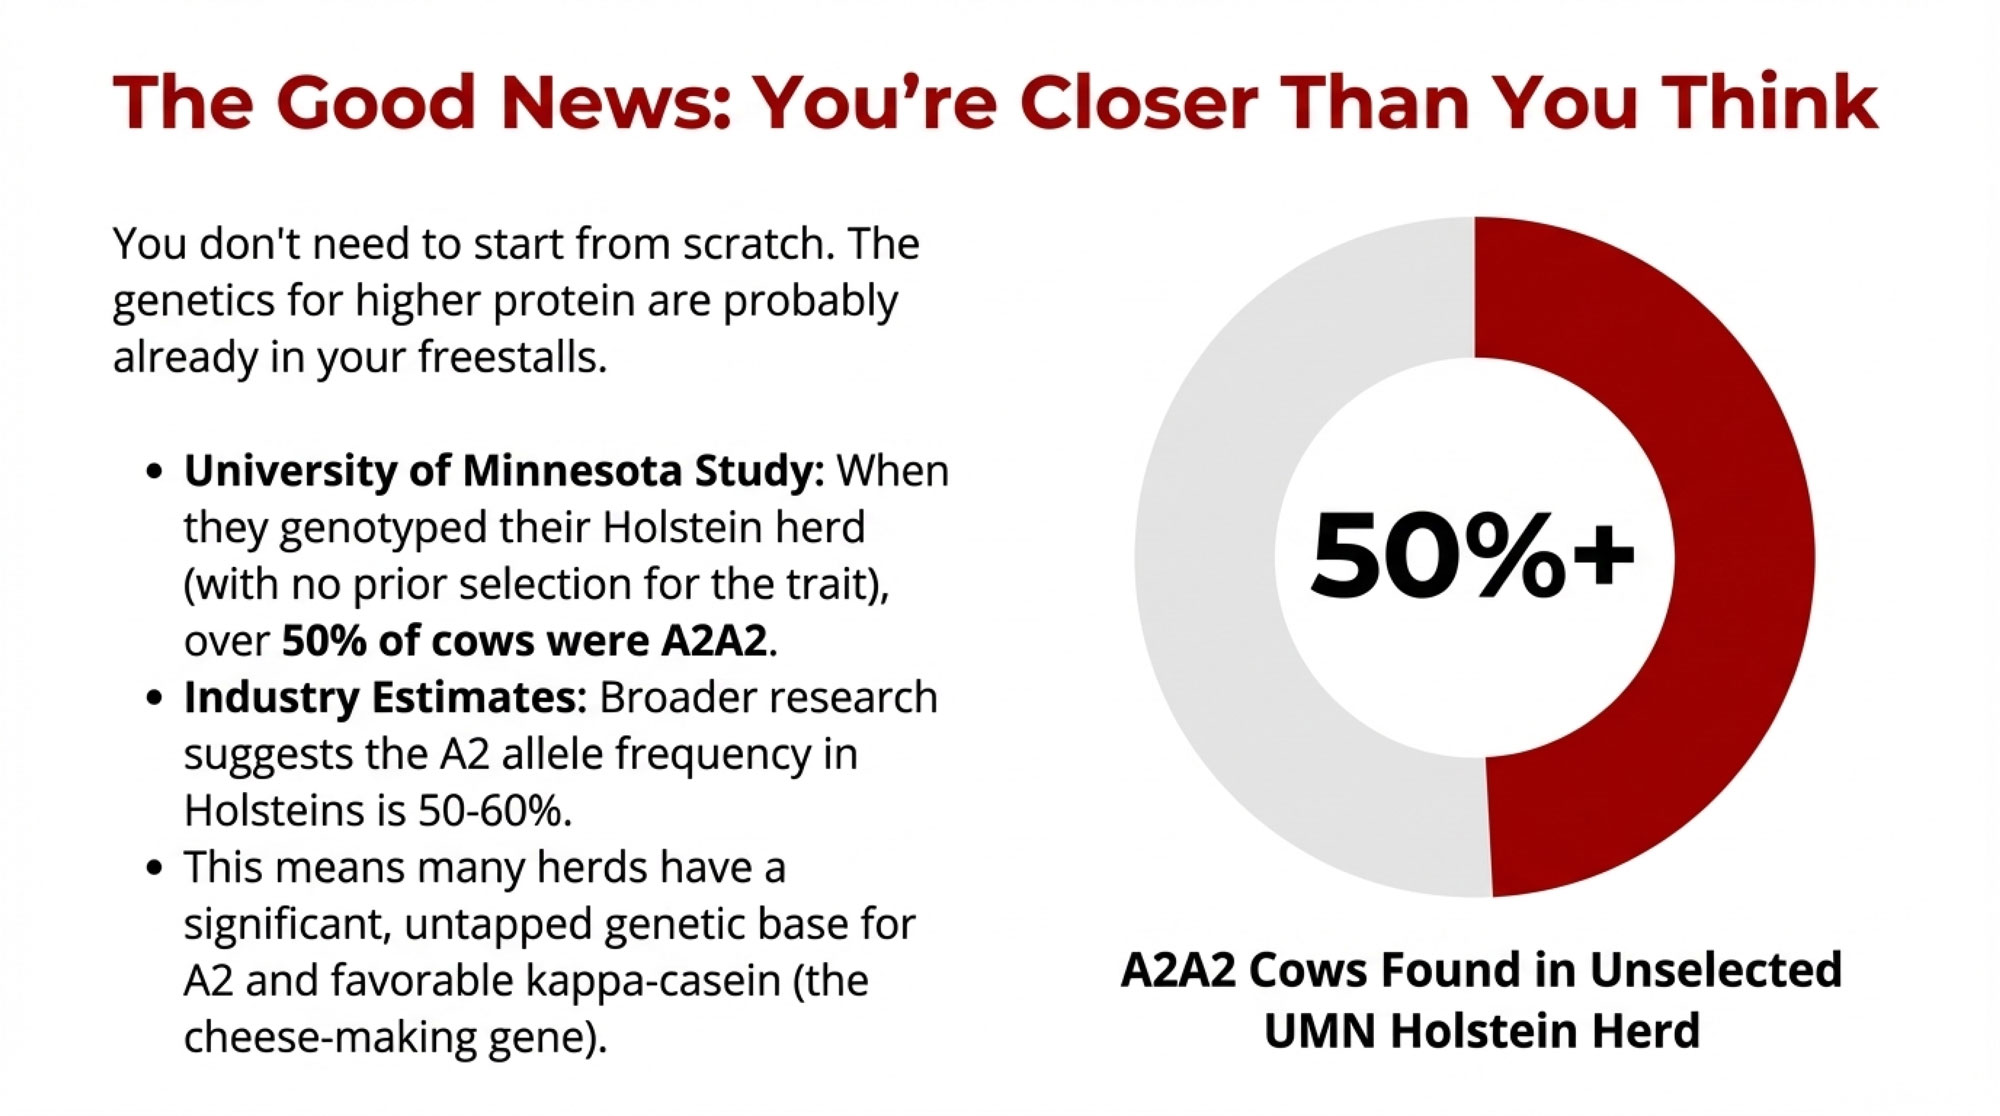
Our own genetics features and CoBank’s component work both highlight herds that are now selecting more for pounds of fat and protein, total solids, and better protein‑to‑fat ratios, especially where plants pay on cheese yield and casein‑related traits. In those systems, the winning milk isn’t just high‑fat; it’s balanced for yield and specs.
Academic work backs that up. An economic study from Brazil on milk pricing found that under component‑based payment systems, protein often carries greater marginal economic weight than fat because of its role in cheese yield and solids content. A 2024 review in Foods (MDPI) on “Emerging Parameters Justifying a Revised Quality Concept for Cow Milk” argues that modern milk quality needs to account much more for functional properties—especially protein fractions—than in the past.
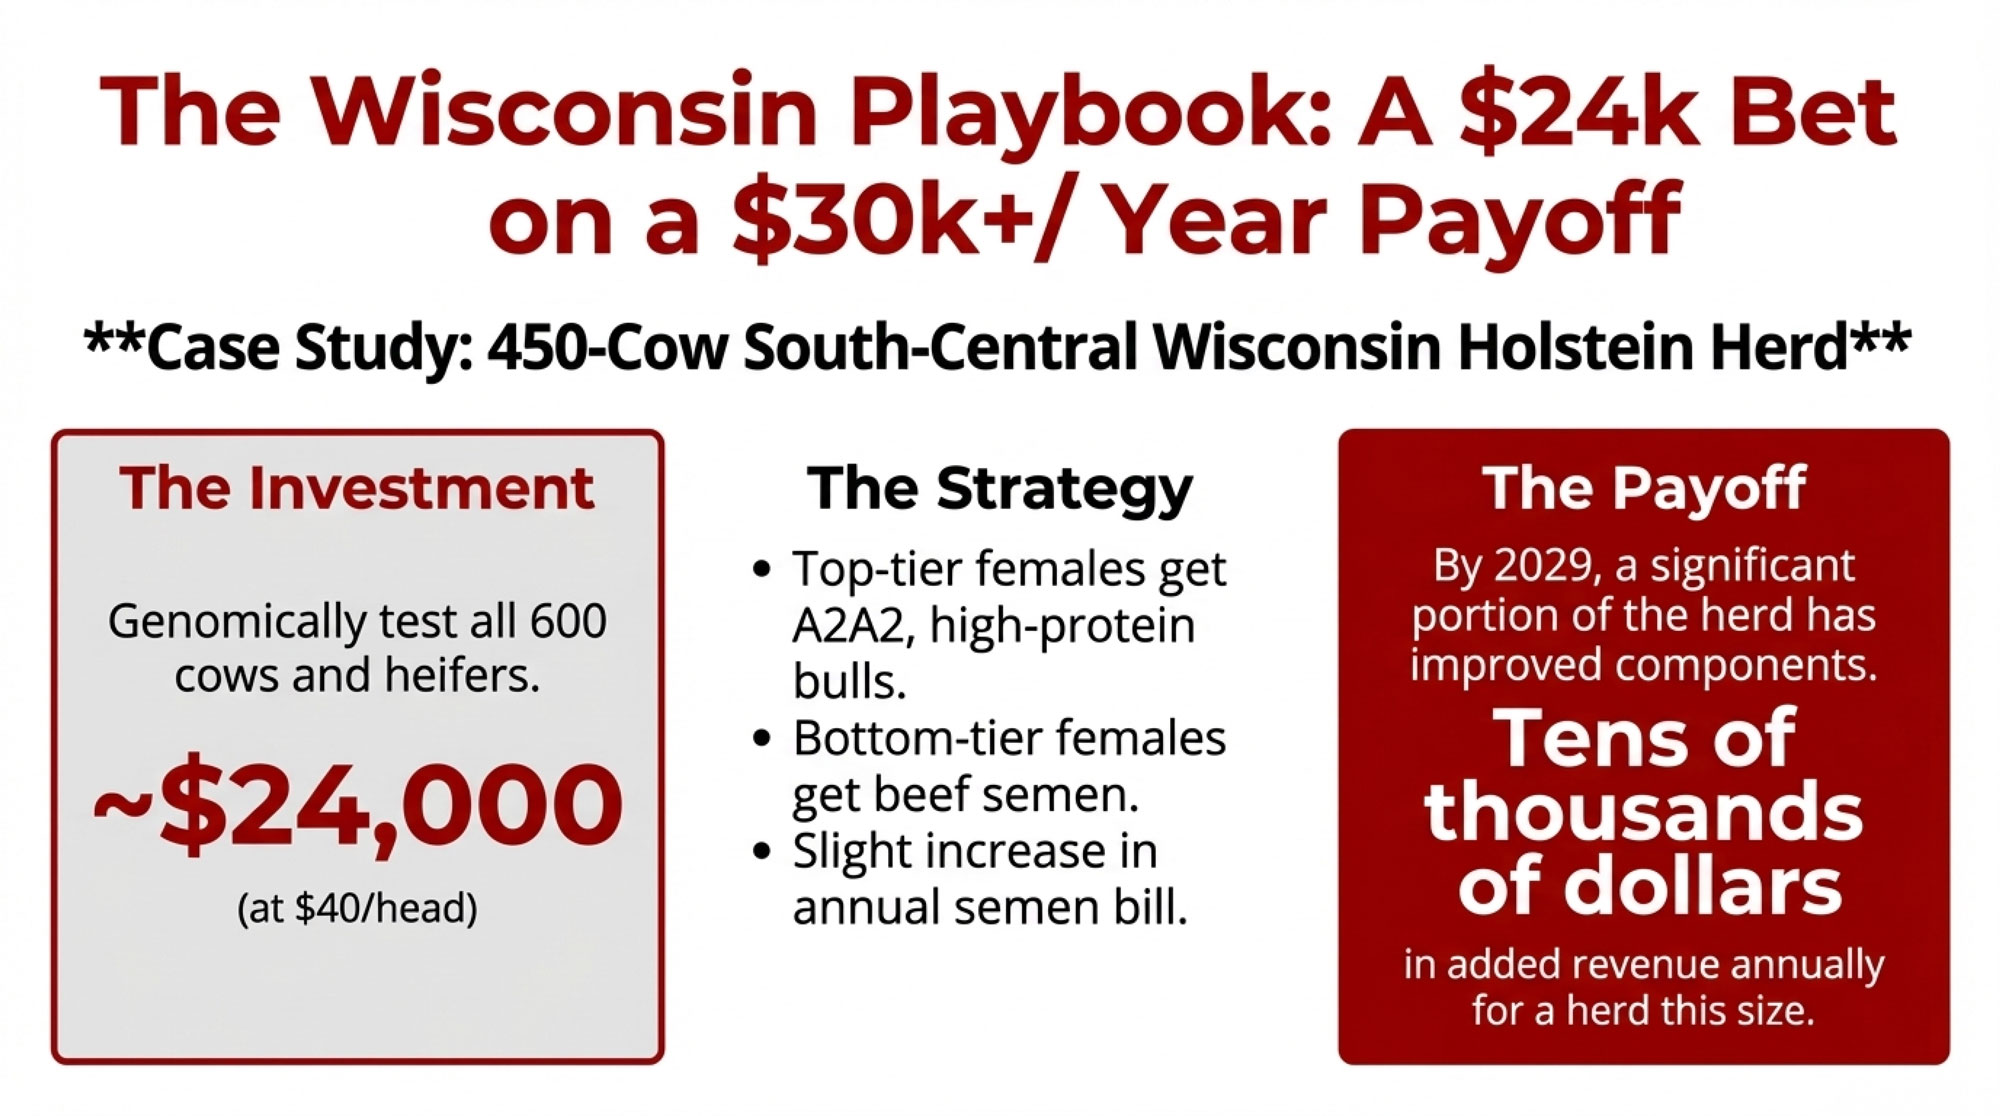
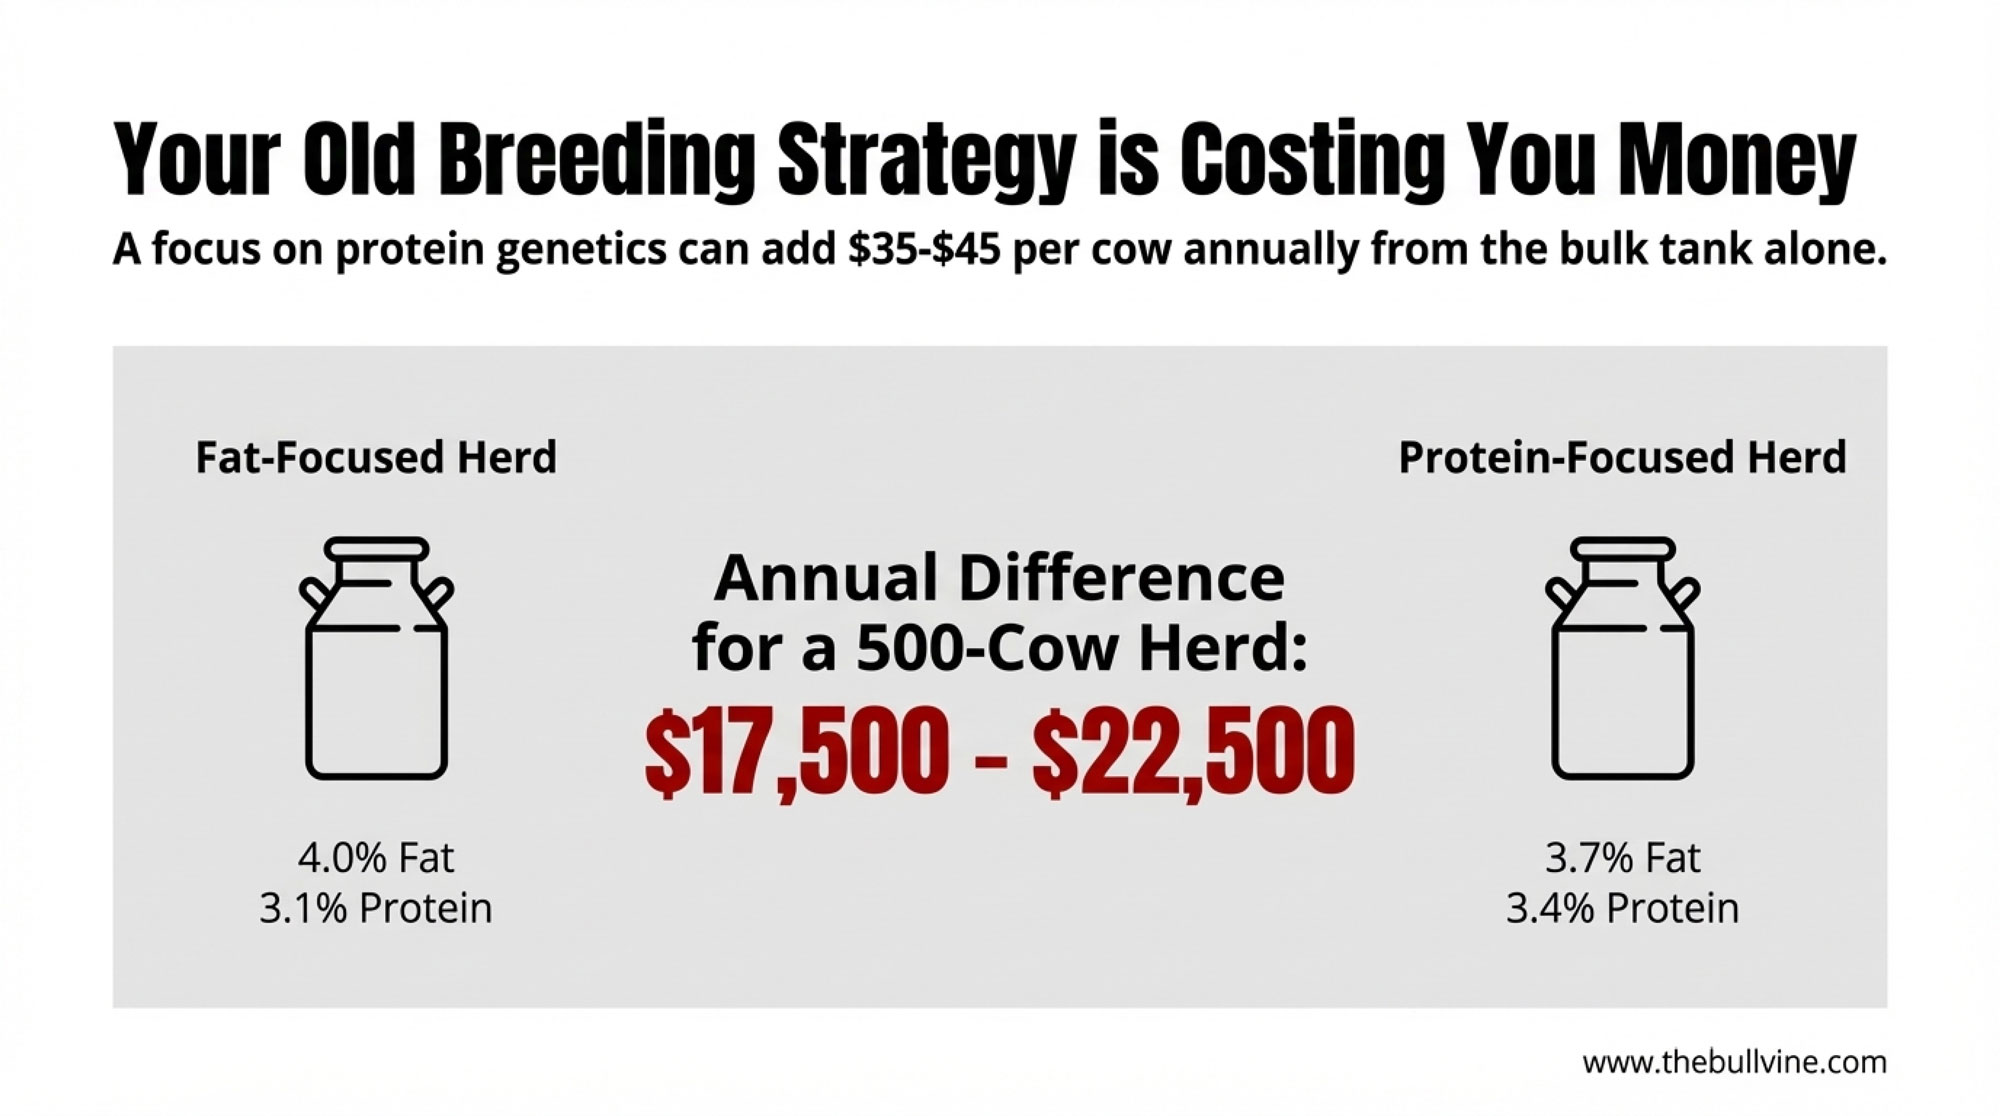
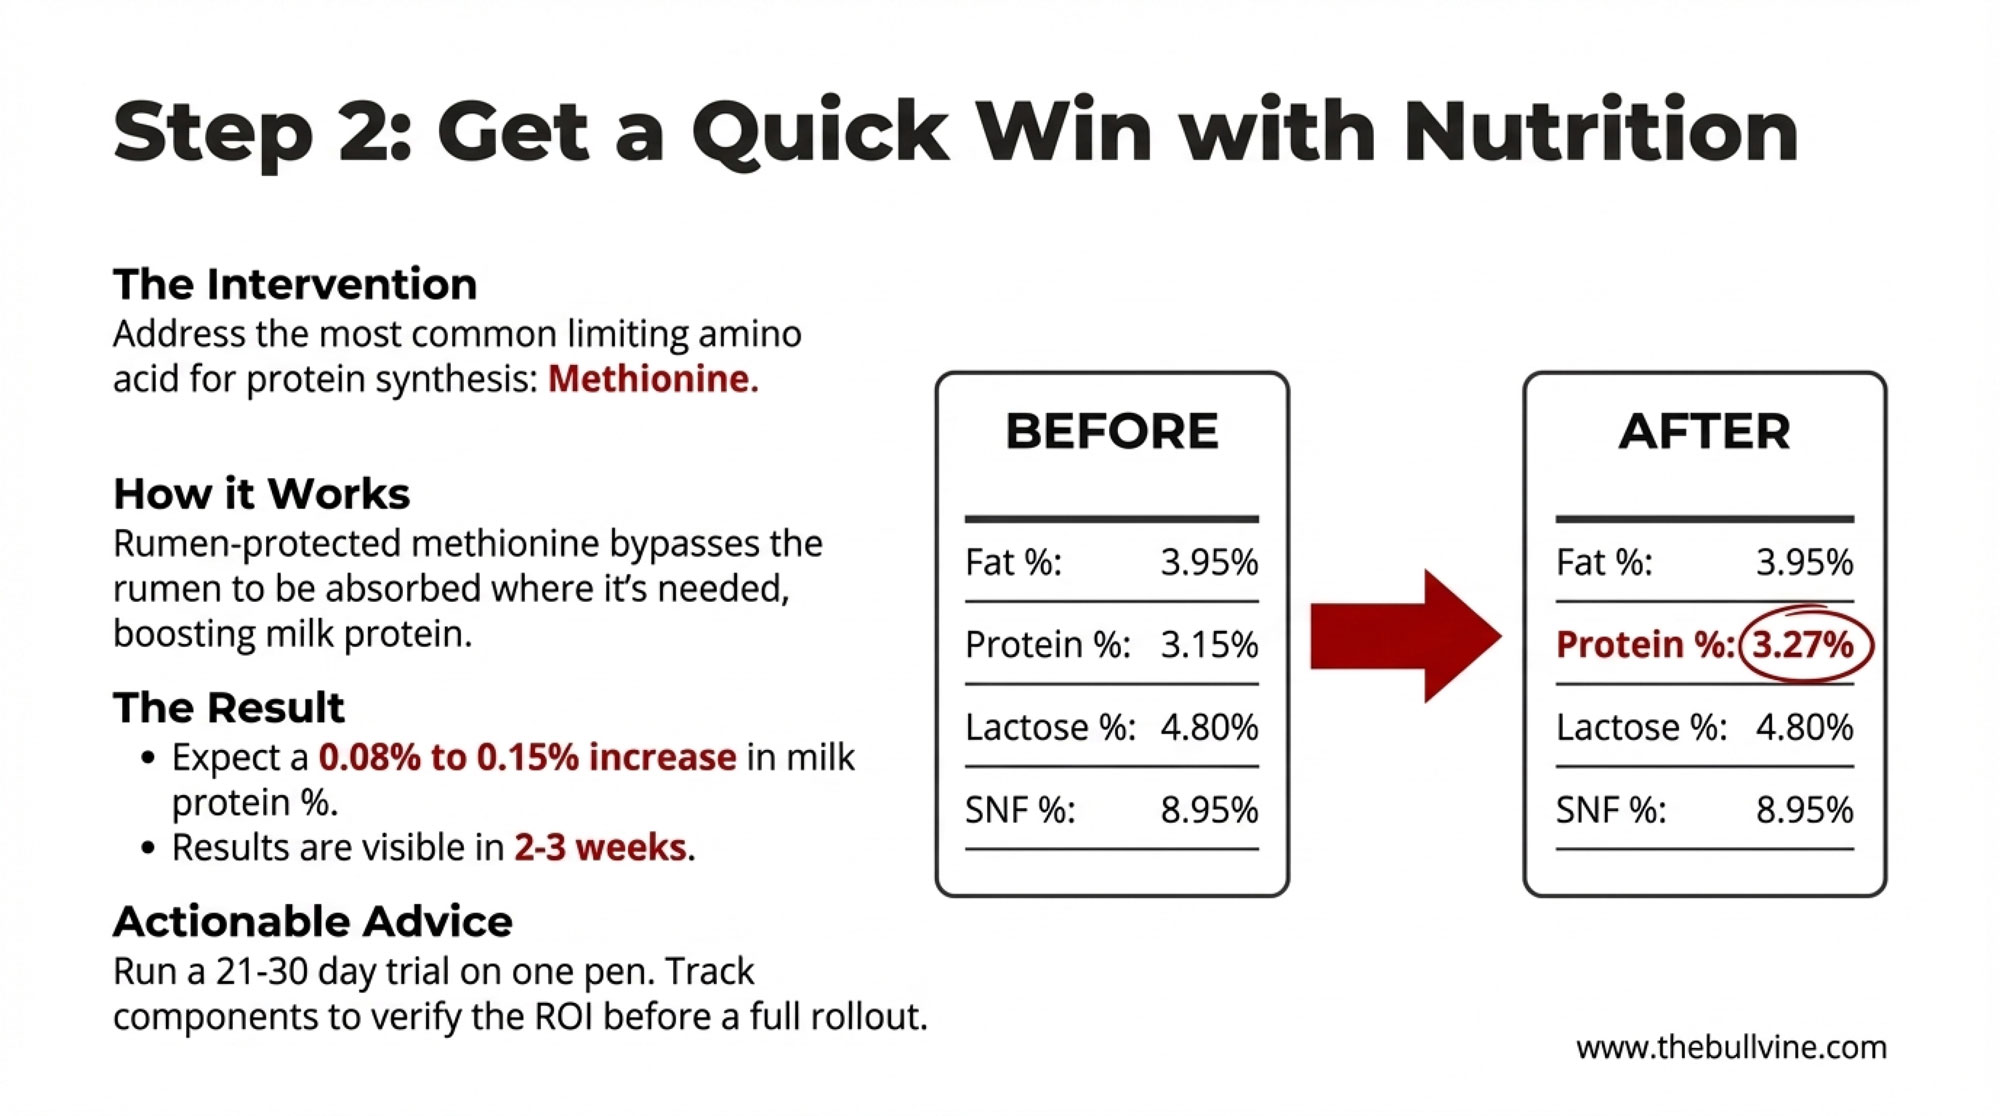
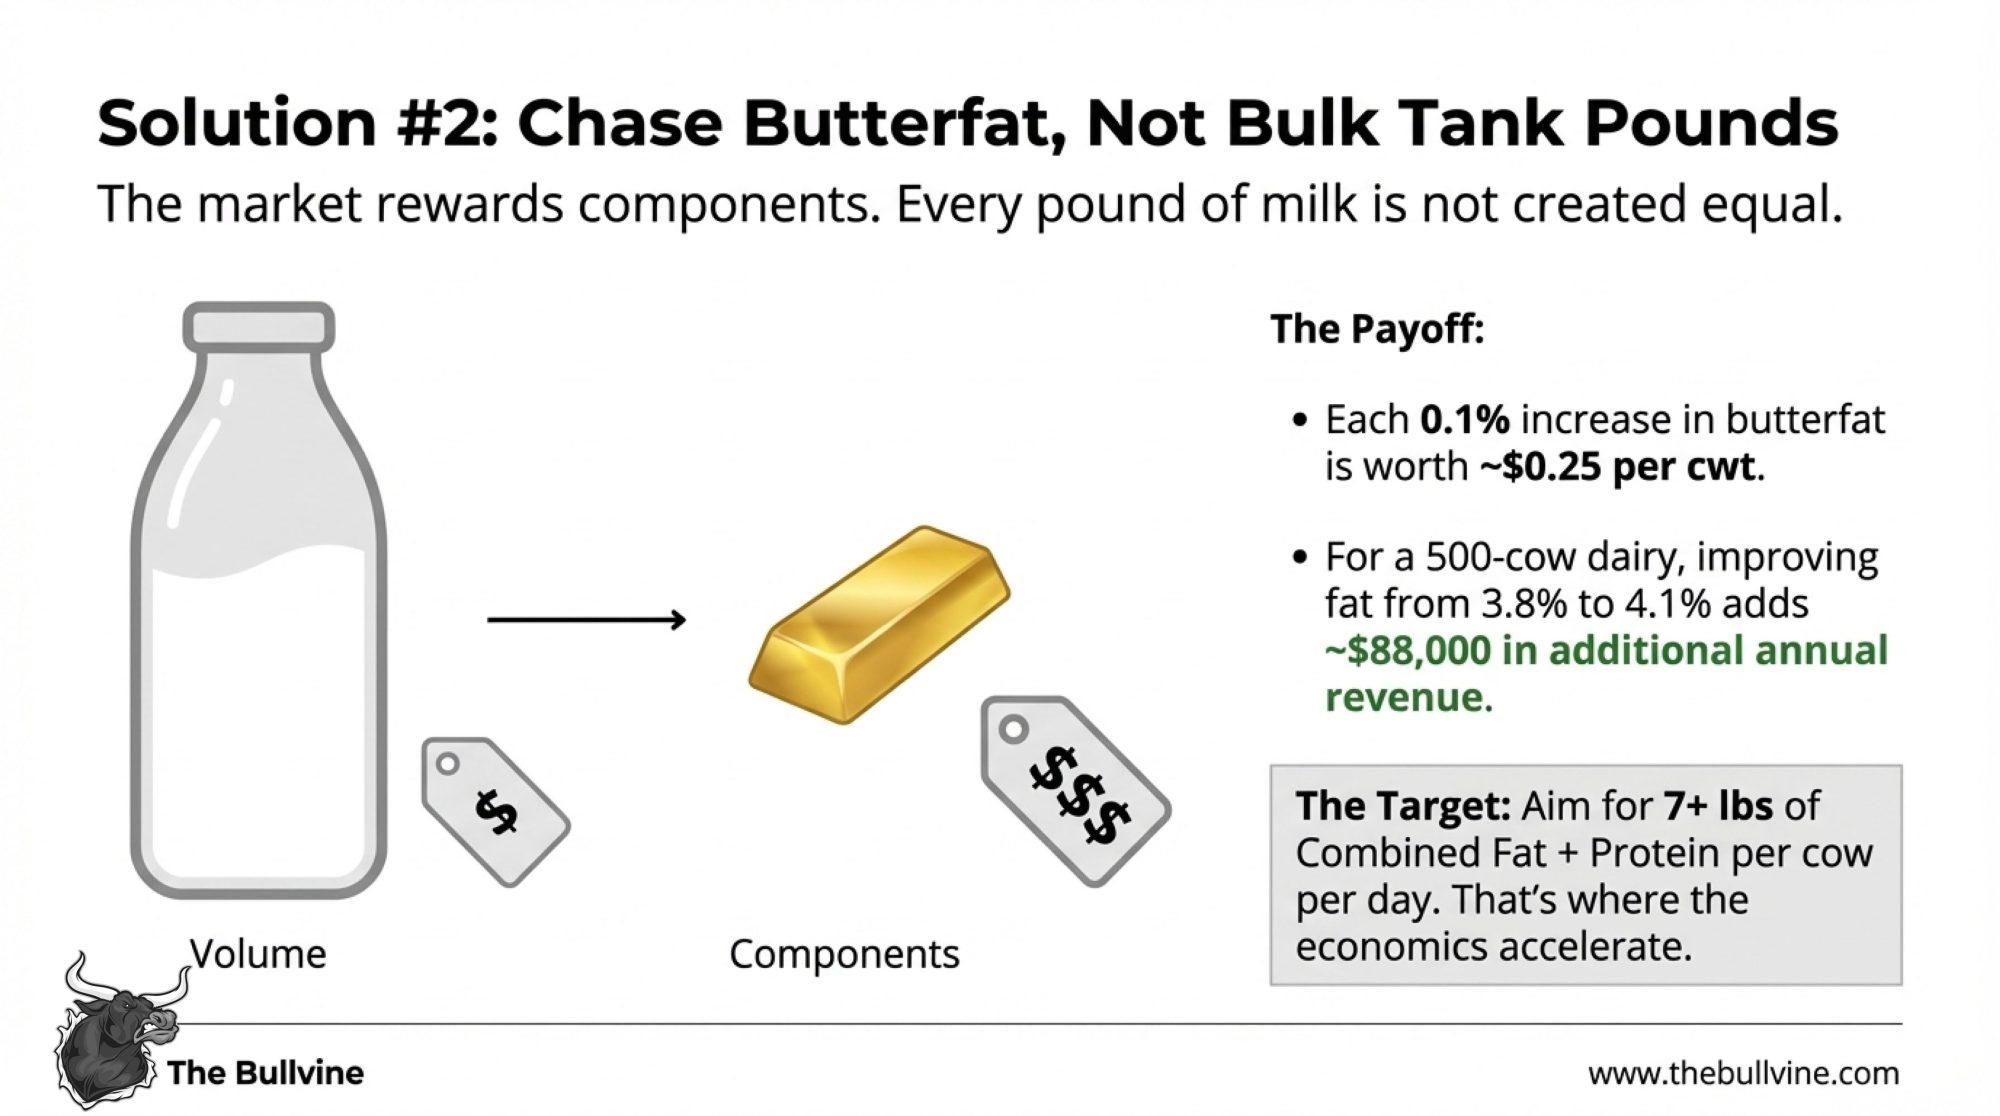
On the ground, what many herds are finding is that in cheese markets, shifting from something like 4.1% fat and just over 3.0% protein toward a more balanced 3.8–3.9% fat and 3.2%+ protein can produce better checks when plants truly pay on solids and yield. In those systems, you often see meaningful gains in revenue per hundredweight, because protein is better rewarded and excess fat isn’t discounted as heavily.
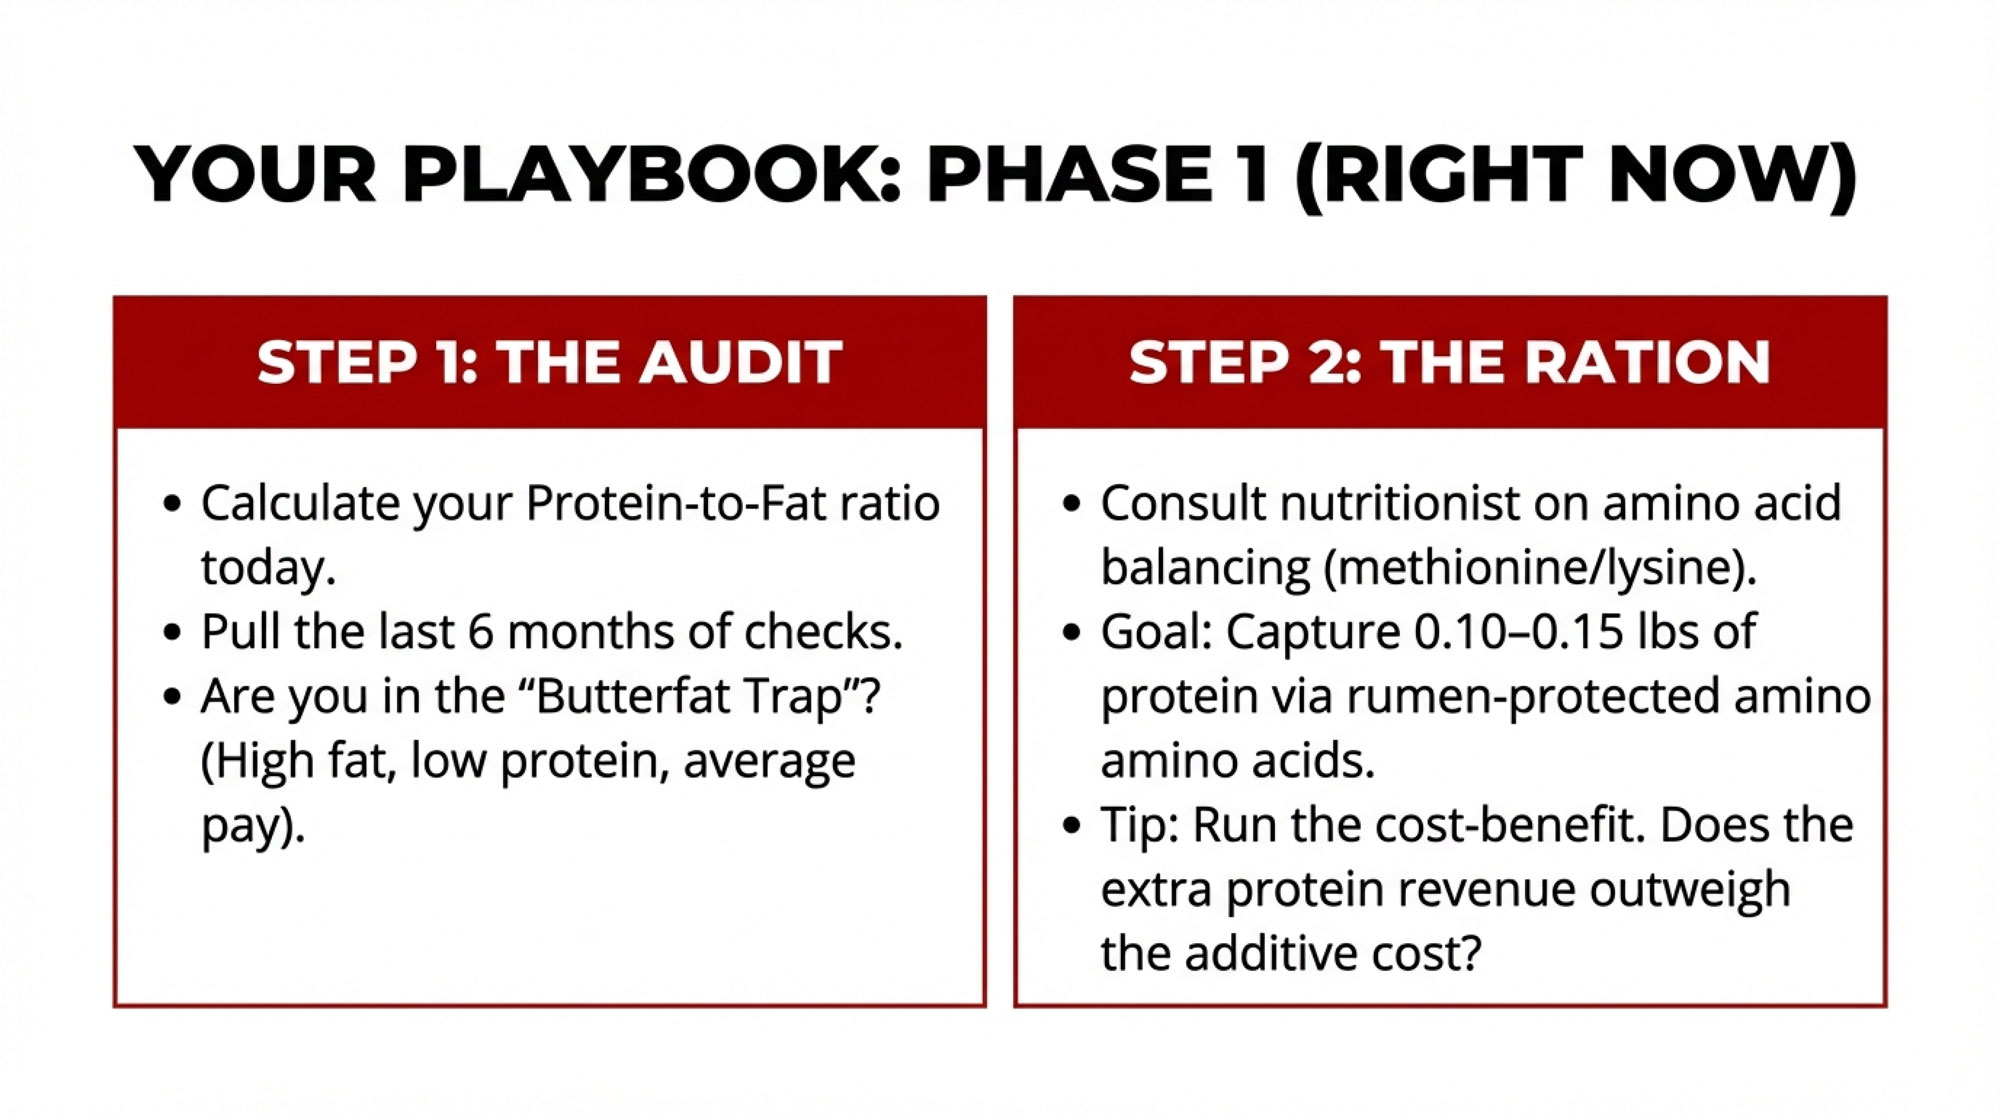
Getting there usually means:
- Working with your nutritionist on amino acid balance, not just crude protein.
- Investing in forage quality and consistency, so cows can express both butterfat and protein potential.
- Tightening fresh cow management and the transition period, so cows hit high intakes fast without metabolic wrecks.
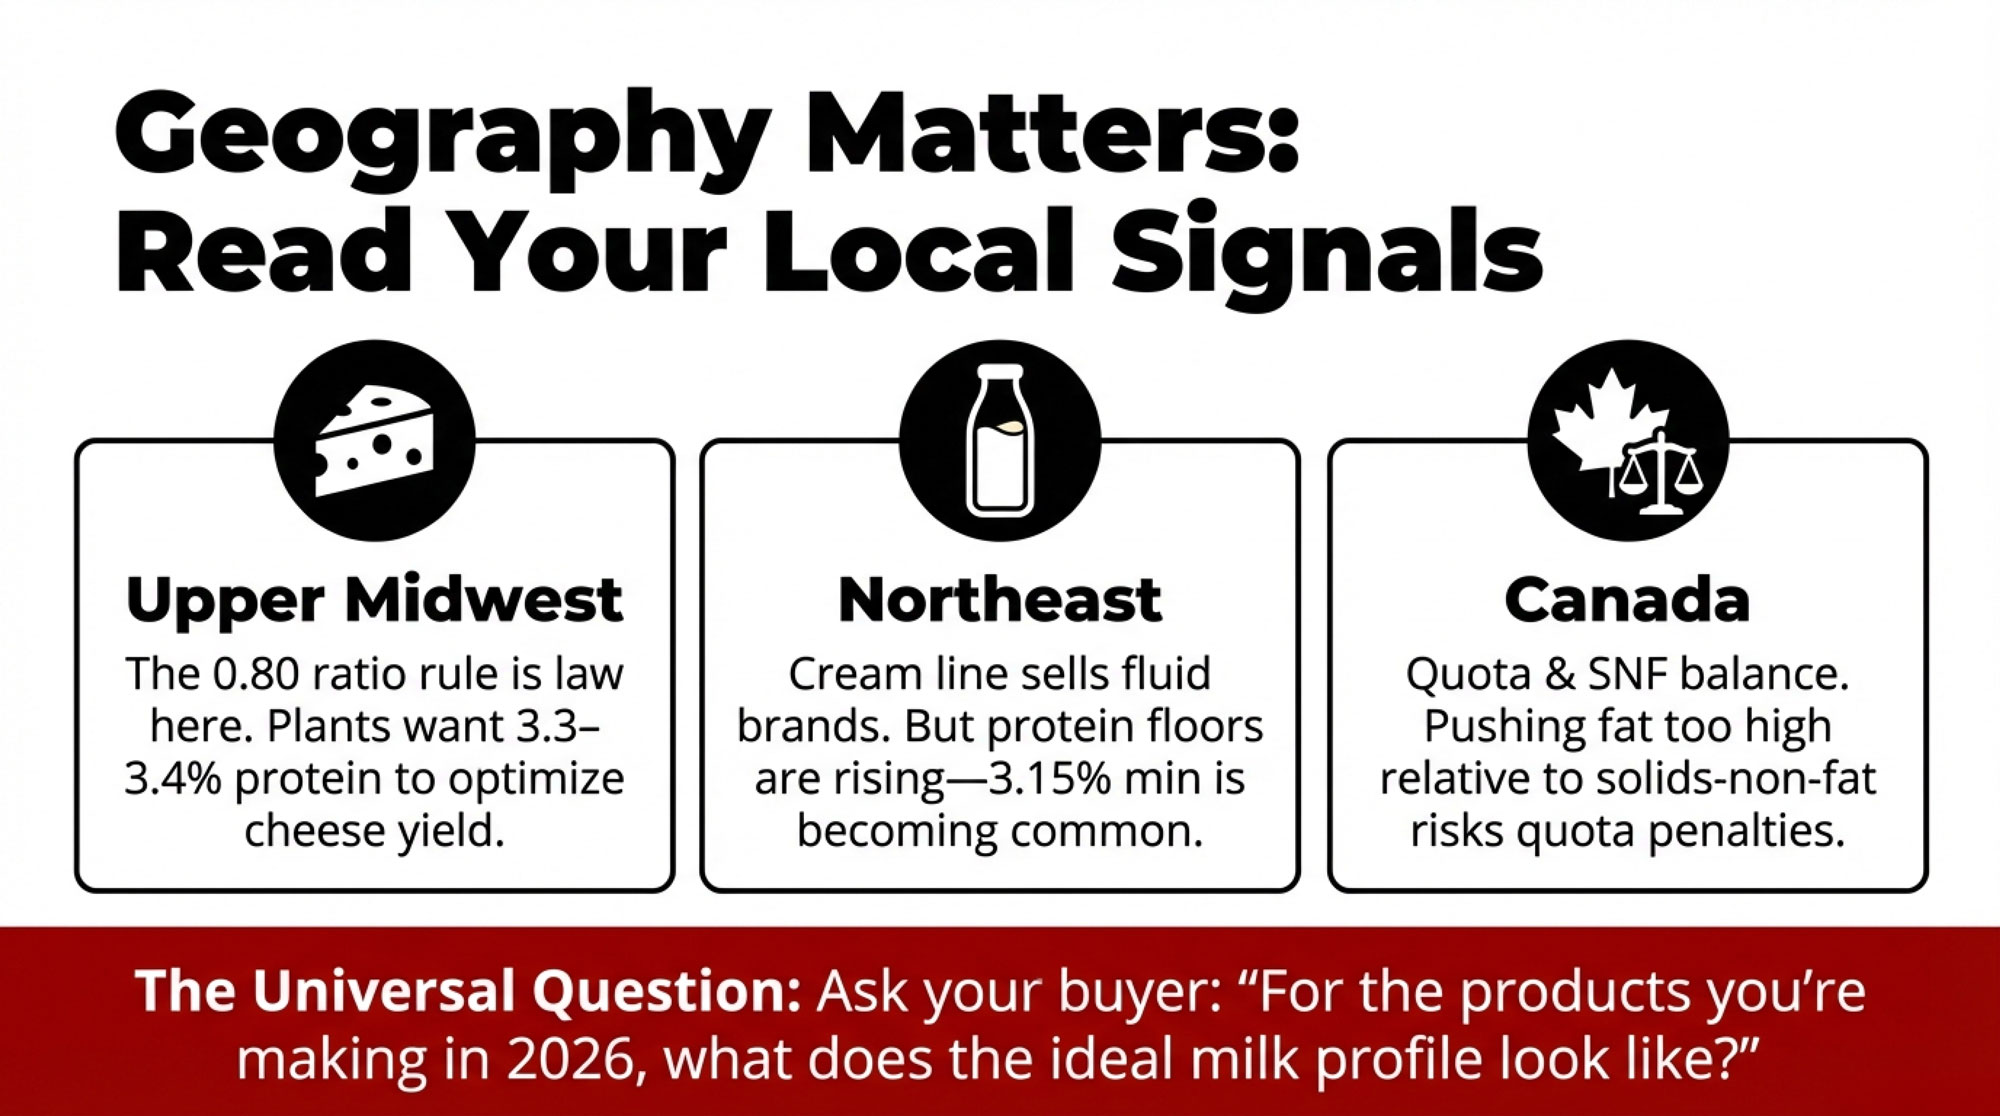
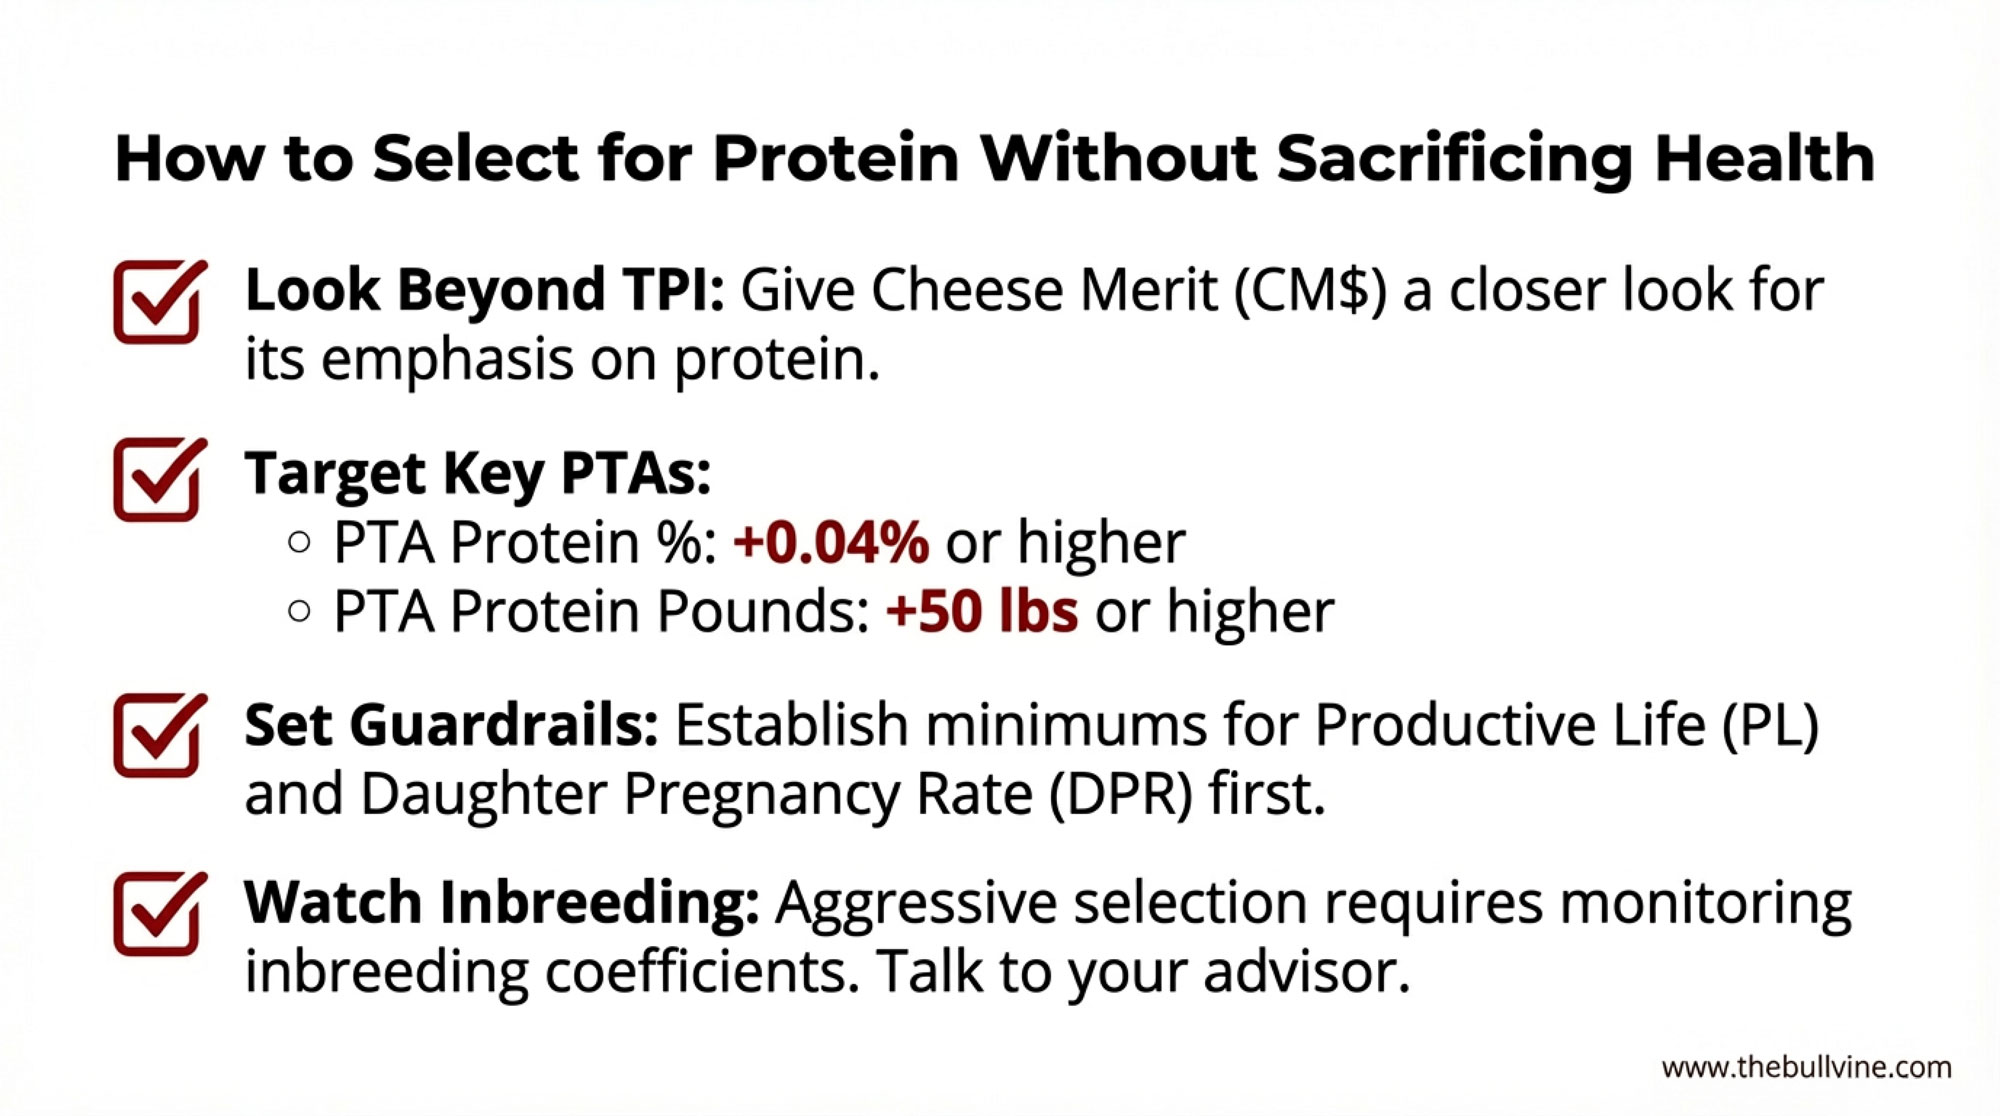
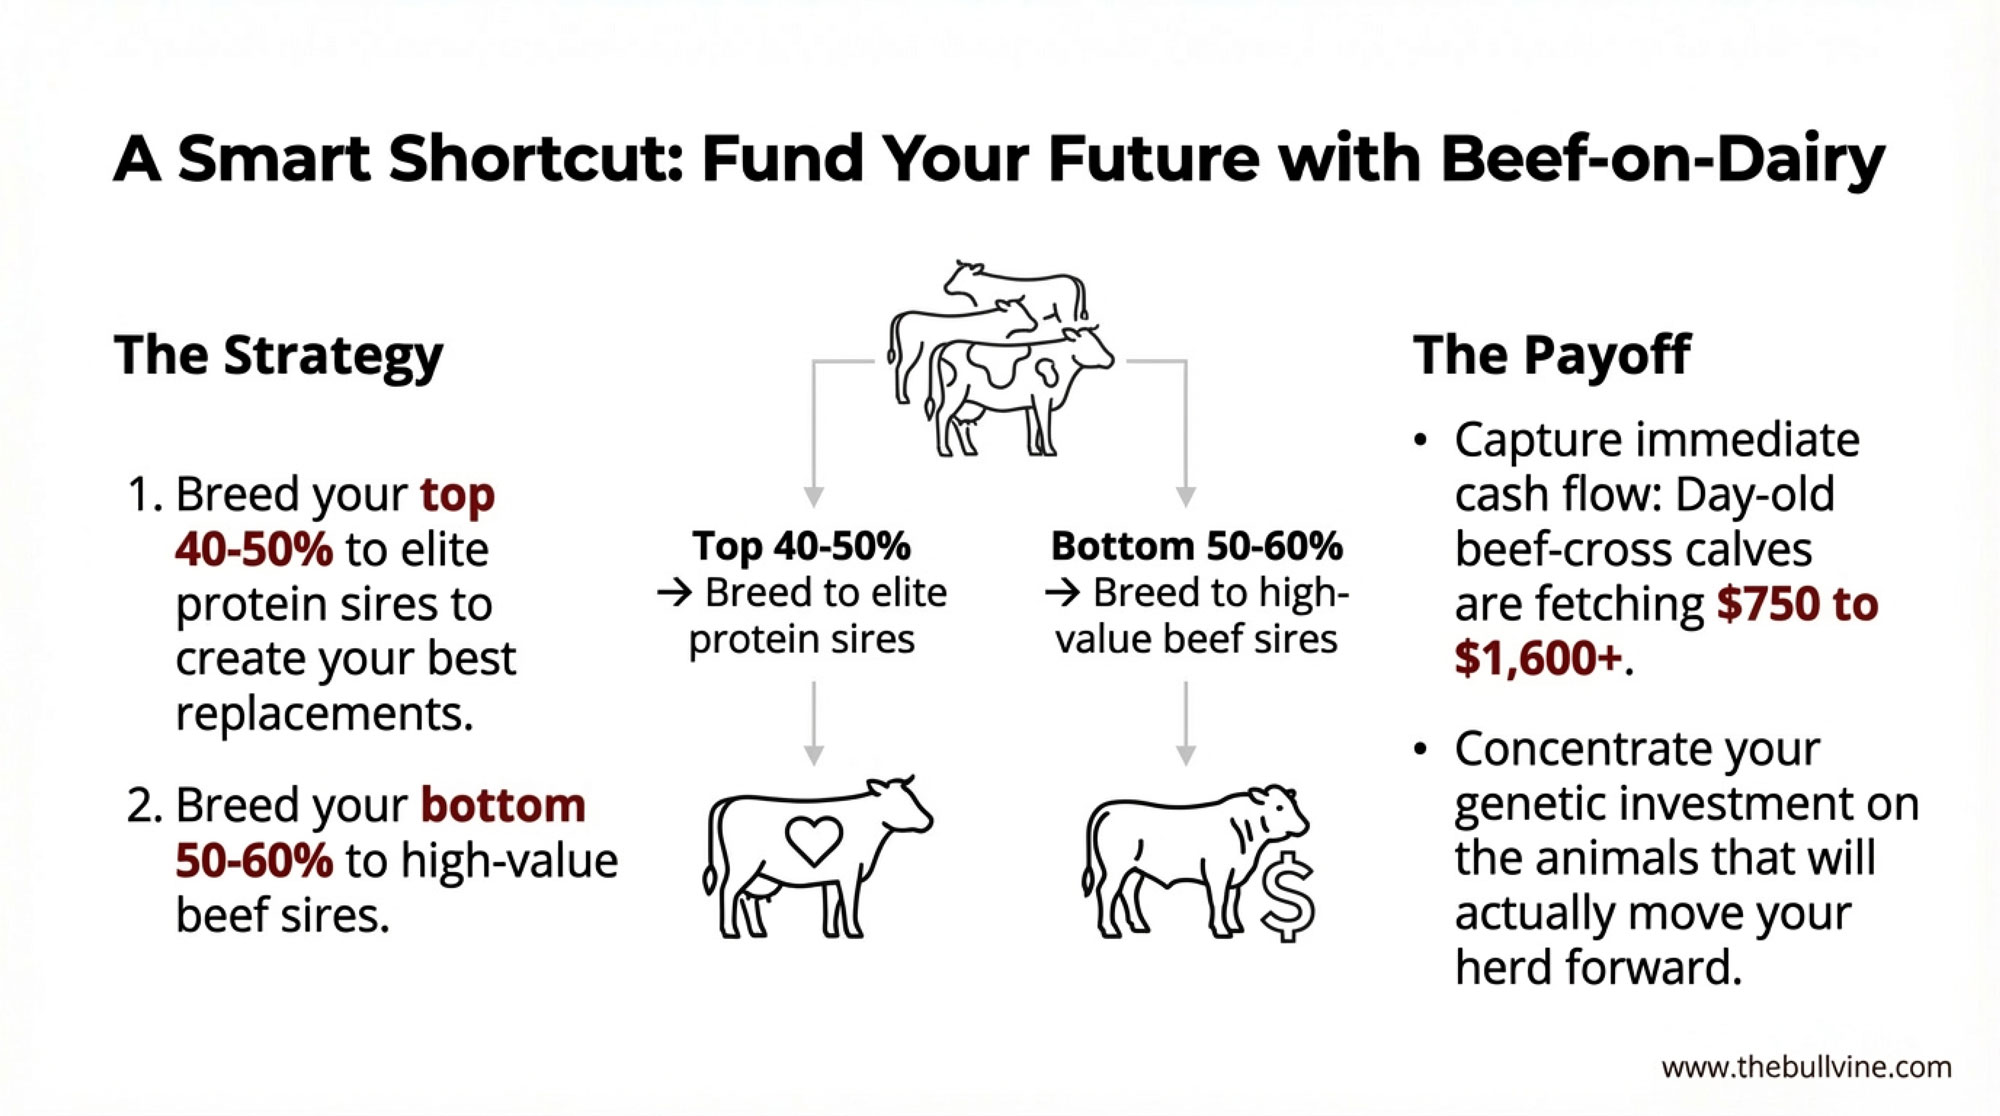
On the genetics side, more herds are using genomic tools to line up sire selection with processor needs—whether that’s cheese yield, powder specs, or value‑added fluid. In Upper Midwest and Northeast cheese sheds, some producers are building custom indexes that place greater weight on protein pounds and cheese yield traits, rather than on total milk or butterfat percent.
If you’re in a quota system like Canada, the pricing grid and quota rules are a bit different, but the core idea still holds: aligning your component profile—both fat and protein—with what your board and processors value is one of the cleanest ways to grow revenue without adding cows.
| Herd Profile | Butterfat % | Protein % | Milk Check $/cwt | Annual Revenue (75,000 cwt) | Competitive Edge |
| Current: Butterfat-Maximized | 4.10% | 3.00% | $16.50 | $1,237,500 | Commodity baseline; excess fat discounted by plants |
| Optimized: Balanced for Cheese Yield | 3.85% | 3.25% | $17.20 | $1,290,000 | ✅ +$52,500/year |
How to Get There (No Capital, No Extra Cows):
| Action | Owner | Timeline | Impact |
| Optimize fresh cow transition (energy, amino acids) | Nutritionist + Herd Manager | Ongoing, 60 days | Peak milk intake faster; protein support |
| Improve forage quality (digestibility, consistency) | Nutritionist | Next forage chop | Supports protein expression, balances fat |
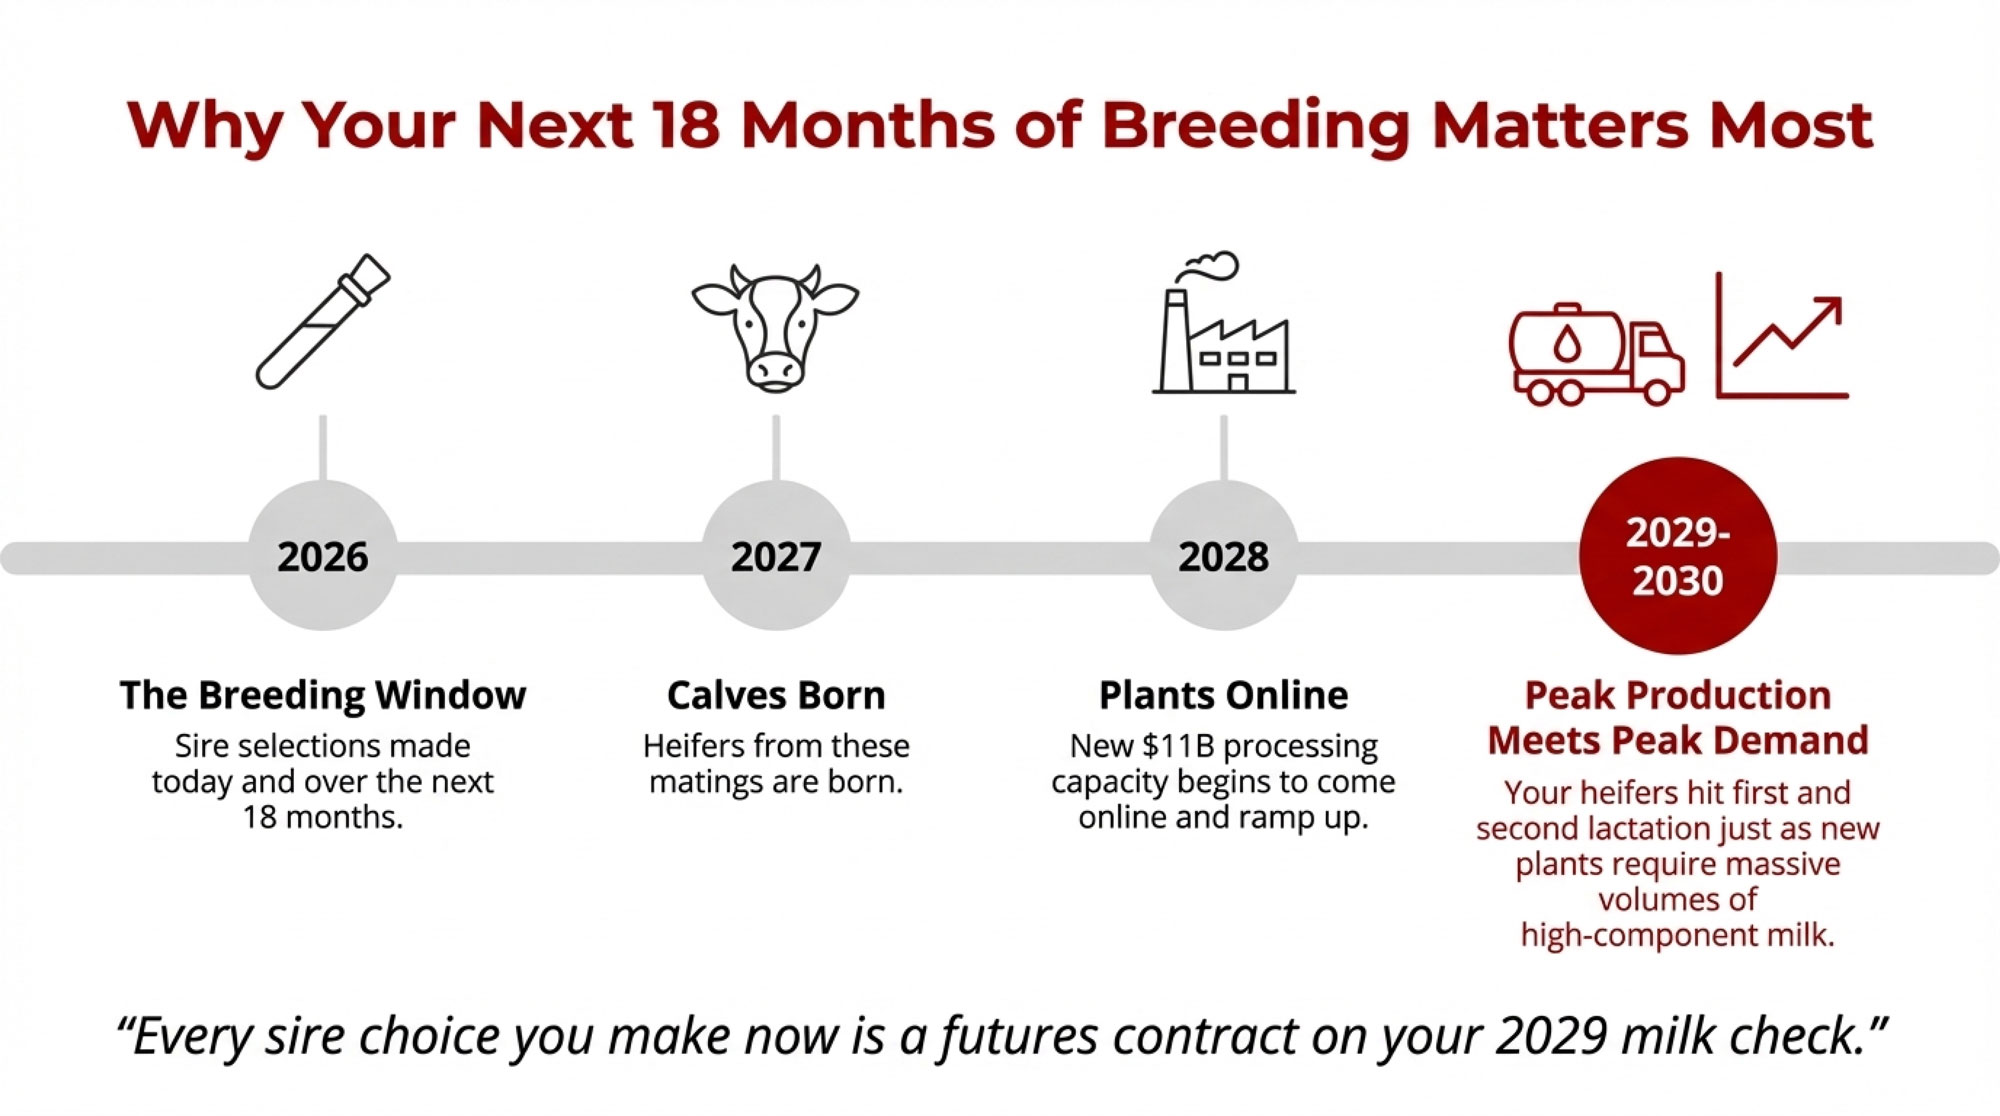
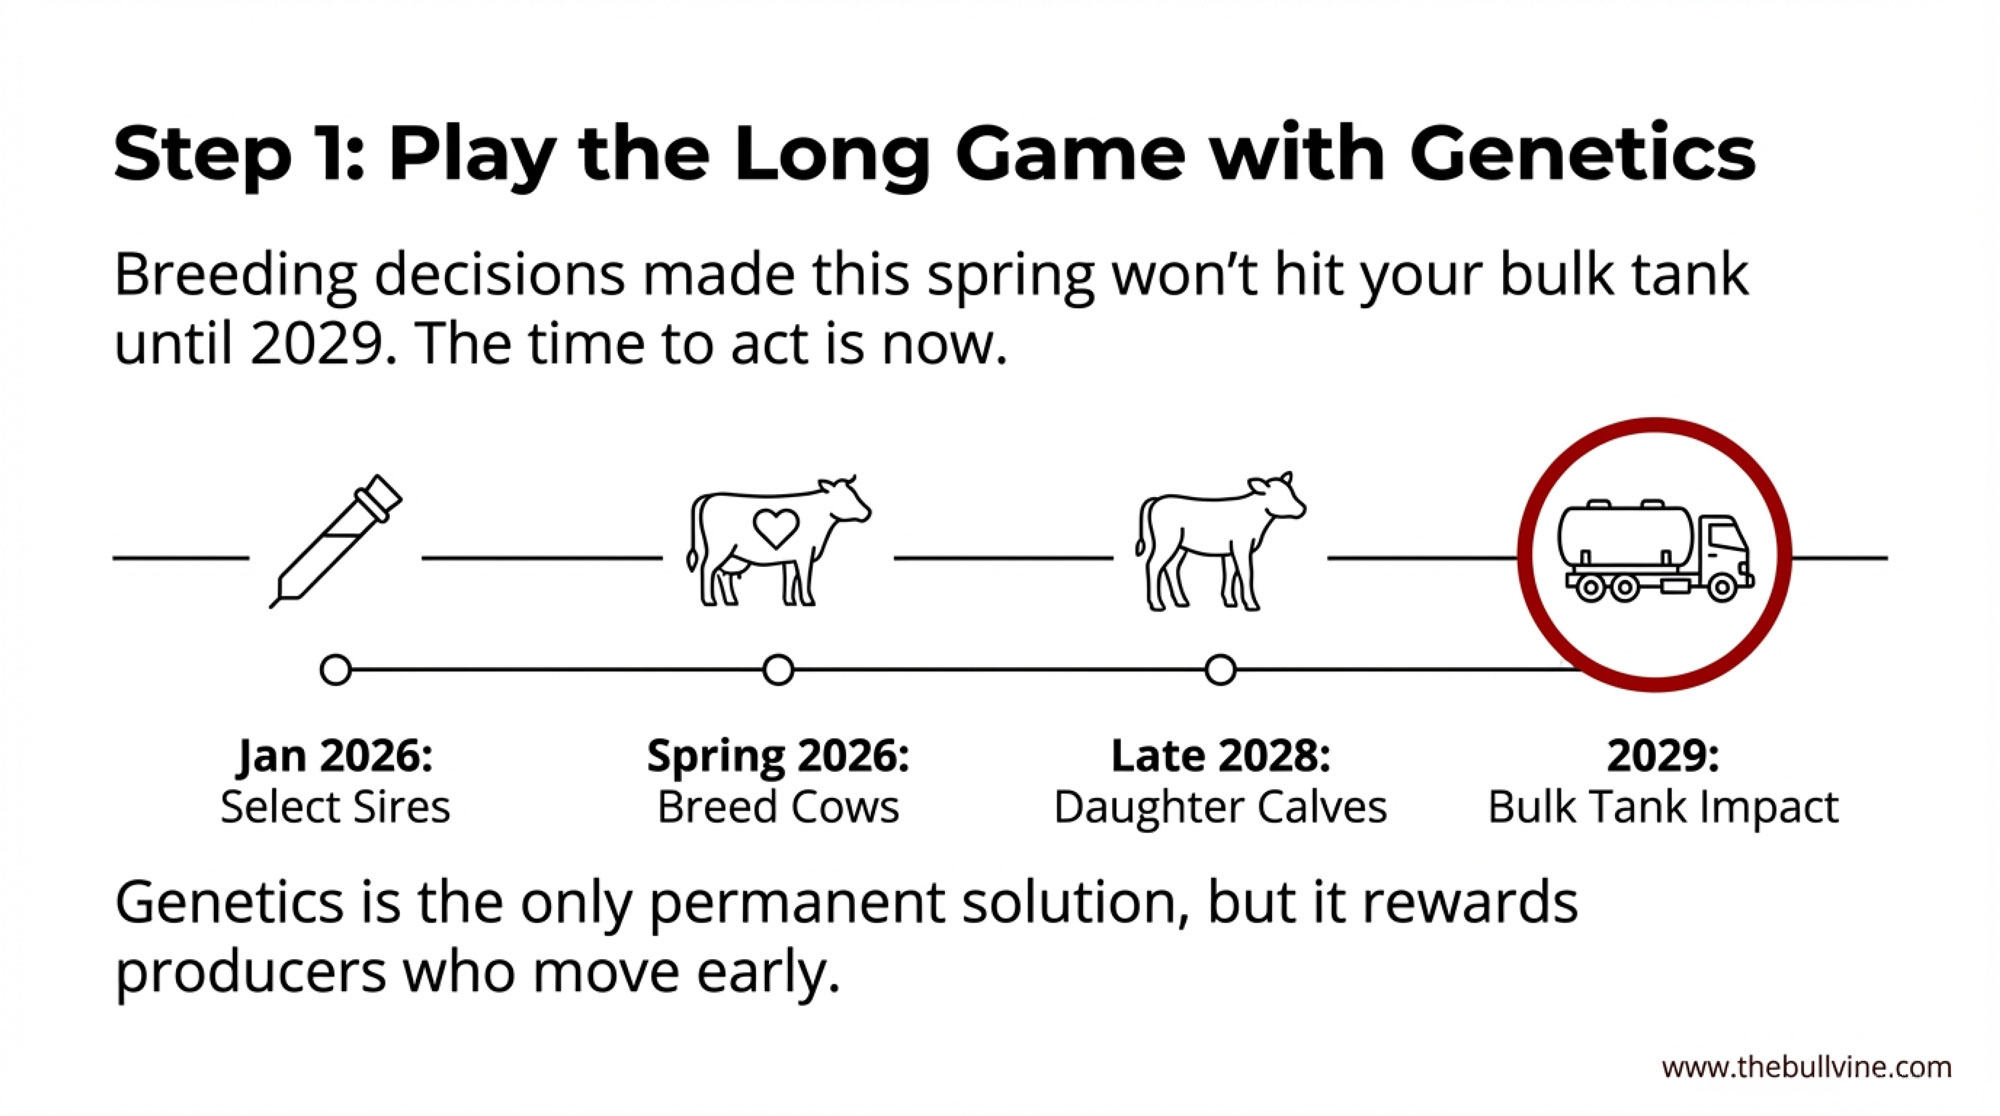
| Shift sire selection to cheese-yield genomics | Genetics team + Manager | Breedings starting now | Next 18 months; gradual shift in offspring profile |
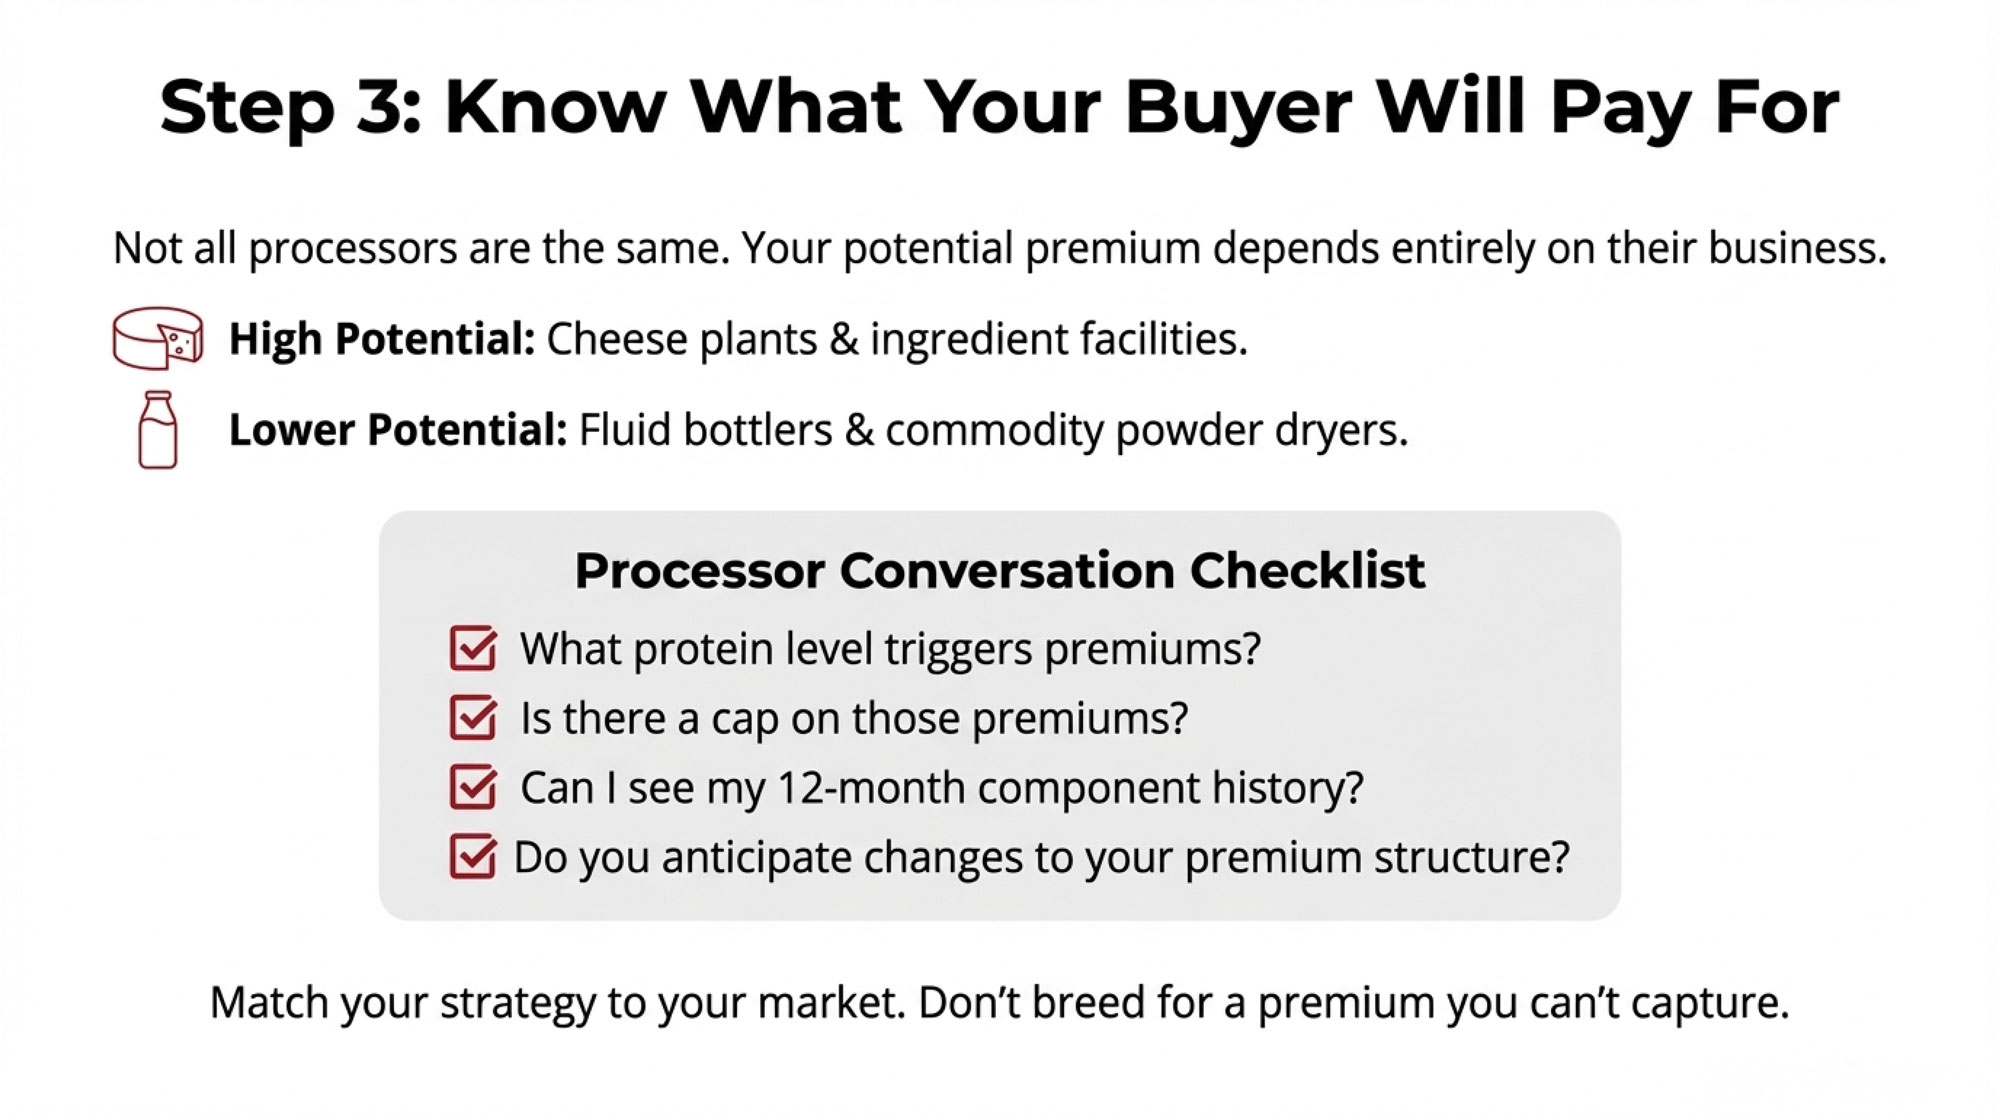
| Work with processor on pay grid alignment | Co-op/Buyer | Q1 2026 | Confirm premiums for balanced profile; lock terms |
Global Supply: No Built‑In Shortage Riding to the Rescue
Now let’s zoom out to the world map.
USDA’s 2025–26 Livestock, Dairy, and Poultry Outlook and coverage on The Dairy Site indicate that U.S. milk output is projected at about 230.0 billion pounds for 2025 and 231.3 billion pounds in 2026, up slightly as milk per cow continues to creep higher. That extra milk is part of why the agency trimmed its Class III and IV expectations heading into late 2025.
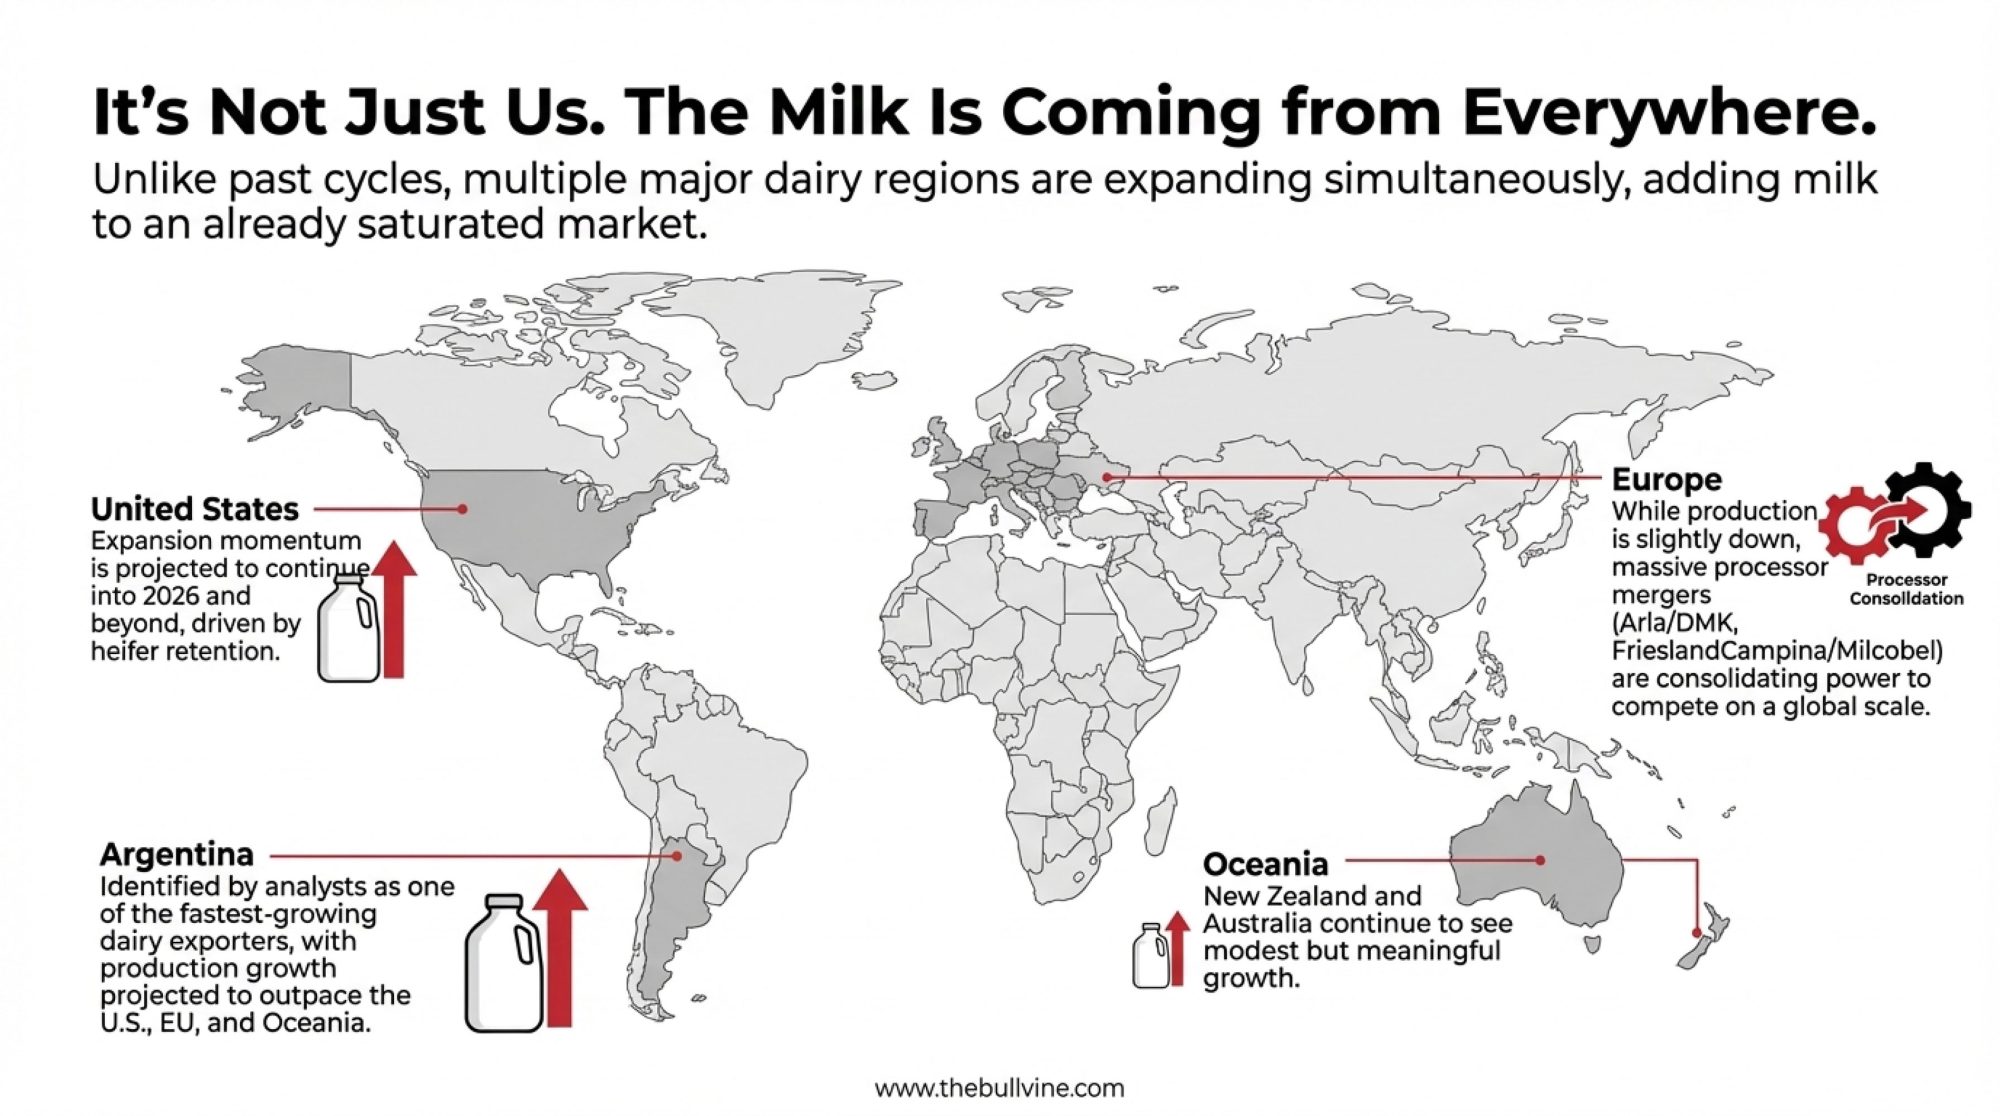
Global summaries suggest a similar pattern among major exporters:
- EU milk production is generally steady to modestly higher, constrained by environmental policies but supported by improved margins in some regions.
- New Zealand and Australia have seen output rebound amid better weather and more favorable cost structures.
- South America—especially Argentina and Brazil—has pockets of growth tied to currency and feed dynamics.
There are always local headaches, but nothing that looks like a synchronized global production crash. From a price standpoint, that means there isn’t an obvious global shortage brewing to “save” the market for us. Any stronger price story in 2026 is more likely to come from demand growth and product mix than from the world suddenly running short of milk.
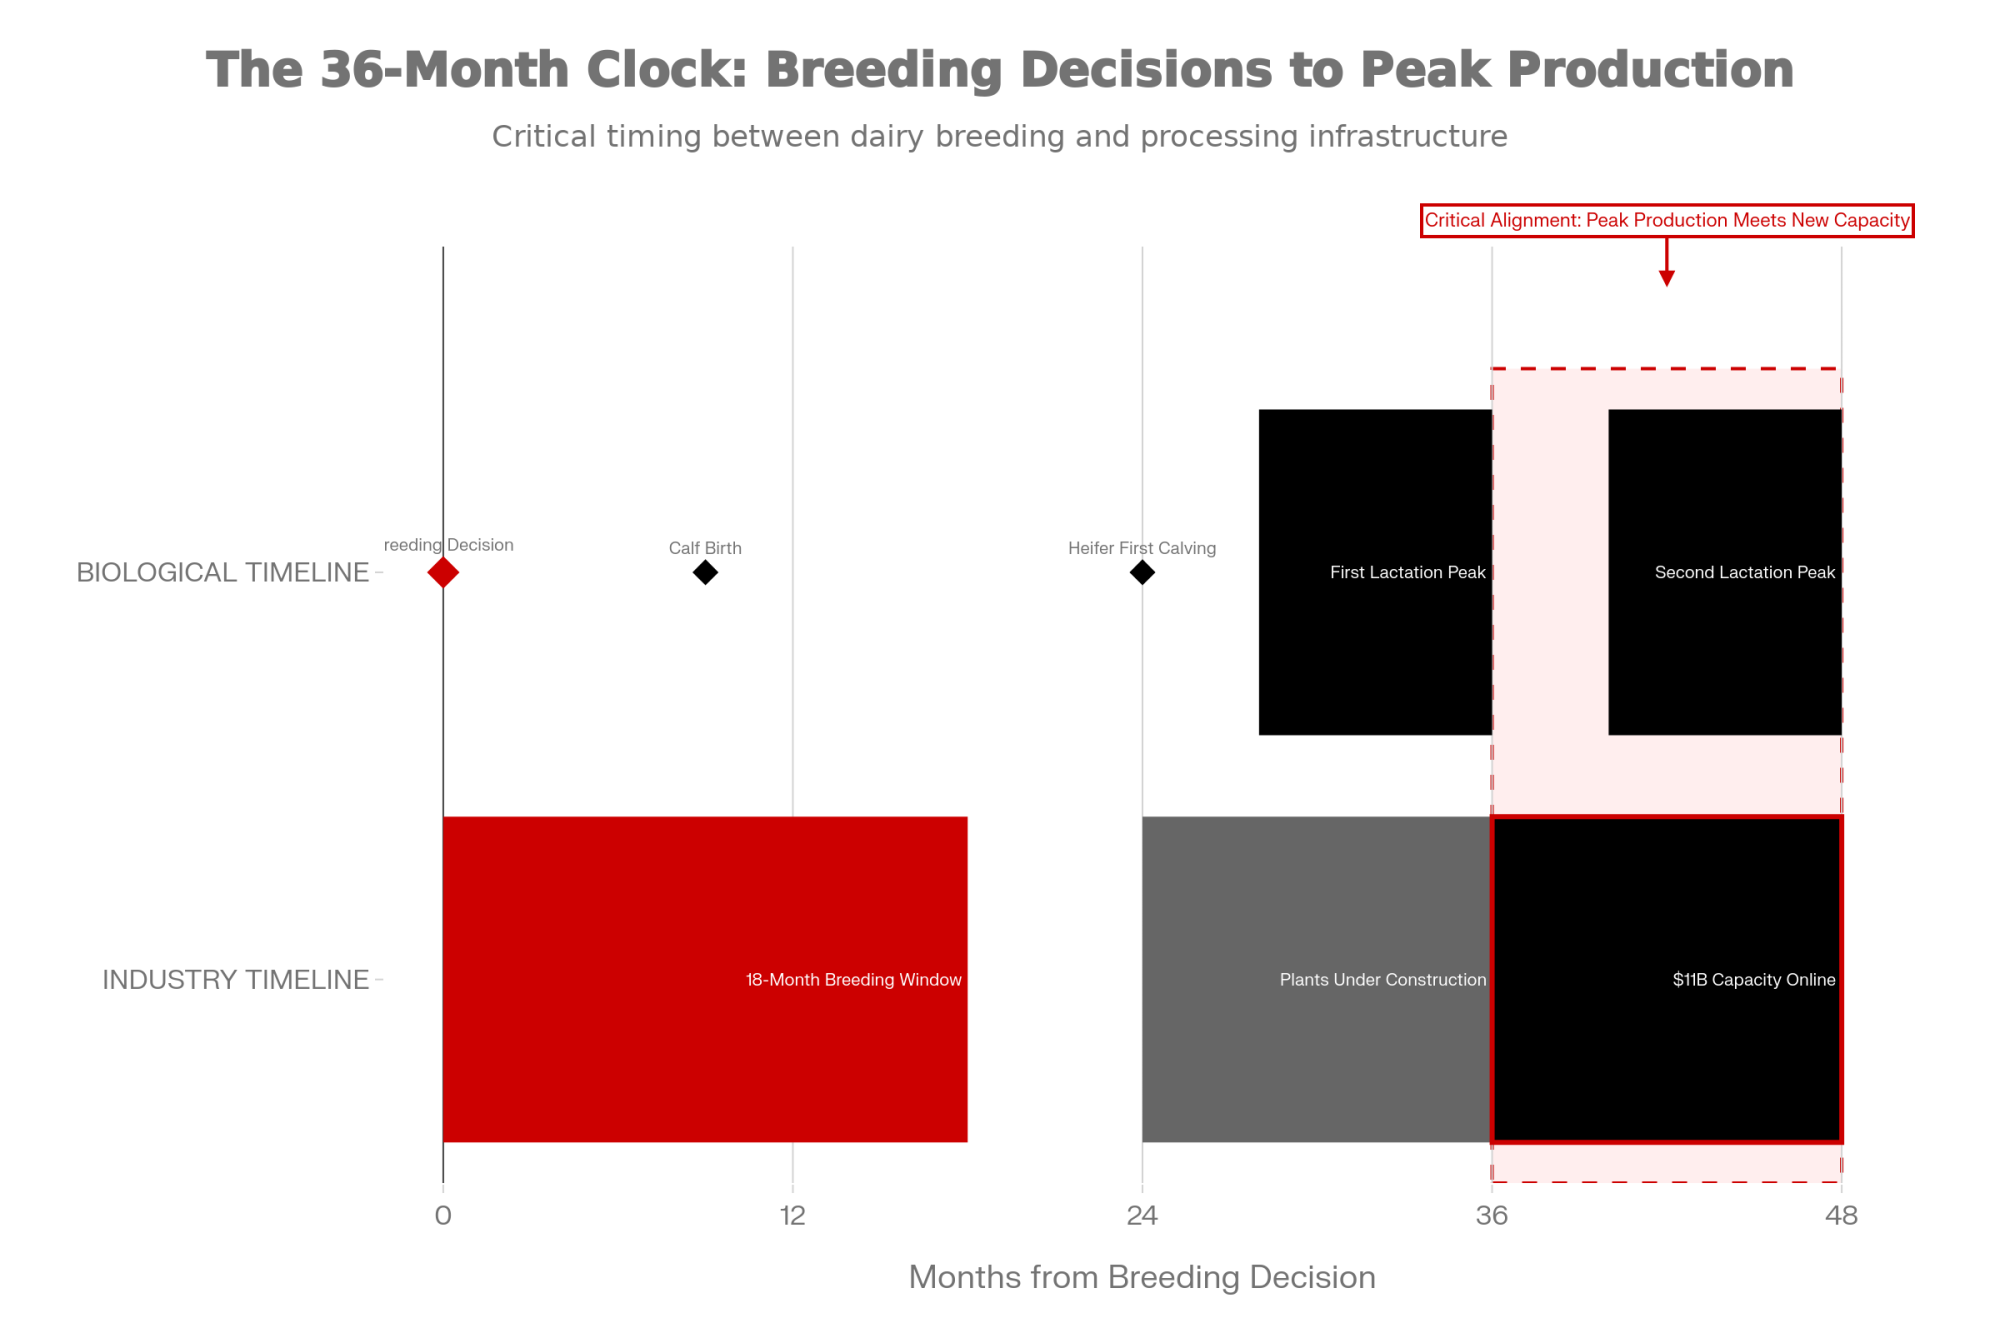
Processing Capacity: New Stainless, New Rules of the Game
Looking at this trend on the processing side, it’s clear that a lot of serious money still believes in the long‑term North American dairy story.
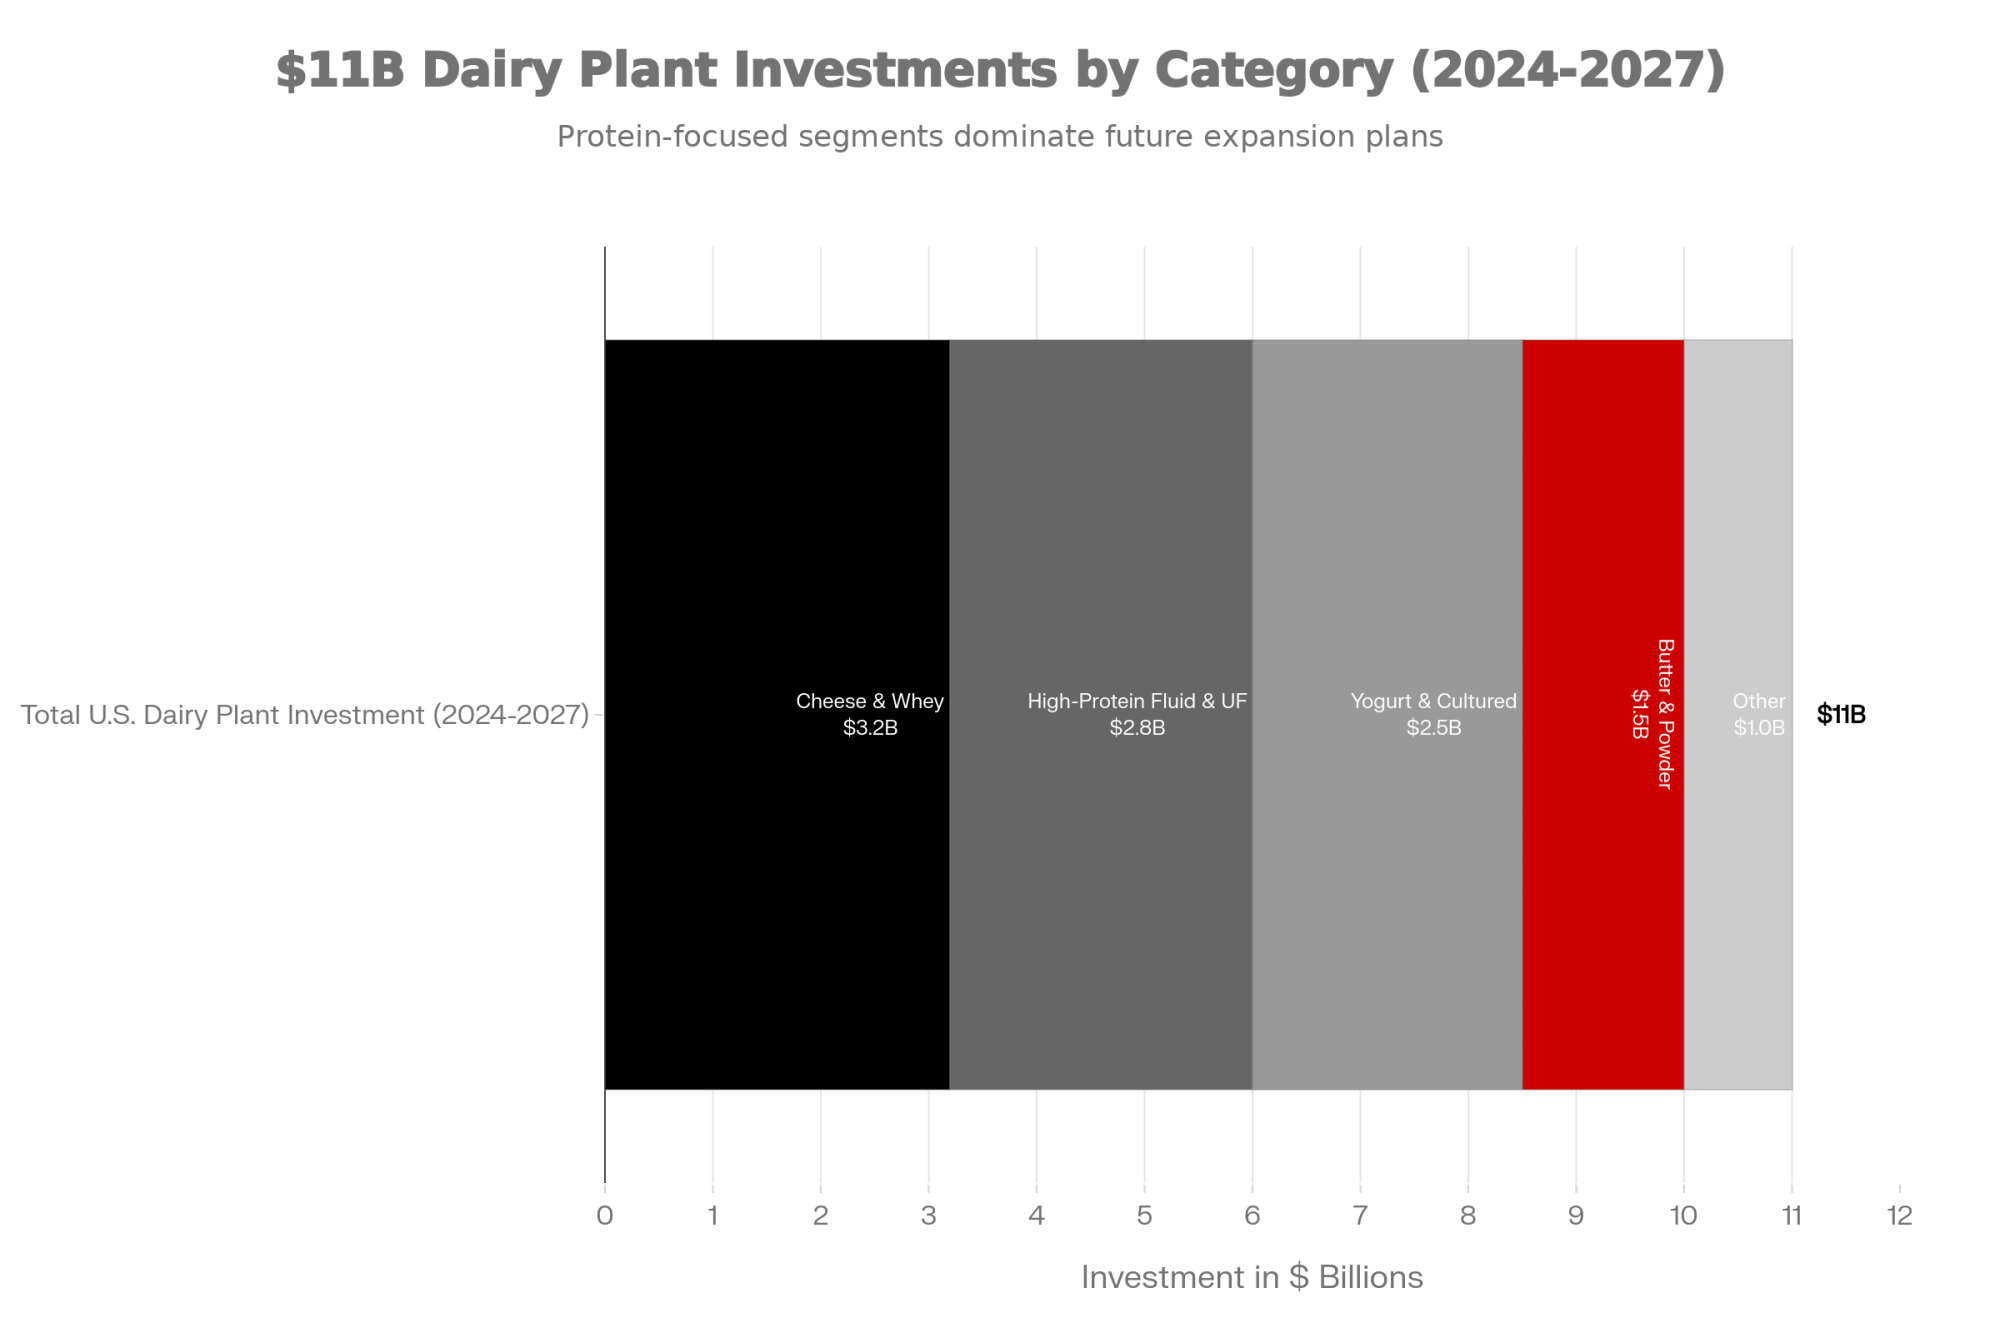
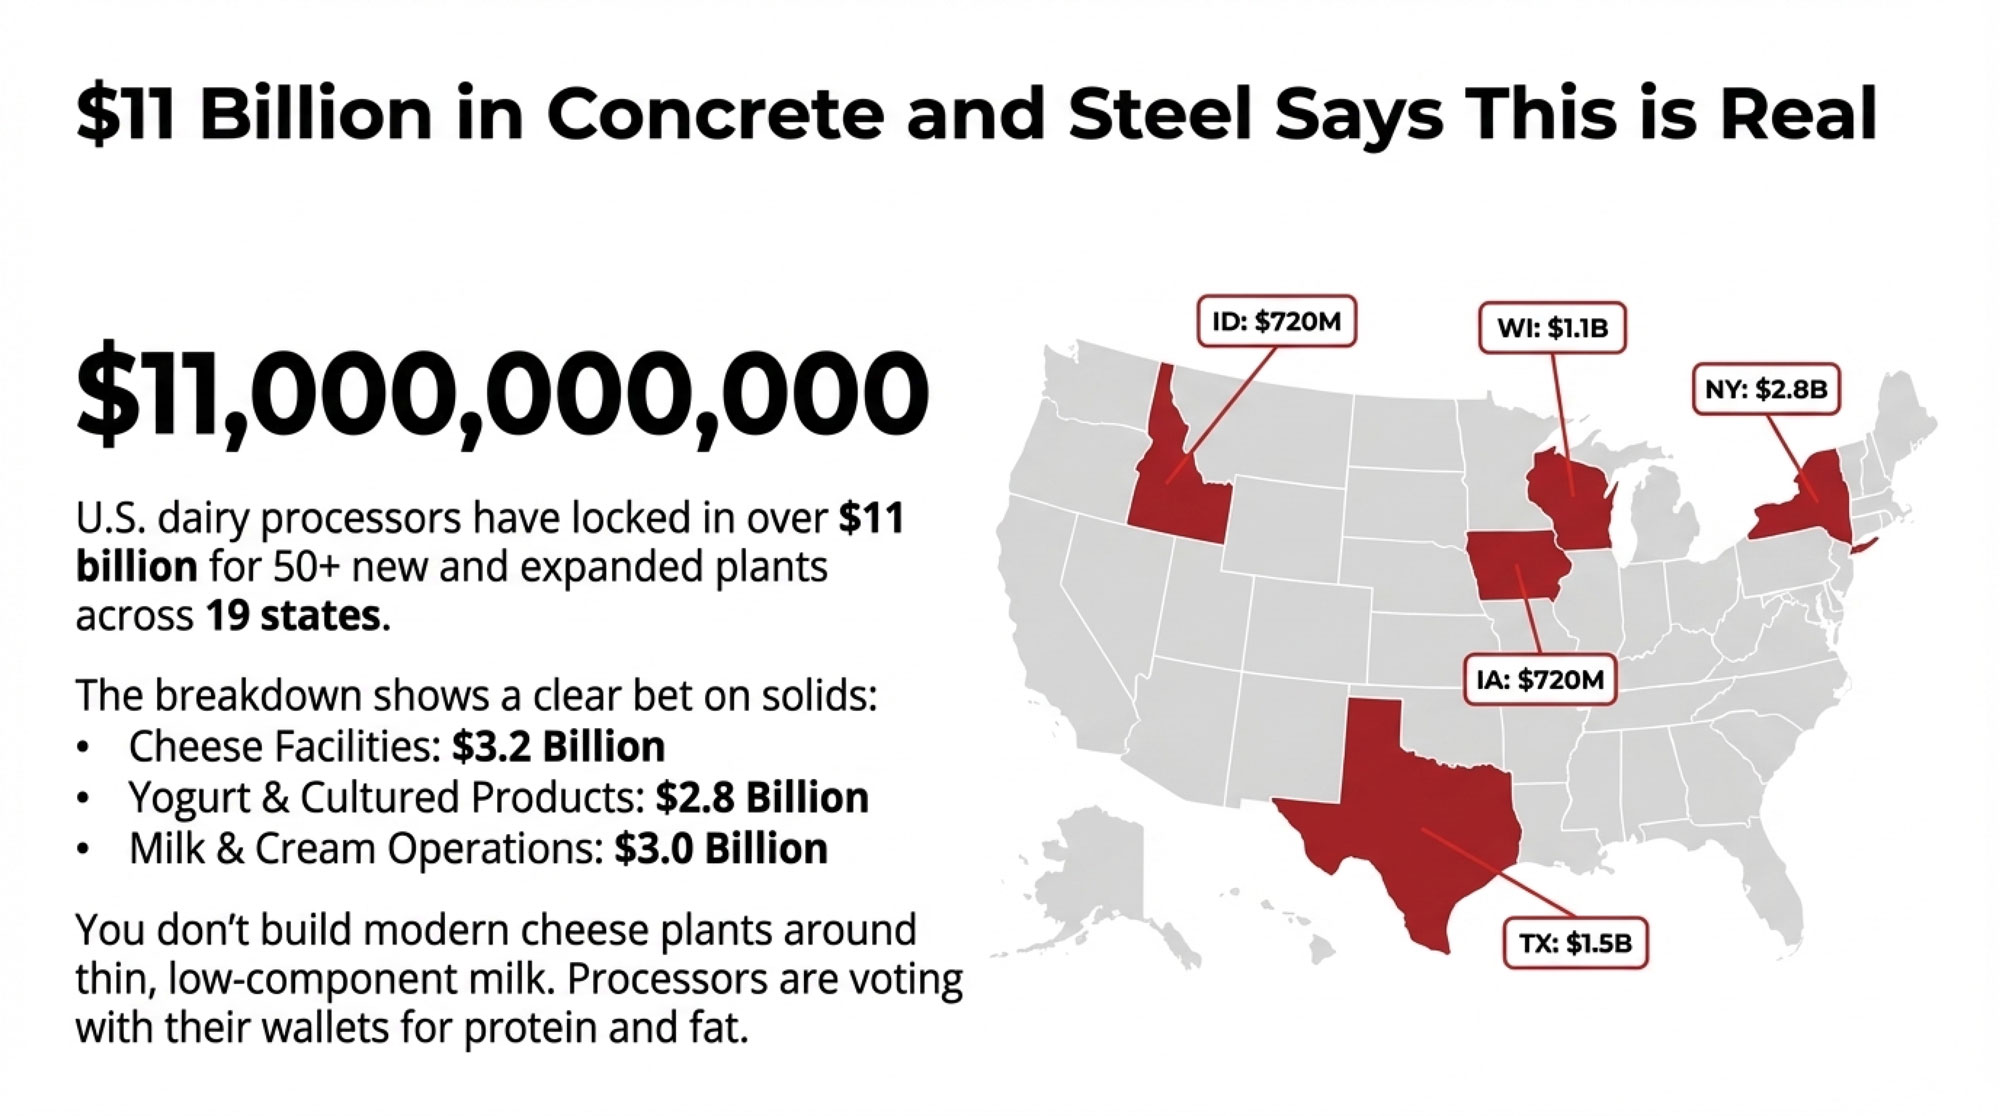
CoBank estimates that roughly $10 billion in new or expanded dairy processing capacity is slated to come online through about 2027, with a heavy emphasis on cheese, butter, whey, and other protein ingredients. In a late‑2024 interview, Geiger said more than $8 billion of that investment is expected to be operating by 2026, with over half targeted at cheese and whey.
You can see that on the ground:
- In Wisconsin and Minnesota, new and expanded cheddar and mozzarella plants are chasing domestic pizza demand and export markets.
- In the Texas Panhandle and High Plains, big complexes built around freestalls and dry lot systems in Texas, Kansas, and eastern New Mexico are designed to run high‑component milk into large cheese and ingredient plants.
- In the Northeast, investments like the Fairlife ultra‑filtered milk plant in Webster, New York, and expansions in yogurt and value‑added fluid plants that need consistent, high‑component milk.
- In Idaho and California, continued investments in cheese and powder position those states as key suppliers to both domestic and export buyers.
CoBank notes that we don’t yet have enough cows to max out all this new stainless, and that’s intentional—plants are being built for where the industry is going, not where it was five years ago. Their analysis also emphasizes that the next efficiency gains won’t just be about scale, but about getting the protein‑to‑fat ratio right for the products being made.
Locally, that creates split realities:
- If you ship into a newer or aggressively expanding plant that pays on components or cheese yield, you may see stronger over‑order premiums, solids incentives, and long‑term supply agreements. Farm Credit East reports that in parts of the Northeast, over‑order premiums of $0.75 to $1.50 per cwt have been common where plants are pulling hard for high‑component milk.
- If you ship to a plant with limited capacity growth or a narrower product mix, you may feel more of the overall supply pressure and less of that premium pull.
From a distance, this wave of investment is a huge vote of confidence in the future of North American milk. At the farm gate, it also means that if demand doesn’t keep pace, processors will push utilization and volume, which can lean on commodity prices even while local premiums improve for the “right” kind of milk.
Looking ahead a bit beyond 2026, it’s also worth keeping an eye on FMMO modernization debates and evolving component pay structures, because those policy and pricing shifts will sit atop the same stainless and component dynamics we’re discussing today.
Credit Tightening: Planning in an 8% Money World
Now bring the lender back into the kitchen conversation.
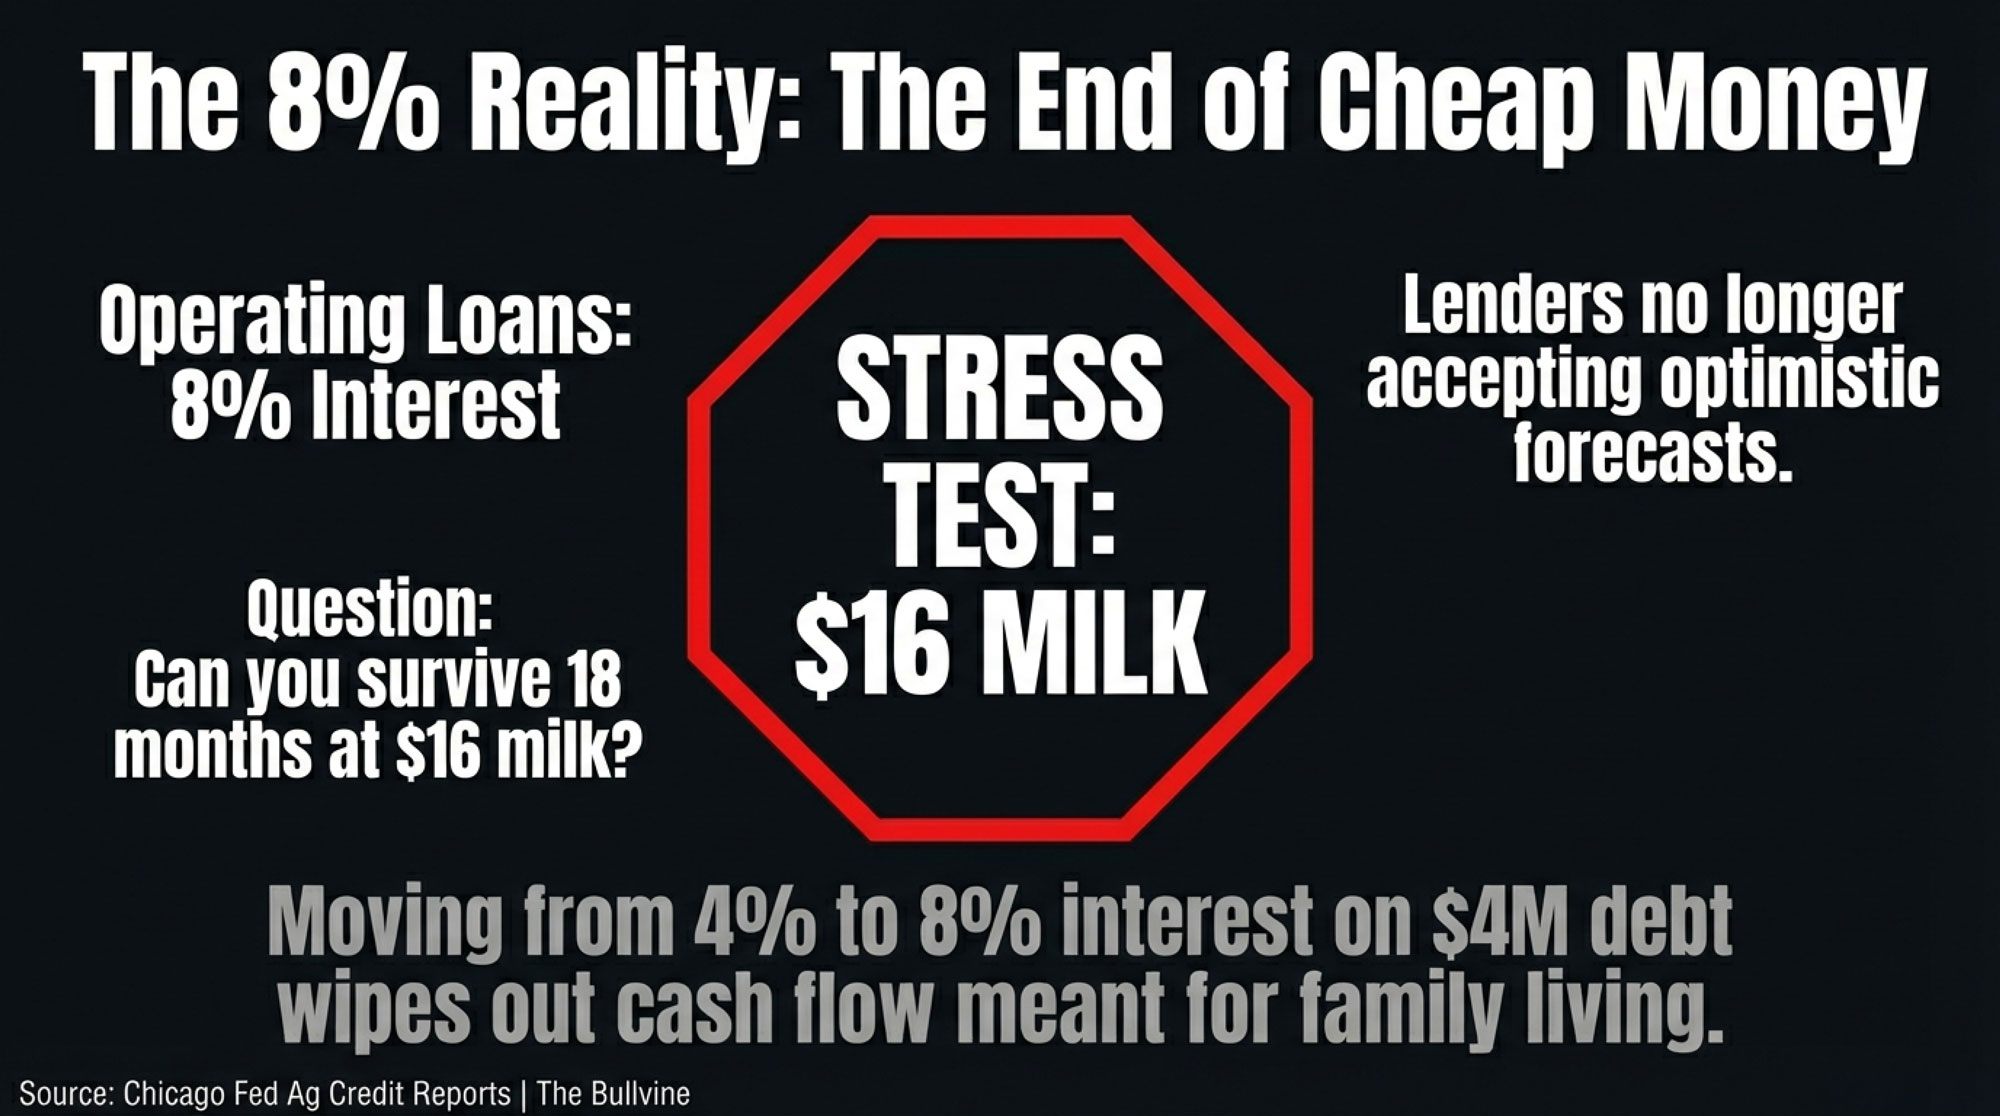
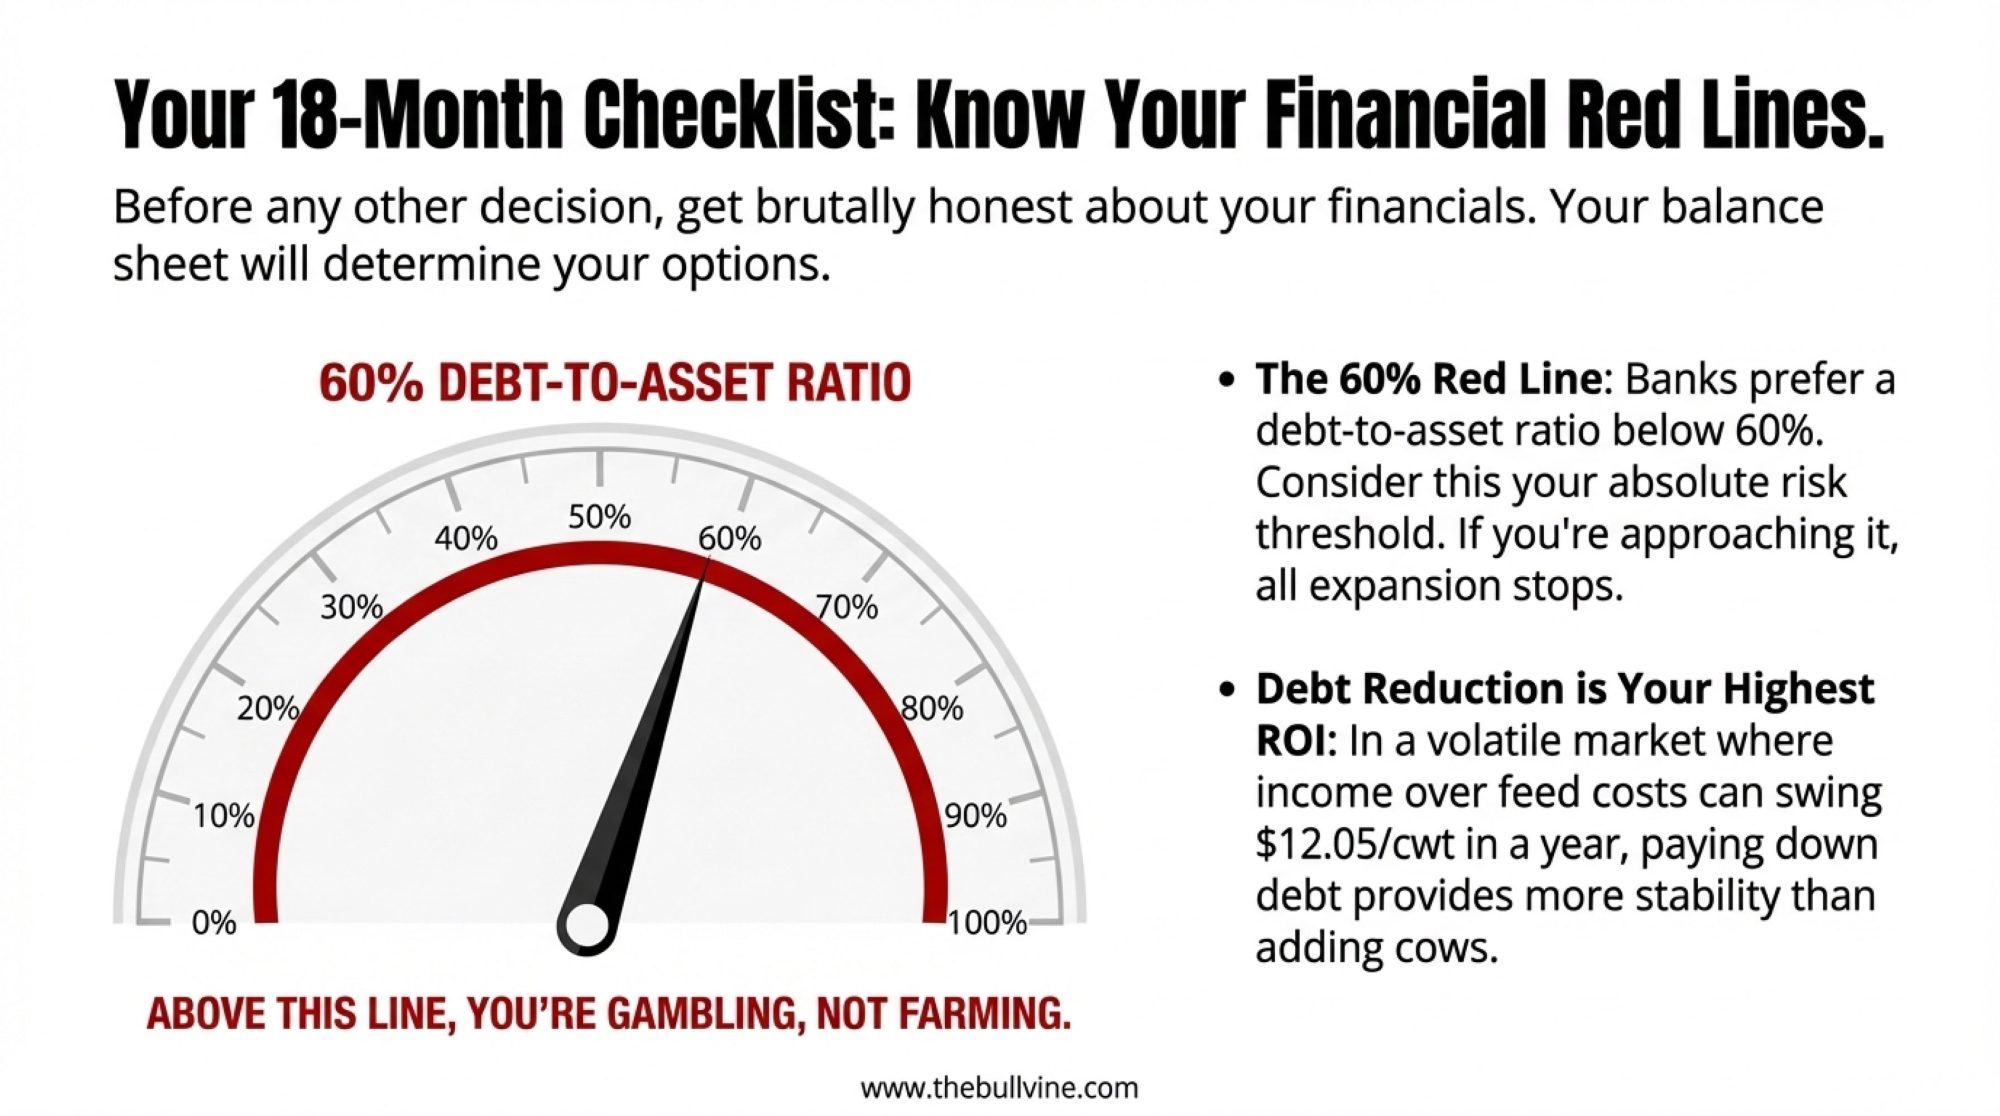
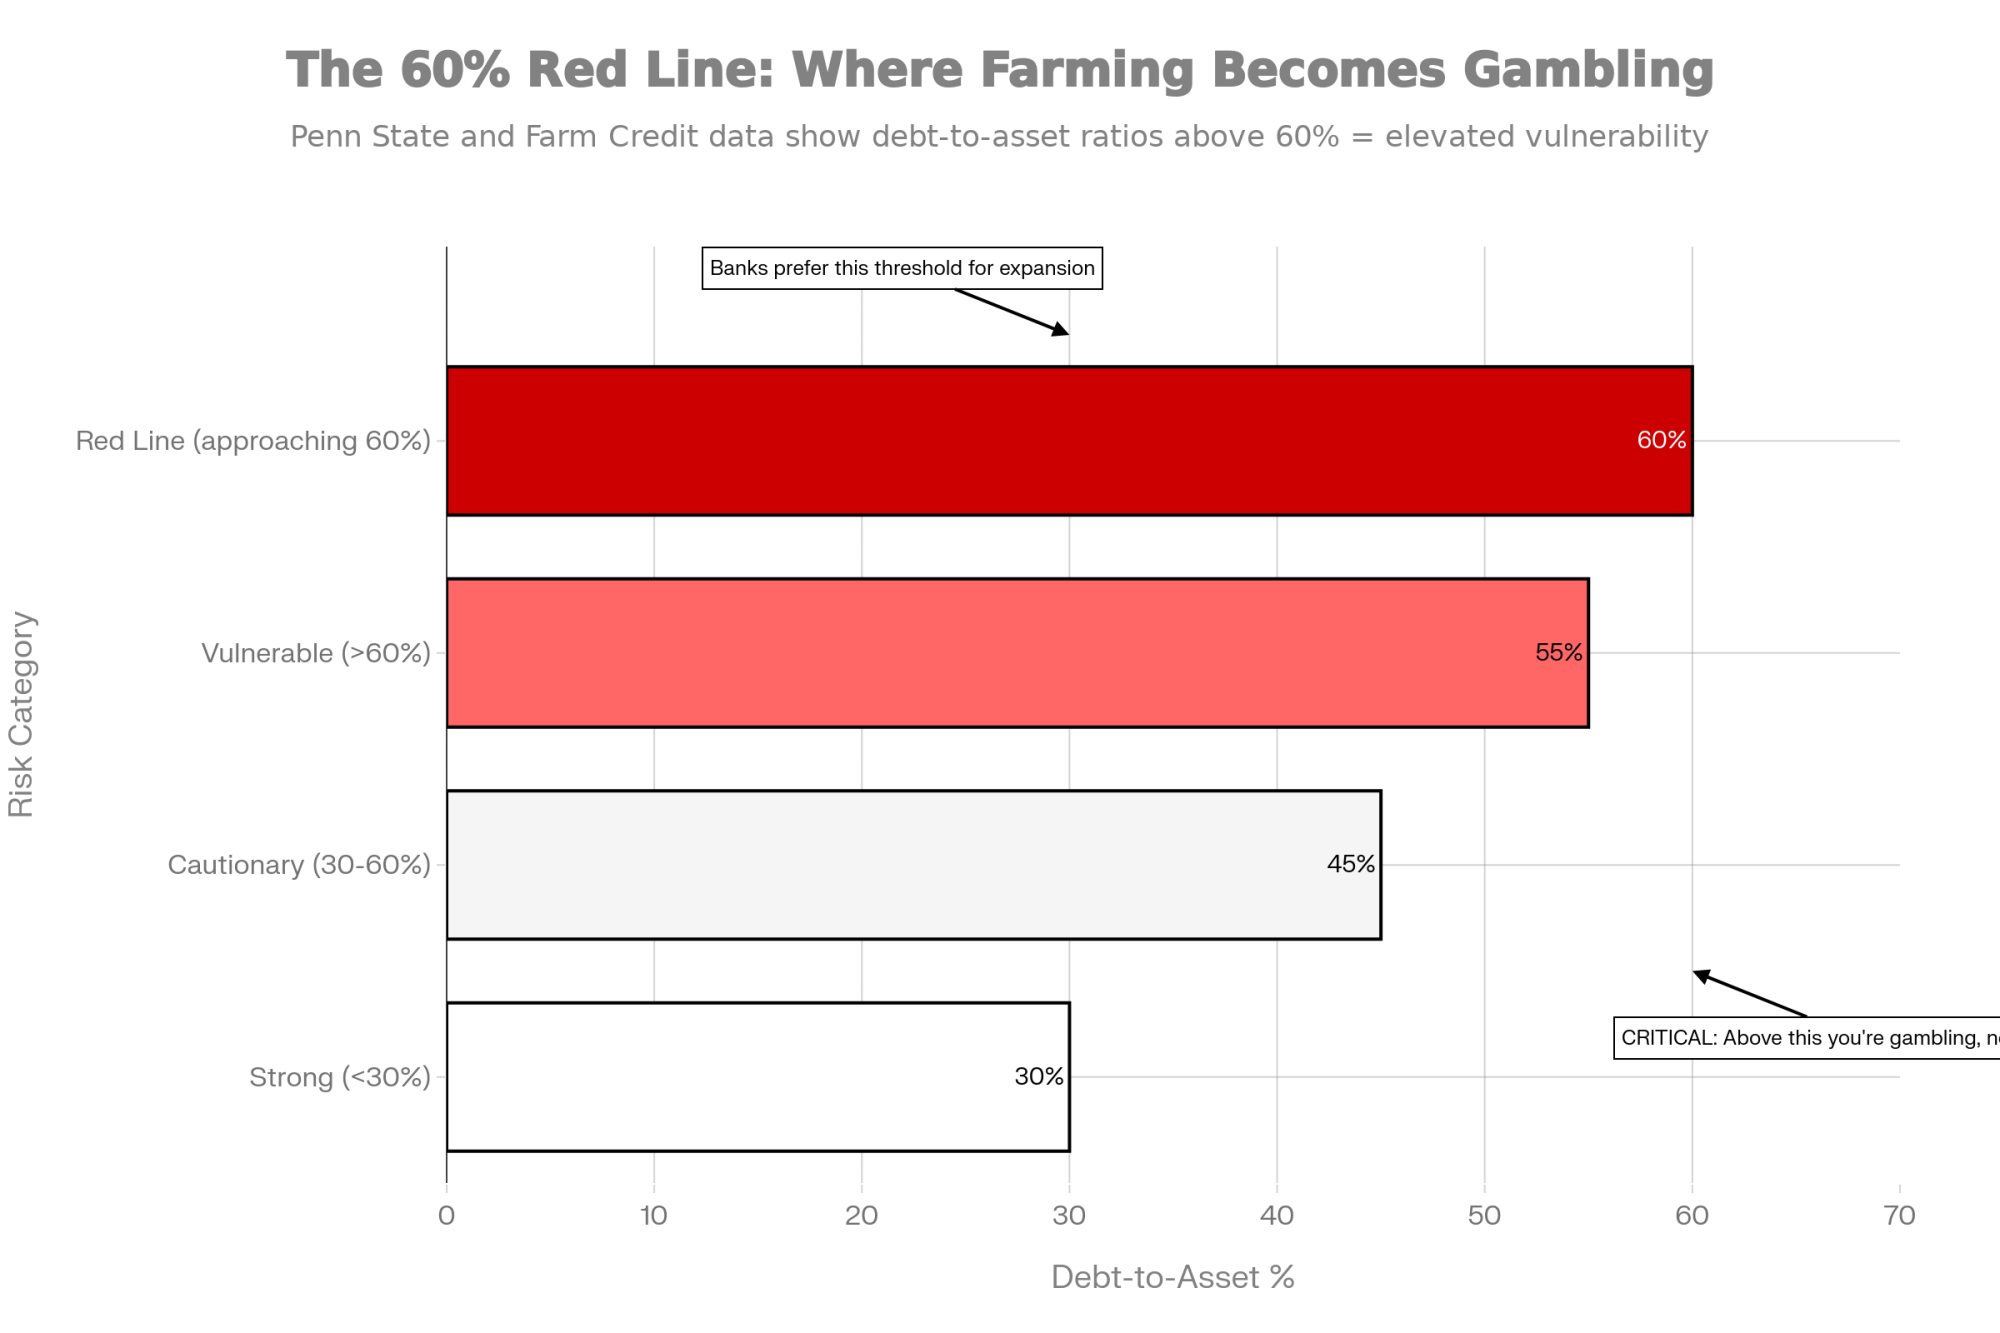
Ag credit reports from the Chicago Federal Reserve show that by late 2023 and into 2024, average farm operating loan rates in that district had climbed to about 8.5% at their peak and then eased slightly to just over 8%, while farm real estate loan rates sat roughly in the mid‑7% range. Purdue ag finance updates and related summaries note that these are the highest farm borrowing costs since the mid‑2000s.
CoBank’s financial statements shows higher provisions for credit losses in 2025 compared to the very low levels of 2021–2022, which is another way of saying lenders are paying much closer attention to risk again. Nobody is slamming the door on dairy, but the days of cheap money and easy approvals are over for now.
On many dairies—from 60‑cow parlors in New England to 2,000‑cow freestalls in Idaho—the lender conversation now revolves around three questions:
- What if milk averages mid‑$16s instead of high‑$18s for the next 12–18 months?
- Does this capital project still pencil at 7–8% interest and realistic feed and labor costs?
- What’s the plan if 2026 turns out “just okay” instead of strong?
For a 300‑cow operation carrying $4–5 million in total debt, moving from roughly 4% to 7–8% interest can add tens of thousands of dollars in interest expense each year, depending on amortization and structure. That’s money that used to be available for principal, repairs, or family living.
I’ve heard more than one banker say their informal stress test now is: “Would you still be comfortable at $16 milk for 18 months?” It’s not a forecast; it’s a guardrail. In a year where USDA and the futures board don’t agree, and exports are strong but price‑sensitive, that kind of discipline matters.
If milk spends half the year at your budget price, do you have anything in place to prevent it from crushing cash flow?
Planning in a $17‑ish World: Five Strategies That Are Working
So with all those moving pieces—USDA vs. futures, record exports at discount prices, big component shifts, new stainless, and 8% money—the practical question is: what do you actually do when you sit down with your 2026 plan?

Here are five strategies that are working on real farms right now.
1. Let the Class III curve anchor your budget
One approach that’s gaining traction is straightforward: build your base budget off the Class III futures strip, and treat USDA’s all‑milk forecast as upside.
If the average of the next 6–12 Class III contracts is sitting in the mid‑$16s, you can:
- Use that futures‑based number as your core milk price in the plan, then apply your historical mailbox basis and component performance.
- Build a second scenario using something closer to USDA’s high‑$18 to low‑$20 all‑milk range and ask, “If we actually see that, what would we change about capital and risk decisions?”
In a 150‑cow family tie‑stall in Ontario or Vermont, that upside scenario might be where a parlor retrofit or bunk upgrade moves ahead. In a 1,200‑cow freestall in Wisconsin or New York, it might be where the next phase of stall renovation or manure handling upgrades makes sense.
Either way, the survival plan—the one your lender sees first—is built around the futures‑anchored price, not the rosiest forecast on the page.
2. Take advantage of a friendlier feed market—without getting greedy
The good news is that feed isn’t the villain it was a couple of years ago.
Corn has generally traded in the high‑$3 to low‑$4 per bushel range, and soybean meal in the high‑$200s to low‑$300s per ton, a long way from the spikes of 2022. USDA’s Dairy Margin Coverage calculations show that by late 2025, the feed‑cost portion of the DMC margin had improved to its best levels since about 2020 as grain and protein prices eased.
That gives you a window to lock in some feed at workable prices.
A middle‑ground approach many herds are using looks like this:
- Lock in 60–75% of core purchased feed—corn, soybean meal, key by‑products—for the next 6–9 months.
- Keep 25–40% open to allow for ration tweaks, herd-size adjustments, or price improvements.
- Avoid locking 100% for a full year unless your operation is very stable, and you’re comfortable with that risk.
For smaller and mid‑size herds, DMC remains a valuable safety net. USDA and extension analyses show that higher coverage levels on the first 5 million pounds have paid out in multiple low‑margin years since the 2019 redesign. For larger herds, Livestock Gross Margin for Dairy (LGM‑Dairy) offers a subsidized way to insure a futures‑based milk‑over‑feed margin.
Research from universities like Wisconsin and Kansas State shows that herds using a rules‑based margin strategy—consistent use of DMC, LGM‑Dairy, futures, and options around target margins—tend to see less income volatility than herds that act only when markets get scary. You’re not trying to pick the exact bottom; you’re trying to avoid being naked when both milk and feed move against you.
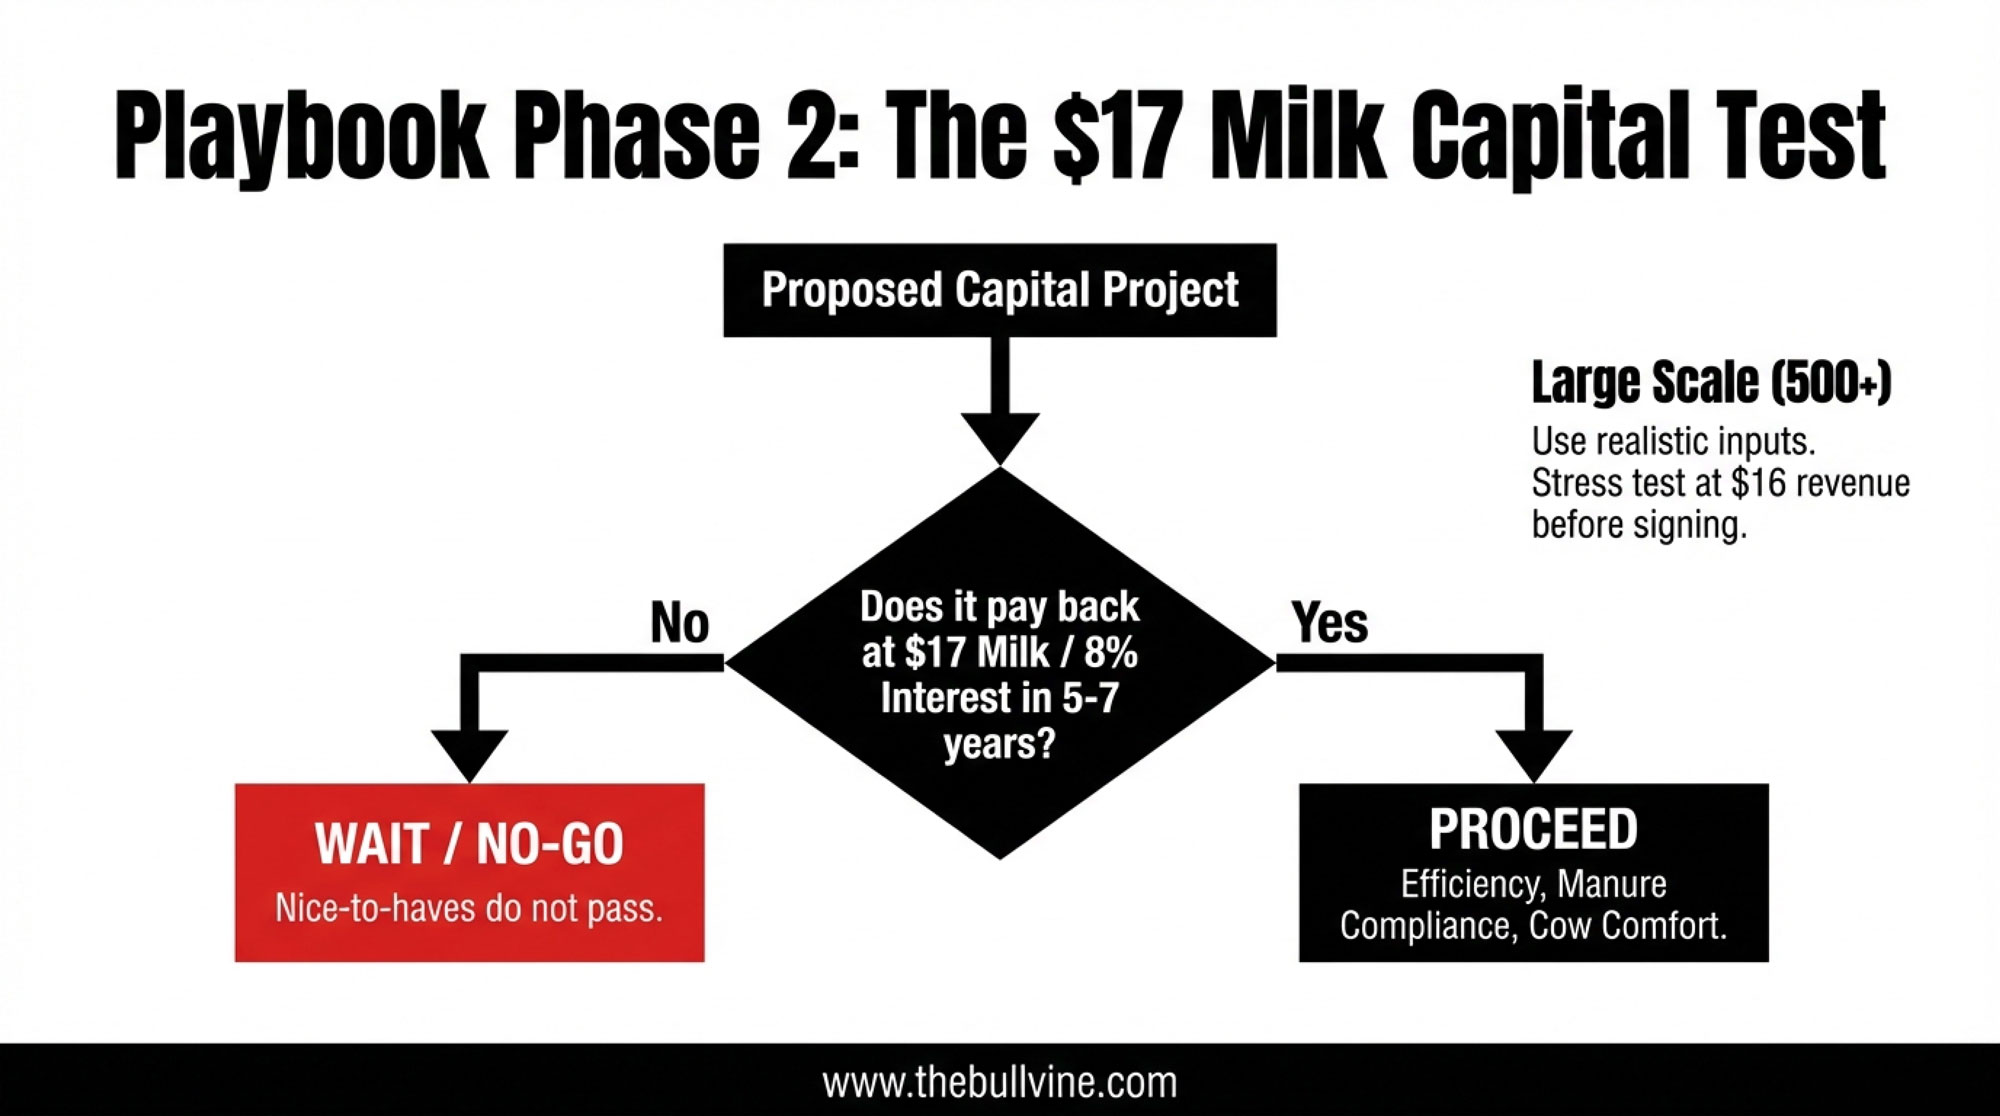
3. Make every capital project pass a $17 milk test
In an 8% money world, every barn, parlor, and piece of iron has to earn its keep.
A simple rule that works well is: if a project can’t pay for itself at about $17 milk and today’s interest rates within 5–7 years, it probably belongs on the “later” list.
| Project Type | Capital Cost | Cash Flow @ $16/cwt | Cash Flow @ $18/cwt | Payback @ $17 (yrs) | Recommendation |
|---|---|---|---|---|---|
| Parlor upgrade (60 cows/hr to 90) | $280,000 | $22,400 | $38,500 | 5.2 | PROCEED—labor payoff in peak season; health spillover |
| New VMS (50-cow system) | $450,000 | -$8,200 | $12,600 | >10 | DEFER—milking labor gains don’t offset cost at $16 milk |
| Freestall renovation + new bedding | $165,000 | $18,900 | $28,400 | 4.6 | PROCEED—cow comfort drives milk/reproduction ROI |
| Manure handling (solid separator + storage) | $220,000 | $14,200 | $22,100 | 5.8 | PROCEED—compliance + nutrient value; essential |
| New feed mill automation | $95,000 | $11,500 | $16,800 | 3.1 | PROCEED NOW—fastest payback; ration consistency ROI |
| Robotic feed pusher (2 units) | $180,000 | $3,400 | $8,200 | 8.1 | DEFER—marginal labor benefit; wait for $18+ milk |
For 100–250‑cow family herds, that tends to move projects that protect daily performance and cow health to the front:
- Milking system reliability and throughput
- Manure handling that keeps you compliant and efficient
- Ventilation, bedding, and stall comfort
- Functional fresh cow and transition facilities
“Nice‑to‑have” projects that don’t clearly move milk, health, or labor safety can wait.
For 500–1,500‑cow freestall or dry lot systems, the numbers are bigger, but the logic is the same:
- Use mid‑$16–$17 milk in your cash‑flow, not $19 or $20.
- Plug in realistic feed, labor, and 7–8% interest from your lender.
- Sit with your lender and run a $16 milk stress test for 12–18 months before you sign.
Lenders are more eager to support capital when they see conservative assumptions and honest downside modeling, not just best‑case spreadsheets.
Letting Components – and Fresh Cows – Carry More of the Load
Components are a lever you can pull without adding cows or concrete.
Butterfat pounds have grown about 30.6% since 2010, compared with 15.9% growth in total milk, and that butterfat output was running 3–4% higher year‑over‑year in early 2025 while milk barely budged. We also know from CoBank that butterfat has accounted for most milk checks over the last decade, driving a butterfat boom, and that protein has risen about 6% in the same period.
At the same time, CoBank, Geiger, and academic work on milk quality argue that processors—especially cheese plants—need a more balanced protein‑to‑fat ratio to optimize yields and manage standardization cost. So the farms that do best are often those that produce strong but not extreme butterfat with rising protein, not just the highest fat test in the county.
On the cow side, that typically means:
- Investing in fresh cow management and the transition period so cows hit peak intake without a wreck.
- Tuning amino acid balance instead of endlessly raising crude protein.
- Focusing on forage quality and consistency so you’re not fighting the ration every week.
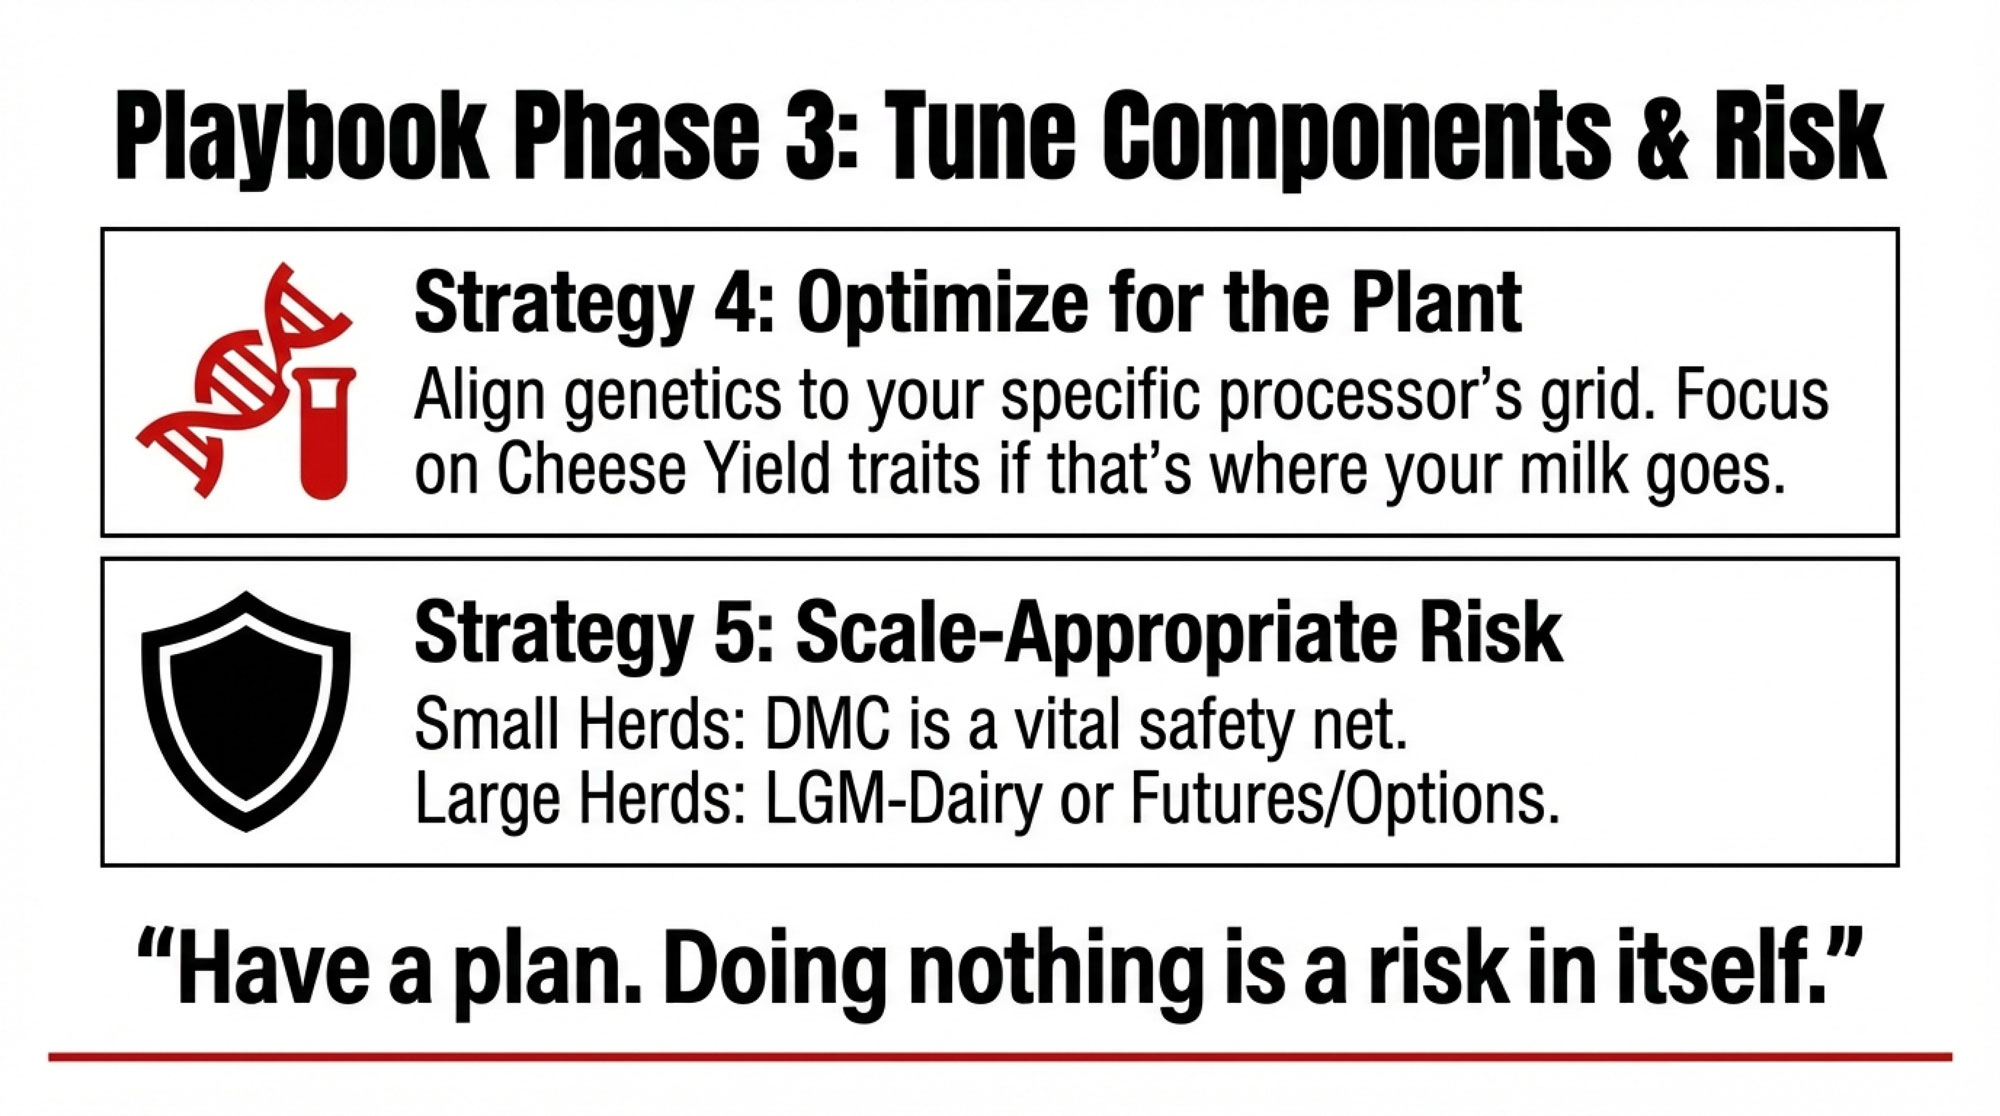
On the genetics side, CoBank’s report and Bullvine’s own component‑ratio work highlight herds using genomic tools and custom indexes that weight butterfat, protein, total solids, and cheese-yield traits, especially where plants pay on solids and yield.
If you’re under Canadian supply management, the pricing grid and quota rules are a bit different, but the same principle applies: match your component profile to what your board and processors value most.
Using Risk Tools That Fit Your Scale

| Month | 2023 High | 2023 Low | 2023 Close | 2024 High | 2024 Low | 2024 Close | 2025 YTD High | 2025 YTD Low | 2025 YTD Close |
|---|---|---|---|---|---|---|---|---|---|
| Jan | $18.20 | $16.80 | $17.10 | $17.50 | $15.80 | $16.40 | $16.80 | $15.20 | $15.65 |
| Feb | $18.60 | $17.20 | $17.50 | $17.80 | $16.10 | $16.70 | — | — | — |
| Mar | $18.90 | $17.60 | $18.20 | $18.10 | $16.40 | $17.10 | — | — | — |
Most producers don’t want to live on a futures screen, and they don’t need to. But in a year when USDA and the board are a couple of bucks apart, and interest is high, having no risk plan is a risk in itself.
A practical, scale‑friendly approach looks like this:
- Once a month, glance at Class III and IV futures and ask whether things are better, worse, or about the same as when you built your plan.
- Talk with your co‑op or buyer about forward‑pricing pools or risk programs where they handle the hedging, and you commit a portion of your milk.
- If you’re in the 1,000‑cow‑plus range, consider working with a risk adviser who uses rules and target margins, not just hunches.
University extension work on dairy risk management consistently shows that herds using structured, rules‑based programs with DMC, LGM‑Dairy, futures, and options have smoother income over time than herds reacting sporadically when markets look scary.
The key is to pick tools that fit your scale, comfort level, and co‑op structure, not to copy whichever strategy your neighbor talks about the loudest.
Different Farms, Different Realities
As you know, the same Class III price can feel very different two roads over.
For 100–250‑cow family herds in regions like New England, Maine, Wisconsin, New York, and Pennsylvania, the biggest pain points are usually cash flow, debt service, and family labor. Conservative price assumptions, sensible feed coverage, and smart use of DMC (or quota‑aligned tools in Canada) often do more good than chasing every 20‑cent move. On‑farm processing or direct marketing can be powerful for some, but only where there’s real local demand and labor capacity.
For 250–800‑cow operations across the Upper Midwest, Northeast, and parts of the West, working capital, component income, and labor efficiency tend to move the needle fastest. Lenders in these regions often say they’re most comfortable when they see:
- Budgets run at $16–$17 milk
- At least some margin protection in place
- A capital program paced for 7–8% money, not cheap‑money days
For 1,000‑cow‑plus herds—multi‑site freestalls, big dry lot systems in the West and Southwest—processors care a lot about consistency, quality, and risk profile. Multi‑year supply deals, basis arrangements, and structured hedge programs can smooth income if they’re built around realistic margins and checked regularly.
Across all sizes, the farms that tend to come out of tight cycles with options left are usually the ones that:
- Know their true cost of production
- Are honest with themselves and their lenders about leverage
- Make small, early adjustments when margins pinch instead of waiting for a crisis
The Short Version
If we were at a winter meeting in Listowel or Tulare and you slid your coffee across the table and said, “Alright, just give me the quick list,” here’s how I’d boil it down:
- Plan off the futures strip, not the prettiest forecast. Use the 6–12‑month Class III average—roughly the mid‑$16s right now—as your base and treat USDA’s higher all‑milk projections as upside, not your starting point.
- Lock in some feed while it’s reasonable. With corn and soybean meal back in more manageable ranges and DMC margins much better than in 2022, it makes sense to protect part of your feed so a spike doesn’t wreck your year.
- Make capital prove it works at $17 milk and 8% interest. Any barn, parlor, or equipment upgrade that doesn’t pencil at about $17 milk and current rates within 5–7 years needs a tough second look before you sign.
- Let components and fresh cow management do more of the lifting. Butterfat performance is strong, and protein’s value is rising in many pay systems. Align your ration, fresh cow management, and genetics with the component blend your plant or board actually pays for.
- Have the hard conversations early. Sit down now—with your lender, co‑op, nutritionist, and family—while there’s still time to tweak the plan instead of scrambling later.
The Bottom Line
The encouraging part of all this is that the long‑term demand story for North American dairy remains strong. USDEC numbers and Bullvine coverage show record or near‑record cheese and butterfat exports, and through three quarters of 2025, U.S. butterfat exports were up triple digits in volume, with butter export value surpassing prior full‑year records. CoBank’s $10‑billion stainless estimate—and the plants you can actually drive past—show processors still betting big on future milk.
You don’t have to operate like milk will stay at $16 forever—but you can’t afford to build a 2026 plan that only works at $20, either.
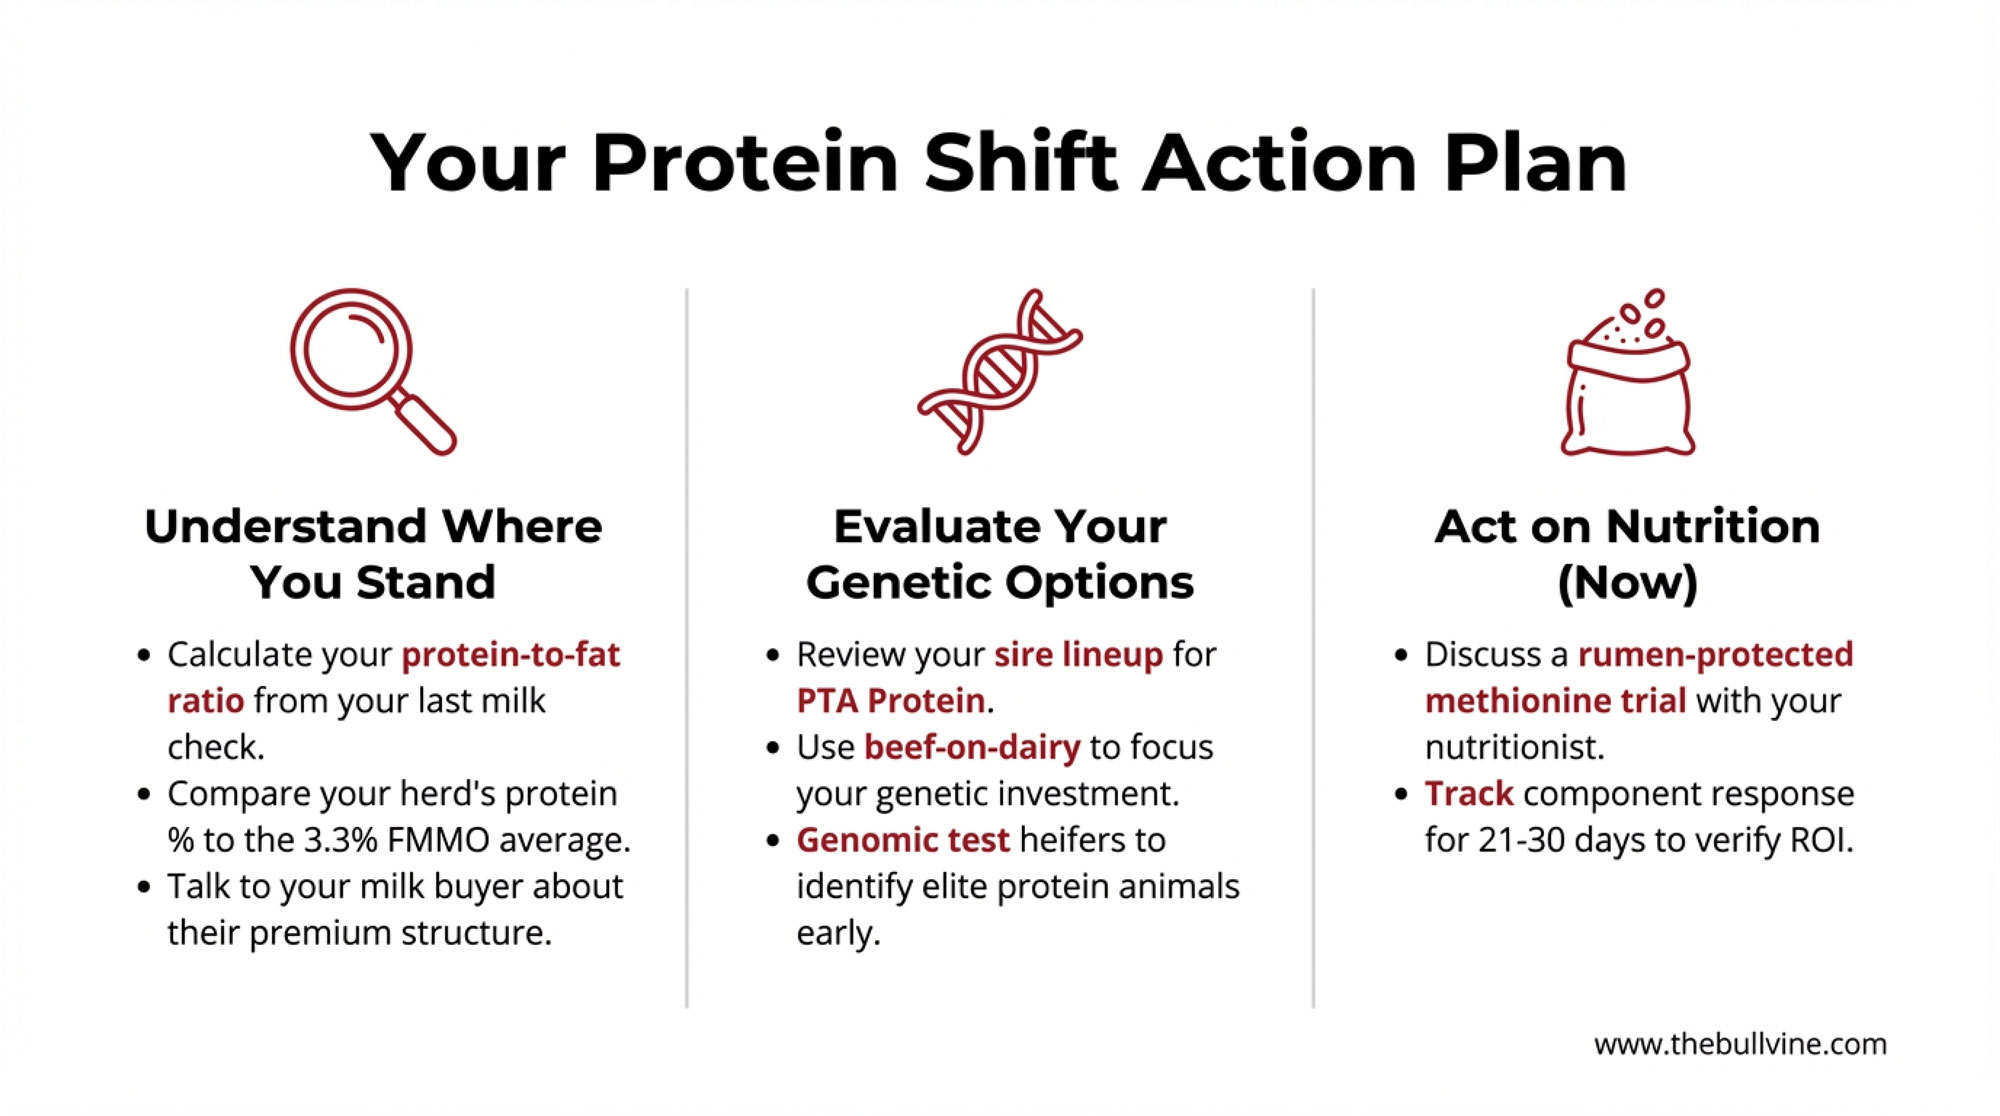
Before March, sit down with: (1) your lender, with a $16–17 milk stress‑tested budget; (2) your nutritionist, with explicit butterfat and protein targets; and (3) your co‑op or buyer, with a specific risk‑tool and contract conversation. If the last couple of decades have taught anything, it’s that the better stretch does come back around. The herds still standing when it does are the ones that took years like 2026 seriously, planned conservatively, and kept just enough powder dry to move when the wind finally shifted in their favor.
Key Takeaways
- Mind the $150K gap: USDA forecasts 2026 all‑milk near $18.25/cwt; Class III futures sit in the mid‑$16s. For a 300‑cow herd, budgeting off the wrong number is a $150,000+ mistake.
- Record exports, discount prices: U.S. cheese exports jumped 28% and butterfat nearly tripled in August 2025—but we’re winning volume by pricing below the EU and New Zealand, not by earning premiums.
- Protein is catching up to fat: Butterfat led the check 8 of 10 years, but cheese plants now want balanced protein‑to‑fat ratios. Herds shifting to 3.8–3.9% fat with 3.2%+ protein are seeing better component checks.
- $17 milk is the new capital test: At 7–8% interest and lenders stress‑testing at $16 milk, any project that doesn’t pay back at ~$17 milk within 5–7 years belongs on the “later” list.
- Act before March: Budget off futures (not USDA), lock 60–75% of feed for 6–9 months, stress‑test every capital decision, align components with your plant’s pay grid, and put risk tools in place that match your scale.
Complete references and supporting documentation are available upon request by contacting the editorial team at editor@thebullvine.com.
Learn More
- The $15,800 DMC Decision Every Dairy Needs to Make Before February 26 – Stop leaving cash on the table. This breakdown reveals the exact math behind the $15,800 DMC advantage and delivers a step-by-step method to protect your 2026 margins before the February 26 enrollment deadline.
- The Bullvine Dairy Curve: 15,000 U.S. Farms by 2035 and Under 10,000 by 2050 – Who’s Still Milking? – We expose the structural reality of the “Dairy Curve.” This analysis arms you with the long-term strategy needed to position your operation among the 15,000 survivors, ensuring you’re not just milking, but thriving through 2050.
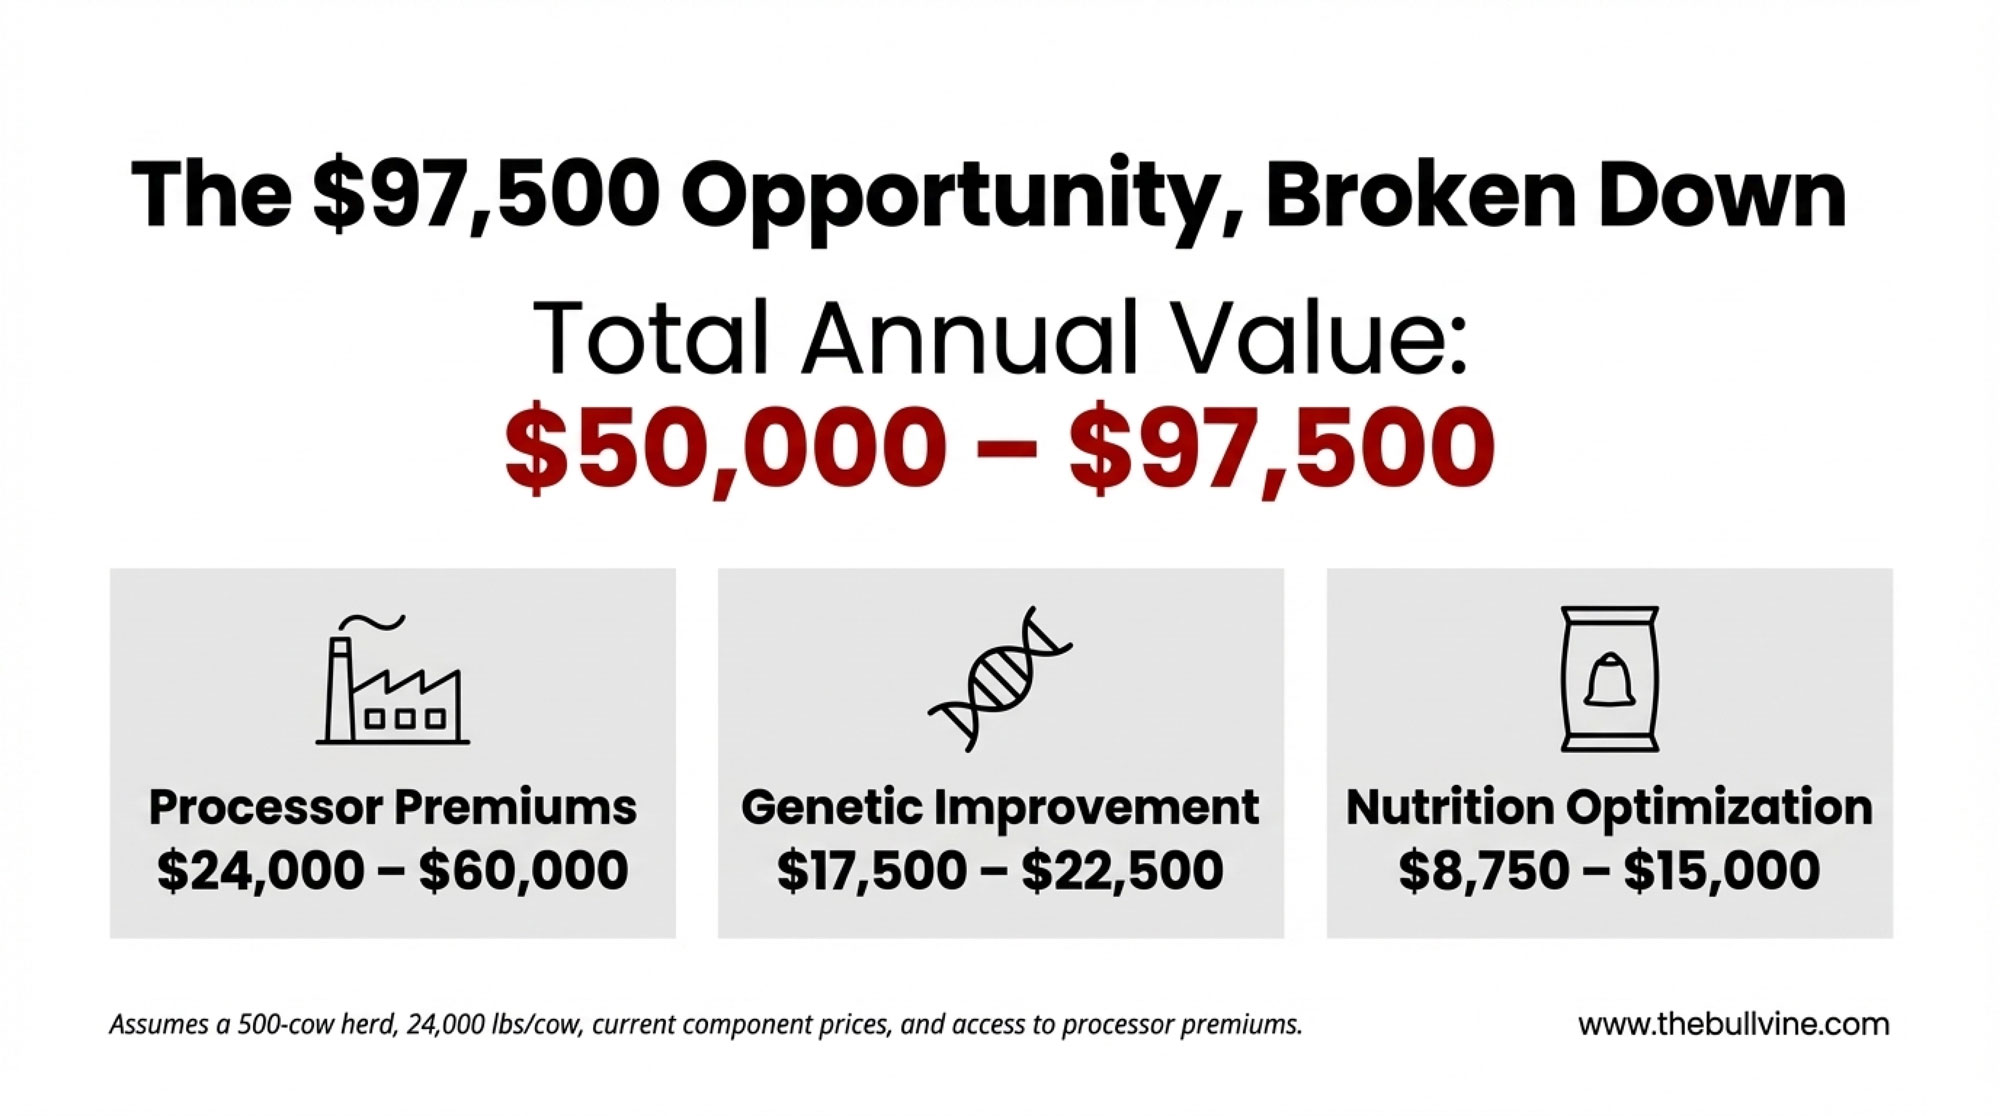
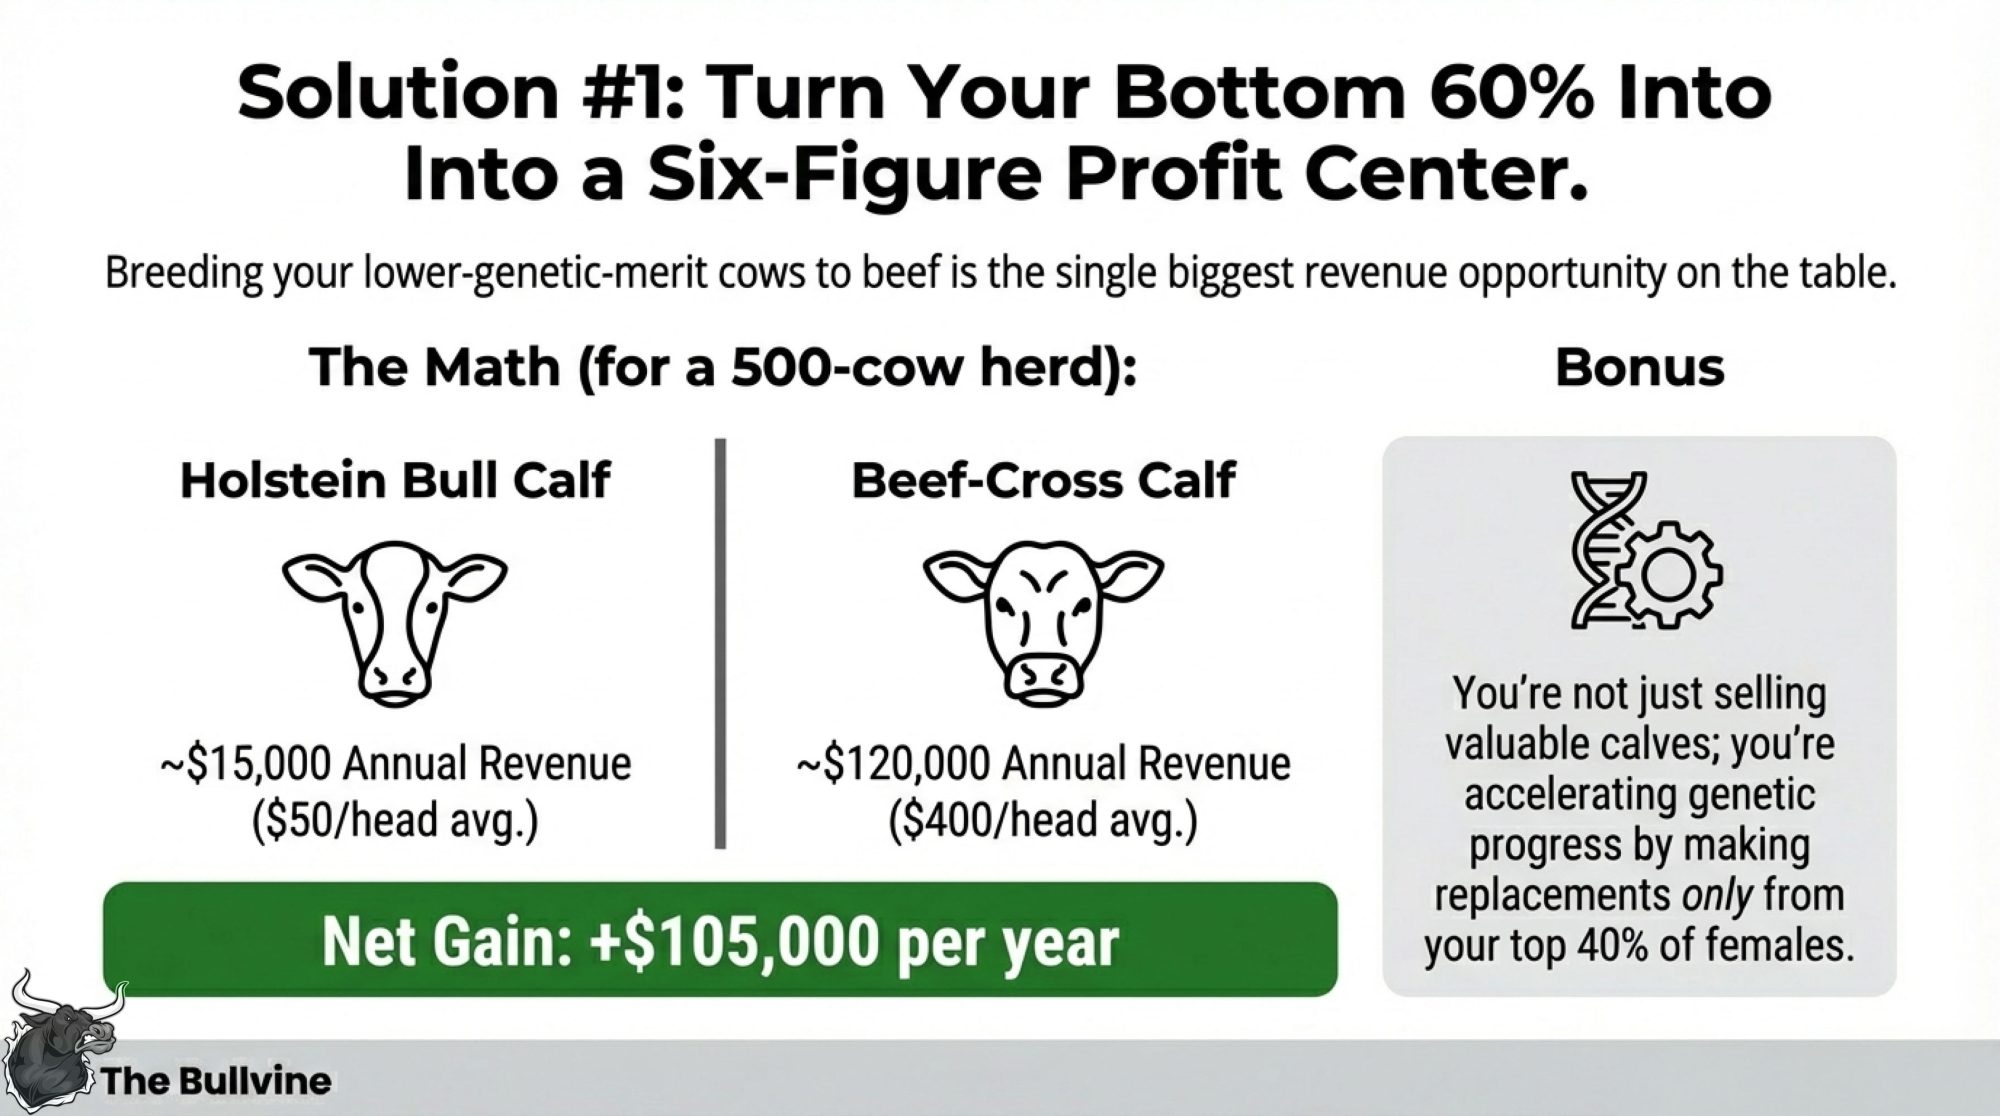
- The 2026 Breeding Playbook: Using Calf‑Health Genomics and Beef‑on‑Dairy to Unlock $50,000 in Your Herd– Genomics isn’t just about production anymore. This playbook breaks down how integrating calf-health traits with beef-on-dairy can unlock a $50,000 competitive advantage, allowing you to stop feeding the bottom 20% of your herd.
 The Sunday Read Dairy Professionals Don’t Skip.
 The Sunday Read Dairy Professionals Don’t Skip.
Every week, thousands of producers, breeders, and industry insiders open Bullvine Weekly for genetics insights, market shifts, and profit strategies they won’t find anywhere else. One email. Five minutes. Smarter decisions all week.