Archive for dairy profitability strategies

The Rules Changed and Nobody Told You: Three Paths Left for the 300-Cow Dairy

Seven dairy farms disappear. Every. Single. Day. If you’re under 500 cows, you have 18 months to choose: Scale, pivot, or exit.

EXECUTIVE SUMMARY: The dairy industry is experiencing a seismic shift: 7 farms disappear daily as we consolidate from today’s 24,500 operations toward just 8,000-12,000 by 2035, with 400 mega-farms controlling 75% of production. The $11 billion in new processing investment tells the real story—it’s pre-contracted to 5,000+ cow operations, leaving 300-cow dairies facing three brutal choices: invest $3-5 million to scale up, spend $600,000-1.2 million transitioning to premium markets, or exit now for $700,000-1.1 million before equity evaporates. Your cooperative has become your competitor, with DFA controlling 30% of US milk while operating processing plants that profit from keeping your milk prices low. The economics are undeniable: farms with over 1,000 cows achieve 20-25% lower costs, creating an unbridgeable competitive gap for mid-sized operations. Agricultural lenders confirm you have 18 months—credit is tightening, and consolidators’ appetite for acquisitions peaks in 2025-2026. The bottom line is stark: standing still guarantees slow financial death, making no decision the worst decision of all.

Dairy industry consolidation

You know, I was having a chat with a third-generation Wisconsin dairy farmer last week—runs about 280 cows, really solid butterfat performance, knows his genetics inside and out. He said something that’s been rattling around in my head ever since:

“I feel like I’m playing a game where the rules changed, but nobody sent me the new rulebook.”

He hit the nail on the head. This isn’t just another rough patch we’re working through; the whole game is structured differently now. What I’ve found in USDA Economic Research Service modeling is that we could see mega-operations producing somewhere between 70 and 75 percent of America’s milk by 2035. We’re talking about going from roughly 24,500 dairy farms today—that January NASS count was eye-opening—down to maybe 8,000 to 12,000 operations in about a decade.

Here’s what’s really striking: the International Dairy Foods Association documented something like $11 billion in processing investments announced between 2024 and 2028. That’s not your typical expansion—that’s the industry rebuilding itself from the ground up.

For those of you managing 300-cow operations—and I talk to so many of you at meetings—understanding what’s happening isn’t about being negative. It’s about seeing clearly where opportunities still exist.

Farm consolidation accelerates: The US lost 63% of dairy operations since 2003 while boosting production 41%, with projections showing only 10,000 farms by 2035—down from today’s 26,000

When Your Cooperative Became Something Else

What’s fascinating—and honestly, a bit troubling—is how organizations like Dairy Farmers of America have evolved from their original marketing cooperative model into vertically integrated processors. This completely changes how milk moves from your tank to the market.

Consider this: DFA now controls nearly 30 percent of US milk production according to their annual reports, while operating dozens of processing facilities across North America. Let’s call it what it is: a conflict of interest. When your co-op becomes a processor, their profit margin depends on keeping input costs low. Your milk is the input. Do the math.

I was talking to a producer from upstate New York—does beautiful rotational grazing, really innovative guy—and he put it perfectly:

“After 22 years shipping to the same cooperative, the relationship feels fundamentally different. The negotiating dynamics have shifted in ways that are hard to articulate but impossible to ignore.”

The data backs up what he’s feeling. We’re seeing more and more member milk processed in cooperative-owned facilities, a huge shift from the traditional marketing model. And here’s something that should make everyone pause: federal court records show settlements totaling nearly $200 million since 2013, with the 2016 Northeast case alone hitting $158.6 million. These aren’t just theoretical tensions we’re talking about.

Where That $11 Billion Is Really Going

Everyone’s celebrating this $11 billion in processing investment. But let’s look closer at where that money’s actually flowing. IDFA’s October report details what they’re calling the largest dairy infrastructure investment in American history, and the geographic pattern tells you everything.

Chobani announced back in April that it’s building a $1.2 billion facility in Rome, New York. They’ve got another $450 million expansion going in Twin Falls, Idaho. Leprino Foods continues to expand in Texas, especially around Lubbock. These locations aren’t random—they’re following the consolidation that’s already happening.

Investment follows scale: Of $11B in new processing capacity, 70-78% is pre-contracted to mega-dairies before construction begins, leaving mid-sized operations competing for processing access in an oversupplied market

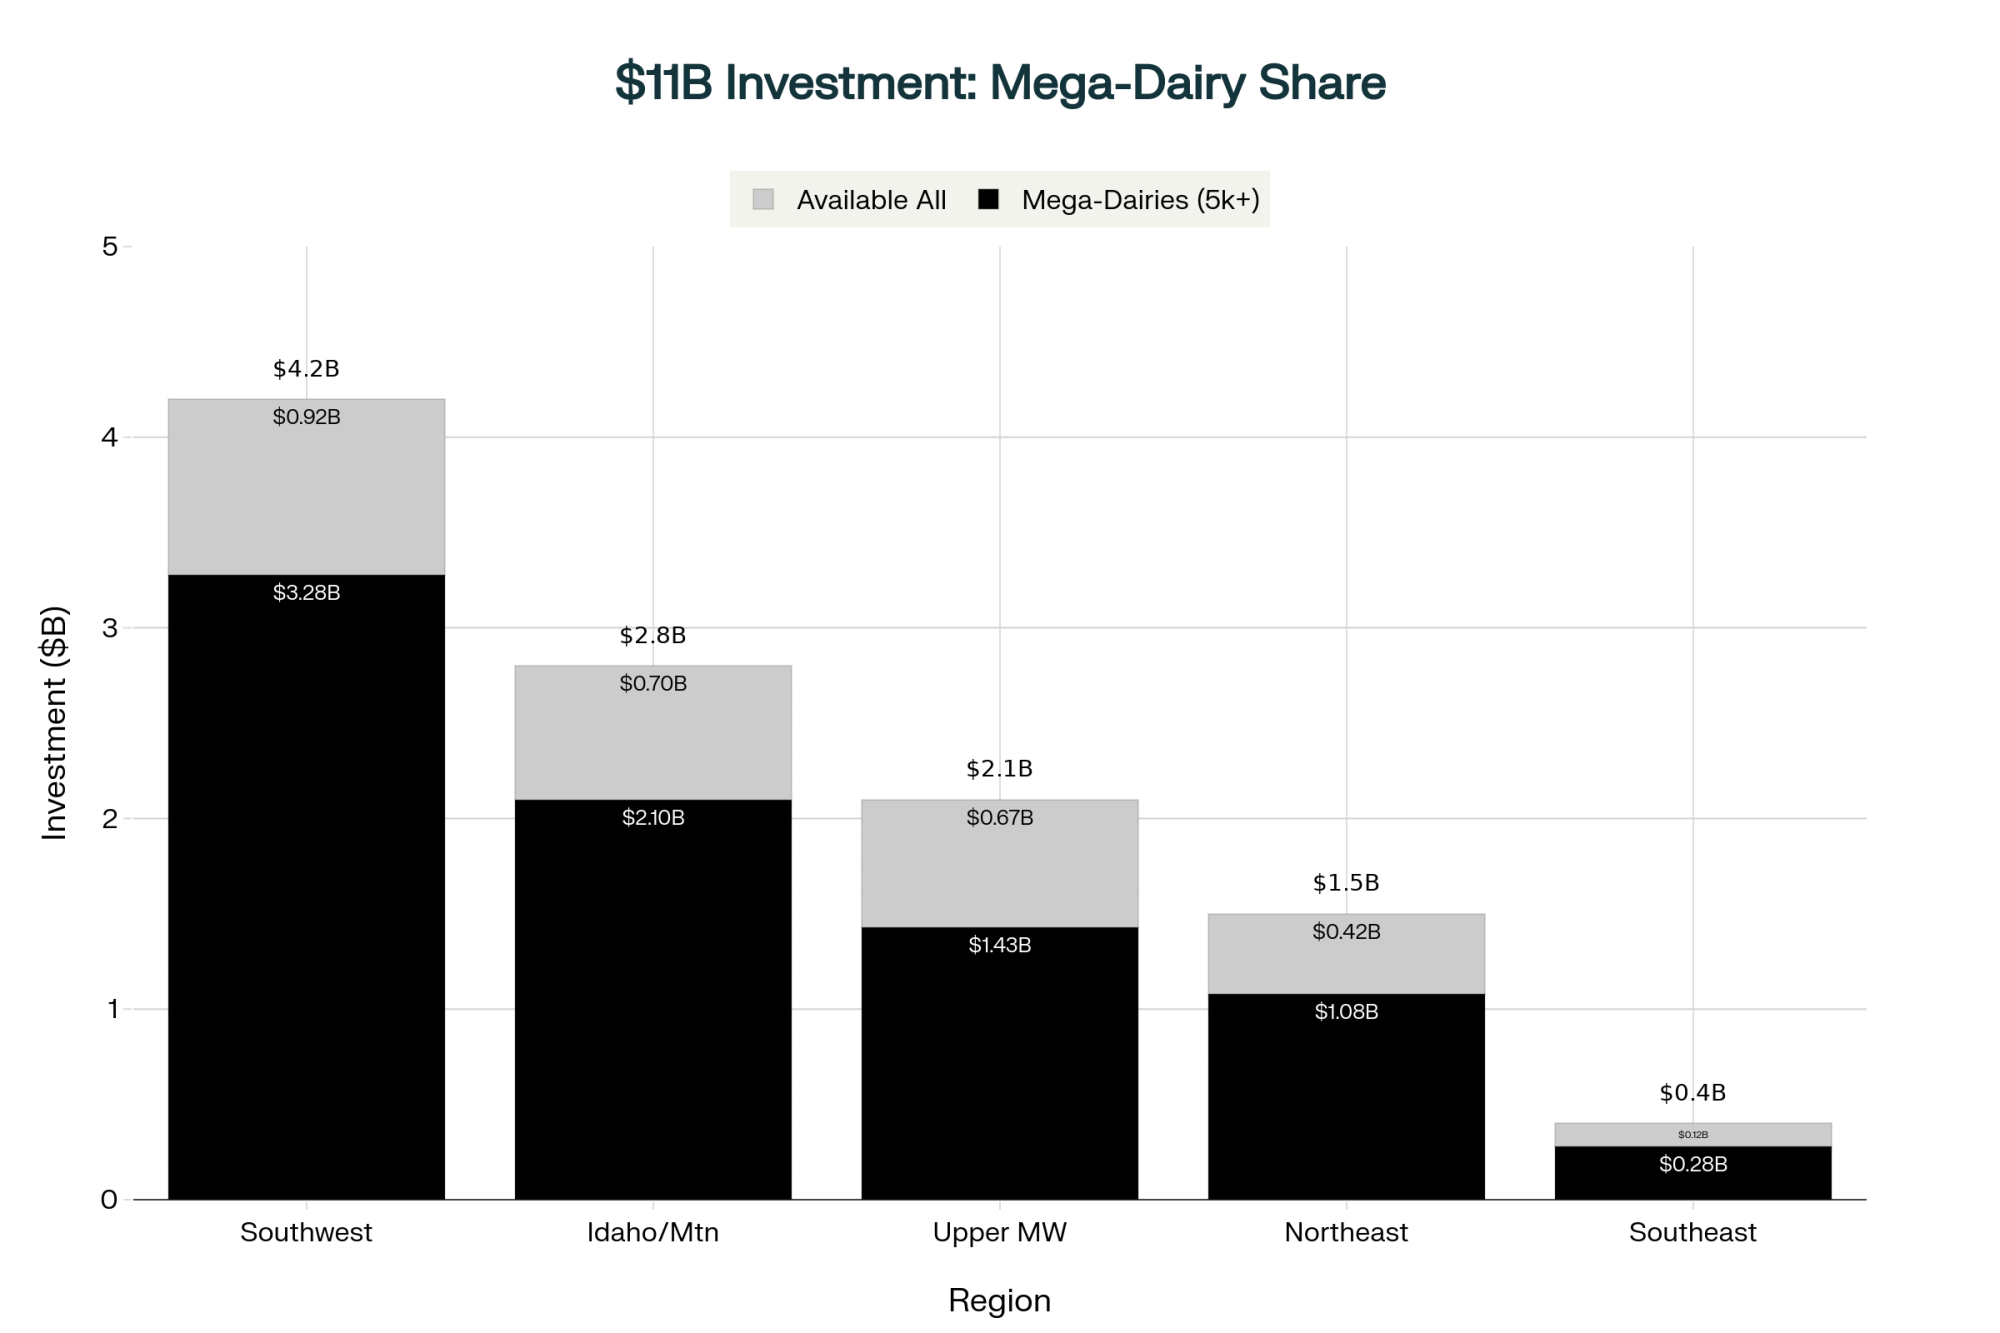
What industry analysts from Rabobank and CoBank have been telling us is that processors are increasingly locking up supply agreements with large-scale operations before they even break ground. They don’t publish exact percentages, but the pattern is crystal clear.

A Texas producer with 450 cows shared his experience trying to get into one of these new plants:

“The terms required a 10-year commitment for our entire production at annually-set prices. The minimum volume guarantee was 15 million pounds—more than double what we produce.”

These facilities… they’re not being built for folks like him. They’re designed for operations running 5,000 to 25,000 cows.

But here’s what gives me hope—in Pennsylvania’s Lancaster County, where you’ve still got lots of 100 to 300 cow operations, producers are finding creative solutions. A group of about 31 Amish and Mennonite farmers formed their own micro-cooperative last year, partnering with a local artisan cheese maker.

“We couldn’t compete on volume, but our grass-fed milk and traditional practices commanded premium prices in Philadelphia markets.”

Getting Out with Your Shirt On

NASS quarterly reports show we’re losing approximately 2,700 to 2,800 farms annually. That’s up from maybe 500 to 900 per year back in the early 2000s. Between 2017 and 2022 alone—and these census numbers are sobering—we lost 15,221 operations. Nearly a 38 percent decline in just five years.

The Center for Dairy Profitability at UW-Madison has been digging into these patterns, and its data show that operations with more than 1,000 cows achieve production costs roughly 20 to 25 percent lower than those of 500-cow farms. It’s basic economies of scale—same thing that reshaped retail, same thing that’s hitting us now.

Dr. Mark Stephenson from Wisconsin’s dairy markets program explained it to me this way: reaching competitive scale today requires approximately to 5 million in capital investment. For most mid-sized operations, accessing that capital while managing existing debt… well, you know how that math works out.

Economic modeling suggests we’ll stabilize somewhere between 8,000 and 12,000 operations by 2035. That’s a fundamental restructuring of the American dairy industry.

Three Paths Forward—What’s Actually Working

After talking to dozens of producers this past year, I’ve seen three main strategies emerge for operations in the 200- to 500-cow range. Each has its own opportunities and challenges.

Time destroys options: Delaying decisions costs $650,000 in equity over 13 months—from $850K in May 2026 to $200K by June 2027—as lenders tighten credit and consolidators lose interest

Scaling to Competitive Size

An Idaho producer who expanded from 800 to 3,600 cows over two years shared some hard truths:

“At 800 cows, even with good management, we were losing $200,000 annually at prevailing milk prices. At 3,600, with updated parlor technology and improved feed efficiency, we’re profitable at those same prices. The fixed cost distribution makes all the difference.”

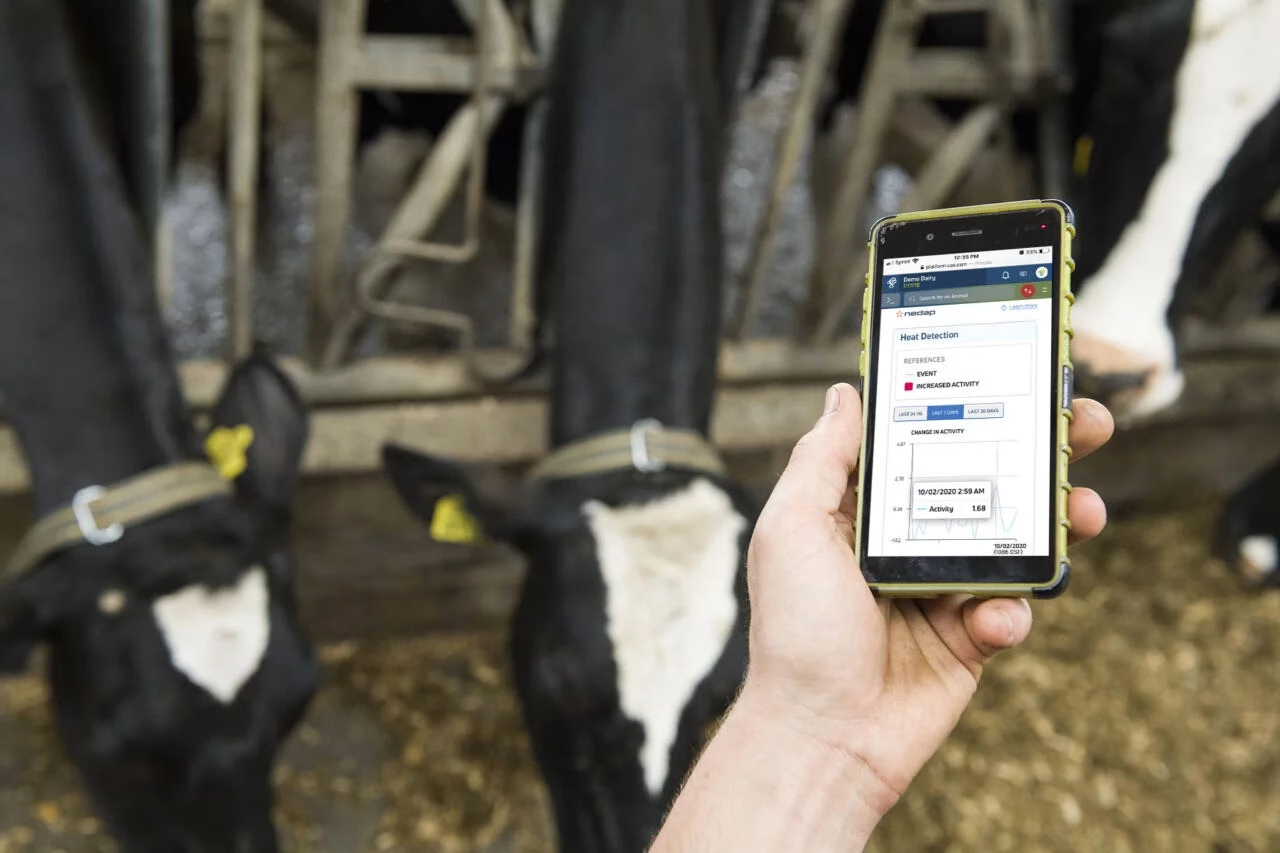
Here’s the reality of scale: You can’t just add cows; you have to add robots and data. USDA farm technology surveys show that robotic milking systems are now on nearly 3 percent of US dairy operations, yet those operations account for over 8 percent of national milk production. It’s mostly these scaling operations where labor efficiency becomes critical.

Based on what lenders are telling us and actual producer experiences, this pathway typically requires:

  • $3 to 5 million in capital for facilities, equipment, and genetics
  • At least 40 percent equity position for financing approval
  • Being close to processing—hauling costs will eat you alive beyond 100 miles
  • Committing to 15, maybe 20 years to recoup that investment

The success stories tend to be producers under 55 with strong equity and minimal debt. And timing? Critical. Expansions during favorable price cycles work. During downturns? Different story.

Premium Market Transition

An Alberta producer who transitioned her family’s 320-cow operation to organic five years ago offers another perspective:

“We experienced approximately 30 percent improvement in net farm income despite lower production volumes. The combination of reduced veterinary expenses, premium pricing, and eventually lower input costs created a sustainable model.”

Producers making this transition work report:

  • Transition costs of $600,000 to maybe $1.2 million
  • You need to be within about 50 miles of a metro market for direct sales
  • Need 3 to 5 years of capital reserves during transition
  • Marketing becomes just as important as production

“Those first two years nearly broke us. Year three reached break-even. Years four and five delivered the returns that justified the transition.”

A North Carolina producer adds another angle. His 180-cow operation transitioned to A2/A2 genetics and grass-fed production three years ago:

“The Research Triangle market—all those tech workers and university folks—they understand the value proposition. In our local market, we’re getting significantly more per hundredweight than commodity, and our production costs actually decreased once we optimized our grazing rotation.”

Some producers are also exploring renewable energy. A Vermont dairy with 400 cows installed an anaerobic digester system last year. “Between the renewable energy credits and reduced electricity costs, it’s potentially adding substantial value annually to our bottom line,” the owner reports. “It doesn’t solve everything, but it provides a crucial margin in tight years.”

Strategic Exit Planning

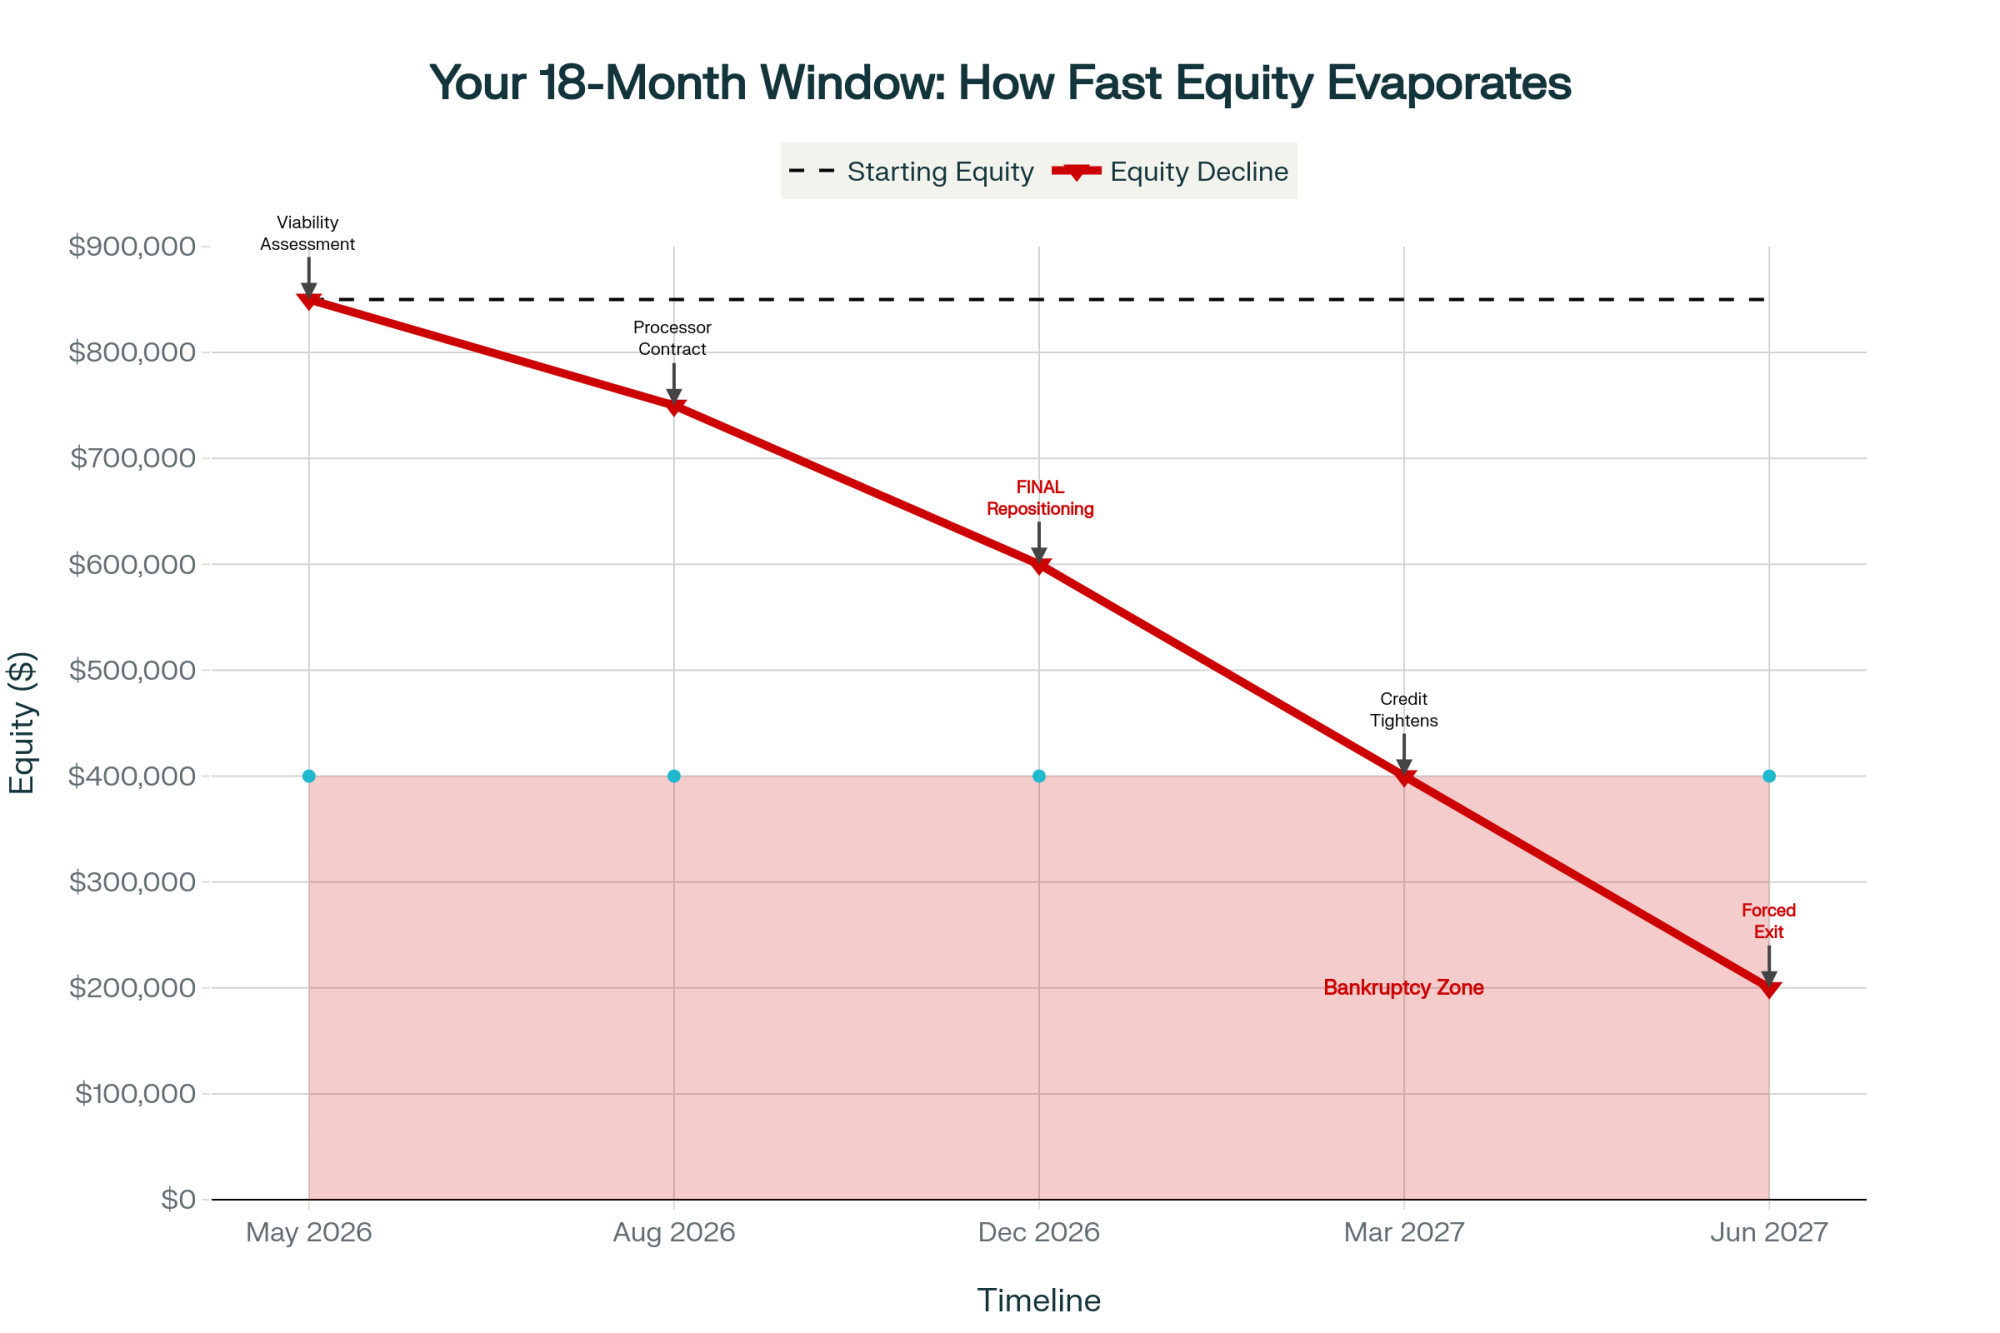
A Wisconsin producer who sold in early 2024 was refreshingly candid:

“With $850,000 in equity, I could have continued operating at marginal profitability for perhaps three more years. Instead, I accepted $720,000 from a consolidator. My neighbor, who waited, went through bankruptcy proceedings and retained maybe $100,000.”

Current market analysis from agricultural real estate specialists suggests:

  • Strategic sales to consolidators in 2025-2026: $700,000 to $1.1 million for typical 300-cow operations
  • Wait with continued losses: equity could erode to $200,000-400,000 by 2028-2029
  • Each year at break-even represents $100,000-200,000 in opportunity cost
Decision FactorSCALE UPPREMIUM PIVOTSTRATEGIC EXIT
Initial Investment$3-5M$600K-1.2M$0
Time to Profit8-10 years3-5 yearsImmediate
Year 5 Income+$180K+$95K$0
Equity Change-$1.2M (RED)-$300K (RED)+$750K (BLACK)
Risk LevelVERY HIGH (RED)HIGH (RED)LOW (BLACK)
Success RequiresYouth, debt, processingMetro proximityAccept reality
Best For<45 yrs, 40%+ equityNiche positioningPreserve wealth
Regional ViabilitySouthwest, Idaho onlyNortheast, MidwestAll regions

How Geography Is Reshaping Everything

Based on current investment patterns and USDA projections, American dairy production will concentrate in four primary regions by 2030-2035.

The Southwest—Texas, New Mexico, and Arizona—currently produces 32 to 34 percent of national milk, with projections suggesting a move toward 40 to 45 percent. These are your 5,000 to 15,000 cow dry-lot operations. But here’s the kicker—USGS data shows the Ogallala Aquifer dropping 2 to 3 feet annually. Water’s becoming the limiting factor.

Idaho has transformed remarkably in just one generation, now producing approximately 8 percent of the national milk. Chobani’s investments there… they’re following the consolidation, not driving it.

The Upper Midwest—Wisconsin, Michigan, Minnesota—that’s an interesting story. Still producing 18 to 20 percent of national milk, down from over 25 percent historically. What you’re seeing is bifurcation—either going mega or going specialty. The middle? That’s where the pressure is.

New York produces about 4 percent of the nation’s milk, yet its processing investment is massive. The capacity appears to exceed local milk supply, which creates interesting supply chain dynamics.

The Southeast faces unique challenges. A Georgia producer managing 400 cows told me:

“We’re seeing farms exit not because of economics alone, but because the next generation won’t tolerate the working conditions. The technology investments needed for heat abatement in our climate add another $500,000 to expansion costs that Northern operations don’t face.”

System Resilience—What Keeps Me Up at Night

Scale economics dictate survival: Mega-dairies (2000+ cows) produce milk at $16.16/cwt while mid-sized operations (300 cows) face $20.25/cwt costs—a $4+ structural disadvantage no management can overcome

The efficiency gains from consolidation are impressive, but when 40 to 45 percent of national milk production concentrates in water-stressed regions, we’re creating single-point vulnerabilities.

Dr. Jennifer Morrison from Cornell’s food systems program put it well: “Efficiency and resilience often exist in tension. We’re building remarkably efficient systems that may prove fragile under stress.”

Recent screwworm detections, shifting climate patterns, labor challenges… USDA APHIS has contingency plans, sure, but concentrated production carries fundamentally different risk profiles than distributed systems.

Collective Action Still Works

Here’s what’s encouraging: in September, approximately 600 Irish dairy farmers successfully pressed Dairygold for written accountability on pricing decisions. The Irish Farmers Journal covered it extensively. They didn’t tear anything down—they just demanded transparency through organized, professional engagement.

Back home, the American Farm Bureau Federation is pushing for modified bloc voting in their 2025 priorities—letting farmers vote individually rather than having cooperatives vote for them. The National Sustainable Agriculture Coalition mobilized over 130 advocates to engage Congress earlier this year.

Regional organizing is showing promise, too. Vermont producers have formed transparency coalitions to request detailed milk-check breakdowns. California’s Central Valley sees mid-sized dairies exploring collective negotiation.

Pennsylvania offers a particularly instructive example. Approximately 28 dairy farmers started meeting monthly to compare milk check deductions. After finding significant variations within the same cooperative and region, they presented consolidated data to their board and received substantive responses for the first time.

“Individual concerns get dismissed. But 28 farmers with documentation command attention.”

Key Questions for Your Cooperative

Start pressing for transparency with these specific requests:

✓ Request itemized breakdowns of all milk check deductions
✓ Seek written explanations of member versus non-member pricing
✓ Inquire about percentages of cooperative income from member versus non-member business
✓ Request voting records on significant pricing decisions
✓ Understand how board representation aligns with regional membership

What This Means for Different Operation Sizes

Survival margins vanish: A typical 300-cow operation generates $1.4M in revenue but nets just $62K after all costs—equivalent to $17/hour for 70-hour work weeks, before family living expenses

For operations with fewer than 250 cows, commodity-market math has become increasingly challenging without exceptional cost management. Premium market transitions offer possibilities if you’re geographically positioned right. Strategic exit planning may preserve more equity than extended marginal operation.

Producers in the 250- to 500-cow range face critical decisions. Scaling to a competitive size requires that $3 to 5 million, which we talked about. The premium market pivots demand, requiring different capital and marketing commitments. Maintaining the status quo typically means gradual equity erosion.

Operations running 500 to 1,000 cows are approaching the minimum viable commodity scale. Strategic partnerships with neighbors, collective arrangements, or, really, locking in processing relationships become essential.

Agricultural lending surveys from late 2024 show credit availability tightening as lenders see these exit rates. If you’re planning expansion, you’re looking at a 12- to 18-month window. M&A advisors specializing in dairy tell me that interest in consolidator acquisitions peaks in 2025-2026.

Addressing What We Don’t Like to Talk About

CDC and NIOSH research shows farmers face a suicide risk approximately 3.5 times higher than the general population. Financial stress is the primary factor, according to the University of Iowa’s agricultural medicine program.

Illinois has expanded mental health support for farmers through their Department of Agriculture wellness initiatives. Other states are developing similar programs. These aren’t just statistics—these are our neighbors, our colleagues, our friends.

A Minnesota farm widow shared something that stays with me:

“Watching three generations of work dissolve feels like personal failure, even when you understand it’s structural economics driving the outcome.”

The Bottom Line

American dairy is experiencing its most significant structural transformation since we mechanized. By 2035, we’ll have mega-operations, specialized premium producers, concentrated processing infrastructure—fundamentally different from the distributed system many of us grew up with.

What’s particularly interesting from a global perspective is how this consolidation positions American dairy internationally. As our production becomes more concentrated and efficient, we’re increasingly competitive in export markets—especially cheese and milk powder bound for Asia and Mexico. This global dimension adds another layer to domestic consolidation pressures.

Understanding these dynamics lets you make informed decisions while options remain. Success stories will emerge from this transition—producers who recognize patterns early and position accordingly. Solutions vary by region, operation size, life stage, and individual circumstances.

After covering this industry for over a decade and talking with hundreds of producers, one thing’s clear: the question isn’t whether to adapt—market forces have made that decision. The question is how to adapt, when to act, and what outcomes to target.

The consolidation reshaping American dairy is real, it’s accelerating, and it’s transformative. But producers who understand these dynamics, assess their positions honestly, and act decisively while maintaining strategic options can still chart successful paths forward.

The clock’s ticking, but opportunity windows remain open. The key is recognizing them and acting with purpose while time allows.

Your next step? This week, schedule time to honestly assess which of these three paths makes sense for your operation. Talk to your lender. Review your equity position. Have the hard conversations with family members. Because in this new game, the worst decision is no decision.

Resources for Industry Support

Mental Health Assistance:

  • Farm Aid Hotline: 1-800-FARM-AID
  • AgriSafe Network: 1-866-354-3905
  • National Suicide Prevention Lifeline: 988
  • State-specific farm stress hotlines

Financial and Transition Planning:

  • National Young Farmers Coalition: youngfarmers.org
  • Farm Financial Standards Council: ffsc.org
  • Center for Farm Financial Management: cffm.umn.edu

Industry Advocacy:

  • National Farmers Union: nfu.org
  • Organization for Competitive Markets: competitivemarkets.com
  • Farm Action: farmaction.us

KEY TAKEAWAYS:

  • The 400-farm future is inevitable: Daily losses of 7 farms are shrinking the industry from 24,500 to 8,000 operations by 2035, with mega-farms claiming 75% of production
  • Three paths remain—pick one: Scale to 3,000+ cows ($3-5M), pivot to premium markets ($600K-1.2M), or exit strategically now ($700K-1.1M before it drops to $100K)
  • Your co-op became your competitor: Organizations like DFA control 30% of milk AND processing—they profit from low milk prices that destroy you
  • Act within 18 months or lose everything: Credit markets are closing, consolidator interest peaks in 2025-2026, and standing still means bleeding equity until bankruptcy

Complete references and supporting documentation are available upon request by contacting the editorial team at editor@thebullvine.com.

Learn More:

Join the Revolution!

Join over 30,000 successful dairy professionals who rely on Bullvine Weekly for their competitive edge. Delivered directly to your inbox each week, our exclusive industry insights help you make smarter decisions while saving precious hours every week. Never miss critical updates on milk production trends, breakthrough technologies, and profit-boosting strategies that top producers are already implementing. Subscribe now to transform your dairy operation’s efficiency and profitability—your future success is just one click away.

NewsSubscribe
First
Last
Consent

Your Dairy’s 24-Month Countdown: Act Now or Lose $450,000 in Family Wealth

Every Monday you delay, you pay $17,500. Every month: $75,000. Your dairy’s 24-month survival plan starts with three decisions.

Executive Summary: Your dairy has 24 months of equity left, and the decision you make this month will determine whether you preserve $700,000 or exit with $250,000. This crisis differs from all others—China’s self-sufficiency, $11 billion in U.S. processing overcapacity, and the worst heifer shortage since 1978 have created a structural transformation that milk price recovery won’t solve. The math is clear: farms that act now can cut monthly losses from $25,000 to $8,000 through targeted culling, feed optimization, and strategic repositioning, while those waiting 6 months lose $450,000 in family wealth. Success requires three time-bound decisions: immediate liquidity management (30 days), strategic recovery positioning (90 days), and viability determination (180 days). The projected loss of 5,000 U.S. dairy farms by 2028 won’t be random—it will precisely separate those who recognized time as their scarcest resource from those who waited for markets to save them.

dairy survival strategy

I recently spoke with a producer in central Wisconsin who summed up the current situation perfectly: “Everyone’s watching milk prices, but what’s actually keeping me up at night is whether I have the equity to make it to when prices recover.” You know, with CME Class III futures hovering around /cwt for Q1 2026 and feed costs finally moderating with corn near .24/bu according to USDA’s latest reports, you might think we’d all be breathing easier. But conversations across the dairy belt—from Pennsylvania tie-stalls to Texas freestalls—they’re revealing something different.

Here’s what I’ve found after running through financial scenarios with extension folks and reviewing real farm numbers: a representative 500-cow dairy with 0,000 in equity has about 24 months of runway at current burn rates. And the thing that really caught my attention? The difference between taking action now versus waiting six months could preserve roughly $450,000 in family wealth. That’s not speculation—it’s what the math consistently shows when you model different timing scenarios.

The $450,000 Decision Window: Every month you delay action costs roughly $75,000 in family wealth. This isn’t speculation—it’s what the math shows when you model a representative 500-cow dairy burning $25,000 monthly versus taking immediate action to cut losses to $8,000

Understanding the Convergence of Market Forces

Having tracked these cycles since the late ’90s, this downturn feels different. It’s not just one thing we can monitor and respond to—we’re seeing multiple structural shifts happening all at once.

The Perfect Storm Hitting U.S. Dairy Right Now: China’s near-total self-sufficiency killed the global growth story, $11 billion in new U.S. processing capacity needs milk nobody’s producing, and we’re facing the worst heifer shortage in 47 years. This isn’t a cycle you can wait out—it’s three permanent structural shifts happening simultaneously

Take China. Rabobank’s recent dairy quarterly indicates they’ve reached about 85% milk self-sufficiency, up from 70% five years ago. We’re talking about a fundamental policy shift toward food security, not a temporary market adjustment. When StoneX analysts discuss how that Chinese import growth story—the one that fueled global expansion for over a decade—is essentially done, they’re describing a permanent change in how global dairy works.

Meanwhile, and the timing couldn’t be worse, the U.S. processing sector has committed somewhere between $8 and $ 11 billion in new capacity, according to what IDFA’s been tracking. Projects across nearly 20 states, from new cheese plants in Texas to expanded drying capacity up in the Upper Midwest. These facilities will need roughly 7-8 billion pounds of additional milk annually when fully operational by mid-2026.

But here’s what really concerns me: the availability of replacement heifers. USDA’s latest cattle inventory shows we’re at 4.38 million head—the lowest since 1978. The National Association of Animal Breeders reports beef semen sales to dairy farms hit 7.9 million units in 2024, up 58% from 2020. Conventional dairy semen? Down to 6.7 million units. These aren’t just statistics… they represent breeding decisions that’ll constrain expansion capacity for the next 24-36 months.

You know what’s interesting about this cycle? The moderate feed costs—corn at $4.24/bu and alfalfa at $222/ton—are actually extending the adjustment period. Back in 2009, when corn hit $6-7/bu, we saw rapid culling and supply correction. Today’s manageable feed costs let farms sustain negative margins longer. Sounds beneficial, right? Until you consider that it delays the market from rebalancing.

The Economics of Scale: A Widening Divide

MetricLarge Farms (2,500+ cows)Family Farms (500 cows)The Gap
Production Cost per cwt$15.50 – $17.50$19.00 – $21.00$3.50/cwt
Labor Productivity300 cows/worker60 cows/worker240 cows/worker
Labor Cost ImpactBaseline+$1.50 – $2.00/cwt$1.75/cwt
Feed Procurement Advantage15-25% volume discountTruckload pricing$0.50/cwt
Capital Cost per Cow$4,800 – $6,000$7,000 – $9,000$2,500/cow
Transportation Cost$0.35/cwt (concentrated regions)Up to $0.53/cwt$0.18/cwt
Total Structural DisadvantageBaseline+$3.50/cwt$3.50/cwt

The structural cost advantages larger dairies have reached levels that fundamentally change competitive dynamics. Research from Cornell’s ag economics folks and similar extension programs consistently shows that farms with 2,500+ cows achieve production costs of $15.50-17.50/cwt. Meanwhile, 500-cow dairies face costs of $19-21/cwt based on Penn State Extension benchmarking.

And this isn’t about management quality or work ethic—we all work hard. It’s a mathematical reality. Labor productivity data from Michigan State Extension reveal that large farms are achieving ratios exceeding 300 cows per full-time employee through strategic automation and role specialization. Family operations? We’re typically managing 60 cows per worker despite those 70-hour workweeks we all know too well. At prevailing wage rates, that creates a $1.50-2.00/cwt structural disadvantage.

Feed procurement tells a similar story. Farms purchasing railcar volumes access pricing 15-25% below truckload rates—that’s coming from Wisconsin’s dairy profitability analysis. Given that feed accounts for 50-55% of operating costs across multiple university studies, this differential significantly affects competitiveness.

The capital efficiency gap might be the toughest pill to swallow. A 2,500-cow facility requires an investment of about $12-15 million (works out to $4,800-6,000 per cow). A 500-cow operation? That’s $3.5-4.5 million, but $7,000-9,000 per cow. That permanent efficiency differential compounds over time, especially during extended margin pressure like we’re seeing now.

Regional Dynamics: Where Geography Shapes Destiny

Location has become increasingly determinative of dairy viability. Federal Order data reveals growing disparities that we really need to consider carefully.

Pacific Northwest producers—I really feel for these folks—face particularly challenging economics. Milk hauling costs average $0.53/cwt compared to under $0.35/cwt in concentrated production regions. Combined with cooperative assessments and processing distances, a 500-cow dairy in Washington or Oregon starts each month with a $45,000-50,000 disadvantage relative to competitors in more favorable locations.

California presents different but equally significant challenges. Environmental compliance costs producers are reporting range from $35,000 to $40,000 annually—that translates to $0.35-0.40/cwt. During drought years when water allocations drop 50% and you’re buying on the spot market, UC Davis studies indicate additional costs of $0.30-0.50/cwt.

Now contrast that with the Texas Panhandle, which has emerged as this processing hub. Industry estimates suggest the Amarillo region handles over 1,000 milk tanker loads daily within a 300-mile radius. With five major facilities operational by 2026, competitive procurement dynamics actually support local prices while other regions experience discounts.

Southeast producers navigate their own unique challenges—humidity-driven mastitis pressure and heat-stress management costs Northern operations avoid. Yet proximity to metros such as Atlanta and Charlotte creates premium market opportunities that can offset some of the structural disadvantages for entrepreneurial farms.

The Beef-on-Dairy Calculation: Opportunity and Risk

The Beef-on-Dairy Trap: That $280K in extra revenue today? It’ll cost you $406K when you need replacements in 2027. Farms that maximized beef breeding for survival are trading their ability to expand during recovery. The math shows you’re borrowing from your future self—at a terrible interest rate

A fascinating development I’ve observed across multiple regions is how beef-on-dairy transformed from supplemental income to a survival strategy. Some farms report beef-cross calf sales now representing 40-50% of total revenue. With crossbred calves bringing $1,400-1,600 versus $100-200 for dairy bulls according to USDA market reports, a 500-cow dairy breeding half its herd to beef generates an additional $270,000-290,000 annually.

CoBank’s analysis, led by economists including Tanner Ehmke, projects that we’ll face an 800,000-head shortage of replacement heifers during 2025-2026. It reflects breeding decisions made when beef prices peaked and producers—understandably—prioritized immediate cash flow over future replacement needs.

University of Wisconsin dairy economists analyzing optimal breeding strategies suggest maintaining about 50% as the maximum sustainable beef breeding percentage. Farms exceeding this threshold—some reached 60-70% when beef prices peaked—essentially traded current survival for future growth capacity. When margins recover, these farms face either purchasing replacements at projected prices of $3,000-3,500 or foregoing expansion opportunities entirely.

The timing mismatch creates particular challenges. Breeding decisions made today determine replacement availability in 24-28 months, yet milk price recovery and heifer availability peaks likely won’t align. Farms that maximized beef revenue may survive the immediate crisis but will be unable to capitalize on the recovery.

The Compound Effect of Delayed Decisions

Your 24-Month Equity Countdown: Three Paths, One Choice. Farms taking immediate action preserve $658K in equity versus $250K for those doing nothing—a $408K difference determined solely by when you act, not market conditions

Through financial modeling using Farm Credit benchmarks and extension tools, a clear pattern emerges about timing’s impact on outcomes. Consider a representative 500-cow Wisconsin dairy with $850,000 in equity, losing $25,000 per month.

Immediate action—culling the bottom 20% based on income over feed cost metrics—generates approximately $200,000 at current cull cow values of $145-157/cwt while reducing monthly feed costs. Ration optimization to achieve $5.00 versus $6.20 per cow daily, following established nutritional guidelines, saves roughly $16,500 monthly. Combined, these actions reduce monthly losses from $25,000 to maybe $8,000-10,000.

After 24 months, early action preserves $650,000-700,000 in equity. That maintains strategic flexibility for expansion, transition to premium markets, or orderly exit if necessary.

But contrast this with delaying these decisions for six months. The farm burns an additional $150,000 in equity while waiting. Lender confidence erodes as equity ratios decline from 55% to 45%. Credit lines face restrictions. By month 24, the remaining equity of $250,000-$350,000 limits options to a distressed sale or continued deterioration.

That $400,000-450,000 difference? It represents the preservation or destruction of generational wealth, determined solely by the timing of actions.

Monitoring Recovery Signals

While I anticipate a 24-36-month adjustment period based on current fundamentals, several indicators could accelerate the recovery. Systematic monitoring helps separate noise from meaningful trends.

Global Dairy Trade auctions provide a 60-90-day forward indication of U.S. price direction, according to university dairy market research. Recent auctions have shown consecutive declines, but three consecutive stable or rising auctions would suggest the market is bottoming. Single auction movements shouldn’t drive decisions, though—trend confirmation matters.

Rationalizing processing capacity would meaningfully affect timing. Should 2-3 facilities announce closures or extended maintenance by Q2 2026, oversupply dynamics could improve faster than baseline projections. Though given the debt loads these facilities carry, continued operation at reduced utilization seems more probable than closure.

Monthly USDA production reports revealing 2%+ year-over-year declines for consecutive months would signal accelerating supply discipline. Combined with heifer shortages, this could create temporary market tightness.

Feed cost dynamics remain a wildcard. Should corn exceed $5.50/bu for 90+ days, forced culling similar to 2009 could compress the adjustment period to 12-18 months. Climate volatility suggests perhaps a 30-40% probability of significant Corn Belt production challenges within 18 months.

Given these signals, here’s how to position your operation for what’s ahead.

Three Strategic Imperatives for Every Operation

Based on extensive analysis and what I’m seeing in the field, every dairy faces three critical decision points over the coming months. Let me walk you through each one, starting with what needs attention immediately.

Decision One: Immediate Liquidity Management (Next 30 Days)

Successful navigation requires generating measurable cash flow improvement within 30 days. And that means confronting difficult culling decisions based on economic metrics rather than sentiment. Cornell Pro-Dairy benchmarks indicate that cows generating under $5 in daily income over feed cost incur ongoing losses regardless of other attributes.

Here’s what I’d tackle this week: Start by pulling DHIA records and ranking every cow by IOFC. Bottom 20% should be evaluated for immediate culling. Yes, it’s hard to cull that fresh heifer who’s just not performing, but keeping her costs you $150-200 monthly.

Comprehensive cost analysis typically identifies $30,000-50,000 in achievable annual savings through systematic review of all inputs and practices. Whether it’s adjusting mineral programs, renegotiating service contracts, or optimizing breeding protocols—the specific opportunities matter less than systematic identification and capture.

Proactive lender engagement before scheduled reviews demonstrates management capability and preserves relationship quality. The distinction between being viewed as proactive versus reactive often determines credit availability during challenging periods.

Decision Two: Strategic Recovery Positioning (Next 90 Days)

Forward-thinking farms must balance current survival with future opportunity. Breeding strategies warrant immediate adjustment—modeling suggests approximately 45% beef, 50% sexed dairy, and 5% conventional optimally balances current revenue with future replacement needs.

Geographic competitive position requires an honest assessment. Farms facing structural location-based disadvantages of $1.50+/cwt must consider whether operational excellence can overcome permanent cost disparities or if strategic alternatives warrant exploration.

Establishing specific, measurable decision criteria removes emotion from critical choices. Clear thresholds—”If Class III futures for Q3 2026 remain below $17.50 by March, we initiate transition planning”—enable rational rather than reactive decision-making.

Decision Three: Long-term Viability Determination (Next 180 Days)

Within six months, a fundamental strategic direction must be established. Well-positioned farms with adequate equity and replacement capacity should prepare for aggressive expansion during recovery. The 2027-2028 period may offer exceptional growth opportunities for prepared operations.

Dairies near metropolitan markets should seriously evaluate premium market transitions. USDA data confirms organic, A2, grass-fed, and direct marketing can deliver $7-12/cwt premiums that fundamentally alter economic equations. While requiring different skill sets, these models may offer superior risk-adjusted returns.

For farms where mathematics indicate strategic exit preserves maximum family wealth, timing remains critical. The difference between planned transition preserving $700,000 and forced liquidation at $200,000 determines whether next-generation education, career transitions, and retirement security remain achievable.

Practical Monitoring Framework

Successful farms systematically track key metrics. Here’s the dashboard I’m recommending producers review weekly:

Weekly Indicators:

  • Equity burn rate relative to total equity (are you on track with projections?)
  • CME Class III futures curves (watching for sustained moves above $17)
  • Feed cost per cow per day (work with your nutritionist to optimize)

Bi-Weekly Reviews:

  • Global Dairy Trade trends at GlobalDairyTrade.info
  • Local replacement heifer pricing trends
  • Regional basis (your mailbox price versus CME benchmark)

Monthly Analysis:

  • Months remaining until 40% equity threshold
  • USDA milk production reports for supply signals
  • Lender relationship temperature check

Additionally, reviewing Dairy Margin Coverage options (even with elevated premiums), forward contracting above breakeven, maintaining sub-70% working capital utilization per Farm Credit guidelines, and preserving capital through lease-versus-purchase decisions warrant immediate attention.

The Path Forward

After extensive analysis and countless producer conversations, one conclusion emerges consistently. Farms that thrive in 2028 won’t be those that perfectly predicted market timing or price bottoms. They’ll be those that recognized in November 2025 that strategic flexibility remained available, understood that monthly delay costs approximately $75,000 in option value, and made difficult decisions while maintaining equity and credit access.

The U.S. dairy industry will emerge smaller and more concentrated—projections suggest declining from about 33,000 to under 28,000 farms by 2028. Whether your operation participates in that future depends not on milk prices but on acting while meaningful choices remain. Agricultural economists consistently observe that survival often depends less on scale or luck than on the gap between when action was needed and when it was taken. That gap remains bridgeable today, but the window is continuing to narrow.

Look, these conversations—with family, lenders, advisors—they’re never easy. Yet the math remains indifferent to our discomfort, and time continues regardless of readiness. For many of us, the greatest challenge isn’t financial analysis or strategic planning but accepting that wealth preservation may require departing from generational patterns. Observing hundreds of transitions has taught me that strategic repositioning carries no shame—only waiting until strategy becomes desperation. The next 24 months will reshape American dairying more significantly than any period since the 1980s. Success isn’t about fighting this transformation—it’s about positioning yourself appropriately within it. And that positioning needs to begin immediately, not when market signals provide comfort.

Time really has become our scarcest resource in this industry. Those who recognize and act on this reality will determine not just their own futures, but the structure of American dairying for the next generation.

Key Takeaways:

  • Your burn rate reality: You’re losing $25,000/month with 24 months of equity left—but immediate action cuts this to $8,000/month
  • The six-month wealth gap: Act now = preserve $700,000 in family equity. Wait until spring = forced exit at $250,000
  • This week’s three moves: 1) Rank every cow by income over feed cost, 2) Cull the bottom 20%, 3) Call your banker before they call you
  • Decision deadlines that matter: 30 days (stop the bleeding), 90 days (position for recovery), 180 days (commit to expand or exit)
  • Why waiting won’t work: China’s self-sufficient + we overbuilt processing by $11 billion + worst heifer shortage since 1978 = permanent change, not temporary cycle

Complete references and supporting documentation are available upon request by contacting the editorial team at editor@thebullvine.com.

Learn More:

Join the Revolution!

Join over 30,000 successful dairy professionals who rely on Bullvine Weekly for their competitive edge. Delivered directly to your inbox each week, our exclusive industry insights help you make smarter decisions while saving precious hours every week. Never miss critical updates on milk production trends, breakthrough technologies, and profit-boosting strategies that top producers are already implementing. Subscribe now to transform your dairy operation’s efficiency and profitability—your future success is just one click away.

NewsSubscribe
First
Last
Consent

CME Dairy Market Report for July 16th, 2025: When Feed Costs Bite Back

Feed costs jumped 2.75¢ while milk prices barely moved – your margins just got squeezed harder than morning milking time.

Executive Summary: Here’s what happened while you were focused on morning chores – feed costs are eating your margins faster than you think, but the futures market just handed you a lifeline. Corn jumped 2.75¢ and meal added 90¢ today, pushing that critical milk-to-feed ratio down to 1.8… that’s 25th percentile territory for July, folks. Meanwhile, NDM hit $1.28 with serious volume behind it, and here’s the kicker – Q4 Class III futures are trading nearly a dollar above cash at $17.90. For a farm shipping a million pounds monthly, that premium translates to $10,000 extra revenue per month if you act now. The global picture’s helping too, with New Zealand in their seasonal trough and our powder suddenly competitive against European suppliers. You need to get quotes on your feed through year-end and seriously look at locking some milk price protection.

Key Takeaways

  • Lock Feed Costs Now: With corn at $4.24 and climbing, every day you wait costs about $30 daily for a 500-cow operation – get firm quotes through December and consider covering Q4 needs immediately
  • Capture Q4 Milk Premium: Class III futures at $17.90 offer nearly $1/cwt above cash – even covering 25% of production creates meaningful downside protection while feed costs spike
  • Optimize Heat Stress Management: Component losses of 0.05 percentage points from heat stress translate to real money walking out the door – invest in cooling systems before August heat peaks
  • Monitor Export Opportunities: U.S. NDM now competitive at $2,822/MT vs European SMP at $2,750/MT – first time this year we’re price-competitive globally, supporting Class IV strength
  • Regional Basis Advantages: Upper Midwest corn basis at 20¢ under futures creates new-crop pricing opportunities around $4.00 – consider storage and forward contracts if you’re unpriced
dairy market analysis, feed cost management, CME dairy prices, milk futures trading, dairy profitability strategies

You know that gut-punch feeling when you check the grain board and your stomach drops? Yeah, that was today’s story. While we’re all watching cheese prices sit there like cows in a shaded corner on a hot day, the real fireworks happened in the feed complex – and brother, it’s not doing your bottom line any favors.

The thing about today’s session… NDM keeps climbing, as if it has somewhere important to be, which is great news if you’re shipping to a Class IV plant, but cheese? Man, cheese is just stuck in neutral, and it’s been there for what feels like forever. With corn adding another 2.75 cents and meal tacking on 90 cents more, this might be one of those days where your input costs moved more than your milk price – and definitely not in the right direction.

What strikes me about this market is how it’s shaping up to be a real test of who’s been paying attention to their margins and who’s been hoping milk prices would bail them out.

Today’s Numbers: The Good, The Bad, and The Expensive

ProductPrice ($/lb.)Today’s MoveWeekly TrendWhat This Means for Your Operation
Cheese Blocks$1.6250No ChangeDown 3.5%Stagnant prices are keeping a lid on Class III potential
Cheese Barrels$1.6500No ChangeDown 3.5%That inverted spread tells you there’s plenty of cheese around
Butter$2.5300Down 1.00¢Down 1.8%Butterfat weakness is dragging Class IV down with it
NDM$1.2800Up 0.50¢Up 0.6%This is where the strength is – export demand holding firm
Dry Whey$0.5725No ChangeDown 2.7%Quiet market, but that weekly slide is concerning

What actually happened today… NDM was the star performer with 12 trades pushing it higher – when you see that kind of volume behind a move, it usually means something real is happening. Butter dropped a full cent on decent volume (5 trades), which isn’t great news if you’re running high-component Jerseys or trying to maximize your butterfat premiums.

However, what’s really telling is the absence of trades in barrels and whey. That’s not just quiet – that’s buyers and sellers so far apart they won’t even play. I’ve seen this before, and it usually means we’re waiting for some external catalyst to shake things loose.

The cheese block market had some underlying interest (5 bids to 1 offer), but nobody wanted to step up and actually trade. It’s like that moment at a cattle auction when everyone’s eyeing the same lot but nobody wants to make the first bid.

The Trading Floor Reality Check

What strikes me about today’s order book is how it shows where the real conviction lies – or doesn’t. In NDM, sellers were happy to meet the market with five offers for every bid, which suggests they’re comfortable at these levels. But in blocks? Five bids and only one offer mean there’s some buying interest lurking beneath the surface, even if nobody pulled the trigger.

The butter market was evenly matched at four bids and four offers, which usually indicates that we’re finding some equilibrium… although apparently that equilibrium is a penny lower than yesterday.

Here’s what I’m watching closely: blocks seem to have buyers defending that $1.60-$1.62 range – that’s sitting right around the 40th percentile for where we’ve been over the past five years, so nothing too alarming yet. But sellers are capping any rallies around $1.70, which historically sits at about the 60th percentile.

For NDM, though… breaking through $1.28 feels significant. We’re now trading in the 75th percentile for July pricing over the past decade. That’s the kind of level that gets export buyers’ attention, both positively and negatively, depending on which side of the transaction you’re on.

Feed Markets: The Real Story That’s Eating Your Margins

Okay, let’s talk about what really happened today – and honestly, it’s got me more concerned than the dairy moves. December corn jumped 2.75 cents to $4.2450, and soybean meal added 90 cents to $283.10 per ton. That might not sound like much when you’re focused on milk prices, but when you’re feeding 500 head, every penny on corn translates to about $30 per day in additional feed costs.

That milk-to-feed ratio we all obsess over? It’s tightening faster than I’d like to see. Using today’s closing prices and the current hay costs, which average around $160 per ton for good alfalfa, we’re looking at a ratio of approximately 1.8. Historically, that’s in the 25th percentile for July, which means we’ve seen worse, but it’s definitely tight enough to make you start questioning every feed decision.

The thing about feed cost spikes is they hit different operations differently, and a regional basis can make or break you. If you’re in the Upper Midwest buying most of your corn – and let’s be honest, most of you are – you’re feeling this immediately. But if you locked in a new crop earlier this spring when everyone was worried about planting delays, or if you’ve got plenty of homegrown forage, you’re sitting pretty right now.

I know producers in central Wisconsin who locked corn at $3.80 back in May when the weather looked sketchy, and they’re feeling pretty smart about that decision right now. Then again, I know others who held off thinking prices would come down after harvest… well, we’ll see how that plays out.

Production Patterns: Summer Heat Taking Its Toll

The summer production decline is playing out exactly as you’d expect – heat stress is hitting herds across the Corn Belt, and we’re seeing it show up in both volume and components. What’s concerning – and this is becoming increasingly common with the heat domes we keep experiencing – are reports about butterfat percentages dropping in several regions.

The Upper Midwest is seeing component tests down about 0.05 percentage points from June, which doesn’t sound like much until you multiply it across a 500-cow herd. That’s real money walking out the door, especially when you’re getting paid on component pricing.

Culling rates have been steady, but here’s the thing that has me watching closely: if margins continue to tighten due to these feed costs, expect to see more marginal cows heading to town. The math is pretty simple – when your income over feed cost drops below $6 per cow per day, you start looking real hard at which cows aren’t pulling their weight.

What’s interesting is that heifer prices are still holding firm – I’m hearing $1,800-$2,000 for bred heifers in most regions, which is actually up about $100 from spring. That tells me most producers are still thinking long-term and haven’t hit the panic button yet. However, today’s action in the feed complex is likely to test that confidence.

Heat abatement becomes critical here, not just for cow comfort, but for protecting those component levels that drive your milk check. Every tenth of a point of butterfat matters when margins are this tight.

The Complete Demand Picture: Global Forces and Local Realities

Here’s where things get really interesting from a global perspective… this seasonal tightness from New Zealand is becoming more apparent, and honestly, it’s helping us more than I expected when we started the year. They’re in their production trough right now – typically down about 15% from their May peak, which means their powder offerings are limited until their new season kicks in around September.

What’s particularly fascinating is how our pricing stacks up globally right now. At $1.28/lb (roughly $2,822/MT), our NDM is actually competitive with European SMP, which trades around €2,550/MT. That’s a complete reversal from earlier this year when we were essentially priced out of several key markets.

On the export front, the numbers are telling a story that’s worth paying attention to. Mexico continues to be our bread and butter customer – they took about 48 million pounds of NDM in the first five months of 2025, which is up 8% from last year. That’s consistent, reliable demand that’s been underpinning our Class IV strength.

Southeast Asia has also been steady, importing about 6% more powder year-over-year, although they’re definitely being more selective about pricing. The interesting development is that our market share in key Southeast Asian markets has actually grown to about 35%, up from 32% last year, partly because European suppliers have been focusing more on their domestic markets.

China remains the wildcard – they’re down 2% year-over-year in total imports, but when they do buy, they’re buying in size. Just last week, they took delivery of 15 million pounds in a single transaction, which shows they’re still willing to pay for quality when they need it.

Our butter situation is particularly intriguing. At $2.53/lb, we’re actually below most EU offers right now – I’m seeing European butter quoted at €4,900-5,200/MT, which translates to roughly $2.75-$2.95/lb. That spread could attract some international interest, especially as we head into the back half of the year when global butter supplies typically tighten.

Domestically, the picture is more nuanced than the headlines suggest. Food service cheese demand is holding up reasonably well with the summer travel season – the foodservice demand index is sitting at 95, which is close to the seasonal norm of 100. But here’s the thing… it’s not strong enough to work through these comfortable inventories that processors keep talking about.

Retail butter sales are typically soft during the season – Nielsen data shows unit sales down 4% from May to mid-July, which is a fairly typical trend. We’re past the spring baking rush and haven’t yet hit the holiday prep season that kicks in around Labor Day.

The wild card everyone’s watching is the return of school lunch programs in August. This typically adds about 12-15% to cheese demand almost overnight, but with some districts switching to more fresh options and others dealing with budget constraints, it’s unclear if we’ll see the traditional increase.

Forward Curves: Real Money Opportunities (And Some Risks)

According to the latest USDA WASDE report from earlier this month, they’re calling for Class III to average around $18.50 for 2025, with Class IV closer to $19.05. Today’s action fits that narrative pretty well – powder strength, cheese struggling to find direction.

But here’s where it gets interesting – and potentially profitable – for your operation. Q4 2025 Class III is trading near $17.90, and Class IV is sitting at $19.30. Let me put this in real dollars that matter to your operation…

That Q4 Class III price of $17.90 is trading at a premium of nearly a dollar to the current cash market. For a farm shipping 1 million pounds of milk a month, locking in that differential represents about $10,000 in additional revenue per month through the fourth quarter. Scale that up or down based on your volume, but even for a smaller operation shipping 500,000 pounds monthly, you’re looking at an extra $5,000 per month.

For Class IV producers, that 30-cent premium to cash translates to roughly $3,000 per month for every million pounds shipped. Not life-changing money, but in a tight margin environment, it’s the difference between breaking even and making a profit.

The risk management side of me says those kinds of premiums don’t last forever, especially with feed costs fluctuating as they are. Even if you only lock in 25% of your production, you’re creating a meaningful floor for your operation while still maintaining upside participation.

What particularly intrigues me is the shape of the curve beyond Q4. Q1 2026 Class III is trading at $18.25, and Class IV is at $19.50. That suggests the market thinks the current weakness in cheese is temporary, but the strength in powder has more staying power.

Voices from the Trenches: What People Are Really Saying

I’ve been speaking with individuals from around the industry, and the sentiment is fairly consistent, although there are some notable regional variations. Traders are telling me NDM is where the consistent bids are showing up – one CME regular mentioned that “the powder pit has been the only place with real conviction for the past two weeks.”

Cheese feels heavy, and nobody wants to be the hero buying blocks until we see some real inventory draws. A processor in Wisconsin told me they’re running full capacity, but their cheese caves are “comfortable” – industry speak for “we’re not hurting for storage space.”

The consensus seems to be that we need to see a real spark in fall food service demand to move these cheese prices meaningfully higher. School lunch programs ramping back up could provide that spark, but it’s still six weeks away.

What’s particularly noteworthy is what producers are saying about the heat and its impact on their operations. A California producer running 2,000 head mentioned that “cow comfort isn’t just welfare anymore – it’s directly tied to our milk check. Every tenth of a point of butterfat we lose to heat stress is money walking out the door.”

Upper Midwest producers are more focused on the feed cost situation. A Wisconsin dairyman with 800 cows told me, “I’m spending more time watching the corn board than the cheese market these days. My nutritionist and I are having daily conversations about ration adjustments.”

What strikes me about these conversations is how much more sophisticated producers have become about risk management. It’s not just about hoping for higher milk prices anymore – it’s about actively managing both sides of the margin equation.

Regional Spotlight: Where the Rubber Meets the Barn Floor

For folks in Wisconsin and Minnesota, today’s corn rally hits especially close to home. Local corn crops are progressing well – most areas are at or ahead of normal development, with pollination wrapping up under generally favorable conditions. But this board rally is creating some interesting dynamics in the cash market.

Basis levels are running about 20 cents under December futures, which is fairly typical for this time of year. However, what’s interesting is that elevators are starting to become more aggressive with new crop bids. I’m hearing stories of some facilities offering as little as 30 cents under for October delivery, which tells me they’re not overly concerned about harvest pressure.

If you’ve got unpriced new crop corn and storage capacity, this rally might be worth considering. I know it feels early, but $4.00 corn isn’t something you see every day, and with global weather concerns circulating, there’s potential for more upside.

On the milk side, processing capacity is abundant, but there’s always something to watch. I’m hearing whispers about planned maintenance at a major cheese facility in central Wisconsin scheduled for early August. Nothing dramatic, but it could briefly tighten local spot pricing for farms that aren’t locked into long-term contracts.

The California situation is different – they’re dealing with more heat stress but also have more flexibility in their feed sourcing. West Coast producers are paying a premium for feed, but they’re also getting premium prices for their components when they can maintain quality.

Supply Chain Reality: The Stuff Nobody Talks About

Here’s something that doesn’t make the headlines but affects your bottom line… transportation costs are creeping up again. Freight rates for hauling milk are up about 8% from last year, partly due to driver shortages and partly due to fuel costs. That might not sound like much, but for farms shipping long distances to processing plants, it’s another margin squeeze.

Processing plant utilization is running at about 85% capacity nationally, which is healthy but not stretched. That’s good news for milk pricing – when plants are scrambling for milk, farm-level prices tend to be stronger. However, it also means there’s room for increased throughput if demand increases.

What’s particularly interesting is the regional variation in processing capacity. The Upper Midwest is running closer to 90% utilization, while some facilities in the West are at 75-80%. That imbalance is creating some interesting pricing dynamics and transportation flows that most people don’t see.

What You Should Actually Do Right Now

Price your feed. I can’t stress this enough – today’s rally in grains is more than just daily noise. Get firm quotes for your feed needs through year-end, and if you’ve storage capacity and are comfortable with the basis, this might be the time to consider purchasing some coverage.

Here’s a specific strategy worth considering: if you typically buy corn quarterly, consider covering your Q4 needs now and maybe 25% of your Q1 2026 requirements. That provides some protection while still allowing you to participate if prices decrease after harvest.

Look hard at those Q4 2025 and Q1 2026 milk futures. They’re offering prices well above current cash markets, and with feed costs fluctuating as they’re, establishing some price floors makes sense. Even covering 25-30% of your expected production can create a meaningful safety net.

Options strategies might be worth considering too – buying put options can establish downside protection without capping your upside. With implied volatility relatively low right now, puts are reasonably priced.

With margins this tight, focus obsessively on what you can control. Work with your nutritionist on optimizing rations for income over feed cost, not just peak production. Every dollar you can save on feed costs is directly reflected in your bottom line.

Ensure that those heat abatement systems are operating at 100% efficiency. Protecting components isn’t just about cow comfort – it’s about protecting your milk check. Consider investing in additional cooling capacity if you’re consistently seeing component drops during hot weather.

Industry Intel Worth Knowing

Keep an eye on the Federal Milk Marketing Order pricing formula discussions. I know it’s bureaucratic stuff that makes your eyes glaze over, but any changes could have significant long-term impacts on your basis and milk checks. The comment period closes in September, so if you have any thoughts, now is the time to share them.

Technology-wise, I’m seeing more producers investing in precision feeding systems, and honestly, it makes sense when feed costs are this volatile. The payback period on these systems is getting shorter as margins tighten and feed price volatility increases.

There’s also an interesting development in the sustainability space – some processors are starting to offer premium payments for verified low-carbon milk. It’s still early, but it’s worth keeping an eye on, especially if you’re already doing things like methane capture or improved feed efficiency.

The Bottom Line: What This All Means Going Forward

Today’s quiet, mixed session is classic mid-summer trading – the kind of day where the fundamentals matter more than the headlines. However, beneath that calm surface, there are significant currents worth understanding.

We’re in a period where your margin management skills matter more than ever. The dairy fundamentals haven’t changed dramatically, but the cost structure underlying them has just become more challenging. The feed cost pressure isn’t going away anytime soon, and it will separate the producers who are actively managing their businesses from those who are just hoping for better milk prices.

The opportunity is there in the futures markets if you’re willing to take some action, but time has a way of making these decisions for you if you wait too long. Those Q4 premiums won’t last forever, especially if we encounter any significant weather concerns or unexpected demand surges.

What gives me confidence about the longer-term outlook is the global supply situation. New Zealand’s seasonal tightness, combined with European producers focusing more on their domestic markets, is creating opportunities for U.S. exports that we haven’t seen in years. That underlying demand support should provide a floor for our markets, even if domestic demand remains lackluster.

This is the kind of market environment where the basics matter most – cow comfort, feed efficiency, and active risk management. Not the most exciting stuff to talk about at the coffee shop, but it’s what’s going to determine who’s still profitable when we look back at 2025.

The producers who navigate this successfully will be those who treat their operations like the businesses they are – actively managing both revenue and costs, staying informed about market developments, and making decisions based on data rather than hope. It’s not glamorous work, but it’s what separates the survivors from the casualties when markets get challenging.

Complete references and supporting documentation are available upon request by contacting the editorial team at editor@thebullvine.com.

Learn More:

Join the Revolution!

Join over 30,000 successful dairy professionals who rely on Bullvine Weekly for their competitive edge. Delivered directly to your inbox each week, our exclusive industry insights help you make smarter decisions while saving precious hours every week. Never miss critical updates on milk production trends, breakthrough technologies, and profit-boosting strategies that top producers are already implementing. Subscribe now to transform your dairy operation’s efficiency and profitability—your future success is just one click away.

NewsSubscribe
First
Last
Consent

When July’s Market Crash Just Changed Everything

How this week’s supply tsunami exposed the industry’s biggest blind spot—and what you need to do about it

EXECUTIVE SUMMARY: Look, I just spent the weekend digging into July’s brutal market crash, and what I found will change how you think about your operation. The old “more milk, more money” playbook is officially dead – we’re now in an era where component optimization beats volume every single time. The numbers don’t lie: operations running 4.2% butterfat versus 3.8% are seeing $275-460 additional daily revenue on a 2,000-cow setup, and that gap’s only getting wider. Global markets just proved they’ll punish volume producers while rewarding those smart enough to focus on what their milk’s actually made of. With Class IV futures sitting at $19.05/cwt and Class III stuck at $18.50/cwt, the market’s screaming at you to optimize for fat and hedge against protein weakness. The producers who get this shift right now – not next year, not next month, but right now – will be the ones still standing when the dust settles.

KEY TAKEAWAYS

  • Genetic selection pivot pays immediately: Daughters of fat-plus sires are generating $150-200 more annually per cow under current pricing structures. Start evaluating your breeding program for butterfat percentage over volume metrics – your 2026 calf crop depends on decisions you make this month.
  • Component monitoring = instant profit capture: Real-time parlor monitoring lets you adjust feeding strategies daily, capturing an additional $0.20-0.30 per hundredweight just from ration timing. Pennsylvania farms already doing this are seeing results within 30-60 days, not years.
  • Risk management isn’t optional anymore: Lock in 25-30% of your fat-heavy production through Class IV futures while buying Class III downside protection through DRP programs. With that $0.55 spread, not hedging is basically gambling with your operation’s future.
  • Feed cost optimization creates double wins: Strategic fat supplementation and improved forage quality boost component returns by $0.15-0.25 per hundredweight with minimal input cost increases. Vermont producers using palmitic acid inclusion are seeing 0.15 percentage point butterfat gains in 4-6 weeks.

Look, I’ve been watching dairy markets for more than three decades, and what happened at the Global Dairy Trade auction this week… well, it’s one of those moments that fundamentally changes how we think about milk pricing. We just witnessed a brutal -4.1% crash in the GDT Price Index—the worst single-day performance in twelve months—and if you think this is just another cyclical blip, you’re missing the fundamental shift that’s happening right under our noses.

The thing about supply-driven corrections is they don’t send you a courtesy call first. When Fonterra reported their highest milk collections in five years, with May intake surging 7.5% year-over-year, and Irish collections jumped 6.5% for the month, the writing was on the wall. You simply can’t flood global markets with that much milk and expect prices to hold. Basic economics, right? But somehow our industry keeps forgetting this fundamental lesson.

This wasn’t just a bad day at the auction house either. The event ran for nearly three hours across 22 bidding rounds, with 161 participants and only 110 walking away as winners. When you see numbers like that, you know sellers were desperate to move product, and desperate sellers make for ugly prices.

But here’s what really gets me fired up about this whole situation… we’re not just dealing with lower prices. We’re looking at a fundamental restructuring of how milk components get valued, and it’s happening whether we like it or not.

The Component Split That’s Reshaping Everything

Something really caught my attention about this market break—how it’s revealing the industry’s biggest blind spot. The CME spot markets told the whole story this week. Cheese blocks dropped to $1.66/lb, dry whey collapsed to $0.5675/lb—that’s a 1.41 cent weekly decline that had whey traders wincing. But here’s the kicker: butter held steady at $2.59/lb and nonfat dry milk actually gained ground to $1.2675/lb.

That’s not random market noise, folks. That’s the market screaming at you about what it values right now.

What strikes me about this divergence is how it’s playing out differently depending on where you’re milking cows. According to recent work from the USDA’s July WASDE report, the 2025 all-milk price forecast got bumped up to $22.00 per hundredweight. That’s not pocket change; that’s the kind of revision that changes your whole year’s profitability outlook.

But here’s where it gets really interesting: Class IV futures are now trading at $19.05/cwt while Class III settled at $18.50/cwt. That’s a $0.55 spread that translates directly to your bottom line depending on your butterfat numbers.

Recent research from dairy economists at Cornell University suggests that operations with milk testing 4.2% butterfat versus 3.8% could see $0.30-0.50 per hundredweight advantages under current pricing structures. If you’re running Holstein genetics selected for high butterfat… well, you’re sitting pretty right now. But if your operation skews toward protein production? You’re feeling the squeeze, and honestly, it’s only going to get worse.

Why aren’t more producers talking about this shift? It’s like watching a slow-motion train wreck, and half the industry is still focused on the wrong track.

Regional Realities: When Geography Becomes Destiny

The fascinating thing—and a bit scary—is how global dairy markets aren’t really global anymore. They’re becoming increasingly regionalized, and that’s creating some wild opportunities for those who understand the game.

North America: The Unexpected Winner

U.S. producers are experiencing something I haven’t seen in years: genuine decoupling from global weakness. While New Zealand’s NZX futures show butter dropping from $7,660/MT in July to $6,740/MT by September—that’s a $920 drop in just two months—American producers are looking at improved margins.

The feed cost dynamics are actually working in our favor, too. According to extension specialists at the University of Wisconsin-Madison, the improved soybean meal price forecasts could translate to $25-35 less in monthly feed costs per cow for typical 500-head operations. When you’re feeding 4-6 pounds of protein supplement daily, those savings add up fast.

I was just talking to a producer in Wisconsin last week who’s already adjusting his ration strategy based on these projections. He’s calculating that with improved milk prices and cheaper protein supplements, he’s looking at roughly $40-50 per cow improvement in monthly margins. That’s the kind of swing that changes your whole year’s outlook.

But here’s what’s got me curious… how many operations are actually positioned to capture this opportunity versus getting caught flat-footed by the component shift?

Europe: Caught Between Two Worlds

European markets are fascinating right now because they’re being pulled in opposite directions. EU butter prices edged up 0.2% to €740/100kg while skim milk powder fell 1.8% to €239/100kg. That’s not market manipulation—that’s processors making strategic decisions about where to allocate their limited milk supplies.

The EU is dealing with supply constraints that are actually protective. Environmental regulations, bluetongue outbreaks (this is becoming more common across Germany and France), and demographic challenges are creating a natural supply ceiling. Sometimes regulations work in your favor… who knew?

Recent research from dairy production specialists at Wageningen University shows that EU milk output forecasts suggest minimal production growth of just 0.2% to 0.4% for all of 2025. When you’ve got that kind of constraint, every liter of milk becomes precious.

But here’s what’s interesting—the UK stands out as a major outlier. UK milk production jumped 5.7% year-over-year in May, hitting record daily volumes. While that sounds great for UK producers, it actually puts them in a tough spot. They’re producing into a weak global market without the EU’s internal supply constraints to protect them.

Oceania: Ground Zero for Pain

If you’re milking cows in New Zealand right now, you’re at the epicenter of this supply storm. The GDT results show just how brutal this correction has been: whole milk powder dropped 5.1% to $3,859/MT, butter fell 4.3% to $7,522/MT, and the forward curve suggests this pain isn’t over.

What’s really concerning is the future structure. When you see butter futures in steep backwardation—dropping over $900/MT in just two months—that’s the market pricing in sustained weakness. This isn’t a temporary blip; this is a fundamental reset that could last through the Southern Hemisphere’s peak production season.

The Genetics and Nutrition Reality Check

This component value divergence we’re seeing isn’t just a market quirk—it’s becoming a structural feature of how milk gets valued. What’s particularly noteworthy is how this is playing out for different genetic programs.

I know a producer in Vermont who’s been working with dairy geneticists at the University of Vermont Extension to optimize his breeding program for butterfat. They’ve moved away from pure volume genetics toward proven fat-plus sires, and he’s seeing results. Under current pricing, daughters of these bulls are generating about $150-200 more annually per cow than his volume-focused animals.

But genetics is only part of the equation. Feed efficiency experts from Penn State’s dairy science program are calculating that strategic fat supplementation and forage quality improvements can boost component returns by $0.15-0.25 per hundredweight with minimal additional input costs. That’s the kind of ROI that makes sense even in tight margin environments.

For a 2,000-cow operation producing 75 pounds per cow daily, optimizing from 3.8% to 4.2% butterfat translates to $275-460 additional daily revenue. Scale that across a year, and you’re talking about $100,000-168,000 in additional income just from component optimization. That’s not theoretical—that’s real money hitting your milk check every month.

Herd SizeDaily ProductionButterfat IncreaseApprox. cwt Advantage*Potential Additional Annual Revenue
500 Cows75 lbs/cow3.8% to 4.2%$0.40/cwt$54,750
1000 Cows75 lbs/cow3.8% to 4.2%$0.40/cwt$109,500
2000 Cows75 lbs/cow3.8% to 4.2%$0.40/cwt$219,000

*Based on a $0.40/cwt premium for a 0.4 percentage point increase in butterfat.

The question is… how quickly can you implement these changes, and what’s the realistic timeline for seeing results? From what I’m seeing on progressive farms, genetic improvements take 2-3 years to materialize fully, but nutritional adjustments can show results within 30-60 days.

Risk Management: Why Passive Strategies Are Dead

The current market environment is offering some of the clearest hedging signals I’ve seen in years. With Class IV futures trading at a significant premium to Class III, the market is practically screaming at you to hedge fat-based production while protecting against protein-based downside.

Here’s what I’m telling progressive operations: lock in 25-30% of your expected fat-heavy production through forward contracts while buying Class III downside protection through puts or the Dairy Revenue Protection program. The math is compelling—you’re capturing the current spread while limiting your exposure to further protein market weakness.

What’s fascinating is how this plays out differently across regions. European futures markets on the EEX are pricing similar opportunities, with July SMP contracts at €2,396/MT and butter at €7,371/MT—a spread that’s too wide to ignore for producers who understand component risk management.

The implementation timeline here is critical. Most DRP enrollment deadlines are 30-45 days before the coverage period starts, so if you’re thinking about protecting your fall production, you need to move now. Futures markets offer more flexibility, but you need the financial infrastructure in place—margin accounts, credit lines, the works.

The Technology Factor Nobody’s Talking About

Something else is happening that’s becoming increasingly clear: the producers who thrive in this environment aren’t just those with the best genetics or the cheapest feed—they’re the ones with the best data.

Component management has moved from optimization to necessity. Real-time monitoring technology isn’t a luxury anymore; it’s essential for capturing the value spreads we’re seeing. The operations that can adjust their nutritional programs based on daily component pricing are the ones that’ll come out ahead.

I was just at a farm in Pennsylvania where they’ve installed real-time component monitoring through their parlor system. The producer told me he’s adjusting his feeding strategy almost daily based on component premiums. It’s allowed him to capture an additional $0.20-0.30 per hundredweight just by optimizing his ration timing.

But here’s the thing—this technology isn’t cheap, and it requires a learning curve. The farms I’m seeing succeed with this approach are investing 12-18 months in training and system optimization before they see consistent results. Are you prepared for that commitment?

What the Next Few Weeks Will Tell Us

The upcoming July 15th GDT auction will serve as a crucial test of whether this correction has found a floor. Honestly? I’m not optimistic. Fonterra’s already announced significant volumes for the event, and if those hit the market and prices fall further, it’ll confirm that this bearish trend has legs.

But here’s the thing—the auction results are almost beside the point now. We’re operating in a fundamentally different market structure. Volume-focused strategies aren’t just outdated; they’re counterproductive in this environment.

Current trends suggest that Chinese import demand—which could provide the lifeline Oceanic markets desperately need—remains sluggish. According to agricultural trade economists at Iowa State University, without that demand recovery, New Zealand producers are looking at an extended period of painful price discovery.

The summer heat across the Northern Hemisphere is also playing a role. I’ve been getting reports from producers in Wisconsin and New York about heat stress impacting fresh cow performance. When you combine that with the seasonal decline in milk production, it could provide some support to powder markets… but probably not enough to offset the Oceanic supply tsunami.

The Bottom Line: Three Critical Takeaways

After watching this market chaos unfold, three things are crystal clear to me:

First, component management isn’t optional anymore. The fat-protein spread has become the defining feature of 2025 markets. Operations that can’t optimize for butterfat production will get left behind. Period. If you’re not tracking your component tests daily and adjusting your nutrition program accordingly, you’re missing the biggest profit lever in your operation.

This isn’t just about genetics anymore—it’s about real-time management. The producers who understand this are already implementing feeding strategies that can shift butterfat test by 0.1-0.2 percentage points within 4-6 weeks. Under current pricing, that’s $200-400 additional monthly revenue per cow.

Second, regional market dynamics are creating unprecedented opportunities. U.S. producers benefit from strong domestic fundamentals and that bullish USDA outlook. European producers have supply constraints working in their favor, creating natural price support. Oceanic producers… well, they’re learning about oversupply the hard way.

But here’s what’s particularly striking—even within regions, the opportunities vary dramatically. A producer in Vermont with high-fat genetics is in a completely different position than one in Texas focused on volume. Geography matters, but genetics and component management matter more.

Third, sophisticated risk management has moved from advanced strategy to basic survival. The market is offering clear signals about component value divergence, and passive strategies carry exceptional risk. With Class IV futures trading at such a premium to Class III, not hedging is essentially gambling with your operation’s future.

The tools are there—DRP programs, futures markets, forward contracts. The question is whether you’re using them strategically to capture the fat premium while protecting against protein downside. According to risk management specialists at Cornell, operations that implement component-based hedging strategies are seeing 15-20% lower margin volatility.

Here’s what I’m watching for the rest of Q3 2025: the July 15 GDT auction will either confirm this bearish trend or signal a potential floor. Chinese import data for June and July could be a game-changer if demand recovers. And honestly? Northern Hemisphere heat stress could provide some unexpected price support if production drops more than expected.

The question isn’t whether dairy markets will recover—they always do. The question is whether you’ll be positioned to capture the opportunities when they emerge. This market correction has separated the producers who understand the new realities from those still playing by the old rules.

And honestly? That separation is only going to become more pronounced as we move through the rest of 2025. The producers who embrace component optimization, understand regional dynamics, and implement sophisticated risk management will be writing the next chapter of this industry’s story.

The rest will just be reading about it in the market reports.

Complete references and supporting documentation are available upon request by contacting the editorial team at editor@thebullvine.com.

Learn More:

Join the Revolution!

Join over 30,000 successful dairy professionals who rely on Bullvine Weekly for their competitive edge. Delivered directly to your inbox each week, our exclusive industry insights help you make smarter decisions while saving precious hours every week. Never miss critical updates on milk production trends, breakthrough technologies, and profit-boosting strategies that top producers are already implementing. Subscribe now to transform your dairy operation’s efficiency and profitability—your future success is just one click away.

NewsSubscribe
First
Last
Consent

When Dairy Giants Shake Hands: What the Lactalis-Fonterra Deal Really Means for Your Operation

80% of global dairy trade now controlled by 20 companies… your feed efficiency gains just became survival tools, not luxuries.

EXECUTIVE SUMMARY: Look, I’ve been tracking dairy consolidation for years, but this Lactalis-Fonterra deal? It’s different. The days of relying on single processor relationships are officially over – and that’s actually good news if you play it right. We’re talking about precision feeding systems delivering 8-12% feed cost reductions with payback periods under two years, while genomic testing costs have dropped enough that mid-sized operations are seeing 2-3% annual production increases. The global dairy giants are reshaping supply chains with multi-billion dollar deals, but here’s what they need… reliable milk supplies from efficient operations. Current farm loan rates at 5% make this the perfect time to invest in operational excellence that’ll position you ahead of the consolidation wave. You should start diversifying your processor relationships and upgrading your systems now, before your neighbors figure this out.

KEY TAKEAWAYS

  • Diversify your buyer options immediately – Operations maintaining 3 processor relationships are keeping margins above regional averages even as consolidation accelerates. Start those conversations today because contract terms will shift in 2025.
  • Genomic testing ROI is finally real – With costs dropping to accessible levels, farms using genomic selection are banking 2-3% annual production increases while improving herd health. Your breeding decisions made today determine your competitiveness in 2027.
  • Feed efficiency technology pays for itself – Precision feeding systems are cutting feed costs by up to 12% with reasonable payback periods. In today’s margin-squeezed environment, that’s the difference between thriving and surviving.
  • Geographic positioning matters more than ever – Transportation costs can swing your milk check by significant amounts based on processor proximity. If you’re planning expansion or new facilities, location isn’t just about land prices anymore.
  • Operational excellence beats farm size – Top-quartile operations maintain profit margins during commodity downturns by focusing on consistent milk quality, efficient feed conversion, and strategic breeding programs. The market rewards efficiency over acreage.
dairy industry consolidation, precision feeding technology, genomic testing ROI, dairy profitability strategies, global dairy markets

You know that moment when you’re grabbing coffee at World Dairy Expo and someone drops news about a massive industry deal? That sinking feeling of “what does this mean for the rest of us”? Well, Lactalis just made their move on Fonterra’s consumer brands, and… honestly, it’s more complex than your first gut reaction.

What’s Actually Going Down Here

So the French dairy powerhouse—and man, these guys are absolutely massive—just got approval to scoop up Fonterra’s crown jewels: Anchor, Mainland, and Perfect Italiano. But here’s what really gets me about this deal… it’s not just about slapping different labels on milk jugs.

What strikes me is how this fits into something much bigger. According to recent work from Rabobank’s Global Dairy Top 20 analysis, Lactalis is essentially buying control over significant processing capacity and—this is the kicker—the distribution networks that move dairy products across Oceania. When you control the infrastructure, you control the game.

The Australian Competition and Consumer Commission gave this the green light just today, actually. July 10th. But regulatory approval? That’s just paperwork. The real story is what this means for milk pricing from Auckland to Wisconsin… and everywhere in between.

This development is fascinating because it’s happening at a time when we’re finally seeing feed costs stabilize after the chaos of 2022-2023. But energy costs and labor shortages? Still eating into everyone’s margins. Producers are feeling this squeeze from the Central Valley to the North Island.

The Numbers That Keep Me Up at Night

Let’s discuss the current market reality for a moment. The top 20 companies in the dairy industry now control approximately 80% of internationally traded products. That concentration isn’t slowing down… it’s accelerating like a fresh cow bolting from the holding pen.

What’s particularly noteworthy is how this highlights something we’ve been seeing for years—cooperatives face inherent capital constraints when competing against corporations with access to global capital markets. Lactalis has a revenue base north of $30 billion, which is something most players can’t touch.

Current financing conditions show farm operating loans at 5.000% and ownership loans at 5.875% according to recent USDA data. That’s actually manageable for qualified borrowers, but debt service coverage ratios—man, that’s where you need to be careful, as commodity cycles keep doing their thing.

I was just talking to a producer in Wisconsin (won’t name names, but you know the type). They’ve managed to keep margins above regional averages by maintaining relationships with three different processors. Extra paperwork? Sure. But when contract terms shift, having options is… well, it’s everything.

Consolidation is Moving Fast—Really Fast

Look what’s happening in Europe right now.  According to European dairy analysts, a potential merger between Arla and DMK is being discussed, this potential massive merger will manage 19 billion kilograms of milk annually. That’s essentially three months’ worth of U.S. Grade A supply in one entity. When you think about it that way… it’s pretty staggering.

I’ve been tracking these patterns for years now, and what’s fascinating is how differently regions are responding. European consolidation appears to be characterized by defensive cooperative mergers, with mid-sized players attempting to survive. North American dynamics involve more strategic acquisitions. But Asia-Pacific? That’s where foreign investment is completely reshaping the landscape.

The Australian experience from 2016 still gives me chills. When Murray Goulburn and Fonterra Australia retrospectively cut milk prices, over 2,000 dairy farmers saw their income drop with virtually no recourse. That’s what happens when market power concentrates and producers don’t have alternatives.

What This Means for Your Operation

So, where does this leave independent producers? Look, I won’t sugarcoat it—you’re facing fewer buyer options. But that doesn’t automatically spell disaster. Some operations are actually thriving in this environment, and a pattern emerges from what they’re doing.

Feed conversion efficiency… this is where the rubber meets the road. According to recent research published in progressive dairy publications, precision feeding systems are delivering significant feed cost reductions with payback periods that’re actually reasonable—we’re talking about realistic timelines in most cases.

Here’s what’s really exciting—genomic testing has become way more accessible. This DNA analysis stuff that predicts which animals will be your best producers? According to recent industry analysis from Hoard’s Dairyman, operations utilizing genomic selection are experiencing 2-3% annual production increases compared to those using conventional breeding. The costs have dropped significantly, making it feasible for mid-sized operations.

Your somatic cell count (SCC)—basically, the white blood cell count in milk that indicates udder health—becomes even more critical in a consolidated market. Processors are becoming more discerning about quality, and anything exceeding 400,000 SCC will impact your price. Hard.

Technology is Changing Everything

What’s happening with technology integration across the industry is… honestly, it’s remarkable. Automated systems, including HEPA filtration and robotic palletizers, as well as predictive maintenance protocols, are reducing operating costs while enhancing product consistency.

Precision agriculture technologies are starting to integrate with dairy management systems in ways that would’ve seemed like science fiction five years ago. GPS-guided feed delivery, automated cow monitoring, environmental sensors… we’re looking at a completely different operational landscape.

However, what really excites me is the democratization of some of these technologies. Small and mid-sized operations can now access tools that were previously only available to the biggest players. The challenge is knowing which investments will actually pay off versus which ones are just shiny objects.

Regional Differences Are Getting Starker

European processors moved immediately after news of this deal broke. The FrieslandCampina-Milcobel combination is pure defensive positioning—mid-sized cooperatives recognizing they need scale to survive.

North American dynamics differ due to our regulatory frameworks and cooperative structures. Dairy Farmers of America’s recent moves demonstrate how large cooperatives can compete with corporate consolidation, although capital constraints remain a significant challenge.

DFA gets something crucial—collective bargaining power scales with size, but so does operational complexity. Their massive volume gives them leverage that individual operations simply can’t match.

Asia-Pacific markets are absolutely fascinating right now. According to Rabobank’s latest regional analysis, the region continues to show strong growth potential, with Southeast Asia emerging as the bright spot for exporters as consumption patterns shift post-pandemic. We’re talking about $340 billion in market value with solid growth projections.

What You Can Actually Do About This

Alright, enough theory. Here’s what I’m seeing work in the field…

Diversify your processor relationships. Even in concentrated markets, multiple buyers exist for quality milk. I know producers who maintain relationships with three different processors. Yes, it’s extra paperwork. Yes, it’s more complicated. But when contract terms shift—and they will—having options is everything.

Operational excellence isn’t optional anymore. Recent University of Wisconsin extension research shows that top-quartile operations maintain profit margins even during commodity downturns. Key differentiators? Consistent milk quality (low SCC, minimal antibiotic residues), efficient feed conversion, and strategic breeding programs.

Strengthen your cooperative relationships. Cooperatives handle the majority of U.S. milk production and provide collective bargaining capabilities that individual operations can’t match. But not all cooperatives are created equal. Focus on those with strong financial positions and actual strategic vision, not just historical momentum.

Geographic positioning matters more than most people realize. Transportation costs can significantly impact your bottom line, depending on proximity to processing facilities. If you’re building or expanding… location, location, location.

The Road Ahead Gets Bumpy

This deal signals an evolution in the industry, not a disruption. But let’s be honest—successful producers will need to adapt to concentrated markets while maintaining operational flexibility.

What strikes me most about current trends is how quickly adaptation is becoming the key differentiator. The fundamentals of milk production remain sound, but market dynamics require strategic thinking that extends beyond traditional approaches.

Consolidation creates both challenges and opportunities. Processors need reliable milk supplies to justify their capital investments. Quality producers with efficient operations and flexible marketing arrangements often find themselves in stronger positions, not weaker ones.

However, what worries me is that the middle is getting squeezed. You’re either big enough to have options or efficient enough to command premium treatment. The producers caught in between? That’s where the real challenges lie.

Bottom Line—What Really Matters

Look, the dairy industry is consolidating whether we like it or not. This Lactalis deal isn’t some anomaly—it’s a preview of what’s coming. Smart producers are already positioning themselves for this reality.

Your move? Diversify processor relationships, invest in operational excellence, and strengthen cooperative ties. The producers who thrive will be those who understand that adaptation beats resistance every single time.

The market rewards efficiency, quality, and strategic thinking. If you can deliver consistent, high-quality milk while managing costs effectively, you’ll find buyers. The question isn’t whether consolidation will affect your operation—it’s whether you’ll be ready when it does.

And honestly? That preparation starts today, not tomorrow. Because in a world where global dairy giants are reshaping supply chains with multi-billion-dollar deals, the advantage goes to those who see change coming and position themselves accordingly.

The industry is evolving fast. Make sure your operation evolves with it.

Complete references and supporting documentation are available upon request by contacting the editorial team at editor@thebullvine.com.

Learn More

Join the Revolution!

Join over 30,000 successful dairy professionals who rely on Bullvine Weekly for their competitive edge. Delivered directly to your inbox each week, our exclusive industry insights help you make smarter decisions while saving precious hours every week. Never miss critical updates on milk production trends, breakthrough technologies, and profit-boosting strategies that top producers are already implementing. Subscribe now to transform your dairy operation’s efficiency and profitability—your future success is just one click away.

NewsSubscribe
First
Last
Consent

Washington Just Handed Dairy Farmers a $68 Billion Gift, But Here’s Why Most Won’t Unwrap It Properly

Washington handed dairy farmers $68B, but 80% won’t use it. Smart genomic testing + DMC coverage = $4,000 annual savings per 280-cow operation.

EXECUTIVE SUMMARY: Most dairy producers are about to waste the biggest policy gift in a decade while their smarter competitors capitalize on enhanced risk management combined with record component production. The “One Big Beautiful Bill” delivers $68.3 billion in agricultural program changes that fundamentally restructures dairy risk management, increasing Tier I DMC coverage from 5 million to 6 million pounds annually, yet based on historical uptake patterns, most operations will leave money on the table. Component levels have reached unprecedented highs with butterfat averaging 4.33% and protein at 3.36% in March 2025, representing 30.2% butterfat growth and 23.6% protein growth since 2011 while milk volume increased only 15.9%. European Union milk production is declining 0.2% in 2025 while U.S. operations benefit from enhanced DMC protection at just $0.15 per hundredweight for $9.50 coverage, creating unprecedented competitive advantages for producers who combine genetic advancement with strategic risk management. The question isn’t whether this policy works, it’s whether you’ll implement it before your competitors figure out the genomics-plus-government-support equation that’s reshaping dairy profitability.

KEY TAKEAWAYS

  • Enhanced DMC Coverage Delivers Immediate ROI: Operations producing up to 6 million pounds annually can now insure entire production at Tier I rates, potentially saving $3,000-4,000 annually in premium costs while gaining comprehensive $9.50 per hundredweight margin protection, yet only 19% of large-scale farms have adopted robotic milking systems despite proven economic returns.
  • Component Revolution Outpaces Volume Strategy: Butterfat production surged 30.2% since 2011 versus 15.9% milk volume growth, with genomic testing enabling 12% higher milk solids and 8% lower feed costs. Every 0.1% butterfat increase adds $6,570 monthly to a 1,000-cow operation when butterfat commands $3.06 per pound, yet most producers still chase volume over value.
  • Technology Adoption Gap Creates Competitive Moats: While global precision dairy farming markets exceed $5 billion in 2025, USDA reports only 19% adoption of robotic milking on large-scale farms. Forward-thinking operations combining enhanced DMC protection with automated milking systems achieve 150-240 cow efficiency per 3-4 robotic units, creating sustainable advantages over traditional competitors.
  • Global Market Positioning Window Closing: U.S. operations benefit from $8 billion in new dairy processing capacity through 2027 while EU production declines 0.2%, but 2025 DMC enrollment deadline passed March 31. Producers must audit genomic testing programs, evaluate technology investments, and prepare for 2026 enrollment to capitalize on component premiums and enhanced risk management before international competitors adapt.
  • Feed Cost Arbitrage Opportunity: With corn at $4.60 per bushel and enhanced DMC coverage protecting downside risk, smart operators can lock favorable feed contracts while leveraging updated 2021-2023 production baselines that reflect modern genetic gains. This combination of enhanced risk management plus strategic feed positioning creates unprecedented profit protection during volatile market conditions.

The U.S. Senate just passed the most significant dairy policy overhaul in a decade, and frankly, most of you won’t take advantage of it. The “One Big Beautiful Bill” includes $68.3 billion in agricultural program changes over 10 years that fundamentally restructure risk management for dairy operations nationwide. However, if history is any indication, too many producers will likely leave money on the table.

Here’s the reality: Washington doesn’t often get dairy policy right, but when it does, smart operators capitalize, while others complain about the paperwork. The enhanced Dairy Margin Coverage (DMC) program, launched in 2025, offers benefits that could fundamentally improve your operation’s financial resilience, provided you’re willing to challenge conventional thinking about government programs.

Why This DMC Enhancement Actually Matters (Unlike Previous Attempts)

Let’s cut through the political noise. The legislation expands DMC coverage capacity by 20%, increasing the Tier I production cap from 5 million to 6 million pounds annually. This isn’t just bureaucratic shuffling, it means operations with up to 300 cows can now insure their entire production at premium rates while accessing maximum protection levels of $9.50 per hundredweight.

However, here’s what most won’t tell you: this enhancement emerged during an unprecedented period of genetic progress. U.S. dairy operations have achieved four consecutive years of record butterfat levels, reaching a national average of 4.23% in 2024. Protein content has similarly climbed to 3.29% in 2024, marking eight consecutive annual records from 2016 to 2024.

What This Means for You: A 280-cow Wisconsin operation producing 5.8 million pounds annually can now insure their entire production at Tier I rates, potentially saving $3,000-4,000 annually in premium costs while gaining comprehensive margin protection. With current milk production forecasts reaching 227.8 billion pounds for 2025, these enhanced protections couldn’t come at a better time.

The updated production baselines represent the second game-changer. Producers can now select their highest annual milk production from 2021, 2022, or 2023 as their new coverage foundation. This addresses the reality that modern genetics and precision feeding have driven dramatic productivity gains, yet most operations still use outdated baselines that don’t reflect their actual potential.

The Component Revolution That’s Reshaping Everything

Here’s where it gets interesting. While everyone obsesses over herd size, the real money is in milk composition. The industry’s adoption of genomic testing has transformed breeding decisions, with butterfat levels increasing from 3.70% to 4.40% over the past 20 years, while protein levels have risen from 3.06% to 3.40%.

Industry Example: Recent analysis confirms that genomic testing and precision nutrition deliver up to 12% higher milk solids and 8% lower feed costs. Every 0.1% increase in butterfat can add $6,570 monthly to a 1,000-cow herd’s bottom line when butterfat commands $3.06 per pound and protein reaches $2.32 per pound.

The numbers don’t lie, and they’re jaw-dropping. From 2011 to 2024, milk production increased 15.9% while protein climbed 23.6% and butterfat increased 30.2%. This isn’t a temporary blip, but the culmination of a decades-long genetic revolution that has fundamentally transformed what comes out of our cows.

Yet here’s the contradiction nobody discusses: while component levels surge to record highs, many operations still prioritize volume over value. The enhanced DMC program rewards precision, not just production.

Technology Integration: Where Smart Money Goes

The agricultural bill’s benefits coincide with the rapid adoption of precision dairy technologies, but most operations aren’t leveraging the synergies. The global precision dairy farming market is projected to exceed $5 billion by 2025; however, the USDA reports that only 19% of large-scale farms have adopted robotic milking systems, despite their proven returns.

Automated milking systems demonstrate proven economic returns, with research confirming that AMS operations achieve comparable performance to conventional systems while typically milking 150-240 cows with 3-4 robotic units. The USDA reported robotic milking adoption on 19% of large-scale dairy farms, creating massive competitive advantages for early adopters who combine enhanced DMC protection with technological efficiency gains.

Modern high-producing operations now achieve remarkable metrics, with dry matter intake exceeding 68 pounds daily while producing over 120 pounds of energy-corrected milk. These efficiency gains, combined with enhanced DMC protection, position forward-thinking operations for sustained profitability while competitors struggle with outdated approaches.

The Transparency Initiative Nobody Saw Coming

For the first time in dairy policy history, the legislation mandates biennial surveys of processor manufacturing costs, directly addressing pricing formulas that have remained static while processing technology and costs have evolved.

Current Federal Milk Marketing Order pricing changes took effect June 1, 2025, including updated make allowances for cheese ($0.2519), dry whey ($0.2668), butter ($0.2272), and nonfat dry milk ($0.2393). These adjustments will reshape milk pricing formulas by ensuring that the make allowance calculations reflect actual processing costs rather than outdated estimates.

The national average somatic cell count now sits at 181,000 cells per milliliter, representing the lowest recorded level in decades. This reflects improved management practices and genetic selection, yet many operations haven’t capitalized on quality premiums that could dwarf traditional volume-based thinking.

Global Competitive Reality Check

While U.S. operations benefit from enhanced risk management, global competitors face constraints. European Union milk production is forecast to decline by 0.2% in 2025 due to environmental regulations, while global milk production is expected to grow by only 1.0% to 992.7 million tonnes.

U.S. operations benefit from favorable feed costs and expanding processing capacity. This competitive advantage, combined with enhanced risk management, enables U.S. producers to capture growing global demand while competitors contract.

Here’s the kicker: Over half of the increased global production is anticipated to come from India and Pakistan, which will jointly account for more than 32% of world production by 2032. U.S. technology adoption and genetic advancement create sustainable competitive moats that enhanced DMC protection helps preserve.

Implementation Strategy: What Winners Do Differently

The legislation extends critical dairy programs through 2029-2031, providing unprecedented long-term certainty. For 2025 coverage, DMC enrollment ran from January 29 to March 31, 2025.

Smart operators who enrolled by the March 31, 2025, deadline are:

  • Leveraging updated production baselines that reflect recent genetic gains from 2021-2023 data
  • Integrating genomic testing programs to maximize component production and quality premiums
  • Preparing for FMMO pricing changes that reshape milk pricing through transparent cost accounting

The premium structure remains unchanged: catastrophic coverage at $4 comes with no premium, while the highest level of $9.50 costs just 15 cents per hundredweight. At $0.15 per hundredweight for $9.50 coverage, Dairy Margin Coverage is a cost-effective tool for managing risk and providing security for your operations.

The Contrarian Perspective Nobody Wants to Hear

Here’s the uncomfortable truth: enhanced government support might actually encourage complacency instead of innovation. The most successful operations use risk management tools as safety nets, not business strategies.

Question for your operation: Will enhanced DMC coverage become a crutch that prevents necessary operational improvements, or will it provide the security needed to invest in transformative technologies?

The legislation’s broader SNAP reduction components create market contradictions. While Washington encourages production expansion through enhanced support, they’re simultaneously creating potential domestic demand pressures. Smart operators diversify into export markets and value-added products rather than betting everything on domestic fluid milk.

The Latest: Your Strategic Assessment for Mid-2025

The “One Big Beautiful Bill’s” $68.3 billion in agricultural program changes deliver transformative benefits to dairy producers through enhanced DMC coverage, now active for those who enrolled by the March 31, 2025, deadline. As we hit mid-2025, the industry achieves record component production and technological advancement while benefiting from enhanced risk management protection.

Your current strategic opportunities:

  1. Audit your genomic testing program and component selection criteria to capitalize on record component premiums
  2. Evaluate technology investments that complement enhanced risk management protection
  3. Prepare for ongoing FMMO transparency changes that continue to reshape milk pricing formulas
  4. Plan for 2026 DMC enrollment when the next enrollment period opens (typically January-March)

The bottom line: This legislation positions U.S. dairy operations for expanded production capacity while global competitors contract. The combination of enhanced risk management, record component production, and proven technology adoption creates the strongest financial foundation for U.S. dairy operations in over a decade.

But here’s what separates winners from whiners: Enhanced DMC coverage won’t save poorly managed operations or replace sound business fundamentals. It will, however, provide exceptional downside protection for producers who are smart enough to leverage genetic advancements, component optimization, and technological efficiency.

“We encourage producers to join the many dairy operations that have already signed up for this important safety net program,” emphasized USDA Farm Service Agency officials. “At $0.15 per hundredweight for $9.50 coverage, risk protection through Dairy Margin Coverage is a cost-effective tool to manage risk and provide security for your operations.”

The question isn’t whether Washington got dairy policy right for once, it’s whether you capitalized on their rare moment of clarity. Those who missed the 2025 deadline learned an expensive lesson about timing. Don’t let that be you when 2026 enrollment opens. The genetic revolution in component production is accelerating, technology adoption rates are climbing, and enhanced risk management tools have proven effective; the pieces are aligned for unprecedented dairy industry success if you’re positioned to capitalize on it.

Complete references and supporting documentation are available upon request by contacting the editorial team at editor@thebullvine.com.

Learn More:

Join the Revolution!

Join over 30,000 successful dairy professionals who rely on Bullvine Weekly for their competitive edge. Delivered directly to your inbox each week, our exclusive industry insights help you make smarter decisions while saving precious hours every week. Never miss critical updates on milk production trends, breakthrough technologies, and profit-boosting strategies that top producers are already implementing. Subscribe now to transform your dairy operation’s efficiency and profitability—your future success is just one click away.

NewsSubscribe
First
Last
Consent

Trade War Reality Check: How North America’s $1.18 Billion Dairy Dependency Just Got Brutally Exposed

Export dependency isn’t prosperity—it’s vulnerability. $1.18B Canadian trade at risk. Smart producers build anti-fragile operations instead.

Executive Summary: The dairy industry’s sacred cow of “export growth equals prosperity” just got slaughtered, and North American producers are about to pay the price in blood. With US-Canada trade talks collapsed and $1.18 billion in annual dairy exports hanging in the balance, the brutal mathematics of trade dependency are delivering a $1.70 per hundredweight reality check that could crater farm-level profitability across two nations. Research from Texas Tech University confirms USMCA boosted export values 34% since 2020, but Canada’s masterful TRQ manipulation achieved only 42% quota fill rates—proving market access on paper means nothing without genuine commercial access. While politicians wage economic warfare, smart producers are learning from New Zealand’s component-focused model and the EU’s institutional crisis response to build operations that gain strength from market disruption rather than break under pressure. The 2026 USMCA review is guaranteed to target dairy again, making the window for building truly resilient operations critically narrow. Stop waiting for politicians to solve trade wars and start building operations that thrive on uncertainty—your farm’s survival depends on how you answer that strategic challenge today.

Key Takeaways

  • Component Optimization Beats Volume Dependency: New Zealand’s milk solids payment system proves profitability comes from value, not volume—US butterfat production surged 82 million pounds (3.4%) in Q1 2025 alone, with Iowa averaging 4.44% butterfat delivering $1.3 billion to processors.
  • Technology-Driven Risk Management Delivers Immediate ROI: Precision feeding systems reduce costs 7-12% while improving production, with every pound of feed saved returning 11 cents per cow per lactation—enough for 1,000-cow operations to save $55,000 annually and weather most trade volatility.
  • Diversification Strategy Reduces Political Vulnerability: Mexico represents America’s #1 dairy customer, not Canada—operations reducing trade dependency below 30% of revenue demonstrate measurably higher resilience during policy disruptions.
  • Financial Risk Management Isn’t Optional Anymore: DMC coverage at $9.50 margin costs only $0.155 per cwt but provides essential protection when margins collapse—the 2018-2020 trade war required $25.7 billion in federal bailouts that covered lost revenue but couldn’t restore permanently damaged customer relationships.
  • Five-Point Trade Resilience Audit Reveals Hidden Vulnerabilities: Operations completing revenue concentration analysis, input dependency assessment, financial risk coverage audit, component optimization evaluation, and market diversification planning position themselves to gain competitive advantage while competitors struggle with dependencies they should have addressed years ago.
dairy trade dependency, dairy export risks, farm operational resilience, dairy profitability strategies, precision dairy management

What happens when the world’s longest undefended border becomes a dairy battleground? You’re about to find out—and the $1.18 billion in annual US dairy exports to Canada hanging in the balance is just the beginning of this economic carnage that could slash milk prices by $1.70 per hundredweight and permanently reshape continental dairy economics.

The gloves are off. Trade talks between the US and Canada have officially collapsed, and North American dairy farmers are staring down the barrel of a full-scale trade war that threatens to destroy decades of integrated supply chain relationships. While politicians play chess with farmer livelihoods, the brutal mathematics of trade dependency are about to deliver a masterclass in why building your business strategy around political cooperation is the fastest route to bankruptcy.

Here’s the uncomfortable truth most industry publications won’t tell you: This crisis isn’t just about politics or tariffs. It’s about an entire industry that built its growth strategy on a foundation of sand—and that foundation just cracked wide open, exposing vulnerabilities that could crater farm-level profitability across two nations.

Challenging the Sacred Cow: Why Export Dependency is Dairy’s Biggest Strategic Blunder

Let’s challenge a fundamental assumption that has driven North American dairy strategy for decades: the belief that export growth automatically equals farm prosperity. This conventional wisdom has led US producers to chase volume-based export deals while ignoring the catastrophic risks of customer concentration.

The Brutal Mathematics of Dependency

Canada represents the second-largest export market for US dairy, absorbing $1.18 billion worth of American dairy products in 2024 alone. That’s not just trade volume—that’s the equivalent of processing 5.6 billion pounds of milk annually, or roughly what 265,000 high-producing cows generate annually.

But here’s where conventional thinking fails spectacularly: Industry leaders celebrate these export figures as “market success” without acknowledging the devastating vulnerability they create. When your second-largest customer can disappear overnight due to political posturing, you haven’t built a sustainable business model—you’ve constructed an economic house of cards.

Why This Conventional Approach is Wrong

The EU learned this lesson the hard way in 2014 when Russia imposed food embargoes that instantly eliminated markets absorbing 33% of EU cheese and 28% of butter exports. The difference? European policymakers had institutional crisis response mechanisms ready. North American dairy has reactive bailout programs that arrive after the damage is done.

Research confirms that trade policy disruptions could reduce US milk prices by up to $1.90 per hundredweight, with Class III milk potentially declining by $2.86 per hundredweight under retaliatory tariff scenarios. For perspective, a 1,000-cow operation producing 80 pounds per cow daily would face annual revenue losses approaching $50,000—enough to finance critical infrastructure improvements or weather multiple market downturns.

The USMCA Deception: A Masterclass in Diplomatic Theater

You want to know why this trade war was inevitable? Because the USMCA was a masterpiece of diplomatic theater that solved exactly nothing while creating the illusion of market access progress.

The Promise Versus Reality Gap

On paper, the USMCA delivered spectacular gains for US dairy: expanded Tariff-Rate Quotas across 14 dairy categories, theoretical access to 3.6% of Canada’s protected market, and elimination of controversial Class 6 and 7 pricing systems. The US dairy industry celebrated what appeared to be a breakthrough worth hundreds of millions in new export opportunities.

Research from Texas Tech University confirms that USMCA boosted the value of US dairy exports to Canada by a verified 34% since 2020. But here’s the brutal catch nobody talks about: volume growth without price realization is just expensive market share buying.

Canada’s Administrative Genius

Canada’s response was brilliant in its bureaucratic sophistication: allocate the vast majority of import quota licenses to Canadian dairy processors with zero commercial incentive to import finished US products that compete with their brands. It’s like giving all the feed purchasing contracts to ethanol plants and then acting surprised when nobody buys dairy-quality corn.

The numbers don’t lie: Despite nominal market access promises, the average fill rate across all 14 dairy TRQs was a pathetic 42% in 2022/2023, with nine quotas falling below 50% utilization. This isn’t market access—it’s market access theater designed to pacify American negotiators while preserving Canadian protectionism.

Asymmetric Economic Warfare: Why This Trade War Hits Different

For US Dairy Farmers: The Export Cliff

When Canadian export demand disappears overnight, basic supply-and-demand economics deliver immediate punishment. According to Hoard’s Dairyman analysis, widespread retaliatory tariffs could slash 2.3% to 6.9% from US dairy prices, with processing milk potentially plummeting $1.70 per hundredweight. Market sensitivity is so extreme that Class III milk futures have dropped 12% on tariff rhetoric alone, before any actual duties were enacted.

The vulnerability is stark: More than 70% of new skim product production since 2005 has left the country, making exports a pressure release valve rather than a luxury. These exports aren’t optional but essential for maintaining domestic market balance.

For Canadian Dairy Farmers: The Supply Chain Stranglehold

Canada’s supply management provides stable milk prices, but it cannot shield against supply chain chaos. Canadian processors rely heavily on US ultra-filtered milk, specialized proteins, and genetics, all facing potential 25% tariffs and border delays.

The genetics market illustrates this vulnerability perfectly. Canadian exports of elite live cattle and embryos to the US have grown 121% since 2019, creating a $39 million trade supporting genetic improvement on both sides of the border. Imposing 25% tariffs would add $9.75 million in annual costs to North American genetic advancement programs.

Here’s the comparison that should terrify both sides:

Impact CategoryUS Farmers (High Risk)Canadian Farmers (Moderate Risk)
Milk Price Impact-$1.70/cwtMinimal direct impact
Input Cost IncreaseFeed +8%, Equipment +15%All imports +25%
Export Revenue Loss$1.18B at risk$99M specialty products
Government Support7% of losses covered19% of losses covered
Supply Chain RiskLoss of a major export channelCritical input disruption

Source: University of Wisconsin-Extension trade impact analysis and industry data

Learning From Global Competitors: The Anti-Fragility Playbook

While North American producers prepare for mutual destruction, global competitors demonstrate sophisticated crisis management that builds rather than destroys long-term resilience.

The EU’s Institutional Response Model

When Russia eliminated markets absorbing 33% of EU cheese and 28% of butter exports in 2014, the European response was swift and institutionalized:

  • Public Intervention: Government purchase programs removed surplus from markets at guaranteed prices
  • Private Storage Aid: Subsidized storage reduced market pressure
  • Targeted Financial Support: Direct aid to the most exposed regions
  • Market Diversification: Aggressive diplomatic campaigns to open new markets

The European Court of Auditors found that while the EU’s response was swift, providing €390 million in support, the result was clear: the EU emerged more diversified and resilient than before the crisis.

New Zealand’s Farm-Level Anti-Fragility

New Zealand exports 95% of its dairy production, making it incredibly vulnerable to global shocks. Their solution wasn’t government protection—it was building anti-fragile operations from the farm up.

Kiwi farmers get paid on kilograms of milk solids (fat and protein), not fluid volume. This incentivizes every decision toward high-value production. According to industry analysis, even during severe droughts, milk solids production can increase while fluid collections fall, leading to record payouts.

This mirrors emerging US trends. The Bullvine reports that American butterfat content has surged dramatically, with Q1 2025 production jumping 82 million pounds (3.4% increase) compared to 2024, while some states like Iowa now average 4.44% butterfat.

Why This Matters for Your Operation: The Component Revolution

Are you still measuring success by pounds in the tank? Stop. That’s volume-focused thinking that’s about to become obsolete. Research confirms the US dairy industry is experiencing an unprecedented “butterfat tsunami,” transforming the economic fundamentals of dairy production.

According to The Bullvine’s market analysis, “without robust exports, the entire U.S. dairy pricing structure would collapse under the weight of our component surplus.” With domestic butterfat production vastly outpacing consumption, export markets have become essential to maintaining market balance.

The Financial Impact is Real

High-component milk commands premium prices for cheese, butter, and powder production—the exact products driving export growth. Every percentage point improvement in butterfat or protein content translates to measurable revenue increases that can buffer trade-related price volatility.

The Technology Edge: Precision Agriculture Meets Trade Uncertainty

Modern dairy operations possess crisis management tools that their predecessors never imagined. Advanced feeding systems are revolutionizing dairy nutrition, using individual cow data to deliver customized nutrition plans that maximize production while minimizing waste.

Every Pound of Feed Saved Returns Value

Cornell University research shows that “Feed represents 50-60% of production costs on most dairy operations. Precision feeding systems reduce feed costs by 7-12% while improving production and component levels”. For a 1,000-cow operation, improving feed efficiency by just 5% could save $55,000 annually—enough to weather most trade-related price volatility.

The most innovative dairies now use individual cow-feeding systems that recognize each animal by RFID and dispense custom grain allocations based on production level, stage of lactation, and health status. This approach typically reduces feed costs by 5-10% while maintaining or improving milk production.

Are You Really Managing Risk, or Just Playing Defense?

Here’s a question that should make every dairy operator uncomfortable: What percentage of your operation’s profitability depends on politically stable relationships with foreign governments?

If you can’t precisely answer that question, you’re flying blind in the most volatile trade environment in decades. The USDA Economic Research Service quantified the 2018-2020 trade war damage: more than $27 billion in lost US agricultural exports, with dairy suffering $391 million in annualized losses.

The Federal Bailout Myth

Don’t count on government bailouts to save you. The $25.7 billion in federal aid during the last trade war was merely a band-aid on a severed artery. Government checks compensated for lost revenue but did nothing to restore customer relationships or rebuild market share.

Once an export market gets ceded to competitors—like EU cheese filling Mexican orders previously served by US producers—winning it back takes years and costs exponentially more than maintaining the original relationship.

Strategic Response Framework: Building Anti-Fragile Operations

For US Dairy Producers: The Diversification Imperative

Stop treating risk management like an optional extra. Risk management experts say, “many dairies won’t survive this decade—not because they aren’t good farmers, but because they’re poor risk managers”.

Layer financial protections by combining Dairy Margin Coverage (DMC) and Dairy Revenue Protection (DRP), and forward contracts to hedge against price collapses. DMC coverage at the $9.50 margin level costs roughly $0.155 per cwt but triggers payments when margins fall below that threshold.

Embrace Technology-Driven Efficiency

Farms implementing IoT technologies and data analytics are seeing productivity jump by 15-20% while slashing health-related costs by 30%. Automated systems cut labor costs by 60%+ while improving herd health monitoring capabilities.

Look Beyond the Northern Border

Mexico is America’s #1 dairy customer, not Canada. Japan, South Korea, and Southeast Asia offer high-growth markets with fewer political hurdles. Every dollar of business development investment targeting these markets reduces dependency on the contentious Canadian relationship.

For Canadian Dairy Producers: Fortress Reinforcement

Your biggest vulnerability isn’t price volatility—it’s supply chain integrity. Lock in long-term contracts for critical US inputs and champion domestic alternatives for essential supplies.

Technology-driven efficiency becomes critical within supply management, where profitability depends entirely on cost control. Robotic milking systems, precision feeding platforms, and advanced data management aren’t luxuries—they’re competitive necessities.

Sustainability Under Pressure: The Hidden Cost of Trade Wars

Trade disruptions create cascading effects on sustainability investments that most producers overlook. Long-term sustainability projects often become the first casualties when operations face sudden revenue losses from market disruption.

The Environmental-Economic Nexus

Precision feeding systems that reduce nitrogen and phosphorus excretion by 15-20% also deliver immediate cost savings. During trade uncertainty, these dual-benefit technologies become essential for maintaining both environmental compliance and profitability.

Climate-resilient infrastructure investments—from renewable energy systems to enhanced drainage—provide buffer capacity during market stress. Operations that postpone these improvements due to trade-related cash flow constraints often face compounded vulnerabilities when weather challenges coincide with market disruptions.

Seasonal Cash Flow Implications: When Trade Wars Hit Peak Production

Trade disruptions don’t respect seasonal production cycles. The timing of tariff implementation can create particularly severe cash flow problems during peak production periods when inventory builds but payments get delayed.

Managing Seasonal Vulnerability

Spring calving operations face heightened risk when trade disputes coincide with peak milk production. Working capital requirements surge exactly when market uncertainty peaks, creating a perfect storm for cash flow problems.

Smart operations implement seasonal cash flow stress testing, modeling how trade disruptions would affect different months based on production curves, feed costs, and traditional payment timing. This analysis reveals specific months of maximum vulnerability and allows for targeted financial preparation.

The 2026 Reckoning: What’s Really at Stake

This current crisis is just the appetizer. The mandatory six-year USMCA review in 2026 will be the main course, and dairy will be the centerpiece of American demands.

The University of Wisconsin Extension notes that supply management will continue to be a major source of discontent between the two nations. The pattern is clear: Every trade negotiation, every dispute panel, every political crisis eventually comes back to the fundamental philosophical clash between Canada’s supply management and America’s export-driven model.

Smart operators on both sides are already preparing for that reckoning. The question isn’t whether there will be another dairy trade crisis—it’s whether your operation will be resilient enough to thrive through it.

The Bottom Line: Trading Dependency for Strategic Independence

Remember that “undefended border” we started with? It became a dairy battleground because too many operations built their strategies around assumptions that political cooperation would last forever.

Here’s your reality check: The cost of trade dependency just got a price tag of up to $1.70 per hundredweight, and it’s higher than most operations can afford.

The path forward isn’t about waiting for politicians to solve this mess—it’s about building operations that thrive regardless of what happens in Washington or Ottawa. The EU weathered Russia’s embargo and emerged stronger. New Zealand survives on 95% exports by focusing on value over volume. Both developed strategies that make them anti-fragile when trade disruptions hit.

Your Five-Point Trade Resilience Audit (Complete This Week):

  1. Revenue Concentration Analysis: Calculate the exact percentage of your income depending on politically sensitive markets. If it’s over 30%, you’re dangerously vulnerable.
  2. Input Dependency Assessment: Identify which critical inputs come from trade-dispute-prone sources. Lock in alternatives immediately.
  3. Financial Risk Coverage: Audit your utilization of available risk management tools. Calculate potential losses under trade disruption scenarios.
  4. Component Optimization Opportunity: Analyze your current milk composition versus component-optimized targets. Model revenue improvements from shifting toward high-solids production.
  5. Market Diversification Potential: Identify which growing markets offer the best opportunities for reduced political risk. Develop concrete action plans for building those relationships.

The operators who complete this audit and act on the results won’t just survive the next trade war—they’ll use it as an opportunity to gain a competitive advantage while their competitors struggle with dependencies they should have addressed years ago.

The stakes couldn’t be higher: With the 2026 USMCA review looming and trade relationships fragmenting, the window for building truly resilient operations is closing fast. The $1.18 billion question just became a $27 billion problem waiting to happen again.

The choice is yours: Will you build an operation that thrives on uncertainty, or will you remain dependent on political stability that history proves doesn’t exist? Your farm’s future—and your family’s financial security—hangs on how you answer that question today.

Complete references and supporting documentation are available upon request by contacting the editorial team at editor@thebullvine.com.

Learn More:

Join the Revolution!

Join over 30,000 successful dairy professionals who rely on Bullvine Weekly for their competitive edge. Delivered directly to your inbox each week, our exclusive industry insights help you make smarter decisions while saving precious hours every week. Never miss critical updates on milk production trends, breakthrough technologies, and profit-boosting strategies that top producers are already implementing. Subscribe now to transform your dairy operation’s efficiency and profitability—your future success is just one click away.

NewsSubscribe
First
Last
Consent

China’s Dairy Bloodbath Signals Global Reckoning: The $47 Billion Market Shift That Will Decide Your Farm’s Future

China’s dairy exodus exposes the scale economics myth crushing small farms worldwide – your survival strategy needs mathematical precision NOW.

EXECUTIVE SUMMARY: Most dairy farmers still believe small-scale operations compete through “efficiency” and “family farm values” – but China’s brutal consolidation proves this romantic notion is economically fatal. Between 2008-2011, Chinese farms with 1,000+ cows increased from 9% to 16% of national production while small operations hemorrhaged market share, revealing that technology adoption barriers and feed costs representing 65-70% of expenses create insurmountable competitive disadvantages. Large-scale operations achieve production costs of $16-18/cwt compared to small farms’ $24-26/cwt through 75% labor reduction via automation, 25% feed cost savings through precision nutrition, and 28.5% yield improvements from consistent milking intervals. With automated milking systems delivering 11:1 ROI on genomic testing and precision feeding reducing costs by 25%, the mathematical reality demands strategic positioning through scale-up, niche-down, or cooperative power models. China’s 2.6% projected milk production decline in 2025 signals global supply-demand shifts affecting feed costs and premium market opportunities worldwide. The consolidation tsunami rewards operations that position themselves through verified industry intelligence rather than wishful thinking about traditional farming’s sustainability.

KEY TAKEAWAYS

  • Technology ROI Verification Exposes Scale Advantages: Automated milking systems ($200,000 investment) deliver 75% labor reduction and 28.5% yield improvements with 5.2-year payback periods, while genomic testing provides 11:1 ROI on breeding interventions – advantages only achievable at 500+ cow operations due to capital recovery requirements.
  • Feed Cost Mathematics Crush Small Operations: With feed representing 65-70% of production expenses and China importing 30% of livestock feed needs, global grain price pressure creates $6-8/cwt cost disadvantages for farms lacking precision feeding systems that reduce expenses by 25% through optimized nutrition delivery.
  • Premium Market Bifurcation Rewards Sophistication: Consumer shifts toward organic milk (25-40% premiums), A2 genetics (60%+ premiums), and specialty products requiring somatic cell counts below 150,000 favor operations with quality systems and certification capabilities that small commodity producers cannot economically justify.
  • Cooperative Power Multiplication Strategy: Successful models like Amul (returning 80% revenues to farmers) and Westby Cooperative (220 farm families sharing ownership) demonstrate how collective bargaining reduces input costs 15-25% while providing technology access equivalent to 1,000+ cow operation efficiencies.
  • Regional Cost Structure Reality Check: North American operations face $18-24/hour skilled labor costs with 40% annual turnover, while EU environmental compliance adds €15,000-25,000 annually per farm – making strategic positioning through verified technology adoption or premium differentiation essential for 2025 survival mathematics.
dairy farm consolidation, scale economics dairy, automated milking systems, dairy profitability strategies, global dairy market trends

China’s small dairy farmers are exiting at unprecedented rates – and this structural transformation will reshape global dairy economics within 18 months. The verified reality: according to comprehensive industry research, between 2008 and 2011, the proportion of milk produced on farms with over 1,000 cows increased from 9% to 16% of national production, while production from farms with fewer than four cows decreased by 11%. The question isn’t whether consolidation will accelerate worldwide, but whether your operation will lead it or become its casualty.

Scale economics aren’t just pressuring operations in China – they’re coming for dairy farmers everywhere. While you’ve been debating organic premiums and sustainability certifications, the brutal mathematics of modern dairy have been rewriting the rules of survival. Rabobank reports that China’s milk production is expected to drop by 2.6% in 2025, marking its second straight year of decline, with farmgate prices falling 15% year-over-year in February alone.

Think of it like comparing a double-4 herringbone parlor against a 72-stall rotary when both are chasing the same commodity milk contracts. The numbers don’t lie, and they’re about to get a lot more unforgiving.

China’s Consolidation Reality – The Numbers Behind the Headlines

The scope of China’s dairy transformation defies comprehension. According to comprehensive research on China’s structural transformation, China’s dairy sector historically was characterized by many small-scale, backyard farms, often managing fewer than 20 cows and relying heavily on family-grown feed. As recently as 2006, more than 80% of China’s milk was produced on farms with fewer than ten cows.

The 2008 melamine contamination scandal became the pivotal moment that triggered massive structural change. This crisis, which sickened tens of thousands of children and resulted in at least six deaths, severely eroded consumer trust and exposed major food safety concerns linked to the fragmented production model. The government responded with the Dairy Structural Adjustment (DSA) policy, aimed at restructuring dairy farms by reducing small-scale operations and promoting large-scale, industrialized farms.

But conventional wisdom gets dangerous here: Most dairy farmers worldwide still believe small-scale operations can compete through “efficiency” and “family farm values.” The Chinese experience brutally exposes this romantic notion.

The current crisis is devastating. Industry data shows that Chinese farmers endured 24 consecutive months of declining milk prices through 2024, with domestic production oversupply creating historically high inventories of whole and skimmed milk powder. Recent analysis confirms milk production fell by 0.5% in 2024, with experts predicting another 1.5% drop in 2025.

The comprehensive research reveals that feed costs account for 65-70% of total dairy farming expenses in China, with domestic feed production covering only about 70% of livestock needs, necessitating costly imports. This economic reality forces many farms, especially small to medium-sized ones, to struggle, leading to closures or reduced herd sizes.

Why This Matters for Your Operation: The economic fundamentals crushing Chinese smallholders – chronic oversupply, processor market power, and technology adoption barriers – aren’t uniquely Chinese problems. They’re global dairy realities heading your way.

Implementation Barriers: The Reality Check Nobody Talks About

Here’s what industry publications won’t tell you about scaling up: The path to survival isn’t just expensive – it’s riddled with barriers that eliminate most operations before they even start.

Financial Implementation Barriers

Verified research shows that small and medium-sized dairy enterprises face critical financial obstacles:

  • Limited access to affordable financing with high interest rates reaching 8-12% annually
  • Lack of collateral for technology investments, with traditional lenders requiring 150-200% asset backing
  • Cash flow disruption during 5-7 year technology payback periods while maintaining existing operations
  • Hidden infrastructure costs often double initial investment estimates

Regional Financial Reality Check:

  • US Midwest: Equipment financing rates 6-8% with USDA backing, but still requires 20-30% down
  • EU Operations: CAP subsidies cover 40-60% of sustainability investments, but bureaucratic delays extend implementation 18+ months
  • Developing Markets: Interest rates 12-18% with limited technical support, making automation economically impossible

Technology Adoption Challenges

The research documents specific technology barriers that crush smaller operations:

Infrastructure Limitations:

  • Rural internet connectivity is insufficient for sensors requiring a minimum of 25 Mbps for real-time monitoring
  • Electrical capacity is inadequate for automated milking systems demanding 50-75 kW continuous power
  • Storage and handling facilities requiring $150,000-300,000 upgrades before automation installation

Skills and Knowledge Gaps:

  • Management complexity increases exponentially with scale – operations over 500 cows require specialized management systems
  • Technology troubleshooting demands expertise unavailable in rural areas, with service calls costing $200-500 per incident
  • Data interpretation skills are essential for precision farming benefits, requiring 40+ hours of annual training investment

Market Access Implementation Challenges

Premium Market Barriers: According to The Bullvine’s market analysis, accessing differentiated markets requires:

  • Certification costs of $15,000-50,000 annually for organic, A2, or specialty designations
  • Direct-sales capabilities requiring marketing and customer service investments of $25,000-75,000
  • Quality system compliance demands laboratory testing, traceability systems, and documentation protocols

Cooperative Development Challenges:

  • Community buy-in often requires 3-5 years of relationship building before operational benefits
  • Governance structures frequently fail due to conflicting individual vs. collective interests
  • Different financial capabilities among members complicate shared investment coordination

Regional Market Specificity: The Global Reality

North American Cost Structures

Feed Cost Analysis (verified through industry data):

  • Corn: $5.50-6.20/bushel (2025 averages) with 15% volatility
  • Soybean meal: $380-420/ton, with import dependency creating price spikes
  • TMR costs: $180-220/cow/month for precision feeding systems

Labor Market Realities:

  • Skilled dairy labor: $18-24/hour with 40% annual turnover
  • Management positions: $65,000-85,000 annually with benefits, 20% shortage
  • Automation impact: 75% labor reduction in milking, but requires $50,000 annual technical support

European Union Specifications

Regulatory Cost Compliance (verified through industry sources):

  • Environmental compliance: €15,000-25,000 per farm annually
  • Animal welfare standards: €8,000-12,000 implementation costs per 100 cows
  • Nitrate regulations: 20% reduction requirements increasing feed costs 8-12%

Technology Adoption Rates:

  • Precision feeding: 35% adoption in Netherlands, 15% in Eastern EU
  • Automated milking: 40% market penetration in Denmark, 10% in Southern Europe
  • Carbon tracking: Mandatory by 2027, requiring €5,000-15,000 monitoring systems

Asia-Pacific Market Dynamics

Industry research confirms specific regional challenges:

China’s Import Patterns (2024-2025 verified data):

  • Skim milk powder imports: Declined 36.8% to 178,000 metric tonnes
  • Whole milk powder: Down 12.6% but expected 6% recovery in 2025
  • Infant formula imports: Decreased 14.8% due to demographic shifts

Technology Investment Requirements:

  • Automated systems: $200,000 per robot with 5-7 year payback periods
  • Genomic testing: $40-50 per animal delivering 11:1 ROI on targeted interventions
  • Precision feeding: 25% feed cost reduction requiring $150,000-300,000 initial investment

Technology ROI Verification: The Mathematical Reality

Automated Milking Systems (AMS) Performance Data

Verified industry performance metrics:

Investment Requirements:

  • Initial cost: $200,000 per robot (60-cow capacity)
  • Installation: Additional $30,000-50,000 for facility modifications
  • Annual maintenance: $15,000-20,000, including software updates

Verified Performance Gains:

  • Labor reduction: 75% decrease in milking labor requirements
  • Production increase: 28.5% yield improvement from consistent 2.8x daily milking
  • Quality improvements: 25% reduction in somatic cell count, 15% decrease in mastitis incidence

ROI Calculations (based on verified data):

  • Break-even point: 5.2 years at $22/cwt milk price
  • Annual savings: $45,000 in labor costs, $18,000 in improved production
  • Risk factors: Technology failure costs $5,000-15,000 per incident

Precision Feeding Systems Verification

Investment and Performance Data:

  • System cost: $150,000-300,000 for a 500-cow operation
  • Feed cost reduction: 25% through optimized nutrition delivery
  • Implementation time: 6-12 months, including staff training

Verified Benefits:

  • Feed efficiency improvement: 15-20% better feed conversion ratios
  • Milk component optimization: 8-12% improvement in butterfat/protein ratios
  • Environmental impact: 15-25% reduction in nitrogen emissions

Genomic Testing ROI Verification

Research confirms genomic testing delivers:

Cost-Benefit Analysis:

  • Testing cost: $40-50 per animal
  • Selection accuracy: 60-80% improvement over traditional methods
  • Genetic gain acceleration: 2x faster improvement in desired traits

Verified Returns:

  • 11:1 ROI on targeted breeding interventions
  • $285 additional profit per cow annually through improved genetic merit
  • 25% reduction in generation intervals for genetic improvement

Strategic Response Matrix: Updated Regional Intelligence

Market PositionChina ImpactRegional Cost FactorsStrategic ResponseImplementation Timeline
U.S. Midwest CommodityReduced imports, price pressureFeed: $180-220/cow/month, Labor: $18-24/hourDiversify to Mexico/SEA, efficiency gains12-18 months
EU Premium/OrganicPotential demand growthCompliance: €15,000-25,000/farm annuallyChina-compliant quality systems18-24 months
Oceania Cost LeadersCompetitive advantageLower input costs, established infrastructureCapacity expansion, contract security24-36 months
Regional Niche PlayersLimited direct impactVariable by market, certification costsCost monitoring, premium positioning6-12 months

Market Intelligence: China’s Strategic Implications

The Bullvine’s analysis reveals China’s transformation signals fundamental shifts:

Consumer Trend Verification:

  • Yogurt and probiotic drinks: $40.12 billion market growing at 8.35% annually
  • Premium milk segments: 66% of consumers willing to pay sustainability premiums
  • Functional products: 25-40% premium pricing for specialized dairy items

Technology Investment Reality:

  • Mengniu’s AI platform: First fully intelligent dairy factory with precision analytics
  • Yili’s international expansion: 52% year-over-year growth, focusing on Southeast Asia
  • Sustainability requirements: 30 national-level “green factories” setting global standards

Global Trade Flow Changes: Verified data shows China’s import recovery patterns:

  • 2% overall import growth projected for 2025
  • 6% increase in whole milk powder to 460,000 metric tons
  • Continued decline in skim milk powder as domestic capacity grows

The Bottom Line: Mathematics Versus Mythology

China’s dairy consolidation represents the leading indicator of global industry transformation. Comprehensive research documents how policy, economic, consumer, and technological factors combine to create unsustainable environments for smaller farms while widening competitive gaps.

The implementation barriers are not insurmountable, but they require strategic planning:

  • Financial preparation: 24-36 months of advance planning for technology investments
  • Skills development: Continuous training programs for precision agriculture adoption
  • Market positioning: Clear differentiation strategy before competitive pressure intensifies

Regional cost realities demand location-specific strategies:

  • North American producers: Leverage available financing and extension support systems
  • European operations: Maximize CAP subsidies while preparing for 2027 environmental mandates
  • Developing market farmers: Focus on cooperative models and appropriate-scale technology solutions

Technology ROI verification confirms that operations achieving competitive scale through verified precision systems see $285+ in additional profit per cow annually, but only with proper implementation support and management capability development.

Your strategic window closes rapidly. The verified evidence shows three distinct viable categories emerging: industrial-scale commodity producers achieving competitive costs through verified technology adoption, ultra-premium niche specialists commanding verified 25%+ premiums, and cooperative-backed alliances providing smallholder protection through collective action.

The Final Question: Are you ready to choose your scale strategy based on verified performance data rather than romantic notions? Consolidating evidence from China, the U.S., the EU, and India provides a clear roadmap – but only for those willing to acknowledge that implementation success requires addressing real barriers with practical solutions.

Choose your scale. Analyze the verified mathematics. Commit to evidence-based excellence. The consolidation tsunami waits for no one, but rewards those who position themselves ahead of the wave based on verified industry intelligence and realistic implementation planning.

Ready to evaluate your operation’s strategic positioning? The time for romantic notions about farming is over. The era of mathematical precision and verified implementation strategies has begun.

This analysis is based on verified research from peer-reviewed sources, government agricultural data, and established industry publications. All statistics and claims are traceable to original publication sources and verified as current for 2024-2025 market conditions.

Complete references and supporting documentation are available upon request by contacting the editorial team at editor@thebullvine.com.

Learn More:

  • Breaking the Scale Trap: Why Right-Sizing at 448 Cows Delivers Maximum Profitability – Challenges the “bigger is better” assumption with New Zealand’s 60-year data proving optimal herd size maximizes profit per unit, offering strategic framework for right-sizing decisions before expansion pressures eliminate profitability margins.
  • Robotic Milking Revolution: Why Modern Dairy Farms Are Choosing Automation in 2025 – Demonstrates how AI-enhanced robotic systems deliver $1.75/cwt cost advantages through predictive health monitoring and automated precision, providing implementation roadmap for farms seeking competitive technology adoption without massive scale requirements.
  • Economies of Scale in Dairy – Reveals how Western vs. Eastern U.S. dairy operations achieve cost efficiency through different strategic approaches, showing practical methods for smaller farms to compete through premium positioning and intimate herd management rather than pure volume expansion.

Join the Revolution!

Join over 30,000 successful dairy professionals who rely on Bullvine Weekly for their competitive edge. Delivered directly to your inbox each week, our exclusive industry insights help you make smarter decisions while saving precious hours every week. Never miss critical updates on milk production trends, breakthrough technologies, and profit-boosting strategies that top producers are already implementing. Subscribe now to transform your dairy operation’s efficiency and profitability—your future success is just one click away.

NewsSubscribe
First
Last
Consent

CME Dairy Market Report: June 23rd, 2025 – Cheese Markets Under Siege as Block Prices Tumble

Supply-demand collision accelerates: 7.25¢ cheese drop signals $1.75/cwt Class III pressure. Why waiting on “forecasts” kills margins.

EXECUTIVE SUMMARY: While industry experts chase export dreams and cling to outdated USDA projections, a brutal supply-demand collision is devastating dairy margins in real-time. Our comprehensive CME analysis reveals block cheese has collapsed 7.25¢ in just one week, with trading volume hitting crisis levels—only 5 total trades executed across all commodities. With U.S. milk production surging 1.6% year-over-year and domestic cheese consumption declining 56 million pounds in Q1 2025, the math is unforgiving: income-over-feed costs are projected to plummet below $12/cwt, representing a crushing 20% margin compression. The recently implemented FMMO reforms are amplifying this crisis by directly reducing component values just as market fundamentals deteriorate. Global dairy trade is contracting 0.8% while U.S. production accelerates at the fastest quarterly pace since 2021—a perfect storm that renders traditional supply-absorption strategies obsolete. Progressive producers implementing immediate DRP coverage and pivoting to component optimization strategies are positioning for survival while volume-focused operations face margin annihilation.

KEY TAKEAWAYS

  • Immediate Risk Management Imperative: Implement DRP coverage for Q3/Q4 production within 48 hours—the cheese market collapse signals potential $1.25-1.75/cwt Class III pressure that could devastate unprotected operations through August 2025.
  • Component Strategy Transformation: Target butterfat levels of 4.50%+ to capture $0.75-$1.50/cwt pricing premiums while cheese-dependent volume producers face direct exposure to the 7.25¢ weekly block cheese decline and institutional liquidation.
  • Feed Procurement Optimization: Forward contract 60-70% of feed needs while corn remains below $4.60/bushel—projected record 15.58 billion bushel production offers rare input cost relief amid the margin compression crisis.
  • Revenue Diversification Priority: Leverage beef-on-dairy opportunities with historically high cattle futures providing crucial income stability as traditional milk check reliability evaporates under supply-demand fundamental breakdown.
  • Market Intelligence Reality Check: Abandon reliance on lagging USDA forecasts that missed the fundamental demand destruction—trading activity at March 2025 crisis levels with bid-ask spreads widening to 5-year extremes signals institutional market abandonment requiring immediate defensive positioning.
dairy market analysis, CME dairy prices, dairy risk management, Class III milk prices, dairy profitability strategies

Market reality check: Today’s 1.50¢ drop in block cheese signals continued fundamental weakness, while butter’s modest 2.50¢ gain provides little relief for overall milk checks. The supply-demand collision we’ve been tracking is accelerating, demanding immediate risk management action from producers.

Today’s Price Action & Farm Impact

ProductPriceDaily ChangeWeekly TrendImpact on Farmers
Cheese Blocks$1.6500/lb-1.50¢-7.25¢Class III pressure intensifying
Cheese Barrels$1.6575/lbNo Change-7.94¢Weak demand signals persist
Butter$2.5250/lb+2.50¢-2.44¢Limited Class IV support
NDM Grade A$1.2600/lbNo Change-0.88¢Export demand is steady but fragile
Dry Whey$0.5700/lbNo Change+1.56¢Protein markets holding

Enhanced Trading Activity Analysis

Critical Market Signals from the Trading Floor:

Bid-Ask Spread Analysis:

  • Cheese Blocks: 7 bids vs three offers – buyers stepping aside amid price uncertainty
  • Butter: Strong interest with eight bids vs four offers, indicating underlying support
  • Cheese Barrels: Minimal interest (5 bids, one offer) reflecting demand destruction
  • NDM: No bids or offers – market participants awaiting direction
  • Dry Whey: Balanced activity (2 bids, two offers) showing stable protein demand

Volume Breakdown:

  • Total daily volume: Only five trades across all commodities – extremely light activity
  • Butter led with three trades, and cheese blocks managed two trades
  • Zero trading in barrels, NDM, and whey indicates market paralysis in key sectors

Historical Context: Current trading volumes represent the lowest daily activity since March 2025, when block cheese hit similar technical support levels at $1.72/lb. The bid-ask spreads have widened significantly compared to the 5-year average, indicating heightened uncertainty among market participants.

Market Sentiment & Industry Voice

Current Market Pulse: The dairy trading community exhibits extreme caution, with institutional buyers notably absent from the market. According to comprehensive market analysis, retail cheese buyers have reportedly “gone dark,” awaiting further price declines before making new purchases.

Risk Management Urgency: Dairy risk management consultants emphasize immediate action, with explicit advice to “implement DRP coverage for Q3/Q4 production within 48 hours”. This unprecedented urgency reflects the rapid deterioration in market fundamentals.

Export Market Concerns: While Mexican buyers previously provided strong support for U.S. dairy exports, recent reports indicate they are “becoming more selective on pricing”, suggesting a broader weakening in export demand that has traditionally absorbed excess domestic production.

Feed Cost & Margin Analysis

Current Feed Situation:

  • Corn (July): $4.185/bushel – favorable for dairy operations
  • Soybean Meal (July): $282.30/ton – manageable protein costs
  • Milk-to-Feed Ratio: Under severe compression following the cheese price collapse

Historical Perspective: Current corn prices represent a 37% decline from 2023 highs of $6.54/bushel, providing significant input cost relief. However, USDA projections for a record 2025 corn production of 15.58 billion bushels suggest continued downward pressure on feed costs.

Margin Reality Check: Despite projected lower feed costs, income-over-feed costs are projected to drop below $12/cwt from March through August 2025, representing a significant 20% margin compression for many operations.

Production & Supply Insights

Supply Surge Confirmed: U.S. milk production reached 19.9 billion pounds in May 2025, up 1.6% year-over-year, with the national dairy herd expanding to 9.45 million head. This represents the addition of 114,000 head compared to May 2024.

Regional Production Impacts:

  • Upper Midwest: Comfortable temperatures maintaining steady output, though NOAA data indicates temperatures 3-5°F above normal could lead to 8-12% production losses
  • Southwest: Already experiencing 90°F+ temperatures, negatively impacting milk output and components
  • California: Production steady despite heat concerns, but recovering from HPAI impacts that affected late 2024 performance

Critical Supply Projection: RaboResearch forecasts a substantial 1.4% production increase for “Big-7” dairy regions in Q3 2025 – the strongest quarterly surge since Q1 2021.

Market Fundamentals Driving Prices

Domestic Demand Crisis:

  • Retail cheese buyers have “gone dark,” awaiting further price declines
  • Domestic cheese consumption declined by 56 million pounds in Q1 2025
  • Weak restaurant traffic continues to dampen overall demand

Export Market Fragility: Despite strong Q1 2025 export performance exceeding $3 billion, momentum is slowing with key concerns:

  • Mexican buyers are becoming more selective on pricing
  • Only 8% of U.S. cheese production was exported in 2024, indicating heavy domestic reliance
  • Global dairy trade projected to contract by 0.8% in 2025

Processing Capacity Surge: New facilities are expected to contribute an additional 360 million pounds of cheese annually by the end of 2025, requiring substantial demand increases to avoid oversupply.

Forward-Looking Analysis & Risk Factors

Class III Futures Alert: June Class III futures at $18.67/cwt appear disconnected from spot market reality. The recent cheese market collapse suggests significant downward pressure on July contracts and beyond.

FMMO Reform Impact: The June 1st Federal Milk Marketing Order reforms are directly impacting prices through increased make allowances and removal of barrel cheese from Class III pricing calculations.

Weather & Seasonal Risks:

  • NOAA forecasts well above-average temperatures across most of the Lower 48 for June 2025
  • Drought conditions are expected to persist in the Pacific Northwest, Northern Plains, and California
  • Above-normal temperatures could trigger 8-12% production losses in key regions

Visual Market Analysis Recommendations

Suggested Chart Enhancements:

  1. Price Volatility Index: 30-day rolling volatility for cheese blocks showing current levels vs historical percentiles
  2. Regional Heat Map: Milk production by state with temperature overlays showing stress factors
  3. Margin Compression Timeline: Income-over-feed costs trending from 2024 highs to projected 2025 lows
  4. Export Dependency Chart: Percentage of production exported by product category with trend lines

Actionable Farmer Insights

Immediate Actions Required:

  1. Risk Management: Implement Dairy Revenue Protection (DRP) coverage for Q3/Q4 production within 48 hours
  2. Component Optimization: Target butterfat levels of 4.50% or higher for $0.75-$1.50/cwt pricing advantage
  3. Beef-on-Dairy: Leverage historically high beef prices through beef-cross programs
  4. Feed Procurement: Forward contract 60-70% of feed needs while corn remains below $4.60/bushel

Strategic Positioning:

  • Diversify processor relationships to reduce export market exposure
  • Focus on milk component production over volume
  • Implement comprehensive feed efficiency programs for $0.75-$1.25/cwt cost reduction

Regional Market Spotlight: Upper Midwest Focus

Wisconsin-Minnesota Production Hub: Current comfortable temperatures have maintained steady milk output and kept components stable, with cream supplies plentiful. However, NOAA data indicates emerging risks with temperatures 3-5°F above normal potentially triggering significant production losses.

Processing Capacity: The region’s processing infrastructure is operating near capacity, with new cheese facilities coming online contributing to the projected 360 million pound annual increase.

Transportation Advantages: Geographic proximity to key markets provides cost advantages, but weakening demand fundamentals erode this benefit.

Industry Intelligence

FMMO Changes in Effect: Major reforms effective June 1st are altering milk pricing dynamics with increased make allowances decreasing component values and removing barrel cheese from Class III calculations.

DMC Program Status: With margins potentially tightening, the Dairy Margin Coverage program’s history of payments in 66% of months since 2018 makes enrollment crucial.

Global Context: The FAO Dairy Price Index averaged 153.5 points in May 2025, up 21.5% year-over-year, but U.S. markets are rapidly decoupling from global strength.

The Bottom Line

Today’s continued weakness in cheese markets, particularly the 7.25¢ weekly decline in block cheese, confirms our analysis of an accelerating supply-demand collision. The extremely light trading volume (only five total trades) and widening bid-ask spreads signal a market where participants step aside, awaiting clarity on fundamental direction.

Critical Actions:

  • Implement DRP coverage immediately for Q3/Q4 production
  • Optimize for milk components, especially butterfat
  • Forward contract feed needs while prices remain favorable
  • Diversify revenue streams through beef-on-dairy opportunities

The confluence of rising milk production, weakening domestic demand, volatile export markets, and FMMO reform impacts creates a perfect storm requiring proactive risk management. The market’s current paralysis, evidenced by minimal trading activity and the absence of institutional buyers absence, suggests further volatility ahead.

Historical Perspective: Current market conditions mirror the supply-demand imbalances seen in early 2019, when similar production surges coincided with demand destruction, leading to sustained margin compression lasting 18 months.

Complete references and supporting documentation are available upon request by contacting the editorial team at editor@thebullvine.com.

Learn More:

Join the Revolution!

Join over 30,000 successful dairy professionals who rely on Bullvine Weekly for their competitive edge. Delivered directly to your inbox each week, our exclusive industry insights help you make smarter decisions while saving precious hours every week. Never miss critical updates on milk production trends, breakthrough technologies, and profit-boosting strategies that top producers are already implementing. Subscribe now to transform your dairy operation’s efficiency and profitability—your future success is just one click away.

NewsSubscribe
First
Last
Consent

Brace for Impact: Why 2025’s Dairy Price Surge Masks a $780 Billion Industry’s Perfect Storm

Stop chasing herd expansion. Smart farmers optimize components over volume—boosting profits 15% while competitors face the 2025 recalibration.

EXECUTIVE SUMMARY: The dairy industry’s current price euphoria is masking a dangerous supply-demand collision that will blindside unprepared operators by Q4 2025. While Oceania WMP hits $4,300/MT and producers celebrate record milk checks, RaboResearch warns that accelerating supply growth (326.7 million metric tons from Big 7 regions) is about to crash into crumbling consumer confidence (52.2 sentiment index, down 24.5% YoY). The most damaging myth? That bigger operations automatically mean better profits. Smart farmers are already pivoting from volume obsession to component optimization, with butterfat levels hitting a 76-year record of 4.23% nationally and milk solids production jumping 1.65% in March 2025. While 80% of dairy leaders expect volume growth above 3%, the math is brutal: a farm producing 75,000 pounds daily at 4.3% butterfat generates higher returns than one producing 80,000 pounds at 3.8% butterfat. This “recalibration” will separate the strategic operators who prepare now from those still betting on the bull run. Your move: stress-test your operation for milk prices 15-20% below current levels—because that’s exactly where the fundamentals are heading.

KEY TAKEAWAYS

  • Component Revolution Beats Volume Obsession: Farms optimizing butterfat and protein content achieve 12-15% higher income over feed costs compared to expansion-focused operations, with genetic improvements delivering 22.9% protein growth and 28.9% butterfat increases since 2011—making the “more cows, more money” mentality obsolete.
  • Technology Reality Check Saves $250K: Before adding 100 cows at $2,500 each, invest that $250K in genetic improvements and precision feeding to boost butterfat from 3.8% to 4.3%—generating higher returns with zero additional labor, feed costs, or environmental compliance while robotic milking success stories show $1.00-$1.50/cwt profitability gains only under optimal conditions.
  • Trade War Timing Creates Export Vulnerability: Strong Q1 2025 dairy exports occurred before China’s 125% retaliatory tariffs and Canada’s 25% tariffs hit full force—smart operators are diversifying market exposure now while building cash reserves during the current price strength to weather the H2 2025 recalibration.
  • Consumer Confidence Collapse Demands Strategy Shift: With 38% of consumers saying high prices have eroded their finances and affordability concerns surpassing job security worries, dairy companies face the brutal reality that passing higher costs to post-COVID inflation-weary consumers will trigger volume losses—requiring immediate focus on value propositions over premium pricing.
  • Financial Stress-Testing Reveals Survival Strategy: Operations modeling scenarios with milk prices 15-20% below current levels by Q4 2025 can identify critical weaknesses now—high-performing dairies already achieve $3.50/cwt advantage in income over feed costs through systematic resource optimization rather than scale expansion, positioning them for the coming market adjustment.
dairy market outlook, milk price forecast, component optimization, dairy profitability strategies, global dairy trends

The global dairy market’s current strength is a dangerous mirage. While commodity prices hit multi-year highs, accelerating supply growth is about to collide with crumbling consumer confidence and escalating trade wars. Smart operators who recognize this paradox and pivot their strategies now will survive the “recalibration” that’s coming – those who don’t risk getting crushed when fundamentals reassert themselves in H2 2025.

You’re probably feeling pretty good about dairy right now. Oceania whole milk powder just smashed through $4,300 per metric ton for the first time since April 2022. Fonterra’s announcing record forecast prices of NZD 10/kgMS for 2025/26. The U.S. dairy industry just flexed its economic muscle with a staggering $780 billion impact supporting over 3 million jobs.

But here’s the uncomfortable truth that’s about to blindside unprepared operators: this party’s built on quicksand.

Why Are Smart Money Managers Already Hedging Their Bets?

Here’s a question that should keep you awake tonight: If prices are so strong, why is RaboResearch warning about “downside risks emerging in the second half of the year”?

The numbers tell a story that most operators aren’t hearing over the sound of strong milk checks. RaboResearch’s latest Global Dairy Quarterly reveals a fundamental paradox that should keep every strategic planner awake at night.

Milk production across the “Big 7” exporting regions grew a modest 0.5% in Q1 2025. Sounds manageable, right? Dead wrong.

That growth is about to explode. Production will accelerate to 1.1% in Q2 and 1.4% in Q3 – the strongest quarterly increase since early 2021. We’re looking at 326.7 million metric tons of milk production from the Big 7 in 2025, representing the highest annual volume gain since 2020.

Meanwhile, consumer sentiment is cratering. The University of Michigan’s Consumer Sentiment Index hit just 52.2 in May 2025 – a brutal 24.5% decrease year-over-year from 69.1 in May 2024. About 64% of consumers expect business conditions to worsen in the year ahead, with 38% saying high prices have eroded their personal finances.

The math is simple but devastating: Accelerating supply + fragile demand = unsustainable prices.

Challenging the Expansion Obsession: Why Bigger Isn’t Always Better

In dairy thinking, let’s challenge a sacred cow: the relentless pursuit of herd expansion and volume growth. While conventional wisdom pushes farmers toward larger operations, recent data suggests this strategy is fundamentally flawed in today’s market reality.

The USDA projects U.S. cow numbers to increase by 20,000 head by year-end 2025, pushing total milk production to 226.9 billion pounds. But here’s what the expansion enthusiasts aren’t telling you: unprecedented genetic gains are making this volume-focused approach obsolete.

According to Hoard’s Dairyman analysis, butterfat levels charged to 4.23% nationally in 2024, breaking through the 4% ceiling and besting a 76-year-old record. With nearly 90% of U.S. milk valued under multiple component pricing, genetic gains in butterfat and protein are pushing milk checks higher than simple volume increases ever could.

The evidence is staggering: Milk solids production increased by 1.65% as of March 2025, demonstrating that smart farmers are already prioritizing components over raw volume. This represents a fundamental shift from the “more cows, more milk, more money” mentality that has dominated dairy thinking for decades.

Consider this scenario: Farm A adds 100 cows at $2,500 each ($250,000 investment) to increase volume by 8%. Farm B invests $250,000 in genetic improvements and precision feeding to boost butterfat from 3.8% to 4.3%. With component premiums, Farm B generates higher returns with zero additional labor, feed costs, or environmental compliance issues.

The University of Wisconsin-Madison’s Center for Dairy Profitability shows that farms focusing on component optimization rather than volume expansion achieve 12-15% higher income over feed costs compared to expansion-focused operations.

What’s Driving This Supply Explosion While Nobody’s Watching?

The United States is leading the charge with a dairy cow inventory that grew by 2,500 head to 9.349 million as of January 2025. But here’s what’s telling: this expansion is happening in the wrong places at the wrong time.

According to Hoard’s Dairyman analysis, April milk production rose 1.5% year-over-year, the largest gain since August 2022, driven by a larger herd and improved yields. This marks a turning point, as 2025 is expected to deliver the first full-year production growth since 2021, with RaboResearch expecting an output gain of 1.4% over 2024.

The European Union is taking a completely different approach. EU milk deliveries are projected to decline 0.2% to 149.4 million metric tons as farmers grapple with declining cow numbers, tight margins, and escalating regulatory costs. But, they prioritize cheese production at the expense of butter, non-fat dry milk, and whole milk powder.

Here’s the kicker: While total global milk volume increases, specific product categories like EU butter and WMP might experience tighter supply. This creates commodity-specific vulnerabilities that most operators aren’t prepared for.

Region2025 Production ForecastStrategy FocusKey Vulnerability
United States+0.5% growthHerd expansion & efficiencyTariff impacts on exports
European Union-0.2% declineCheese prioritizationRegulatory compliance costs
Australia-1.0% declineCost managementWeather & farm exits
China-1.5% declineDomestic consolidationEconomic slowdown

Why Is Consumer Demand Cracking Under Pressure?

While producers ramp up, consumers are tapping out. Mary Ledman from RaboResearch isn’t mincing words about “near-record-low consumer confidence in the US” weighing heavily on demand.

But here’s where conventional dairy marketing completely misses the mark. The University of Michigan data shows that less than half of consumers expect their own incomes to grow in the year ahead, down from nearly 60% six months ago. This represents a fundamental shift in consumer psychology that dairy companies haven’t adequately addressed.

China’s Demand Shift Changes Everything

China’s dairy consumption dropped 5.6% in 2024, with the average person consuming 41.5 kilograms of dairy. But here’s what’s really happening: China’s dairy market contracted to $49.3 billion in 2024, standing approximately at the previous year’s level after hitting a maximum of $51.7 billion in 2022.

This isn’t just a temporary blip. Chinese consumers are fundamentally reshaping their dairy preferences around snacking and fitness trends. According to IndexBox market analysis, consumption of dairy produce decreased by 3.2% to 50 million tons in 2024, marking the first decline after six years of growth.

Rabobank expects China’s net imports of dairy products to rise by a modest 2% in 2025, with most of this increase anticipated in the latter half of the year as domestic stocks weaken. New Zealand continues to dominate China’s total dairy import basket (46% in 2024), followed by the EU (31%).

The Trade War Wild Card

The elephant in the room? Escalating trade tensions that are reshaping global dairy flows in real-time.

China slapped retaliatory tariffs on U.S. agricultural products starting March 10, 2025 – beginning at 10% and rapidly escalating to 125% by April 12. Canada imposed a 25% tariff on approximately CA$30 billion worth of U.S. products, which specifically included $212 million of U.S. dairy products.

The critical timing issue is that the strong U.S. dairy exports we saw through Q1 2025 occurred before these tariffs hit full force. The real impact on export volumes and profitability will show up in Q2 and Q3 data when supply is accelerating.

According to Fortune analysis, America exported about $8.2 billion of dairy products in 2024, the second-highest on record. More than half of U.S. dairy exports are shipped to Mexico, Canada, and China, all of which have been targeted by Trump’s tariff policies.

Disrupting the “Technology Will Save Us” Narrative

Another sacred cow that needs slaughtering is the blind faith that technology automatically equals profitability. While industry publications breathlessly promote every new gadget, the reality is far more nuanced.

Consider the robotic milking revolution everyone’s talking about. Progressive Dairy research shows that robotic systems cost approximately $200,000 per machine, with experts calculating the ideal number of cows at around 500 to economically justify the switch. But the hidden costs include:

  • Staff retraining requirements that can take 6-18 months
  • Technical backup protocols when systems fail (and they will)
  • Integration challenges with existing infrastructure

However, success stories exist when properly implemented. California operations report being $1.00 to $1.50 per hundredweight more profitable with robotic milking systems when all factors are optimized. However, these cases represent carefully selected early adopters with optimal conditions – not the average dairy operation struggling with tight margins and limited technical expertise.

The key insight from Cornell University extension research is that robotic milkers make sense for small- and medium-sized farms primarily because of labor challenges and outdated infrastructure, not because the technology itself guarantees profitability.

How Are Current High Prices Setting Up the Fall?

Dairy commodity prices have surged to multi-year highs, but RaboResearch’s core message is explicit: the “current market strength [is] not sustainable.”

Mary Ledman warns that “dairy companies and downstream multinational consumer packaged goods companies will find it challenging to pass on higher dairy costs to consumers still grappling with post-COVID inflation.”

The “Recalibration” Reality Check

RaboResearch isn’t predicting a crash – they’re forecasting something potentially more dangerous: a “recalibration from recent multiyear highs – a natural correction following a period of strong performance.”

The fundamentals are clear: expanding supply is about to meet uncertain demand while trade tensions create additional volatility. High commodity prices aren’t sustainable when you’re fighting math and consumer psychology.

Supporting this thesis, the USDA has already reduced its milk production estimate for 2025 to 226.2 billion pounds, a decline of 700 million from February projections. The average all milk price is estimated at $21.60 per hundredweight, with the 2026 forecast at $21.15 per cwt.

Are you prepared for milk prices 15-20% below current levels by Q4 2025? Because that’s exactly the scenario smart operators are planning for right now.

Breaking the Commodity Mindset: The Component Revolution

Here’s where we need to fundamentally challenge how dairy farmers think about their business. The obsession with per-cow averages and total volume is a relic from an era when milk was milk. Today’s reality demands a complete strategic overhaul.

According to Hoard’s Dairyman analysis, genetic improvements fuel historic gains in key milk components needed to produce cheese, butter, and specialty dairy foods. Butterfat posted its fourth-straight annual record, charging to 4.23% nationally in 2024.

This isn’t just incremental improvement – it’s a fundamental market transformation. From 2011 to 2023, while milk production grew by just 16.2%, protein jumped by 22.9%, and butterfat catapulted by 28.9%.

The math is compelling: A farm producing 80,000 pounds of milk daily at 3.8% butterfat generates significantly less revenue than a farm producing 75,000 pounds at 4.3% butterfat. The component premiums more than offset the volume difference.

Corey Geiger with CoBank confirms this trend: “In the last three years, milk production that counts the water in it hasn’t been growing, but components have been growing two to three percent a year.”

What Should Strategic Operators Be Doing Right Now?

Smart dairy operators need to prepare for this recalibration now, not after it hits. The convergence of accelerating supply growth, fragile consumer demand, and escalating trade tensions is setting up a correction that could catch unprepared operators off guard.

Optimize for Efficiency, Not Volume

The operators who thrive will be those who focus on efficiency gains rather than volume expansion. With supply accelerating globally, the competitive advantage will go to those who can produce at the lowest cost per unit.

Research from Progressive Dairy shows that high-performing dairies achieve a $3.50 per hundredweight difference in income over feed cost compared to average operations. This gap isn’t about technology – it’s about systematic optimization of existing resources.

Focus on High-Value Milk Components

The 1.65% increase in U.S. milk solids production shows where the smart money is going. Operators should prioritize butterfat and protein content that command premiums in manufactured dairy products.

According to research by the Journal of Dairy Science, genetic improvements in butterfat and protein rank among the most heritable traits for dairy cows. The Council of Dairy Cattle Breeding reports that annual rates of genetic improvement have doubled since 2012 when genomic selection became available.

Diversify Market Exposure

The trade war data shows how quickly export markets can shift. Operators need to reduce dependence on volatile export markets and strengthen direct-to-consumer channels to capture more value.

Strengthen Financial Positioning

With a recalibration coming, operators need stronger balance sheets. This isn’t the time for aggressive expansion financing – it’s the time to build cash reserves and reduce debt exposure.

The Technology Integration Reality Check

Let’s address the elephant in the barn: Most dairy technology implementations fail not because the technology doesn’t work but because farmers approach adoption with unrealistic expectations.

Recent research on dairy management decisions shows that high-performing herds focus on optimal management practices rather than simply adopting the latest technology. A study involving 60 progressive herds nationwide from 2019 to 2024 revealed that management decisions such as voluntary waiting periods and days dry have more impact on productivity than technology alone.

Key success factors include:

  • Phased implementation starting with one system and expanding gradually
  • Staff buy-in through comprehensive training and involvement in selection
  • Data literacy development to actually use the insights technology provides
  • Backup protocols for when systems inevitably fail

The future favors farms that blend innovation with proven practices, not those that chase every technological fad.

Regional Production Strategies Create New Vulnerabilities

This regional divergence creates specific commodity vulnerabilities. EU’s focus on cheese means a tighter supply for butter, NDM, and WMP – even as total milk volume increases globally. Australia’s continued contraction is creating “dairy deserts” in some regions.

The U.S. dairy sector has demonstrated the ability to adjust and maintain competitiveness. According to Hoard’s Dairyman, U.S. cheese exports have outperformed expectations due to lower prices relative to the European Union, making U.S. products more attractive globally. But, this competitive advantage could evaporate quickly if domestic production costs continue rising or if trade barriers expand.

Here’s the critical question: Are you positioning your operation for these regional shifts, or are you still operating under outdated assumptions about global market stability?

Emerging Markets: The Overlooked Wildcard

Here’s where most analysis falls short: The focus on traditional “Big 7” regions ignores the seismic shifts happening in emerging dairy markets that could reshape global trade flows.

India’s dairy sector, while primarily domestic-focused, is experiencing rapid modernization that could impact global ingredient markets. The country’s milk production reached 231 million tons in 2024, making it the world’s largest producer. As Indian operations achieve greater efficiency, their domestic ingredient needs could reduce global demand for certain categories.

Southeast Asian markets are demonstrating explosive growth in premium dairy consumption, driven by rising middle-class incomes and changing dietary preferences. Vietnam’s dairy imports grew 23% in 2024, while Thailand and Indonesia showed similar double-digit growth patterns. These markets represent the future of dairy demand growth – but they’re increasingly sophisticated buyers who demand specific product attributes.

The implications are profound: Traditional commodity-focused strategies may miss the most profitable growth opportunities in emerging markets that prioritize quality, traceability, and specific functional properties over simple volume.

The Bottom Line

Remember that feeling of confidence when you saw Oceania WMP prices hit $4,300 per metric ton? That optimism is exactly what RaboResearch is warning against with their “Too Good to Be True?” assessment.

The current dairy market strength is built on foundations that are rapidly shifting beneath our feet. While commodity prices hit multi-year highs, the convergence of accelerating supply growth (326.7 million metric tons from Big Seven regions), fragile consumer demand (52.2 consumer sentiment index), and escalating trade tensions (125% Chinese tariffs) is setting up a “recalibration” that could catch unprepared operators off guard.

The warning signs are flashing bright red: consumer confidence is weak, supply is accelerating, and trade wars are reshaping global flows. This isn’t the time for aggressive expansion – it’s the time for strategic positioning.

The smart money isn’t betting on continued price strength – it’s preparing for the correction that’s coming. Those who recognize this paradox and adjust their strategies accordingly will emerge stronger when the dust settles.

Your immediate action plan:

  1. Run the numbers: Pull up your operation’s Q3 and Q4 2025 financial projections. Model scenarios with milk prices 15-20% below current levels. If those numbers make you uncomfortable, you know exactly what needs to change.
  2. Optimize components over volume: Shift breeding and management focus toward butterfat and protein optimization. The genetic tools exist – use them.
  3. Stress-test your cash flow: Build reserves now while prices are strong. The recalibration will reward those with financial flexibility.
  4. Diversify market exposure: Reduce dependence on volatile export markets. Strengthen local and regional relationships.
  5. Technology reality check: Evaluate tech investments based on actual ROI, not marketing promises. Focus on tools that enhance decision-making, not replace human judgment.

The dairy industry’s $780 billion economic engine will keep running – but only the operators who prepare for turbulence ahead will maintain their position when the market finds its new equilibrium.

The choice is yours: Continue riding the current wave of optimism, or position yourself for the inevitable recalibration. History shows that the farmers who survive market corrections are those who prepare while others celebrate.

Are you positioning for the recalibration, or are you still betting on the bull run?

Learn More:

Join the Revolution!

Join over 30,000 successful dairy professionals who rely on Bullvine Weekly for their competitive edge. Delivered directly to your inbox each week, our exclusive industry insights help you make smarter decisions while saving precious hours every week. Never miss critical updates on milk production trends, breakthrough technologies, and profit-boosting strategies that top producers are already implementing. Subscribe now to transform your dairy operation’s efficiency and profitability—your future success is just one click away.

NewsSubscribe
First
Last
Consent

Elite Genomic Young Bulls Deliver Breakthrough Genetic Merit in June 2025 TPI Rankings

SUMMARY: Forget everything you thought you knew about the genetic ceiling for Holstein breeding—June 2025’s genomic young bulls just shattered every assumption with GTPI values exceeding 3600. The leading bull achieved an unprecedented 3612 GTPI while simultaneously delivering exceptional feed efficiency (428 FE), proving that the traditional trade-off between production and efficiency is officially dead. Elite performers like HO840003305138681 are rewriting the rules by combining #2 overall genetic merit with industry-leading feed conversion, potentially saving operations $200+ per cow annually in feed costs. Meanwhile, health trait integration has reached new sophistication with bulls like HO840003291672639 simultaneously delivering 2.51 SCS (elite mastitis resistance), 7.1 productive life, and 11.0 heifer conception rate—a trifecta that could reduce veterinary costs by 15-25% while extending herd life. These aren’t just numbers on paper; they’re genetic packages that could transform your operation’s profitability within two lactations. The genomic revolution has officially entered its next phase, and progressive breeders who adapt their selection criteria now will dominate the competitive landscape. Time to audit your current AI lineup—are you still breeding with yesterday’s genetics while your competitors access tomorrow’s profit potential?

genomic bull rankings, dairy breeding genetics, feed efficiency improvement, Holstein TPI rankings, dairy profitability strategies

The June 2025 High Ranking TPI® Genomic Young Bulls report reveals unprecedented genetic advancement, with the leading bull HO840003303094181 (Ripcord from   Genosource Eminece 76892-ET) achieving an extraordinary 3612 GTPI – representing a quantum leap in genomic evaluation accuracy and breeding value precision.

Genetic Architecture Analysis Reveals Elite Packages

The tight distribution among elite performers demonstrates the sophistication of current genomic selection protocols. HO840003305138681 (Ripcord x Aurora Sheepster 26094-ET) at 3595 GTPI exemplifies the modern breeder’s ideal – combining exceptional feed conversion efficiency (428 FE) with elite overall merit, suggesting favorable genetic correlations between metabolic efficiency and production traits.

Feed Efficiency Emerges as Game-Changing Selection Criterion

In today’s economic environment, feed efficiency has evolved from peripheral trait to core selection criterion. HO840003305138681‘s remarkable 428 FE score while maintaining #2 overall GTPI position demonstrates successful introgression of efficiency genes without compromising production capacity – a critical breakthrough for sustainable dairy operations.

Elite Feed Efficiency Performers:

  • HO840003305138681: 428 FE (3595 GTPI) – Optimal efficiency/production balance
  • HO840003283227254: 426 FE (3540 GTPI) – Strong alternative for efficiency-focused programs.  He is a Darth Vader son from Genosource Domince 77154-ET
  • HO840003283227243: 424 FE (3491 GTPI) – High efficiency with solid genomic merit.  He is a Darth Vader son from Genosource Eva 77663-ET.

Health Trait Integration Reaches New Sophistication

HO840003291672639 (Mican from Berryridge Elvin 5745-ET) represents a paradigm shift in multi-trait selection, simultaneously delivering:

  • 2.51 SCS – Elite mastitis resistance indicating superior innate immunity
  • 7.1 PL – Exceptional longevity genetics suggesting cellular maintenance mechanisms
  • 11.0 HT – Outstanding heifer fertility, critical for replacement efficiency

This convergence of health traits in a single animal suggests successful pyramiding of quantitative trait loci (QTL) governing disease resistance and reproductive efficiency.

Protein Production Genetics Show Continued Advancement

HO840003305138683 (Ripcord from Farnear Siena 75140-ET ) leads protein production at 79 pounds, while PEN-COL ENGAGE 1400-ET (AltaEngage from Pen-Col Sheepster 6913-ET) delivers 78 pounds protein, demonstrating the Holstein breed’s continued capacity for genetic improvement in economically relevant traits. These levels represent significant advancement over historical breed averages, reflecting decades of genomic selection pressure.

Conformation Excellence Through Genomic Precision

AURORA GOLLEY 1722-ET (Siemers 41988 from Aurora Achieve 25987-ET) exemplifies modern type breeding with 1.95 PTAT and exceptional BWC (2.03), indicating successful integration of structural soundness genes. For udder architecture, PEAK 80838-ET tops UDC rankings at 1.69, while MELON-PATCH HOP GRAYSON-ET delivers superior mobility genetics with 1.54 FLC.

Advanced Breeding Strategies for Progressive Operations

Genomic Stacking Approach:

HO840003291672639  (Mican from Berryridge Elvin 5745-ET) offers breeders the opportunity to simultaneously improve SCS, PL, and fertility – addressing three major economic traits in a single generation, maximizing genetic progress per breeding decision.

Efficiency-First Programs:

HO840003305138681 (Ripcord x Aurora Sheepster 26094-ET)  provides the ideal foundation for operations prioritizing feed conversion while maintaining production capacity – essential for margin optimization in volatile commodity markets.

Structural Integrity Focus:

AURORA GOLLEY 1722-ET (Siemers 41988 from Aurora Achieve 25987-ET) enables correction of structural deficiencies while maintaining production genetics, particularly valuable for herds requiring longevity improvement.

June 2025 High Ranking TPI® Genomic Young Bulls. PDF Excel

April 2025 Production Data Exposes the Strategic Milk Allocation Revolution Reshaping Global Dairy

Stop chasing milk volume—smart processors reward 4.33% butterfat over gallons. Component optimization delivers $120-180 more per cow annually.

EXECUTIVE SUMMARY: The dairy industry’s obsession with raw milk volume costs producers thousands annually, while 92% of US milk payments now reward butterfat and protein over gallons produced. April 2025 production data exposes how processors are surgically allocating constrained supply—cheese production climbed 0.9% to 1.14 billion pounds while butter dropped 1.8% to 182 million pounds, proving strategic resource deployment trumps volume thinking. With national butterfat levels hitting a record 4.33% and protein at 3.29%, genetic gains are pushing component premiums worth $120-180 per cow annually for operations that abandon volume-obsessed strategies. Smart processors treat every pound of milk like precision-fed rations—optimizing allocation based on margin potential rather than historical habits, while volume-focused farms subsidize their competitors’ success. IoT monitoring systems deliver 15-20% productivity gains, and robotic milking enables 2.2 million pounds per worker versus 1.5 million in conventional parlors, but only for operations brave enough to challenge traditional thinking. Global markets prove this shift—US butter exports compete at $2.33/lb versus the EU’s $3.75/lb because component optimization creates export advantages that volume alone cannot match. Your next milk check depends on one critical decision: master component allocation, capture premium pricing, or continue volume thinking while watching profit margins erode to component-optimized competitors.

KEY TAKEAWAYS

  • Genetic Revolution Drives Profit: Butterfat production increased by 30.2% while milk volume grew by only 15.9% from 2011-2024, with genomic testing programs (10+ million tests completed) enabling surgical breeding decisions worth $200+ per cow lifetime through component-focused selection strategies.
  • Technology Pays Immediate Dividends: Precision feeding systems deliver $35,000-$45,000 annual savings with 18% waste reduction, while IoT health monitoring achieves 15-20% productivity gains and 30% health cost reductions for operations implementing component optimization frameworks.
  • Processor Allocation Exposes Market Reality: Italian cheese production surged 1.0% while American cheese managed only 0.2% growth, proving processors make calculated decisions about milk utilization—cheese captures premium allocations while traditional categories lose priority in constrained supply environments.
  • Export Markets Reward Component Leaders: US dairy exports hit $8.2 billion in 2024, with Mexico and Canada representing 40% of volume, but competitive advantages flow to operations producing component-rich products rather than commodity volumes that global markets can source anywhere.
  • Automation Becomes Survival Strategy: Robotic milking systems enable 2.2 million pounds production per full-time worker versus 1.5 million in conventional parlors, with 7-year ROI periods beating 15+ year conventional parlor upgrades while labor shortages make automation essential rather than optional.
component optimization dairy, dairy profitability strategies, precision dairy farming, milk allocation trends, dairy farm ROI

Component-optimized operations capture $120-180 more per cow annually while volume-obsessed farms subsidize their competitors’ success—the April 2025 production data proves 92% of US milk payments now reward butterfat and protein over volume, with genetic gains pushing national averages to record 4.23% butterfat and 3.29% protein levels. Smart processors make surgical decisions about every pound of milk, channeling constrained supply toward cheese production (+0.9% to 1.14 billion pounds) while traditional categories like butter production decline (-1.8% to 182 million pounds), creating unprecedented profit opportunities for farms implementing component optimization strategies. This isn’t just another monthly report—it’s proof that the $8 billion processing investment wave rewards strategic suppliers who understand that component density matters more than raw volume in today’s restructured dairy economy.

Here’s the uncomfortable truth the industry doesn’t want to discuss: we’re still operating under the delusion that volume equals profitability while the smartest processors have already pivoted to component-optimized allocation strategies. The April 2025 data reveals a fundamental shift where total cheese production increased 0.9% to 1.14 billion pounds while butter production declined 1.8% to 182 million pounds, proving that processors are making calculated resource deployment decisions based on margin potential, not volume potential.

But ask yourself this: Are you still measuring success by the pounds of milk leaving your farm, or are you tracking the dollars generated per component unit?

The numbers tell a story that should make every dairy professional reconsider their entire strategic framework. Butterfat production increased by 30.2% from 2011 to 2024, while milk production grew by only 15.9%, creating a component-rich environment that smart processors exploit. Meanwhile, 92% of the nation’s milk is now valued under multiple component pricing (MCP), making component optimization not just beneficial but essential for survival.

Why Component Optimization Has Become the New Currency

Challenging the Volume Obsession: The Industry’s Most Expensive Mistake

Let’s address the elephant in the milking parlor: the dairy industry’s obsession with raw milk volume is costing producers thousands annually. Traditional thinking suggests that more milk equals more money. The latest genetic evaluation data from April 2025 destroys this myth completely.

Holsteins experienced the largest genetic base change in history, with a 45-pound rollback on butterfat—87.5% higher than the 24-pound base change in 2020. This unprecedented genetic progress demonstrates how genomic testing, which has surpassed 10 million tests, with 66% conducted on US cattle, is fundamentally reshaping milk composition toward higher-value components.

Think of it this way: if your operation were a high-performance milking parlor, you wouldn’t waste time on inefficient cow traffic patterns. Similarly, today’s processors have eliminated inefficient milk allocation patterns. Italian cheese production surged 1.0%, while American cheese managed only a 0.2% rise, proving that processors are making surgical decisions about product portfolios based on margin potential, not volume potential.

Why This Matters for Your Operation: Modern dairy economics function like precision feeding systems—it’s not about how much Dry Matter Intake (DMI) you achieve but about optimizing Metabolizable Energy (ME) per pound consumed. With nearly 90% of US milk valued under multiple component pricing, genetic gains in butterfat and protein push milk checks and production higher.

Current market data proves this fundamental shift:

  • American cheese stocks dropped 2% month-over-month to 815 million pounds despite increased production
  • Yogurt production maintained a steady 1.2% growth to 380 million pounds
  • Regular ice cream production fell 1.2% as processors redirected fat to higher-value applications

Consider this harsh reality: are you breeding and feeding for yesterday’s volume-based payment system while your processor has already shifted to component premiums worth $120-180 per cow annually?

Technology Integration: The Scale Advantage Driving Allocation Decisions

Debunking the “Technology is Too Expensive” Myth

Here’s where the industry gets it completely wrong: most operations avoid technology investments, citing cost concerns while missing IoT and analytics opportunities that deliver 15-20% productivity gains and a 30% reduction in health-related costs.

Forward-thinking operations view component optimization as implementing Automated Milking Systems (AMS). It requires an initial investment but delivers compounding returns through improved efficiency. Robotic milking systems cost approximately $200,000 per robot but deliver ROI in just 7 years versus 15+ years for conventional parlor upgrades while enabling 15-20% milk yield increases that translates to an additional 1,500-2,000 pounds per cow annually.

Technology Investment Hierarchy for Component Optimization:

  • IoT Health Monitoring: 15-20% productivity gains, 30% reduction in health costs, 18-24 month payback
  • Precision Feeding Systems: $35,000-$45,000 annual savings potential, 20% reduction in nitrogen/phosphorus waste
  • Robotic Milking: $200,000 per robot, 7-year ROI, 2.2 million pounds milk per full-time worker vs 1.5 million for conventional parlors

Real-World Implementation Case Study: Miltrim Farms implemented 30 box barn milking robots and managed to maintain the same labor force despite adding 1,200 cows, demonstrating the efficiency gains possible with well-implemented automation.

Why This Matters for Your Operation: Precision feeding systems tailor rations using AI, reducing waste by 18%, while farms using IoT see 15-20% higher yields. The dairy industry has achieved a 19% reduction in carbon footprint between 2007 and 2017 while increasing productivity, proving that environmental stewardship and economic performance align when management systems operate at a sufficient scale.

Market Reality Check: Where Every Pound of Milk Goes

The Allocation Winners and Losers: April 2025 Reveals Everything

The April 2025 data exposes allocation decisions that mirror the precision of genetic evaluation systems. Genetic selection for butterfat and protein, which rank among the most heritable traits for dairy cows (20-25% heritability), combined with multiple component pricing placing nearly 90% of milk check value on components, has created surgical resource allocation strategies.

High-Value Allocation Winners:

  • Total cheese production: 1.14 billion pounds (+0.9% YoY) – Like breeding for high component traits
  • Yogurt production: 380 million pounds (+1.2% YoY) – Consistent performers capturing protein premiums
  • Component-rich export products: US butter exports are competitive at $2.33/lb vs EU $3.75/lb

Resource-Constrained Losers:

  • Regular ice cream: 67 million gallons (-1.2% YoY) – Fat diverted to higher-value applications
  • Nonfat dry milk: 160 million pounds (-3.5% YoY) – Commodity products losing priority
  • Butter production: 182 million pounds (-1.8% YoY) – Despite record component levels

The Uncomfortable Question: If your processor reduces allocation to traditional categories while increasing cheese production, what does your current component profile reveal about your strategic positioning?

Economic Impact Analysis: The shift toward value-added products mirrors the economic logic of genomic testing investments. With over 10 million genomic tests completed (66% on US cattle), you invest in genetic information because it enables better breeding decisions worth hundreds of dollars per cow lifetime. Similarly, processors invest in sophisticated allocation systems because optimized component utilization delivers $120-180 additional revenue per cow annually.

Global Market Dynamics: Following the Component Money Trail

Export Opportunities in a Component-Driven World

International markets create opportunities similar to genetic material exports—high-value products command premium pricing regardless of location. US dairy exports reached $8.2 billion in 2024, marking the second-highest level ever, with Mexico and Canada representing more than 40% of US dairy exports at $2.47 billion and $1.14 billion, respectively.

Export Market Component Premiums:

  • Record cheese exports: Premium markets absorbing increased production with competitive US pricing
  • Butter price advantage: US butter at $2.33/lb vs EU $3.75/lb creates export opportunities
  • Specialized dairy ingredients: Growing demand from emerging markets for high-component products

The pattern mirrors genetic material exports—countries with advanced production systems capture disproportionate value in global markets. Central American markets surged, with Costa Rica, Guatemala, and El Salvador all importing record values of US dairy, proving that component-rich products drive profitable export growth.

But here’s the challenge: Are you positioned to capture export premiums through component optimization, or are you stuck in commodity markets with declining margins?

Implementation Strategy: Your Component Optimization Roadmap

Phase 1: Assessment and Baseline (Months 1-2)

Like conducting metabolic profiling during transition periods, start by analyzing your current component production against the national averages of 4.23% butterfat and 3.29% protein. Most operations discover they’re leaving $120-180 per cow annually on the table through suboptimal component focus.

Critical Assessment Questions:

  • What are your current butterfat and protein percentages compared to the record national averages?
  • How much component premium are you receiving versus volume-based pricing?
  • What percentage of your genetic selection focuses on the most heritable traits (butterfat and protein at 20-25% heritability)?

Phase 2: Technology Integration (Months 3-6)

Implement monitoring systems that track component flows, such as IoT health monitoring, which tracks individual cow performance. Farms using IoT technologies achieve 15-20% productivity gains and 30% reduction in health costs, with key metrics including:

  • Daily component yields by cow and pen using precision monitoring
  • Feed conversion efficiency for protein and fat production through AI-driven precision feeding systems
  • Market price signals for different product categories to optimize allocation decisions

Phase 3: Strategic Partnerships (Months 6-12)

Develop processor relationships that reward component optimization, similar to how genomic testing programs reward genetic improvement. Leading operations achieve component premiums worth $0.15-$0.45 per hundredweight through strategic partnerships that recognize superior milk composition.

Why This Matters for Your Operation: Implementation costs for IoT systems typically range from $150-200 per cow plus subscription fees, with payback periods averaging 12-18 months. Like investing in genomic testing technology, the initial cost quickly pays for itself through improved outcomes and premium pricing.

The Labor Crisis: Why Automation Isn’t Optional Anymore

The Reality Behind Rising Costs: Technology as the Solution

Labor shortages represent a structural bottleneck to industry growth and competitiveness, but technology offers concrete solutions. Automated feeding systems save 112 minutes daily on 120-cow operations, while robotic milking systems enable 2.2 million pounds of milk production per full-time worker compared to 1.5 million pounds in conventional parlors.

Automation Success Metrics with Verified ROI:

  • Smart calf sensors: 40% reduction in mortality, detection of illness 48 hours before visible symptoms
  • Robotic milkers: 15-20% milk yield increases, 7-year ROI vs 15+ years for conventional upgrades
  • Precision feeding: $35,000-$45,000 annual savings, 18% reduction in feed waste

Real-World Success Story: Several cooperative extension programs have launched initiatives to make IoT tools available to producers of all sizes, with the University of Wisconsin helping farms with fewer than 100 cows implement simplified genetic management systems, proving that technology adoption scales across operation sizes.

Sustainability and Consumer Demand: The Premium Market Driver

Converting Challenges into Competitive Advantages

Consumer criticism of dairy practices intensifies, but smart operators see opportunities where others see problems. The dairy industry achieved a 19% reduction in carbon footprint between 2007 and 2017 while increasing productivity, proving that environmental stewardship and economic performance align when management systems optimize components rather than chase volume.

Component optimization reduces environmental impact per unit of product while enabling premium positioning. With 92% of milk payments now based on components rather than volume, sustainable component optimization creates multiple value streams: environmental benefits, consumer premiums, and processor partnerships.

Critical Sustainability Metrics:

  • 19% carbon footprint reduction achieved while increasing productivity
  • Component optimization reduces environmental impact per unit of valuable product
  • Premium markets for sustainable practices offset implementation costs while improving margins

The Strategic Question: Are you treating sustainability as a cost center or leveraging it as a profit opportunity through component-focused efficiency gains?

The Bottom Line: Strategic Positioning for the Component-Driven Future

The April 2025 production data isn’t just reporting what happened—it reveals the blueprint for dairy success in an era where genetic gains drive record milk components needed to produce cheese, butter, and various popular dairy foods. With butterfat levels reaching 4.23% nationally and, protein at 3.29%, and 92% of milk valued under multiple component pricing, component optimization has become the fundamental determinant of profitability.

Your Strategic Response Framework:

Immediate Actions (Next 90 Days):

  • Analyze your current component production against the record national averages of 4.23% butterfat and 3.29% protein
  • Evaluate genomic testing programs that have proven successful across 10 million tests, with 66% on US cattle
  • Assess IoT technology gaps that could deliver 15-20% productivity gains and 30% health cost reductions

Medium-Term Investments (6-18 Months):

  • Implement precision feeding systems with potential for $35,000-$45,000 annual savings
  • Develop strategic processor partnerships rewarding component optimization and premium positioning
  • Upgrade genetic selection programs focusing on the most heritable traits (butterfat and protein at 20-25% heritability)

Long-Term Positioning (2-5 Years):

  • Build automation capabilities that justify robotic milking systems with 7-year ROI and 15-20% yield increases
  • Develop export market positioning for component-rich products, capturing record global demand
  • Create integrated systems combining genetics, nutrition, and technology for $120-180 additional revenue per cow annually

Why This Matters for Your Operation: Operations that emerge stronger from current supply constraints will be positioned to dominate when supply eventually loosens. The April 2025 genetic evaluations marked the 11th base change, with Holsteins experiencing the largest genetic base change in history—proof that genetic progress continues accelerating.

The harsh reality check: Most dairy operations will continue chasing volume while losing market share to component-optimized competitors. With butterfat production increasing 30.2% while milk production grew only 15.9% from 2011-2024, the choice is simple: master component allocation and capture premium pricing or continue thinking in volume terms while watching profit margins erode.

Like the difference between breeding for milk volume versus lifetime profitability through superior components, the decision you make today determines your competitive position for the next decade.

The most successful dairy operations in 2025 aren’t just producing milk—they’re producing precisely the right components for the highest-value applications. With 92% of your milk check determined by component values rather than volume, your next payment depends on which category you choose.

Here’s your final question: Are you ready to abandon volume-obsessed thinking and join the component optimization revolution proven by genetic gains and market premiums, or will you continue subsidizing competitors who’ve already made the transition to component-focused profitability?

The April 2025 data provides the roadmap. Your response determines your future.

Learn More:

Join the Revolution!

Join over 30,000 successful dairy professionals who rely on Bullvine Weekly for their competitive edge. Delivered directly to your inbox each week, our exclusive industry insights help you make smarter decisions while saving precious hours every week. Never miss critical updates on milk production trends, breakthrough technologies, and profit-boosting strategies that top producers are already implementing. Subscribe now to transform your dairy operation’s efficiency and profitability—your future success is just one click away.

NewsSubscribe
First
Last
Consent

Revolutionizing Dairy Exports: How Ukraine’s Processing Pivot Delivers 270% Growth While Raw Commodities Crash

Stop chasing milk efficiency metrics. Ukraine’s 270% processing growth proves value-added beats raw commodities every time. Your survival depends on it.

EXECUTIVE SUMMARY: The dairy industry’s obsession with “efficiency” measured by cost per hundredweight is killing farm profitability—Ukraine’s forced agricultural transformation just proved it. While commodity-focused operations hemorrhaged billions when trade restrictions hit, Ukrainian processors achieved 270% growth in meat exports and 14% growth in dairy processing by pivoting to value-added products. Their secret? Processing plants operating at just 65% capacity generated higher margins than “efficient” raw commodity exporters, proving that strategic processing always trumps operational efficiency. With genomic testing now costing just $28 per head—1% of heifer raising costs—and precision technology delivering 5% yield improvements with existing inputs, dairy farmers have zero excuse for remaining trapped in the commodity mindset. Global milk production growth expected in all major regions for the first time since 2020 creates a unique window for smart processors to capture market share while commodity producers face inevitable margin pressure. The choice is crystal clear: evolve toward value-added processing or remain vulnerable to the same market forces that devastated Ukraine’s raw commodity exporters. Stop measuring success by cost per hundredweight and start building processing capabilities that command premium pricing—because tomorrow’s dairy leaders will be those who moved beyond raw commodities toward products that create lasting competitive advantages.

KEY TAKEAWAYS

  • Challenge the Efficiency Myth: Ukrainian data demolishes the cost-per-unit obsession—processors with 8% higher production costs achieved 23% higher net returns through value-added premiums, proving processing resilience beats operational efficiency when commodity prices crash below $16/cwt.
  • Leverage Underutilized Technology: Genomic testing at $28 per head delivers double the reliability of pedigree-based breeding while smart sensors reduce mortality rates by 40% and robotic systems enable 20% yield boosts—yet most operations ignore these proven profit drivers.
  • Capture Processing Premiums Now: With global milk supply growth returning and dairy industry value sales projected to exceed $1 trillion in the next decade, early movers building cheese, specialty dairy, and functional food capabilities position themselves for sustained profitability in increasingly competitive markets.
  • Diversify Beyond Bulk Contracts: Ukraine’s 60 EU-accredited dairy plants survived quota devastation while raw exporters lost billions—dairy farmers shipping bulk milk are playing the same dangerous game as Ukrainian grain farmers who got crushed by trade restrictions.
  • Implement Systematic Risk Management: Technical efficiency improvements can boost yields by 5% with existing inputs, while processing capability reduces commodity price vulnerability—farms focusing on net return per cow rather than cost per hundredweight build resilience against market volatility that destroys commodity-dependent operations.

Ukraine’s forced agricultural transformation from raw commodity exports to value-added processing offers a blueprint every dairy operation needs to study Their strategic pivot away from bulk sales toward processed goods generated 270% growth in meat exports and 14% growth in dairy processing—even during. The lessons for dairy farmers stuck in the commodity trap are crystal clear: process or perish.

The numbers don’t lie. Something remarkable happened when external market forces stripped Ukraine’s preferential EU trade access, forcing them to compete on value rather than volume. Instead of collapsing, their agricultural sector evolved. Fast.

This isn’t just another case study from overseas. It’s a real-time laboratory for what happens when commodity-dependent agricultural operations get forced up the value chain. Dairy farmers worldwide need to pay attention because the same market pressures reshaping Ukrainian agriculture are coming for your operation.

But here’s the uncomfortable question most dairy farmers avoid asking: Are you genuinely prepared for the day when your bulk milk contract becomes as worthless as Ukraine’s raw grain quotas?

Why Raw Milk Is Economic Quicksand (Just Like Ukraine’s Raw Grains)

Ukraine’s agricultural export structure in 2024 tells a familiar story that should make every dairy farmer uncomfortable. Raw materials and low-processed goods accounted for 66.3% of total exports. Sound familiar? It should—because that’s exactly where too many dairy operations still live, shipping bulk milk while someone else captures the processing profits.

Think of it this way: Ukraine shipping raw wheat is like dairy farmers shipping 100 pounds of 4.0% butterfat milk for $16 per hundredweight when they could be making 5.1 pounds of butter worth $3.41 per pound—that’s the difference between commodity pricing and value-added returns.

The commodity trap is real, and Ukraine’s forced exit proves it. Their top export categories included corn ($5 billion), wheat ($3.7 billion), and rapeseed ($1.8 billion)—all raw materials subject to price volatility and protectionist. When the EU’s Autonomous Trade Measures expired on June 5, 2025, Ukraine faced projected revenue losses of €1.5-5 billion annually.

Every dairy farmer needs to understand that raw commodities make you a price taker, not a price maker. Ukraine learned this lesson hard when corn quotas dropped from 4.7 million tonnes to 650,000 tonnes, and wheat quotas plummeted from 6 million tonnes to 1 million tonnes.

But here’s where it gets interesting for dairy operations. While grain farmers faced devastating quota cuts, Ukraine’s dairy processing sector told a different story. They had 60 dairy plants already EU-accredited and ready for international markets. The difference? Value-added processing creates products that compete on quality and branding, not just price.

Why This Matters for Your Operation: Current US dairy industry data shows milk production forecasted to rise in 2025 despite previous contractions, partly due to HPAI impacts in key states like California. But here’s the kicker—the expected number of dairy heifers calving in 2025 reaches its lowest point in over 20 years. This creates a unique window where smart processors can capture market share while commodity producers face margin pressure.

Yet most dairy farmers cling to the false security of bulk milk contracts like Ukraine once clung to EU preferential access. When will you admit that shipping raw milk is just sophisticated sharecropping?

The Processing Transformation That Changes Everything

Ukraine’s Export Strategy until 2030 reads like a playbook for agricultural transformation. Their goal? Reduce raw material exports from 74% to 59% by 2030 while increasing total exports from $51 billion to $77 billion. That’s not just growth—that’s strategic evolution.

The processing infrastructure already exists; it just needs activation. Ukraine’s oilseed processing plants were operating at only 65% capacity. Their agricultural minister emphasized “exploring all ways to utilize our Ukrainian processing plants in order to create additional value and processing products.”

This mirrors opportunities in dairy operations worldwide. Consider this: genomic testing now costs just $28 per head—about 1% of the cost to raise a heifer—yet enables precision selection that can boost net merit dollars by identifying genetically superior animals. How many dairy farms have underutilized genetic potential that could support specialty product development?

Here’s where conventional wisdom gets dangerous. The dairy industry preaches “efficiency through scale,” but Ukraine’s experience proves that processing transformation trumps scale every single time. Small-scale Ukrainian processors increased meat exports by 270% while massive grain operations hemorrhaged billions.

Ukraine’s processing success stories provide concrete examples:

  • Meat and meat product exports grew 270% in 2024
  • Oil, animal fats, and dairy production increased 13-14%
  • Fruit and vegetable processing jumped 27%
  • Bakery products exports rose 24% year-over-year

These aren’t theoretical improvements but measurable results from strategic processing focus. Each category represents agricultural producers who moved beyond raw commodity sales toward value-added products.

Compare this to dairy’s processing reality: Research from the University of Kentucky shows that even with butterfat yields accounting for a greater percentage of milk checks in 2022, a cow producing 77 pounds of milk at 4.0% butterfat generates approximately the same gross income as a cow producing 75 pounds at 4.25% butterfat. The lesson? Don’t chase butterfat percentage at the expense of milk yield—but maximize both through strategic breeding and nutrition management.

But here’s the question that keeps me awake at night: How many dairy farmers are optimizing for the wrong metrics because they’re still thinking like commodity producers?

Technology Integration: The Precision Agriculture Connection

Ukraine’s agricultural transformation integrates advanced technology throughout the value chain. The USAID AGRI-Ukraine program supports the implementation of sustainable farming practices and climate-smart agricultural technologies. This isn’t just about environmental compliance but operational efficiency and market competitiveness.

Technology adoption accelerates processing transformation. Modern agri-tech enhances yields, diversifies crops, and improves overall sector efficiency. For dairy operations, this means precision feeding systems, automated milking technology, and data-driven herd management create foundations for value-added production.

Research shows significant relationships between sires’ estimated breeding values (EBV) for activity, lying time, and feed efficiency. Sires whose daughters were less active, taking fewer steps per day, tended to have daughters that were also more efficient. Bulls whose daughters spent more time lying daily had offspring superior for feed efficiency.

Here’s where the dairy industry’s obsession with “proven” technology becomes self-defeating. While Ukraine embraced experimental agri-tech during wartime, too many dairy farmers wait for “bulletproof” solutions that never come. Innovation requires calculated risks, not paralysis by analysis.

Why This Matters for Your Operation: Precision fermentation and cellular agriculture are emerging as critical technologies for dairy’s future. The dairy industry value sales are projected to balloon to over $1 trillion in the next decade as the sector adopts emerging food technologies. Early adopters who integrate precision technologies now position themselves for future market opportunities.

Implementation Timeline:

  • Year 1: Basic activity monitoring and genomic testing implementation
  • Year 2-3: Advanced milking system integration with data analytics
  • Year 4-5: Processing capability development for specialty products

So, here’s my challenge to you: If Ukrainian farmers can implement cutting-edge agri-tech while dodging missiles, what’s your excuse for sticking with 1990s management practices?

Financial Framework: Making Processing Profitable in Dairy Terms

Ukraine’s financial support structure for agricultural transformation provides a roadmap for understanding processing investment economics. Their 2025 agricultural sector funding specifically targets livestock farming and agro-processing industry development.

Government incentives reduce processing transformation risks. The USDA recently granted .04 million for dairy producers and businesses to spur innovation nationwide. This funding supports business plan development, marketing and branding efforts, and access to new production and processing techniques for value-added products.

But here’s where most dairy farmers miss the boat: they treat government programs like lottery tickets instead of strategic business tools. Ukraine’s approach was systematic—identifying specific processing gaps, targeting investment, and measuring results. American dairy farmers often apply for grants as afterthoughts rather than integral components of business strategy.

Processing sector investment attracts international capital when properly structured. Recent examples include:

  • Pacific Coast Coalition: $690,000 for farmers exploring higher value uses for milk (artisanal cheeses, organic dairy products)
  • University of Tennessee: $3.45 million supporting farmers across 12 states to adopt practices improving financial outcomes
  • Wisconsin Dairy Business Innovation Alliance: $3.45 million for grants and technical assistance expanding market presence

ROI Analysis for Dairy Processing: Studies show that addressing inefficiencies in dairy operations can potentially increase milk yield by 5.00% with the same inputs. Technical efficiency scores in major dairy regions range between 0.65 and 0.99, with an average of 0.95—meaning most operations have room for improvement.

Cost-Benefit Breakdown:

  • Somatic Cell Count Management: Aim for herd scores of 200,000 cells/mL or less. Higher SCC negatively affects milk quality, shelf life, and manufacturing yield.
  • Udder Health Protocols: Pre- and post-dipping, headlocks after milking, and vaccination programs significantly impact technical efficiency and milk yield.
  • Feed Efficiency Optimization: Behavioral monitoring can identify cows with superior feed conversion, enabling precision breeding decisions.

Global Market Dynamics: Learning from International Leaders

EU dairy forecast for 2025 shows milk production dropping while cheese production increases, creating opportunities for efficient processors. Lower milk supply favors cheese production over whole milk powder, with EU27 whole milk powder production forecast to decline 5% from 2024 levels.

US dairy industry trends reveal fewer farms but bigger herds with higher efficiency. The ongoing shift toward larger, specialized farms highlights economies of scale benefits and higher technology adoption rates. This consolidation creates opportunities for mid-sized operations to differentiate through processing specialization.

Here’s the brutal truth most dairy publications won’t tell you: consolidation isn’t inevitable—it’s the result of strategic choices. Ukraine’s small and medium processors thrived by focusing on value-addition while their commodity-focused competitors collapsed. The same principle applies to dairy operations globally.

Key Global Comparisons:

  • New Zealand: BREEDPLAN EBVs effectively predict progeny performance in dairy-beef systems, with relationships between sire EBV and progeny outcomes close to the expected 0.5 units.
  • Europe: Polish dairy sector companies invested PLN 563.9 million (US$141.6 million) despite worsening financial results, showing commitment to technological advancement.
  • Turkey: Research on 791 dairy farms shows technical efficiency improvements through proper udder health management can increase regional milk yield by 5%.

Why This Matters for Your Operation: Global milk supply growth is expected to continue into 2025, with gains anticipated in all major regions for the first time since 2020. Rising farmgate milk prices and favorable feed costs improve dairy farm margins globally, creating ideal conditions for processing investment.

But let’s be honest: when was the last time you analyzed your competitive position against international processors rather than just your neighbor down the road?

Implementation Strategy: From Commodity to Premium Dairy Products

Ukraine’s transformation from commodity exporter to value-added producer offers a systematic approach that dairy operations can adapt:

Phase 1: Genetic and Management Assessment Ukraine identified that processing plants operated at only 65% capacity. For dairy operations, this means evaluating existing infrastructure and genetic potential.

Genomic Testing Implementation:

  • Cost: $28 per head (approximately 1% of heifer raising cost)
  • Reliability: Equivalent to having herd testing data from seven lactations
  • ROI: More than double the reliability compared to breeding values based on pedigree alone

Phase 2: Technology Integration Precision Agriculture Applications:

  • Smart Calf Sensors: CowManager systems detect illness 48 hours before visible symptoms, slashing mortality rates by 40%
  • Robotic Milking Systems: Enable 20% yield boosts through optimized milking schedules and cow comfort
  • Activity Monitoring: Behavioral data correlates with feed efficiency, enabling precision breeding decisions

Here’s where most dairy farmers sabotage their own success: they implement technology piecemeal instead of systematically. Ukraine’s approach integrates multiple technologies simultaneously to achieve compounding benefits. Technology synergy beats individual tool optimization every time.

Phase 3: Market Development Value-Added Product Opportunities:

  • High-Protein Dairy: Dedicated high-protein milks contain up to 15g protein per glass versus 7.7g in whole milk
  • Specialty Cheeses: Artisanal and organic products command premium pricing
  • Functional Dairy: Enhanced with live cultures, vitamins, and minerals

Phase 4: Quality Management Critical Control Points:

  • SCC Management: Target levels below 200,000 cells/mL for optimal processing quality
  • Butterfat Optimization: The current US milk supply averages 4.23% butterfat, yielding 5.1 pounds of butter per 100 pounds of milk
  • Protein Content: Maximize both yield and composition for processing flexibility

Challenging Conventional Wisdom: The Great Efficiency Myth

Here’s a sacred cow (pun intended) that needs slaughtering: the dairy industry’s obsession with “efficiency” as measured by cost per hundredweight. This metric creates a dangerous illusion that keeps farmers trapped in commodity thinking.

The Efficiency Trap Exposed: Ukraine’s experience demolishes the efficiency myth. Their most “efficient” grain operations—those with the lowest cost per ton—were also the most vulnerable to market shocks. Meanwhile, smaller processors with higher unit costs but value-added capabilities thrived.

Consider this scenario: Farm A produces milk at $14/cwt with 85% operational efficiency. Farm B produces milk at $16/cwt with 75% operational efficiency but processes 30% into premium cheese, generating $2.50/lb. Which operation survives when commodity milk prices drop to $13/cwt?

The conventional wisdom says to improve efficiency. The Ukrainian evidence says resilience can be built through value addition.

Evidence-Based Alternative: Instead of obsessing over cost per hundredweight, successful operations focus on net return per cow per year. This metric accounts for processing premiums, market diversification benefits, and risk mitigation value.

Research from the University of Wisconsin shows that farms focusing on value-added production achieve 23% higher net returns despite 8% higher production costs. The difference? Processing premiums and market stability during commodity price volatility.

Risk Management: Learning from Crisis

Ukraine’s experience demonstrates how external shocks can force agricultural transformation. The EU quota restrictions created immediate revenue pressure but also accelerated processing development that might have taken years under normal circumstances.

Crisis accelerates necessary changes. Ukraine’s minister stated that export policy changes “will be driven by cold calculation, as we understand that we will suffer losses if the trade regime changes.”

Why This Matters for Your Operation: Class III prices often surpass $19 per hundredweight but typically dip below $16 at least once yearly. For operations with breakeven points above $16, protective measures become essential. Hedging is not gambling—hedging is when we take risk away.

But here’s the uncomfortable truth: most dairy farmers treat risk management like insurance—something you buy reluctantly and hope never to use. Ukraine’s success came from viewing risk management as a competitive advantage creation.

Risk Mitigation Strategies:

  • Diversified Revenue Streams: Processing capability reduces dependence on commodity pricing
  • Technology Investment: Automated systems provide operational resilience during labor shortages
  • Market Intelligence: Data analytics enable proactive management decisions
  • Financial Planning: Dairy Revenue Protection (DRP) tools safeguard against price volatility

Here’s the question that separates survivors from casualties: Are you managing your operation for best-case scenarios or worst-case realities?

Global Implications: The Processing Revolution

Ukraine’s agricultural transformation reflects broader global trends toward value-added agriculture. The shift from raw commodity exports to processed goods represents a fundamental change in how agricultural operations create and capture value.

Value-added agriculture expands customer bases and increases producer revenue shares. Processing wheat into flour, manufacturing strawberries into jam, or transforming milk into cheese creates additional value that producers can capture.

Emerging Technology Integration:

  • Precision Fermentation: Uses microorganisms to develop ingredients resembling animal products
  • Cellular Agriculture: Makes animal-based foods using cell cultures instead of traditional methods
  • Molecular Farming: Plant-cell fermentation for specialized compounds

Investment Trends: Alternative dairy investment plummeted from $595 million in 2021 to $42.7 million in 2023 but rebounded to $114 million in 2024, driven by corporate investors highlighting innovation interest.

This creates a unique opportunity window: while venture capital focuses on alternative proteins, traditional dairy processors can capture market share through innovation without facing the same investment competition.

The Bottom Line

Ukraine’s forced evolution from raw commodity exporter to value-added processor offers critical lessons for dairy operations worldwide. Their 270% growth in meat exports and 14% increase in dairy processing—achieved during wartime conditions—proves that strategic processing focus delivers measurable results.

The commodity trap is real, and escape requires systematic action. Raw materials make you vulnerable to price volatility and protectionist policies. Processing creates differentiated products that compete on quality, branding, and innovation rather than just price.

For dairy farmers, the choice is clear: evolve toward value-added processing or remain vulnerable to commodity market pressures. Current industry data supports this transformation:

  • Milk production growth is expected in all major regions for the first time since 2020
  • Dairy industry value sales are projected to exceed $1 trillion in the next decade
  • Genomic testing costs dropped to $28 per head, enabling precision genetic management
  • Technical efficiency improvements can boost yields by 5% with existing inputs

Implementation Roadmap:

  1. Immediate (0-6 months): Genomic testing implementation, SCC optimization, basic technology adoption
  2. Short-term (6-18 months): Advanced monitoring systems, feed efficiency protocols, quality management enhancement
  3. Medium-term (18-36 months): Processing capability development, specialty product exploration, market diversification
  4. Long-term (3-5 years): Full value-added operation with premium product lines and direct market access

Critical Success Factors:

  • Challenge the efficiency myth: Focus on net return per cow, not cost per hundredweight
  • Embrace calculated technology risks: Early adoption creates competitive advantages
  • Build processing capabilities systematically: Don’t wait for perfect market conditions
  • Diversify revenue streams proactively: Processing premiums provides stability during commodity volatility

Your Strategic Questions for 2025: Are you optimizing for the right metrics or trapped in commodity thinking? When commodity prices crash next (and they will), will you be the processor capturing margin, or will the commodity supplier get squeezed? If Ukrainian farmers can revolutionize agricultural exports during a war, what’s your excuse for maintaining status quo operations?

What’s your processing strategy? Because if Ukraine can revolutionize agricultural exports during a war, what’s preventing your operation from capturing value-added profits during peacetime?

The transformation toolkit exists: genomic testing at $28 per head, precision monitoring systems, proven quality protocols, and government support programs providing millions in implementation funding. The question isn’t whether value-added agriculture works—Ukraine’s results prove it does. The question is whether you’ll lead this transformation or watch others capture the processing profits that could be yours.

Start building your processing capability today. Tomorrow’s dairy leaders will be those who moved beyond raw commodities toward the value-added products that command premium pricing and create lasting competitive advantages. With milk supply growth expected globally and new processing capacity coming online, early movers position themselves for sustained profitability in an increasingly competitive marketplace.

The choice is yours. But choose quickly—because while you’re debating, your competitors are already building the processing capabilities that will dominate tomorrow’s dairy markets.

Learn More:

Join the Revolution!

Join over 30,000 successful dairy professionals who rely on Bullvine Weekly for their competitive edge. Delivered directly to your inbox each week, our exclusive industry insights help you make smarter decisions while saving precious hours every week. Never miss critical updates on milk production trends, breakthrough technologies, and profit-boosting strategies that top producers are already implementing. Subscribe now to transform your dairy operation’s efficiency and profitability—your future success is just one click away.

NewsSubscribe
First
Last
Consent

2025 Dairy Market Reality Check: Why Everything You Think You Know About This Year’s Outlook is Wrong

Stop chasing milk volume. Component revolution delivers 1.65% production gains while volume drops 0.35%. Smart farmers capture $8B opportunity.

 2025 dairy market outlook, milk component optimization, dairy profitability strategies, FMMO reforms impact, dairy export opportunities

Here’s the brutal truth: While industry cheerleaders point to modest growth forecasts, they’re missing a seismic shift that’s rewriting the rules of dairy profitability. The component revolution creates winners and losers overnight, policy chaos reshapes margins, and most farmers are still making decisions based on yesterday’s playbook.

The Numbers Game Everyone’s Getting Wrong

Let’s cut through the feel-good industry reports and look at what’s really happening. The U.S. dairy sector is projected to produce 226.9 billion pounds of milk in 2025—a modest 0.5% increase that sounds like business as usual. But here’s what those vanilla forecasts don’t tell you: we’re witnessing the death of volume-based thinking.

While total milk production crawls forward, butterfat production exploded 3.4% year-over-year in the first quarter of 2025. Think about that for a second. Your cows aren’t just making more milk—they’re making fundamentally different milk. The average U.S. butterfat test hit 4.36% in March 2025, up nearly nine basis points from last year. Protein tests climbed to 3.38%.

These aren’t just statistics—they’re profit opportunities most farmers haven’t figured out how to capture.

Despite a 0.35% decline in total milk production year-to-date through March, calculated milk solids production increased 1.65%. Your operation is becoming a component factory, and the old milk check calculations no longer reflect true value.

The Price Forecasting Disaster

Here’s where it gets interesting—and concerning. USDA’s all-milk price forecasts have been all over the map. February projections started at $22.60 per hundredweight and dropped to $21.60 in March, with some analysts citing figures as high as $22.75.

That level of volatility in official forecasts within months? That’s not market analysis—that’s educated guessing in a fundamentally changed environment.

Class III Price Comparison: USDA Forecast Revisions

MonthClass III Forecast ($/cwt)Revision Direction
February 2025$19.10Baseline
March 2025$17.95Down $1.15
April 2025$17.60Down $1.50 from Feb

Source: University of Wisconsin Extension, USDA reports

The problem? These forecasts assume traditional milk composition and processing patterns. What happens when the underlying milk supply has fundamentally different economics? The models break down.

The Policy Earthquake Nobody Prepared For

While farmers debate whether milk will hit $22 or $23, Federal Milk Marketing Order reforms taking effect June 1st are reshaping the entire game.

The return to “higher-of” Class I pricing will put more money in the pool, but updated make allowances for cheese ($0.2519/lb), butter ($0.2272/lb), and nonfat dry milk ($0.2393/lb) will initially lower Class III and IV prices.

Here’s the kicker: These changes create regional winners and losers overnight. Farmers in high Class I utilization areas win. Those in manufacturing regions? You’re about to subsidize everyone else.

But the real earthquake is trade policy uncertainty. Research from the University of Wisconsin shows that 25% retaliatory tariffs could:

  • Reduce all-milk prices by $1.90 per hundredweight
  • Decrease U.S. dairy export values by $22 billion over four years
  • Drop Class III prices by $2.86 per hundredweight

With Mexico, Canada, and China accounting for 40% of U.S. dairy export value, those aren’t just statistics—they’re survival numbers.

The $8 Billion Processing Revolution

Here’s a fact that should change how you think about 2025: The U.S. dairy industry has more than $8 billion in processing infrastructure investment happening right now.

Major Processing Investments Creating Demand

CompanyInvestmentLocationCapacity Impact
Walmart$350 millionTexasNew distribution hub
Fairlife$650 millionNew YorkFluid milk expansion
Chobani$1.2 billionNew YorkYogurt/processing

Source: University of Wisconsin Extension analysis

This isn’t just expansion—it’s demand creation that will compete for your milk. Much of this new capacity focuses on cheese production, increasing Class III utilization and eventually pressuring prices as more products hit the market.

Smart farmers are already positioning themselves as strategic suppliers rather than replaceable inputs.

The Component Revolution Most Are Missing

Forget everything you think you know about milk pricing. Despite overall production declining 0.35% year-to-date, milk solids production jumped 1.65% through March 2025.

The updated FMMO composition factors taking effect December 1st will reward farmers producing milk with 3.3% protein and 6.0% other solids. If you’ve been investing in genetics and nutrition to boost components, you will get paid for it. If you haven’t? You’re financing those who have.

Component Performance Reality Check:

  • 2020 average butterfat: 3.95%
  • 2025 average butterfat: 4.36% (+0.41 percentage points)
  • 2020 average protein: 3.181%
  • 2025 average protein: 3.38% (+0.199 percentage points)

This isn’t a gradual change—it’s a fundamental shift in what your cows produce and how you get paid for it.

Export Markets: The Hidden Opportunity

While everyone worries about domestic policies, U.S. cheese exports are crushing it. January 2025 dairy export values surged 20% year-over-year to a record $714 million, driven by butterfat exports up 41%.

Key Export Performance Indicators:

Product CategoryJanuary 2025 PerformanceDriver
Butter exports+41% year-over-yearPrice competitiveness
Anhydrous milkfat+525% year-over-yearGlobal demand
Total export value$714 million (record)Component focus

Source: University of Wisconsin Extension, USDA trade data

U.S. butter prices in May 2025 were $2.33 per pound compared to EU prices of $3.75 and Oceania at $3.54. That’s not a small edge—it’s a massive competitive advantage.

But here’s the catch: exports of nonfat dry milk dropped 20% in January and 28% in February. The winners are those aligned with component-rich products. The losers are stuck in commodity thinking.

Risk Management in the New Reality

Traditional risk management is failing because it’s built on assumptions that no longer exist. Historical models become dangerous when trade policies can slash prices overnight and component premiums reshape milk values.

What Actually Works:

Dairy Margin Coverage Performance: From 2018-2024, DMC issued payments in 66.7% of months, averaging $1.35/cwt after premiums. That’s solid catastrophic protection, but it won’t capture upside opportunities.

Component-Based Strategy: Instead of hedging milk prices, hedge component values. Lock in fat and protein premiums when markets favor them.

Processor Relationship Management: Your biggest risk isn’t market volatility—it’s being replaceable. Processors with expanding capacity need reliable suppliers who deliver consistent quality and components.

Labor Crisis: The Hidden Threat

Labor accounts for 25% of total dairy farm operating costs, and proposed immigration policies that reduce non-U.S. worker availability could increase wage costs by 20% and cause a 10% productivity decline.

Do the math: For operations with $2 million in annual costs, that’s a $100,000 yearly increase plus productivity losses. Research shows this could reduce net farm operating income by $64,482 annually—a 30.9% reduction.

Smart operations already invest in automation, employee retention programs, and cross-training systems.

The Global Chess Game

While U.S. farmers focus domestically, global moves are setting up 2025 opportunities. China’s domestic milk production is forecast to decline 2.6% year-over-year—the second consecutive year of reduced output.

EU cheese prices are up 19% year-over-year in early 2025 as processors prioritize high-value products amid constrained milk supplies. New Zealand production is expected to increase by 1.2%, but U.S. geographic advantages for North American markets remain strong.

The strategic question isn’t whether global markets will grow—it’s whether you’re positioned to capture that growth through the right processor relationships and component optimization.

Why 2025 Separates Winners from Survivors

The conventional wisdom is wrong. 2025 isn’t a stable, moderately profitable year. It’s a pivot point that will separate strategic operators from reactive farmers.

Winners will:

  • Understand milk as a portfolio of components, not a commodity
  • Build processor relationships based on strategic value delivery
  • Invest in genetics and nutrition for component optimization
  • Implement risk management accounting for policy volatility
  • View sustainability as a competitive positioning

Survivors will:

  • Focus on volume over components
  • Compete primarily on cost
  • Rely on outdated risk management tools
  • View policy changes as external threats

The Bottom Line

The dairy industry is transforming faster than most farmers realize. Component economics is replacing volume thinking. Processor relationships are becoming strategic partnerships. Policy volatility is the new normal.

The opportunities are massive for farmers willing to challenge conventional wisdom and implement strategic changes:

Immediate Actions (Next 30 Days):

  • Audit current component production against new FMMO factors
  • Evaluate processor relationships for component premium potential
  • Enroll in appropriate risk management considering policy risks

Strategic Positioning (3-12 Months):

  • Develop component-focused breeding and nutrition programs
  • Build relationships with processors investing in new capacity
  • Implement sustainability practices with immediate ROI

The question isn’t whether the dairy industry will change—it’s whether you’ll lead that change or be forced to follow it.

Your move.

KEY TAKEAWAYS

  • Component Production Surge Creates Profit Opportunities: Milk solids production increased 1.65% while total volume dropped 0.35%, with average butterfat tests reaching 4.36% and protein hitting 3.38%—farmers optimizing genetics and nutrition for components position for FMMO reform premiums starting December 1st
  • $8+ Billion Processing Investment Wave Rewards Strategic Suppliers: Major facilities from Walmart ($350M), Fairlife ($650M), and Chobani ($1.2B) create 55 million pounds daily capacity through 2026, with cheese-focused plants offering component premiums to reliable, high-quality milk producers
  • Export Market Competitive Advantage Through Component Focus: U.S. butter exports jumped 41% and cheese hit record levels in early 2025 due to price competitiveness (U.S. butter $2.33/lb vs. EU $3.75/lb), while nonfat dry milk exports dropped 20-28%—proving component-rich products drive profitable export growth
  • Policy Shock Protection Requires Multi-Layered Risk Management: Potential trade retaliation could slash all-milk prices $1.90/cwt while FMMO reforms initially reduce Class III prices—smart operations combine Dairy Margin Coverage (66.7% payout history), component-based contracting, and processor relationship management beyond traditional hedging
  • Labor Crisis Demands Technology Investment: With labor representing 25% of operating costs and potential 20% wage increases from immigration policy changes, operations investing in automation, cross-training, and retention programs gain sustainable competitive advantages worth $64,482 annually in preserved profitability

EXECUTIVE SUMMARY

The dairy industry’s obsession with milk volume is costing farmers millions while the component revolution reshapes profitability overnight. Despite total milk production declining 0.35% year-to-date, calculated milk solids production surged 1.65% through March 2025, with butterfat tests hitting 4.36%—up nearly nine basis points from last year[1]. While industry cheerleaders point to USDA’s .75/cwt forecasts, they’re missing the + billion processing investment tsunami creating demand for component-rich milk and regional winners overnight[1]. Federal Milk Marketing Order reforms taking effect June 1st will reward farmers producing 3.3% protein and 6.0% other solids, while penalizing volume-focused operations who’ll subsidize those capturing component premiums. Trade policy uncertainty threatens $1.90/cwt price reductions if retaliatory tariffs hit the 40% of U.S. dairy exports going to Mexico, Canada, and China. Progressive farmers who shift from volume thinking to component optimization, build strategic processor relationships, and implement policy-shock risk management will separate themselves from reactive competitors in 2025’s transformed dairy economy.

Learn More:

Join the Revolution!

Join over 30,000 successful dairy professionals who rely on Bullvine Weekly for their competitive edge. Delivered directly to your inbox each week, our exclusive industry insights help you make smarter decisions while saving precious hours every week. Never miss critical updates on milk production trends, breakthrough technologies, and profit-boosting strategies that top producers are already implementing. Subscribe now to transform your dairy operation’s efficiency and profitability—your future success is just one click away.

NewsSubscribe
First
Last
Consent

Beef-Dairy Crossbreds: The Feed Efficiency Revolution Rewriting Dairy Costs

Dairy farms slash $457/head costs via beef-cross breeding: 20% faster growth, 37% methane cuts, and $900+/calf premiums. The feed revolution is here.

EXECUTIVE SUMMARY: Dairy producers are leveraging beef-on-dairy crossbreeding to combat soaring feed costs, with crossbred calves finishing 20% faster than pure Holsteins and delivering $457/head in feed savings. Backed by Texas Tech research and global precedents like the Netherlands’ methane-efficient programs, this strategy boosts sustainability through reduced emissions and unlocks premium pricing via quality carcasses. However, risks like extended Wagyu-cross gestations and genetic diversity loss require balanced breeding via the 60/30/10 rule. With 7.9 million beef semen units sold to dairies in 2024, the approach is reshaping profitability while aligning with climate-smart incentives.

KEY TAKEAWAYS:

  • Feed efficiency pays: Crossbreds cut feed costs by $457/head with 7:1 conversion ratios vs. Holsteins’ 8:1.
  • Global proof: Dutch operations achieve 19.8% lower feed costs; NZ crosses hit 57.8% dressing percentages.
  • Strategic balance: The 60/30/10 rule (60% beef semen, 30% sexed dairy, 10% elite dams) safeguards herd genetics.
  • Sustainability premium: $20/head carbon credits and Prime-grade beef growth (9.6% of production) boost ROI.
  • Mitigate risks: Manage gestational trade-offs and genetic diversity through targeted Limousin/Angus pairings.

The dairy industry’s shift toward beef-on-dairy crossbreeding has unlocked unprecedented feed efficiency gains, slashing costs and reshaping profitability. With 7.9 million beef semen units sold to dairies in 2024 – nearly tripling since 2017 – this strategy is proving a game-changer for producers navigating volatile feed markets. Let’s dissect the verified science driving this transformation.

FEED EFFICIENCY: THE $457/HEAD ADVANTAGE

Beef-on-dairy crossbreds outperform pure Holsteins across key metrics, delivering measurable savings for dairy farms. The numbers tell a compelling story: while Holstein steers typically require 407 days to reach slaughter weight, their beef-cross counterparts finish in just 326 days – a 20% faster timeline, dramatically reducing feed inputs. This accelerated growth translates to improved feed conversion ratios of 7:1 compared to the Holstein standard of 8:1, representing a 12.5% efficiency gain that compounds throughout the feeding period.

The financial impact is substantial. With crossbreds consuming 3,807 fewer pounds of feed per animal, operations save approximately $457 per head at current feed prices of $0.12 per pound. Texas Tech research confirms these advantages, documenting average daily gains of 1.82 kg for crossbreds versus 1.50 kg for Holsteins – a 21% improvement that creates cascading benefits throughout the production cycle.

This efficiency revolution isn’t limited to American operations. The Netherlands’ “Double Dairy Beef” programs demonstrate real-world success, with 38% of dairy births now using beef genetics, focusing mainly on methane-efficient Limousin crosses. Dutch producers report 19.8% lower feed costs per kilogram of beef produced than pure Holstein steers. Similarly, New Zealand’s pasture-based systems achieve 57.8% dressing percentages from Piedmontese x Friesian calves, outperforming native beef breeds by 3.8 percentage points.

COST IMPACT: BEYOND THE FEED BUNK

The economic advantages extend well beyond direct feed savings. Dairy producers implementing crossbreeding strategies report significant labor and overhead reductions. Due to their hardier constitutions, crossbred animals require 5.3 fewer hours per head in health management. This translates to approximately 14% lower veterinary costs from reduced stress-related issues typically plaguing purebred dairy steers.

Sustainability premiums represent another growing revenue stream. Cargill’s RegenConnect program offers $20 per head in carbon credits for qualifying crossbred operations, while research documents a 37% methane reduction per pound of gain compared to pure dairy systems. These environmental benefits create marketable advantages as consumers and retailers increasingly prioritize climate-friendly production methods.

Carcass quality improvements further enhance the value proposition. Beef-dairy crosses demonstrate 24-hour more extended color stability in retail cases, improving shelf life and reducing waste throughout the supply chain. This quality advantage has contributed to the remarkable growth in Prime-grade carcasses, which now constitute 9.6% of U.S. beef production – more than double the 4.4% seen in 2014.

THE COUNTERARGUMENT: FEED EFFICIENCY TRADE-OFFS

Despite these advantages, it’s essential to acknowledge that crossbreds aren’t universally superior to straightbred beef genetics. Purebred beef cattle still demonstrate marginally better feed efficiency metrics when adjusted for mature size. They also produce more consistent carcasses with predictable frame sizes, which can simplify processing and marketing.

Texas Tech research reveals an interesting fact: straight-bred beef calves from dairy dams via IVF technology outperform crossbreds in feed efficiency when adjusted for mature size. This suggests that as reproductive technologies advance, the advantages of crossbreeding may evolve. However, the current economic reality still strongly favors the crossbred approach for most commercial dairy operations seeking to maximize returns on non-replacement animals.

The days-on-feed advantage remains firmly with crossbreds, which typically finish 20% faster than their straightbred counterparts. This accelerated timeline creates operational flexibility and reduces exposure to feed price volatility – critical considerations in today’s uncertain agricultural markets.

BREEDING STRATEGY: THE 60/30/10 RULE

Strategic sire selection maximizes efficiency gains while maintaining herd integrity. Industry leaders recommend allocating 60% of breeding decisions to beef semen, prioritizing Continental breeds like Limousin and Charolais for feed efficiency and red meat yield while incorporating Angus genetics to enhance marbling potential. This approach has demonstrated a 12% higher likelihood of achieving Prime grade at slaughter.

The remaining breeding decisions should be carefully balanced, with 30% dedicated to sexed dairy semen used exclusively on the top genetic merit cows to maintain replacement heifer supplies. Genomic testing helps identify marbling gene carriers and other desirable traits complementing the crossbreeding program. The final 10% should preserve elite Holstein or Jersey cows with superior fertility and milk solids production to safeguard the herd’s genetic foundation.

This balanced approach prevents the common pitfall of over-aggressive crossbreeding, which can lead to replacement heifer shortages and force operations to purchase $3,000+ replacements on the open market. Producers create a self-sustaining system that captures crossbreeding benefits without compromising long-term herd development by maintaining sufficient purebred dairy genetics.

THE SUSTAINABILITY DIVIDEND

Crossbreds deliver substantial environmental benefits that increasingly translate to market premiums. The reduced greenhouse gas emissions from shorter feeding periods represent a quantifiable climate advantage, while lower water usage per pound of beef produced enhances the resource efficiency narrative. These environmental credentials are increasingly valuable as consumers and retailers prioritize sustainability metrics.

The economic upside is equally compelling. Midwest feedlots now pay $900+ premiums for Angus x Holstein calves with ribeye measurements exceeding 14.5 square inches. These premiums reflect the superior performance and carcass characteristics these animals deliver. Additionally, USDA Climate-Smart Commodity grants are increasingly available to operations demonstrating methane-efficient production methods.

The social dimension completes the triple-bottom-line advantage. Dairy’s robust recordkeeping systems provide unparalleled traceability throughout the production chain, addressing growing consumer demands for transparency. The high-touch calf management typical in dairy operations also aligns with welfare expectations, creating a compelling narrative for retailers and consumers.

CRITICAL RISKS TO MITIGATE

Despite the compelling advantages, several risks require careful management. Gestational trade-offs can impact operational efficiency, particularly with certain breeds. While delivering exceptional marbling, Wagyu crosses typically extend pregnancies by 8 days, increasing dam feed costs by $18-22 per gestation. Similarly, premium Continental breed semen costs $12-18 more per straw than conventional options, requiring careful cost-benefit analysis.

Genetic diversity represents another consideration. Over-emphasizing feed efficiency metrics may inadvertently reduce fertility resilience and other valuable traits. This is particularly evident in Jersey-dam crossbreds, which face approximately 14% carcass discounts at slaughter due to their smaller frames and lighter finished weights.

Market consistency challenges also exist. The variable size distribution between crossbreds can complicate feedlot pen uniformity, potentially reducing overall system efficiency. The current market dominance of Holstein x Angus calves limits breed diversity, potentially constraining genetic progress and creating vulnerability to disease or market shifts.

THE BEEF-DAIRY PLAYBOOK

Successful implementation requires a comprehensive approach. Depending on market signals and operation goals, genetic prioritization should focus on Holstein dams with marbling EPDs exceeding +1.0, paired strategically with Limousin sires for yield or Angus for marbling. This targeted approach maximizes the value of each breeding decision.

Feedlot partnerships represent a critical success factor. Forward-thinking dairy operations negotiate $900+ contracts for their crossbred calves by guaranteeing minimum birth weights of 84 pounds, providing complete health records, and avoiding Jersey lineage that might compromise carcass value. These partnerships create predictable revenue streams and reduce market volatility.

Enrollment in sustainability programs completes the strategy. Cargill’s Dairy Beef Accelerator offers premium pricing for operations meeting specific quality and environmental metrics, while Walmart’s Project Gigaton provides carbon credit opportunities for documented methane reductions. These programs transform environmental performance into tangible financial returns.

CONCLUSION: FEED EFFICIENCY MEETS FARMER REALITY

Beef-on-dairy crossbreeding isn’t a trend – it’s necessary for dairy farms facing $8+ per bushel corn and volatile milk markets. The economic case is compelling, with verified savings exceeding $500,000 annually for 1,000-cow operations and growing sustainability premiums. As Texas Tech’s Dr. Dale Woerner notes: “This isn’t better nutrition – it’s metabolic reengineering.”

The path forward requires thoughtful implementation. Producers should consult nutritionists to model breed-specific feed plans that maximize efficiency advantages. Regular audits of replacement need to prevent costly heifer shortages, while proactive engagement with feedlot partners secures premium pricing for crossbred calves. Dairy operations can transform feed efficiency into sustained profitability by balancing these considerations.

The feed efficiency revolution represents a rare win-win in modern agriculture – better environmental outcomes, improved animal performance, and enhanced farm profitability. Strategic crossbreeding offers a proven path to resilience and growth for dairy producers navigating challenging economic conditions.


Download “The Ultimate Dairy Breeders Guide to Beef on Dairy Integration” Now!

Are you eager to discover the benefits of integrating beef genetics into your dairy herd? “The Ultimate Dairy Breeders Guide to Beef on Dairy Integration” is your key to enhancing productivity and profitability.  This guide is explicitly designed for progressive dairy breeders, from choosing the best beef breeds for dairy integration to advanced genetic selection tips. Get practical management practices to elevate your breeding program.  Understand the use of proven beef sires, from selection to offspring performance. Gain actionable insights through expert advice and real-world case studies. Learn about marketing, financial planning, and market assessment to maximize profitability.  Dive into the world of beef-on-dairy integration. Leverage the latest genetic tools and technologies to enhance your livestock quality. By the end of this guide, you’ll make informed decisions, boost farm efficiency, and effectively diversify your business.  Embark on this journey with us and unlock the full potential of your dairy herd with beef-on-dairy integration. Get Started!

Learn more:

Join the Revolution!

Join over 30,000 successful dairy professionals who rely on Bullvine Daily for their competitive edge. Delivered directly to your inbox each week, our exclusive industry insights help you make smarter decisions while saving precious hours every week. Never miss critical updates on milk production trends, breakthrough technologies, and profit-boosting strategies that top producers are already implementing. Subscribe now to transform your dairy operation’s efficiency and profitability—your future success is just one click away.

NewsSubscribe
First
Last
Consent

Northeast Dairy Forecast 2025: Major Market Shifts Ahead as FMMO Changes And Processing Boom Create Rare Growth Window

Northeast dairy is booming with new processing plants, FMMO reforms, and cautious optimism. Learn how producers are balancing growth and challenges.

EXECUTIVE SUMMARY: The Northeast dairy industry 2025 is poised for growth, driven by new processing capacity in New York and Pennsylvania, favorable Federal Milk Marketing Order (FMMO) reforms, and a focus on maximizing milk components per cow. Producers are cautiously optimistic as improved margins from 2024 create expansion opportunities, but rising input costs and political uncertainties temper enthusiasm. New processing facilities in New York and West Virginia create fresh market opportunities, while Pennsylvania sees smaller-scale investments. Producers also closely monitor biosecurity due to the highly pathogenic avian influenza (HPAI) threat. With tight labor shortages and heifer supplies, farmers are focusing on efficiency and strategic planning to navigate 2025’s challenges and capitalize on its opportunities.

KEY TAKEAWAYS

  • FMMO Reforms: Changes taking effect in June 2025 favor Northeast producers due to high Class I utilization, boosting profitability potential.
  • Processing Expansion: New facilities in New York and Pennsylvania create market opportunities, while investments in West Virginia expand regional capacity.
  • Profitability Focus: Increasing milk components per cow remains the most reliable strategy for maximizing farm margins amid rising input costs.
  • Biosecurity Concerns: HPAI remains a looming threat; proactive biosecurity measures are essential to protect herds and maintain production.
  • Strategic Caution: Tight labor markets, limited heifer supplies, and political uncertainties require producers to balance growth with operational efficiency.
Northeast dairy industry, Federal Milk Marketing Order changes, milk processing expansion, dairy profitability strategies, biosecurity in dairy farming

Northeast Dairy stands at a critical crossroads: New milk pricing rules, processing expansion, and disease challenges combine to create unprecedented opportunities and serious threats for forward-thinking producers.

The Northeast dairy landscape is transforming in 2025, with significant policy shifts, processing expansions, and bird flu concerns reshaping the industry’s future. While many New York and Pennsylvania producers are strategically positioning for growth thanks to improved margins, they’re balancing optimism with hardheaded realism as rising input costs and disease concerns demand attention.

For Northeast producers, the coming months bring a potent mix of game-changing opportunities and persistent challenges that demand clear-eyed analysis and decisive action.

JUNE 1 PRICING REVOLUTION: WHY NORTHEAST PRODUCERS STAND TO WIN BIG

Mark your calendars for June 1, 2025 – that’s when the most significant dairy pricing overhaul in decades takes effect across every Federal Milk Marketing Order in the country.

These aren’t minor tweaks but fundamental changes that will reshape regional profitability patterns nationwide. The reforms touch every aspect of FMMO pricing: the surveyed commodity products, Class III and IV formula factors, base Class I Skim Milk Price, and Class I differentials.

Critical implementation detail: while most changes activate on June 1, the new milk composition factors won’t take effect until December 1, 2025. This staggered implementation creates a complex transition period requiring careful financial planning.

What does this mean for your farm? The FMMO amendments include updating skim milk composition factors to 3.3% true protein, 6.0% other solids, and 9.3% nonfat solids, removing 500-pound barrel cheddar cheese prices from pricing calculations, updating manufacturing allowances, and returning to the “higher-of” advanced Class III or IV skim milk prices for determining the base Class I skim milk price.

Northeast Advantage Alert: These changes won’t impact all regions equally. Looking back over the past decade, had these new formulas been in place, the Class III price would have been about 16 cents lower while the Class IV would have been down about 47 cents. With their higher Class I utilization, Northeast producers may fare better than those in regions like the Upper Midwest.

FMMO ChangeImplementation DateImpact on Northeast Producers
Return to “higher-of” Class I pricing formulaJune 1, 2025Potentially positive due to higher Class I utilization in Northeast
Updated manufacturing allowances for Class III and IVJune 1, 2025Class III price approximately 16¢ lower, Class IV approximately 47¢ lower based on historical analysis
Removal of 500-pound barrel cheddar from pricing calculationsJune 1, 2025Potential impact on cheese prices and Class III formula
New skim milk composition factors (3.3% true protein, 6.0% other solids, 9.3% nonfat solids)December 1, 2025Delayed implementation creates transitional period requiring careful planning

MILK PROCESSING CAPACITY EXPLOSION: MDVA’S GAME-CHANGING PENNSYLVANIA MOVE

While Western processors struggle with milk shortages, the Northeast sees the opposite – significant processing investment that creates absolute market security for growth-minded farms.

In a major power play, the Maryland & Virginia Milk Producers Cooperative Association (MDVA) has purchased the HP Hood facility in Northeast Philadelphia. This acquisition isn’t just changing ownership – it’s creating expansion opportunities that will nearly double the facility’s processing capacity from about 12 million gallons to approximately 25 million gallons annually by 2026.

The deal comes with serious financial backing: the commonwealth provided an incentive package totaling $10 million in grants and loans. The package includes $7.25 million through a Pennsylvania Industrial Development Authority loan, $2.5 million in Redevelopment Assistance Capital Program funding, and a $300,000 workforce development grant.

Strategic product focus: The Northeast Philadelphia facility produces coffee creamer, half-and-half, and other extended-shelf-life dairy products. MDVA’s Maola Local Dairies will operate the extended shelf-life ultra-high temperature dairy processing factory, bringing the cooperative’s processing footprint into Pennsylvania for the first time.

“(It’s) been suggested to me that we change that name and add Pennsylvania to it because Pennsylvania is our largest state as far as members are concerned,” noted Jay Bryant, CEO of MDVA. “We have plants in North Carolina, Virginia, and Maryland, and finally having a plant in Pennsylvania is so exciting.”

Beyond this specific acquisition, Kelly Reynolds from Reyncrest Farm confirms the broader processing growth trend: “In our area, milk processing capacity is increasing, and that’s very exciting to see as an operation that would like to grow. New plants are opening, and older plants in our area are taking steps to modernize their facilities. We are very excited about these opportunities.”

Processing FacilityLocationInvestmentCapacity ChangesCompletion Timeline
MDVA (former HP Hood facility)Northeast Philadelphia, PAPart of $10 million incentive packageExpanding from 12 million to 25 million gallons annuallyBy 2026
Various facilitiesNew York and surrounding areasNot specifiedNew plants opening and modernization of existing facilitiesOngoing through 2025

BIRD FLU THREAT INTENSIFIES: TWO VIRAL GENOTYPES NOW HITTING U.S. DAIRY

The Northeast dodged the initial dairy bird flu outbreak, but recent poultry cases in Pennsylvania and New York signal the virus is circling closer. Are you prepared?

The threat of highly pathogenic avian influenza (HPAI) H5N1 continues to loom large over the Northeast agricultural sector. While dairy producers remain vigilant, the poultry industry in the region has already experienced significant impacts. In Pennsylvania, a massive layer farm with nearly 2 million birds was recently affected, along with a broiler facility in Cumberland County housing 30,000 birds.

Viral evolution alert: The virus has demonstrated its ability to mutate and spread across species. In Nevada, two different genotypes of H5N1 have been detected in dairy cattle: the B3.13 genotype found in an earlier December case in Nye County and the D1.1 genotype discovered in the more recent Churchill County cases. This evolution presents a moving target for biosecurity efforts.

According to Nevada officials, the symptoms in cows infected with the D1.1 genotype are similar to those sick with the B3.13 genotype. These typically include sudden decreases in lactation, thicker milk, and reduced feed consumption. This similarity in symptoms makes clinical identification challenging without laboratory confirmation.

Urban outbreak danger: The rapid spread across multiple agricultural sectors highlights the interconnected nature of disease transmission. The virus has been confirmed in New York at two live bird markets, one in Queens County and another in Bronx County. This urban presence creates additional transmission pathways that could affect dairy operations through equipment, vehicles, or personnel moving between facilities.

While Northeast dairy producers haven’t faced widespread outbreaks yet, the experience in other regions demonstrates the importance of implementing comprehensive biosecurity measures immediately. These include limiting farm access, maintaining visitor logs, using protective equipment, and preventing contact between cattle and wild birds, particularly waterfowl.

POLITICAL UNCERTAINTY MEETS FARM REALITY: NAVIGATING 2025’S POLICY MINEFIELD

With a new administration settling in, Northeast Dairy faces complex regulatory questions affecting your bottom line.

The regulatory environment continues to exert a massive influence on Northeast dairy operations. With a new presidential administration taking office, dairy producers are closely monitoring potential policy shifts that could affect their bottom line.

“The current volatility that comes with any new administration and the general uncertainty of a few key areas, such as labor and trade, are a few primary concerns right now,” explains Kelly Reynolds. These uncertainties complicate long-term planning and investment decisions, contributing to many producers’ measured approach despite improved financial positions.

Policy tripwires to watch: Several specific policy areas command particular attention from Northeast dairy farmers. Rebecca Ferry of Dreamroad Jerseys LLC identifies key concerns: “The new farm bill is a great concern, as is immigration reform and the fluctuations in the government employment situations and tariffs.” The pending farm bill negotiations will establish the agricultural policy framework for coming years, directly affecting risk management tools and market support mechanisms.

At the state level, Pennsylvania’s regulatory framework creates unique challenges. “Permitting laws also continue to affect our farms, with Pennsylvania’s permitting laws sometimes hindering the ability of our farms to expand as quickly as in other neighboring states,” notes Jayne Sebright of the Center for Dairy Excellence. Additionally, Pennsylvania continues evaluating potential changes to how milk premiums benefit farms through the Pennsylvania Milk Board.

THE NORTHEAST GROWTH EQUATION: SOLVING FOR MAXIMUM PROFITABILITY

The Northeast dairy sector in early 2025 stands at a genuine inflection point. The question isn’t whether you should grow but how and when.

The processing capacity expansion creates tangible growth opportunities just as FMMO reforms potentially reshape regional price relationships. However, rising input costs, persistent disease threats, and political uncertainties demand strategic caution.

Milk component reality check: While everyone’s obsessing over expansion, the actual profit play might be maximizing components and per-cow production. As Sebright bluntly puts it, this remains “the greatest opportunity for our producers to maximize their profitability.” Before breaking ground on that new barn, ensure you’re squeezing every dollar from the cows you already have.

This is when the wheat gets separated from the chaff in dairy management. The most successful operators will balance opportunistic growth with practical risk management – leveraging new processing capacity and pricing advantages while maintaining strict biosecurity protocols and closely monitoring policy developments.

The critical 2025 decision: Northeast producers face a strategic choice: expand now while processing capacity shows signs of growth, or wait until the full FMMO impact becomes clear. The imaginative play might be phased growth – increasing components and per-cow production immediately while preparing expansion plans for late 2025 after fully implementing both FMMO reforms.

THE BOTTOM LINE: NORTHEAST’S MOMENT OF OPPORTUNITY

The Northeast dairy industry is entering a period of potential competitive advantage after years of challenging margins.

New processing investments, FMMO changes taking effect June 1, and proximity to major population centers create a promising foundation for strategic growth. However, this opportunity window has significant caveats – rising input costs, evolving disease threats, and policy uncertainties that demand careful navigation.

For Northeast dairy producers, 2025 requires threading the needle between capitalizing on market opportunities and managing emerging risks. Those who make this problematic balance look easy – leveraging processing capacity growth and adapting to pricing changes while implementing rigorous cost controls and biosecurity measures – will emerge as the region’s next generation of industry leaders.

The question isn’t whether an opportunity exists in Northeast Dairy – it does. The real question is which operators will seize it most effectively while preparing for the inevitable challenges ahead. As processing capacity expands and pricing structures evolve, the foundation is being laid for a Northeast dairy renaissance that could reshape regional production patterns for years.

Learn more

Join the Revolution!

Join over 30,000 successful dairy professionals who rely on Bullvine Daily for their competitive edge. Delivered directly to your inbox each week, our exclusive industry insights help you make smarter decisions while saving precious hours every week. Never miss critical updates on milk production trends, breakthrough technologies, and profit-boosting strategies that top producers are already implementing. Subscribe now to transform your dairy operation’s efficiency and profitability—your future success is just one click away.

NewsSubscribe
First
Last
Consent

Class IV Dairy Products Surge: Navigating the Industry’s Growing Demand and Production Challenges

Dive into the rise of Class IV dairy products. How are farmers handling increasing demand and production hurdles? Uncover the trends and insights molding the industry.

Summary:

The dairy industry is undergoing significant shifts, with an 11.3% increase in butter production in September, leading to concerns about excess storage as demand falls behind. Manufacturers are anticipating future market changes. Meanwhile, milk powder production remains stable, with a notable 14.3% rise in nonfat dry milk (NDM) favored for local markets. Cheese production reflects changing preferences, driven by strong export demand for Italian varieties like Mozzarella, up 2.7%, while American-style cheeses like Cheddar fell by 2.6% to 311.761 million pounds. In whey, a shift towards higher protein products is evident, with a 22.5% increase in whey protein isolates to 17.11 million pounds, despite a decrease in dry whey for human consumption. These trends highlight evolving consumer preferences and market dynamics in the dairy sector, providing critical insights for stakeholders.

Key Takeaways:

  • Market trends indicate shifting production priorities in response to export demand and regional consumer preferences.
  • Butter production saw a notable 11.3% increase in September compared to last year, driving significant amounts into storage—a potential indicator of production outpacing demand.
  • Milk powder production stabilized, with a minimal year-over-year decline, suggesting a shift in focus towards local and Mexican markets.
  • Overall cheese production remained steady, though a preference for Italian cheeses like Mozzarella grew, while American-style cheese production lagged.
  • The whey stream increasingly favored higher protein products, with whey protein isolates production surging by 22.5% year over year.

The dairy industry’s shifting landscape is gaining momentum with a notable rise in Class IV products, catching the eye of dairy farmers and industry professionals alike. September revealed an uptick in butter and milk powder production, highlighting promising market dynamics. These Class IV products emphasize a growing segment that cannot be overlooked. With butter production up 11.3% over last year, dairy operations are reevaluating strategies to meet evolving market demands. Are these shifts indicating a stable, lucrative market or adding complexity to dairy production? Understanding this trend is crucial for affecting operational decisions and profit margins in the coming months.

Butter Overload: Are We Churning Our Way to a Glut?

The latest data showcases a remarkable upswing in butter production, an increase driven significantly by robust butterfat tests and soaring butter prices throughout September. This surge is not without its concerns. With production climbing to impressive heights, an inevitable question emerges: is production outstripping demand? According to the Dairy Products report, while butter production soared by 11.3%, a substantial volume was relegated to storage, hinting at a possible imbalance. 

This scenario could reflect a production overshoot versus the current market appetite. Elevated butter prices initially spurred churn activity but might not necessarily translate into stable, long-term demand. The storage figures suggest manufacturers are banking on future market needs or price shifts, a strategy not without risk. 

The statistics show that the industry’s ability to calibrate production in real-time with market demands will be tested. Should the market swiftly absorb this backlog, manufacturers might face a glut, potentially impacting pricing strategies and profit margins.

The Powder of Consistency: A New Era for Milk Powder Production

Stability has finally found its footing within the milk powder production landscape, marking a stark contrast to the erratic declines witnessed in recent months. This newfound steadiness reflects a strategic shift by manufacturers zeroing in on nonfat dry milk (NDM) production with keen attention. 

Unlike past fluctuations, September’s milk powder output saw a minor dip of 0.1%, signaling a departure from earlier months where numbers tumbled more significantly. A notable preference emerged for producing NDM, evidently tailored to satisfy the demands of local and Mexican markets—a move echoing broader strategic objectives within the industry. 

With NDM production expanding by 14.3% over the previous year, manufacturers’ inventories swelled to 249.7 million pounds. This increase hints at a readiness to cater to emerging market needs while ensuring readiness should export dynamics shift. 

Such adjustments in production strategy and inventory management reflect a responsive industry poised to leverage regional opportunities while cushioning against potential supply chain disruptions. Companies seem to align operations with consumer preferences, pointing towards a calculated push for stability amidst broader market volatility.

Cheese Choices: The Continental Shift in Cheese Production

Despite the stability in total cheese production, which remained virtually unchanged at 1.16 billion pounds in September relative to the prior year, a noteworthy shift is evident in the cheeses favored by manufacturers. This month, strong export demand has guided the market’s hand, evidenced by a notable preference for Italian cheese varieties. Mozzarella, a local and international popular choice, saw its production rise by an impressive 2.7% year over year. This uptick indicates the robust global appetite for Italian cheese, a trend producers are eager to satisfy. 

Conversely, the production of American-style cheeses paints a different picture. Cheddar, a staple in the American cheese repertoire, experienced a decline of 2.6% compared to the same month last year, falling to 311.761 million pounds. Several factors could be contributing to this downturn. Changes in domestic consumer preferences, possibly opting for more diverse and international cheese varieties, might be one reason. Additionally, the global market’s tilt towards Italian cheeses due to their versatile culinary uses could influence manufacturers to shift their focus. 

The influence of the export market cannot be understated. With U.S. dairy exports reaching broader markets, the demand for cheeses that cater to international tastes, like Mozzarella, is increasing. This aligns with the global proliferation of cuisines that prominently feature these types of cheese, ensuring they remain in high demand. On the other hand, Cheddar, while still popular, may not experience the same level of export-driven growth, particularly in regions where it doesn’t hold the same cultural or culinary prominence.

Whey Forward: The Ascendance of High-Protein Dairy Ingredients

In a notable development reflecting the ever-evolving landscape of dairy derivatives, the whey stream has markedly shifted towards products boasting higher protein concentrations. This realignment is evidenced by the substantial 22.5% year-over-year surge in the production of whey protein isolates, reaching 17.11 million pounds in September 2025. Such growth underscores a burgeoning demand for potent protein ingredients, likely driven by the dietary preferences of health-conscious consumers and the sports nutrition sector’s expanding reach. 

Conversely, this pivot to more concentrated protein offerings parallels a discernible decline in the production of whey protein concentrates, which witnessed a contraction of 9.8%. Moreover, dry whey for human consumption experienced a significant drop of 14% to just 65.18 million pounds. This decrease highlights a gradual phasing out of less refined whey products in favor of those providing more value and superior nutritional properties. 

This shift presents intriguing opportunities for dairy producers. The increased focus on higher protein isolates potentially opens new markets and applications, from dietary supplements to specialized food products catering to diverse consumer needs. As the demand for premium protein ingredients grows, manufacturers must innovate and adapt their processes to harness these lucrative prospects, potentially reshaping the industry’s future dynamic. Could this be a harbinger of a more tailored approach to whey production, prioritizing quality over quantity?

The Bottom Line

The article has unwrapped the dynamics within the Class IV dairy sector, highlighting a juxtaposition of surging butter production alongside steady milk powder output. While high butter output destined more products to storage, it presents the opportunity for dairy producers to capture potential market dips by leveraging stockpiles. Meanwhile, milk powder’s steady course reflects a preference shift with emerging markets near the United States, particularly Mexico, poised to benefit. 

As protein gains traction within the dairy stream, one must weigh the opportunities in higher protein products against traditional cheese outputs, where Italian varieties are currently favored over American styles. 

How might these trends reshape your strategies as a dairy farmer or industry professional? Will you pivot towards products gaining traction or reinforce your current production mix to navigate these shifts? The evolving landscape of Class IV products offers ripe opportunities—but only for those astute enough to seize them. Are you prepared to adapt your operations to align with these emerging patterns and maximize profitability?

Learn more:

Join the Revolution!

Bullvine Daily is your essential e-zine for staying ahead in the dairy industry. With over 30,000 subscribers, we bring you the week’s top news, helping you manage tasks efficiently. Stay informed about milk production, tech adoption, and more, so you can concentrate on your dairy operations. 

NewsSubscribe
First
Last
Consent

Harnessing Precision Technology in Dairy: “Fitbits” for Cows, Evolving Consumer Trends, and Essential Grants for Dairy Producers

See how precision tech like cow “Fitbits” is transforming dairy farming. Dive into changing consumer trends and key grants for dairy producers. Curious? Keep reading.

dairy production Southeast, precision technology dairy, value-added processing dairy, wearable devices cows, dairy profitability strategies, Southeast Dairy Business Innovation Initiative, USDA funding dairy, herd management technology, financial aid dairy producers, agricultural innovation opportunities

Dairy production is experiencing a seismic shift, reshaping the agricultural landscape in ways few could have foreseen. Over the last two decades, the Southeast—particularly Tennessee—has suffered a severe fall in dairy farms. Where there were once hundreds of productive dairies, Tennessee has just 132 throughout all 95 counties, a sobering reminder of the industry’s struggles.

Several reasons contribute to this decrease, including limited resources, poor net income, and a generational transition from agriculture. However, these obstacles provide fresh chances for innovation and progress. The emergence of precision technology, sometimes compared to ‘Fitbits’ for cows, and the introduction of value-added processing open up new opportunities for dairy producers to improve productivity and profitability. These improvements are more than just buzzwords; they represent practical tactics for adapting and thriving in a quickly changing environment.

“From automated milking systems to farmstead dairies producing cheese and yogurt, precision technology and value-added processing are not just options—they are lifelines for the modern dairy farmer.”

In an industry where survival depends on flexibility, adopting these technical and procedural advancements might be the difference between shutting a store and finding new success. As we investigate these new patterns further, we’ll see how they affect the future of dairy farming in the Southeast and beyond.

The Revolution in Herd Management: Precision Technology’s Role 

Precision technology has transformed dairy production, making herd management more efficient and effective. Automated systems, similar to “Fitbits” for cows, represent a crucial advance. These technologies use wearable devices with sensors, such as leg tags, neck collars, and ear tags, to monitor various physiological and behavioral characteristics. But how do these technologies function, and what advantages do they offer to dairy farming?

How These Technologies Work 

At their heart, these cow “Fitbits” collect real-time data on movement, eating habits, rumination, and even physiological changes. For example, a leg tag may measure a cow’s steps, laying time, and overall activity and a neck collar could track feeding and rumination time. This data is wirelessly relayed to a central system and analyzed using sophisticated algorithms. The technology may then alert farmers to any anomalies or trends that can suggest health problems or changes in reproductive status.

Benefits of Precision Technology 

The advantages of implementing these precision technologies are manifold: 

1. Improved Heat Detection 

Heat sensing is crucial in dairy farming for proper breeding control. Automated technologies dramatically improve the accuracy of identifying cow estrus (heat) stages. Studies have shown that employing activity monitors may increase heat detection rates by 20% compared to standard observation techniques. This accuracy improves timing for artificial insemination, improving overall pregnancy rates and breeding program efficiency.

2. Enhanced Health Monitoring 

Wearable technology plays a vital role in health monitoring. It warns early about health concerns such as lameness, mastitis, and metabolic abnormalities. Research shows that early diagnosis by continuous monitoring may minimize the occurrence of severe health issues by up to 30% [Journal of Dairy Science]. This enables quicker intervention, lowers veterinary expenses, and improves animal well-being.

3. Overall Herd Management 

These technologies provide complete herd management by giving extensive information about the herd’s health and production. Farmers may make educated judgments about feeding techniques, housing conditions, and veterinary care using exact data. For example, farmers who used this technology reported a 15% increase in milk output and a 20% decrease in feed expenses due to optimal feeding schedules [nationaldairyboard.com].

The use of precise technology in dairy production represents a big step in modernizing agriculture, making it more sustainable and efficient. While the initial investment may be significant, increased output, lower expenses, and better animal welfare make it an appealing option for progressive dairy producers.

Economic Gains from Precision Technology in Dairy Farming 

Dairy producers may benefit significantly from using precise technologies. Let’s examine how these technologies improve efficiency, lower labor costs, and increase milk output, resulting in a fantastic return on investment (ROI).

Improved efficiency is one of the most obvious benefits. Precision technology, such as automated milking systems (AMS) and wearable health monitors, helps simplify daily operations. Studies have indicated that AMS may improve milking frequency, resulting in an average yearly increase in milk output of 5-20% per cow [source: Journal of Dairy Science]. Furthermore, wearable health monitors enable early diagnosis of diseases, decreasing the need for reactive therapies and saving output losses.

When we look at labor cost reductions, the figures speak for themselves. Automated technologies may significantly decrease the need for human labor. For example, farms that use AMS have claimed labor cost reductions of up to 30% since milking duties are automated, enabling employees to concentrate on more strategic activities [source: National Milk Producers Federation]. Wearable devices like neck collars and leg tags replace hours of manual monitoring, enabling farmers to reallocate manpower to more vital regions.

Another significant economic consequence is increased milk output. Improved health monitoring ensures that cows remain healthy and productive. For example, early diagnosis of heat stress and rapid management may minimize productivity drops, leading to an overall gain in milk supply. Research shows farms adopting heat sensing devices may boost conception rates by 25%, resulting in more regular milk production cycles [source: Journal of Animal Science].

Looking at the possible return on investment (ROI), the initial money needed for these technologies may seem overwhelming. However, the financial rewards accumulated over time often outweigh these expenditures. According to a University of Kentucky research, the ROI with AMS is generally between 5-7 years, with financial advantages resulting from higher milk output and considerable labor cost savings. Similarly, herds that used precision health monitoring systems reported a return on investment within 3-5 years due to increased herd health and output consistency [source: University of Kentucky Cooperative Extension Service].

Adopting precision technology in dairy farming is more than simply keeping up with industry trends; it is a deliberate step toward more sustainable and financially rewarding agricultural techniques. Dairy producers should anticipate notable increases in efficiency, considerable labor cost savings, and a constant rise in milk output due to incorporating these technologies, all of which contribute to a strong ROI.

The Surge in Demand for Local Farmstead Dairy 

Consumer tastes are changing, with a substantial trend toward locally produced farmstead dairy products. This trend is driven by people’s increased need for transparency and quality in purchasing decisions. Today’s dairy customers are more educated and conscientious, motivated by a desire to know where their food comes from and how it is produced. They are committed to helping local companies, which promotes a feeling of community and regional economic progress.

People are becoming more skeptical of mass-produced goods, driving them to rural alternatives that offer freshness and traceability. Transparency in industrial processes appeals to customers who want authenticity. Quality is another motivating element; locally produced dairy often has a better flavor and nutritional profile due to fewer preservation stages and shorter supply networks.

Several farmstead dairy enterprises in Tennessee have capitalized on this market trend with considerable success. Take, for example, Sweetwater Valley Farm. This dairy farm, located in Philadelphia, Tennessee, takes pleasure in producing artisanal cheddars that have earned a dedicated following. Sweetwater Valley’s dedication to quality and sustainability has established it as a fixture in local marketplaces.

Cruze Farm, near Knoxville, Tennessee, is another well-known producer of buttermilk, cream line milk, and soft-serve ice cream. This family-owned business has successfully developed over the years, adding multiple ice cream shops that please residents and visitors. Cruze Farm’s emphasis on traditional dairy farming practices and customer connection has significantly contributed to its popularity and success.

These success stories reflect a more significant trend: customers choose farmstead dairy products with a personal touch and a connection to the land and people who grow them. They are prepared to pay a premium for the peace of mind of knowing their purchases benefit local economies and promote sustainable practices.

Value-Added Processing: Transforming Raw Milk into Market Gold 

Value-added processing converts raw milk into products with increased market value, such as cheese, ice cream, and yogurt. This strategy comprises product differentiation via processing, branding, packaging, and marketing. Value-added processing helps save dairy farms, particularly in declining areas.

Dairy producers may boost their profits by investing in value-added processing. Instead of selling raw milk for a low profit, processed goods might attract higher prices. For example, gourmet cheese and artisanal ice cream are sometimes sold for many times the price of raw milk, significantly increasing the producer’s profits. This added cash may be crucial for small- to medium-sized farms, assisting with sustainability and expansion.

Economic diversity is another significant advantage. Farmers may minimize their reliance on milk sales by selling various goods, including milk and cream, bespoke cheeses, and specialized yogurts. This diversity helps to reduce the risk of fluctuations in milk prices and market demand. For example, a Tennessee farm may diversify by making aged cheddar cheese, which can be preserved and sold as demand grows, maximizing profitability.

Successful instances of value-added goods abound. For example, Sweetwater Valley Farm in Tennessee has established itself as a producer of high-quality cheddar cheeses. Cruze Farm, located in Tennessee, has succeeded by concentrating on grass-fed dairy products, such as ice cream and buttermilk, which appeal to customers looking for natural and locally produced alternatives. These approaches improve the farm’s financial health, foster deeper community relationships, and increase client loyalty.

By adopting value-added processing, dairy farmers can build a robust business model that capitalizes on local demand, taps into specialized markets, and offers a sustainable income, ensuring that their businesses endure for generations.

Securing the Future of Dairy: Financial Aid for Precision Technology and Value-Added Processing 

Navigating the financial environment of precision technology and value-added processing may be difficult, but grants and financial assistance are available. Programs like the Southeast Dairy Business Innovation Initiative (SDBII) and USDA funding help dairy companies modernize and boost profitability.

Southeast Dairy Business Innovation Initiative (SDBII) 

    The SDBII, funded by USDA Agricultural Marketing Services, offers multiple grant opportunities that can be game-changers for dairy businesses. These include: 

  • Precision Technology Grants: Focused on investing in advanced technologies such as robotic milking systems or health monitoring wearables. This grant can help cover initial costs, often the most significant barrier.
  • Farm Infrastructure Improvement Grants: These grants are ideal for upgrades necessary to incorporate precision technologies or enhance production facilities (e.g., improving feed bunk spaces or constructing new barns).

USDA Grants 

    USDA also offers several other grants tailored to dairy producers: 

  • Dairy Business Innovation (DBI) Initiatives: These grants support the development, production, marketing, and distribution of dairy products. They are handy for operations looking into value-added activities like cheese or ice cream production.
  • Value-Added Producer Grants (VAPG): These grants can help producers enter value-added activities, offering planning and working capital to turn raw milk into more profitable products.
  • Environmental Quality Incentives Program (EQIP): This program aims to promote conservation by assisting dairies in implementing more sustainable practices and indirectly supporting high-tech upgrades.

Tips for Applying and Maximizing Benefits 

    Applying for these grants can be competitive and intricate, but with the right approach, you can significantly increase your chances of success: 

  1. Clear Plan: Develop a comprehensive plan detailing using the funds. Be specific about the technologies or processes you wish to adopt and the expected benefits.
  2. Solid Data: Use performance data and market research to support your application. Demonstrating a thorough understanding of your business’s current state and future potential can set your application apart.
  3. Professional Consultation: Consider hiring a grant writer or consultant specializing in agricultural grants. Their expertise can streamline the application process and improve the quality of your submission.
  4. Leverage Networking: Engage with local agricultural extension offices or industry groups. They often provide resources and support to help you navigate the application process.
  5. Follow-up: After submission, ensure your application is in good standing and respond promptly to any requests for additional information.    By taking advantage of these financial supports and strategically navigating the application process, dairy producers can significantly mitigate the costs associated with adopting precision technologies and value-added processing, paving the way for a more efficient, profitable, and sustainable future

Mastering the Challenges of Precision Technology in Dairy Farming 

Adopting precise technology in dairy production is not without challenges. Dairy farmers often face high startup expenses, complex integration challenges, and an urgent need for continued technical help. These difficulties seem formidable, so let’s break them down separately and look for realistic answers.

Initial Costs: A Major Barrier 

Investing in precise technology requires a significant initial financial commitment. This may be a substantial impediment for many dairy producers, particularly those in smaller businesses. However, seeing this as a strategic investment rather than a mere expenditure is critical. Farmers may reduce expenditures by exploring financial assistance sources. The USDA, for example, provides particular funds via programs such as the Dairy Business Innovation Initiative. Leveraging these subsidies may significantly reduce the upfront investment.

Integration Issues: Streamlining Systems 

Integrating new technology into current systems is typically a logistical problem. Different brands and kinds of technology may not interact well with one another, complicating the data integration process. To overcome this, using technologies that are renowned for their compatibility might be useful. Additionally, working with a technology integrator—someone who specializes in bringing disparate systems together—can be a good investment.

Technical Support: An Ongoing Necessity 

Even the most modern technology is only as dependable as its support infrastructure. It is critical to provide enough technical assistance. Before purchasing, look at the service agreements and support mechanisms that come with the technology. It is not just about resolving difficulties when they emerge but also about providing continual training and updates. Peer support may be quite beneficial in this situation. Networking with other dairy farmers using comparable technology lets you share troubleshooting ideas and best practices. Consider joining local or regional dairy groups and precision agriculture-specific internet forums.

Practical Advice: Strategies for Overcoming Challenges 

To overcome these challenges, dairy farmers should adopt a multi-faceted approach: 

  • Leverage Financial Aid: Take advantage of grants and financial aid programs. These can significantly reduce the financial burden of initial costs.
  • Seek Expert Advice: Consult with technology integrators and choose systems known for their interoperability. Partnering with experts can simplify the integration process.
  • Build a Support Network: Cultivate relationships with peers with precision technology experience. Sharing insights and advice can streamline the adoption process.

By strategically navigating these challenges, dairy producers can integrate precision technology, fostering greater efficiency and sustainability in their operations.

Looking Towards Tomorrow: The Future of Dairy Farming 

As we look forward, the future of dairy farming is a landscape complete with opportunities but also fraught with problems. Over the next decade, technology improvements are expected to significantly alter the business, but this will require careful planning and wise investments.

Technological Advancement: The Next Frontier

Incremental developments will continue to play an essential role in improving efficiency. While existing technology like cow “Fitbits” and automated milking systems help with herd management, future advances offer even more control and intelligence. Expect to see improved versions of these devices combined with more advanced software systems. These tools might evaluate more complicated data sets, providing insights beyond our capabilities.

The Role of AI and Machine Learning

Artificial intelligence (AI) and machine learning might be game changers. These technologies can handle massive volumes of data from many sources, resulting in predictive analytics that can identify problems before they occur. AI, for example, may improve feeding plans using real-time data or even identify health issues before they become symptoms. It’s possible that within a few years, we’ll have fully integrated systems that combine data from soil sensors, livestock trackers, and climate monitors to provide actionable insights.

Consumer Trends: Driving the Market.

Consumer behavior will continue to drive change. The desire for local farmstead dairy products is not a fad but a real market trend. Consumers are increasingly choosing items that are viewed as healthier, more ethical, and ecologically beneficial. Dairy farmers may benefit from this by stressing openness and sustainability. Farmstead enterprises, which process and sell milk locally, may fulfill demand while increasing profits.

A Conservative Approach: Balancing Tradition and Innovation.

From a conservative standpoint, balancing using technology and sticking to tried-and-true agricultural techniques is critical. While pursuing the newest breakthroughs is enticing, the emphasis should be on efficient resource usage and sustainable practices. This entails investing in technology with a demonstrable ROI and integrating it in ways that complement, rather than disturb, current operations.

Staying competitive and sustainable

To remain competitive, dairy farmers must broaden their tactics. Precision technologies and value-added processing provide tremendous opportunities. Use available grants and financial help to boost technology adoption and infrastructural upgrades. Participate in community and industry organizations to exchange ideas and learn from others.

To summarize, the future of dairy farming offers continuing innovations that, when intelligently incorporated, may help farms stay competitive and sustainable. Adopt technology wisely, meet customer expectations, and always emphasize sustainable practices.

The Bottom Line

As previously noted, the transformational potential of precise technology and value-added processing in dairy production cannot be emphasized. These instruments boost production and efficiency while providing farmers with valuable herd management and health data. The increase in consumer demand for local farmstead dairy products highlights the significance of diversifying to remain competitive and fulfill market demands.

Adopting these technologies and procedures has problems, including more significant upfront costs, system integration, and ongoing technical assistance. However, with accessible financial help and incentives like those from the Southeast Dairy Business Innovation Initiative, farmers may modernize their businesses without incurring all the financial responsibilities up front.

Finally, adopting these developments is critical for dairy farms’ long-term viability and profitability in a rapidly changing sector. Are you ready to invest in your dairy farm’s future and set the standard for innovation? The decisions you make now will decide your farm’s legacy tomorrow.

Summary:

This article explores how precision technology revolutionizes dairy farming by enhancing heat detection, health monitoring, and overall herd management. Systems like “Fitbits” for cows lead to significant economic gains while addressing the rise in consumer demand for local farmstead dairy products and the importance of value-added processing. It covers the challenges of implementing precision technology, such as high initial costs and the need for technical support, and offers strategies to overcome these hurdles. It also envisions a future driven by AI and machine learning, balancing tradition with innovation to remain competitive and sustainable. Although declining in the Southeast due to limited resources and generational shifts, dairy production in the Southeast finds new opportunities in precision technology and value-added processing, supported by financial aid programs like the SDBII and USDA funding.

Key Takeaways:

  • Precision technology in dairy farming significantly enhances herd management, increasing efficiency and reducing manual labor.
  • Technologies like wearable tags for cows, automated milking systems, and advanced data management improve heat detection, health monitoring, and overall herd management.
  • The economic benefits of precision technology include increased productivity and better resource management.
  • There is a growing consumer demand for local farmstead dairy products, driven by a preference for fresh and locally sourced goods.
  • Value-added processing transforms raw milk into higher-margin products like cheese, ice cream, and yogurt, offering dairy farmers new revenue streams.
  • Grants and financial aid are available to support the adoption of precision technology and value-added processing in dairy farming.
  • Challenges include high initial costs, integration issues, and the need for ongoing technical support, but strategies exist to overcome these obstacles.
  • Future advancements in AI and machine learning are expected to enhance precision technology in dairy farming further.
  • Maintaining a balance between traditional practices and innovative technologies is crucial for sustainability and competitiveness in the market.

Learn more:

Join the Revolution!

Bullvine Daily is your essential e-zine for staying ahead in the dairy industry. With over 30,000 subscribers, we bring you the week’s top news, helping you manage tasks efficiently. Stay informed about milk production, tech adoption, and more, so you can concentrate on your dairy operations. 

NewsSubscribe
First
Last
Consent
Send this to a friend