Archive for component optimization

October 20 Global Dairy Report: $17 Milk Everywhere Except This Wisconsin Farm Getting $28

Why are 14 Wisconsin farms capturing $6,000 extra annually from a group text? The answer changes everything.

EXECUTIVE SUMMARY: We’ve uncovered something that challenges everything you’ve heard about dairy consolidation: Wisconsin farms under 200 cows are capturing $4-6 more per hundredweight than their 2,000-cow neighbors through component optimization, direct marketing, and collaborative networks. Penn State Extension’s latest data confirms farms pushing protein above 3.5% are banking an extra $5,110 annually on just 200 cows—that’s a 4.5:1 return on feed investment. With European butter crashing to €5,820/MT (down 26% year-over-year) and China cutting imports despite their 2.8% production decline, we’re witnessing the biggest market disruption since 2009. But here’s what matters: Central region processing plants running at 95-98% capacity through Q2 2026 means those who adapt now will capture the market share from the projected 2,800 farm exits this year. Cornell’s data shows milk solids production up 1.65% despite declining cow numbers—efficiency alone won’t save you, but strategic pivoting will. The farms thriving at $17 milk aren’t waiting for recovery; they’re creating their own markets, and we’ll show you exactly how.

Monday morning, 6 AM. Coffee’s hot, but the numbers are cold.

European butter prices have plummeted to €5,820 per metric ton—down 26% from last year. Got a text from a buddy milking 180 Holsteins outside Eau Claire: “Can’t make the math work anymore. Not at these prices.”

But here’s where it gets weird…

Ten miles down the road from him, another 180-cow operation is having their best year since 2015. Same milk price. Same feed costs. Guy’s actually thinking about buying another robot. Posted pictures of his new Ram 3500 on Facebook last week.

What the hell’s going on?

Small farms are crushing it—capturing a $4-6/cwt premium over the big herds. This chart lets you SEE why the future favors the bold, not the biggest.

REGIONAL BREAKEVEN REALITY CHECK

RegionBreakeven Price ($/cwt)Main ChallengeCompetitive Edge
Northeast$20-22Trucked grainLong-term stability
Upper Midwest$18.50-19.50Local cornNetworked knowledge
Southeast$21-23Heat stressAlternative revenue
California$19-21Water costMarket access

Northeast: $20-22/cwt (trucked grain, 1970s tie-stalls)
Upper Midwest: $18.50-19.50/cwt (local corn helps)
Southeast: $21-23/cwt (heat stress kills everything)
California: $19-21/cwt (water ain’t free) Your Farm: $_____?

The October Numbers That Matter (Spoiler: They’re All Bad)

Let me paint you the picture: Class III is bouncing between $16.50 and $ 17.00/cwt, while your breakeven’s probably north of $19. Maybe $20 if you’re honest about that new loader payment.

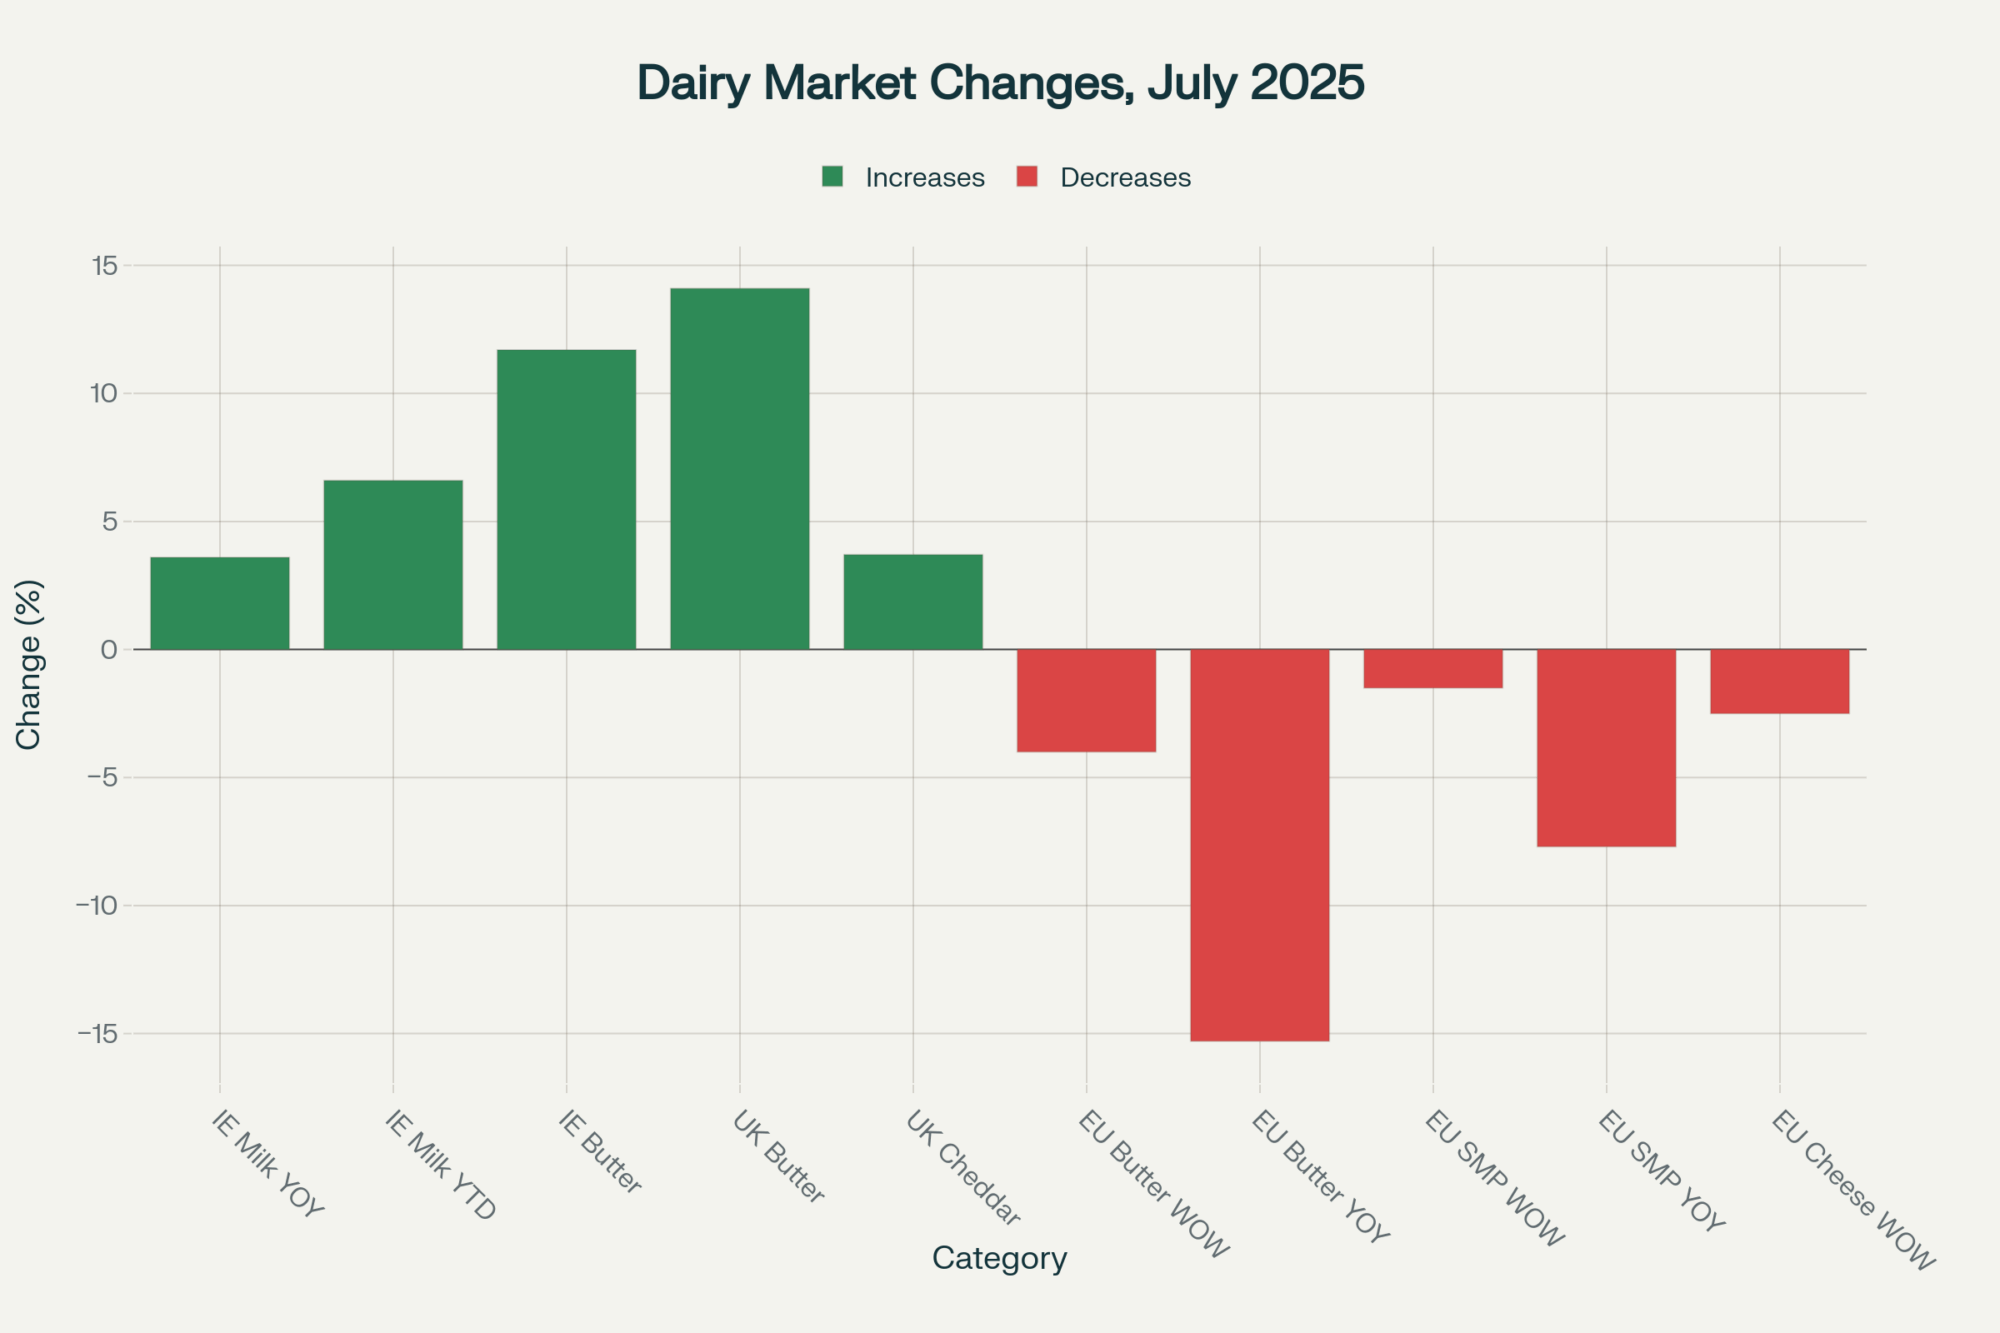
The Europeans? They’re drowning in milk. French production jumped 4% year-over-year. Germans added 2.1%. The entire EU bloc produced 13.75 million tonnes in August—up 3.3%. Their reward? That €5,820 butter price that keeps sliding like a fresh cow on ice.

Meanwhile, the USDA’s September outlook indicates that we are heading for 230 billion pounds in 2025. Another 231.3 billion forecast for 2026. More milk into markets, such as China.

The thing about China—and nobody at World Dairy Expo wanted to say this out loud—they’re done buying. Down 2.8% in domestic production, sure, but they’re cutting imports anyway. Why? Because over 90% of Chinese dairy farms are hemorrhaging money. They’d rather have empty shelves than lose more cash buying our powder.

That growth story we built our entire export strategy around? It’s not coming back. And if you’re waiting for it to, you might want to update your resume.

Small Farms Are Beating Big Dairies (No, Really)

This is gonna sting for some of you, but those small farms everyone said would die? Some of them figured out what the 2,000-cow operations missed.

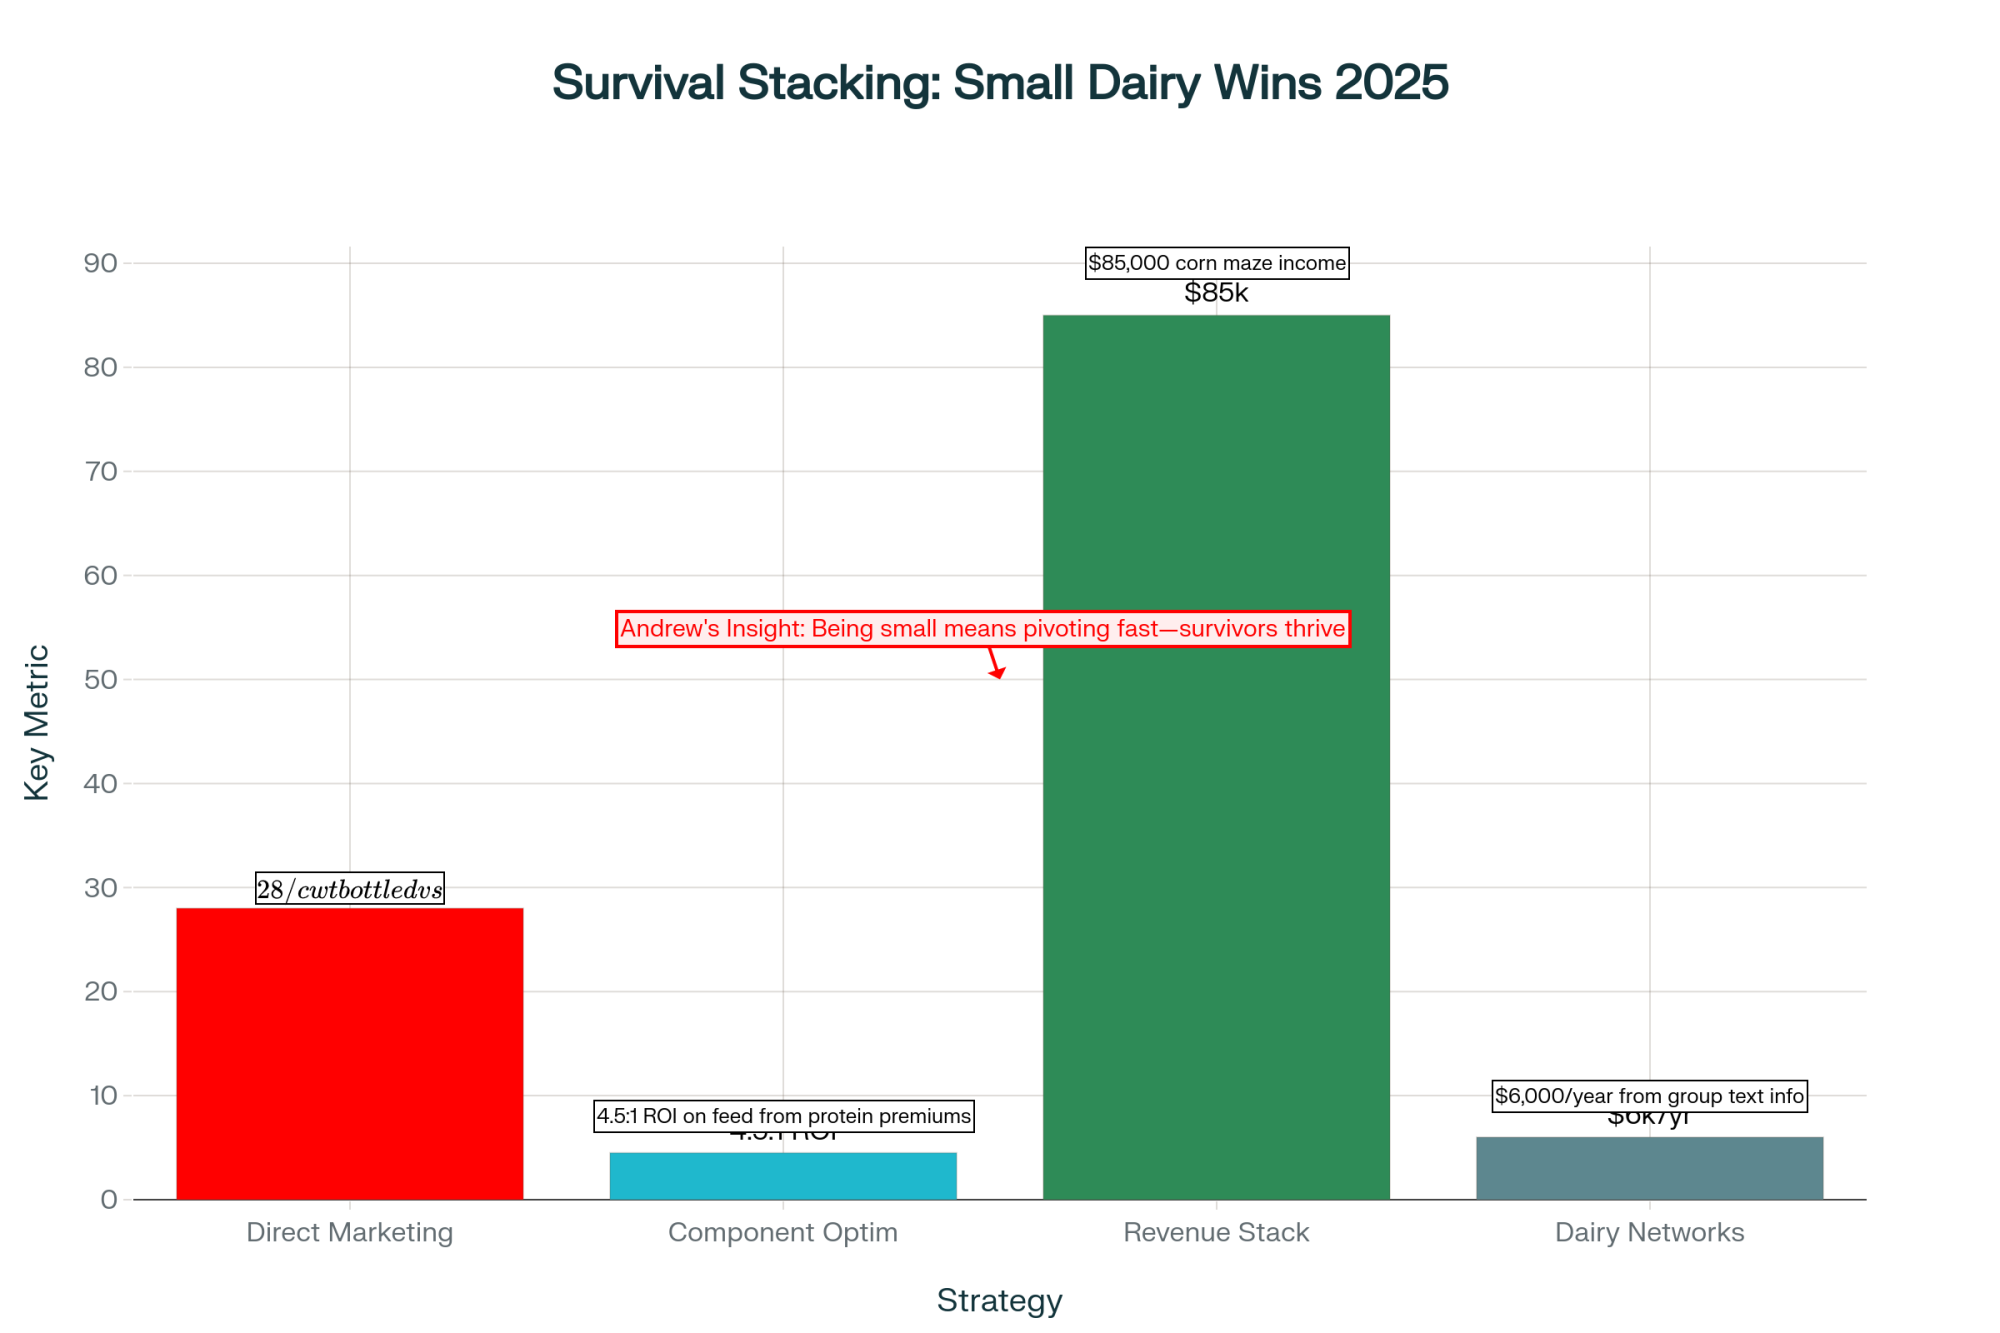
Penn State Extension’s Virginia Ishler and her team have been tracking this. Farms under 200 cows doing direct marketing or adding value on-farm? They’re capturing $4 to $ 6 more per hundredweight. That’s not a rounding error. That’s the difference between bankruptcy court and buying that neighbor’s 40 acres when he quits.

“I started bottling 20% of my production in June. Same milk that would’ve gotten me $17 at the co-op, I’m getting the equivalent of $28 on the bottled stuff. Yeah, there’s more work. Yeah, I’m tired. But tired beats broke.”
— Vermont producer, 165 cows

What really strikes me about Wisconsin is how fast this shift is happening. Brody Stapel at Double Dutch Dairy near Cedar Grove—you might know him, as he sells at the Sheboygan Farmers Market—started bottling in May. Non-homogenized, low-temp pasteurized, glass bottles. It turns out that lactose-intolerant individuals can actually drink it. He now has home delivery routes, featuring the Farm Stapels brand, in three Piggly Wigglys.

Still ships 95% to Sargento. But that 5% bottled? That’s where his profit lives.

Success Metric: Of the 14 Wisconsin farms in that information network, 12 are expanding operations while the state average is contracting. That’s not luck—that’s strategy.

Three Things That Actually Work (With Real Numbers, Not BS)

Every tenth of a percent matters. Jumping from 3.29% to 3.70% protein can mean an extra $9,000 for a 200-cow operation.

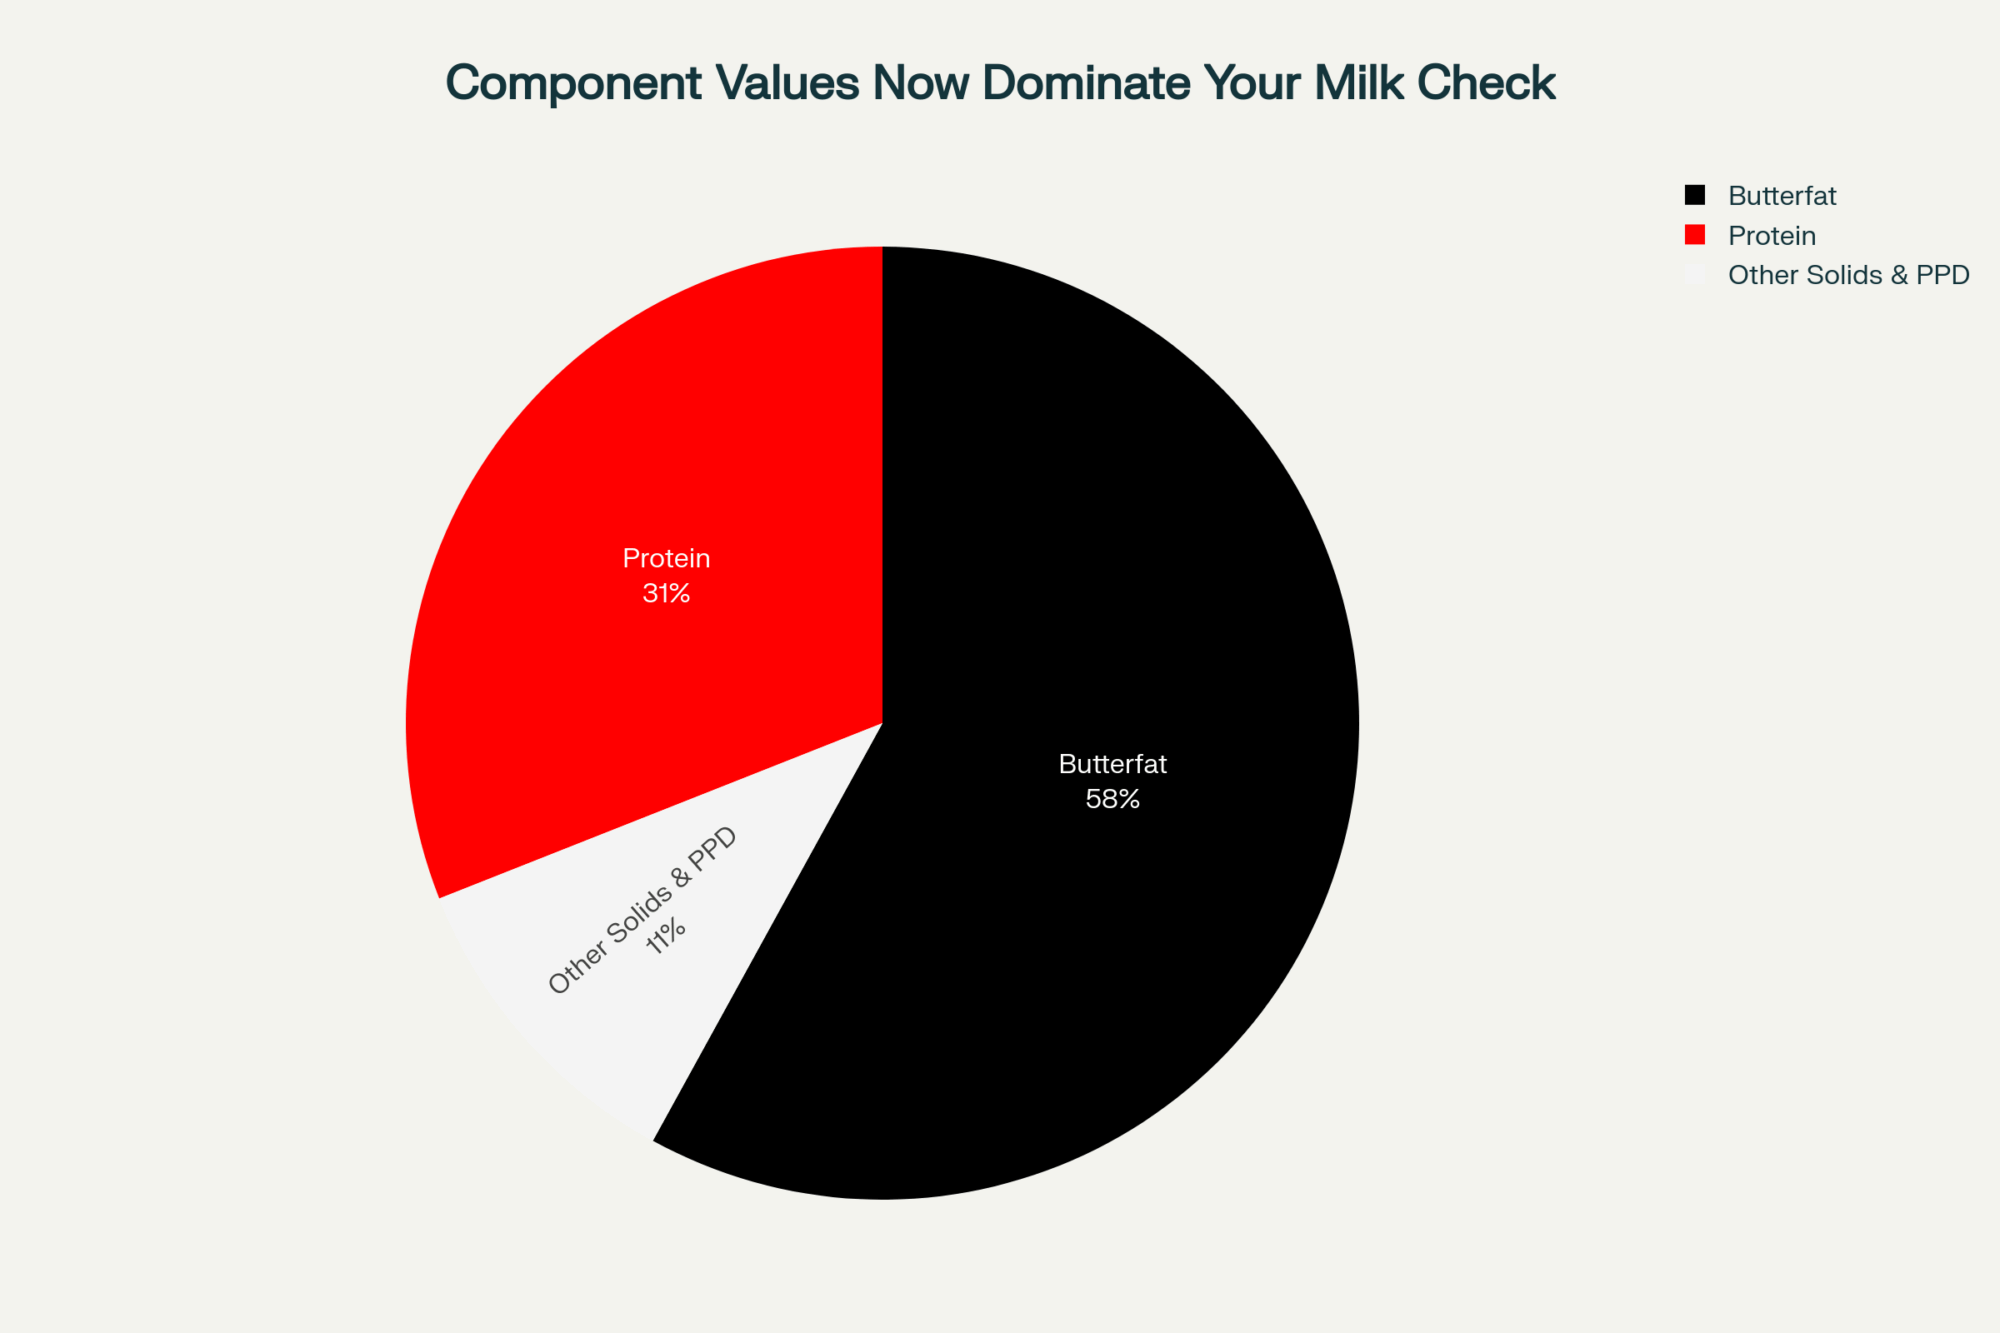
1. The Component Game (AKA Your Only Lever)

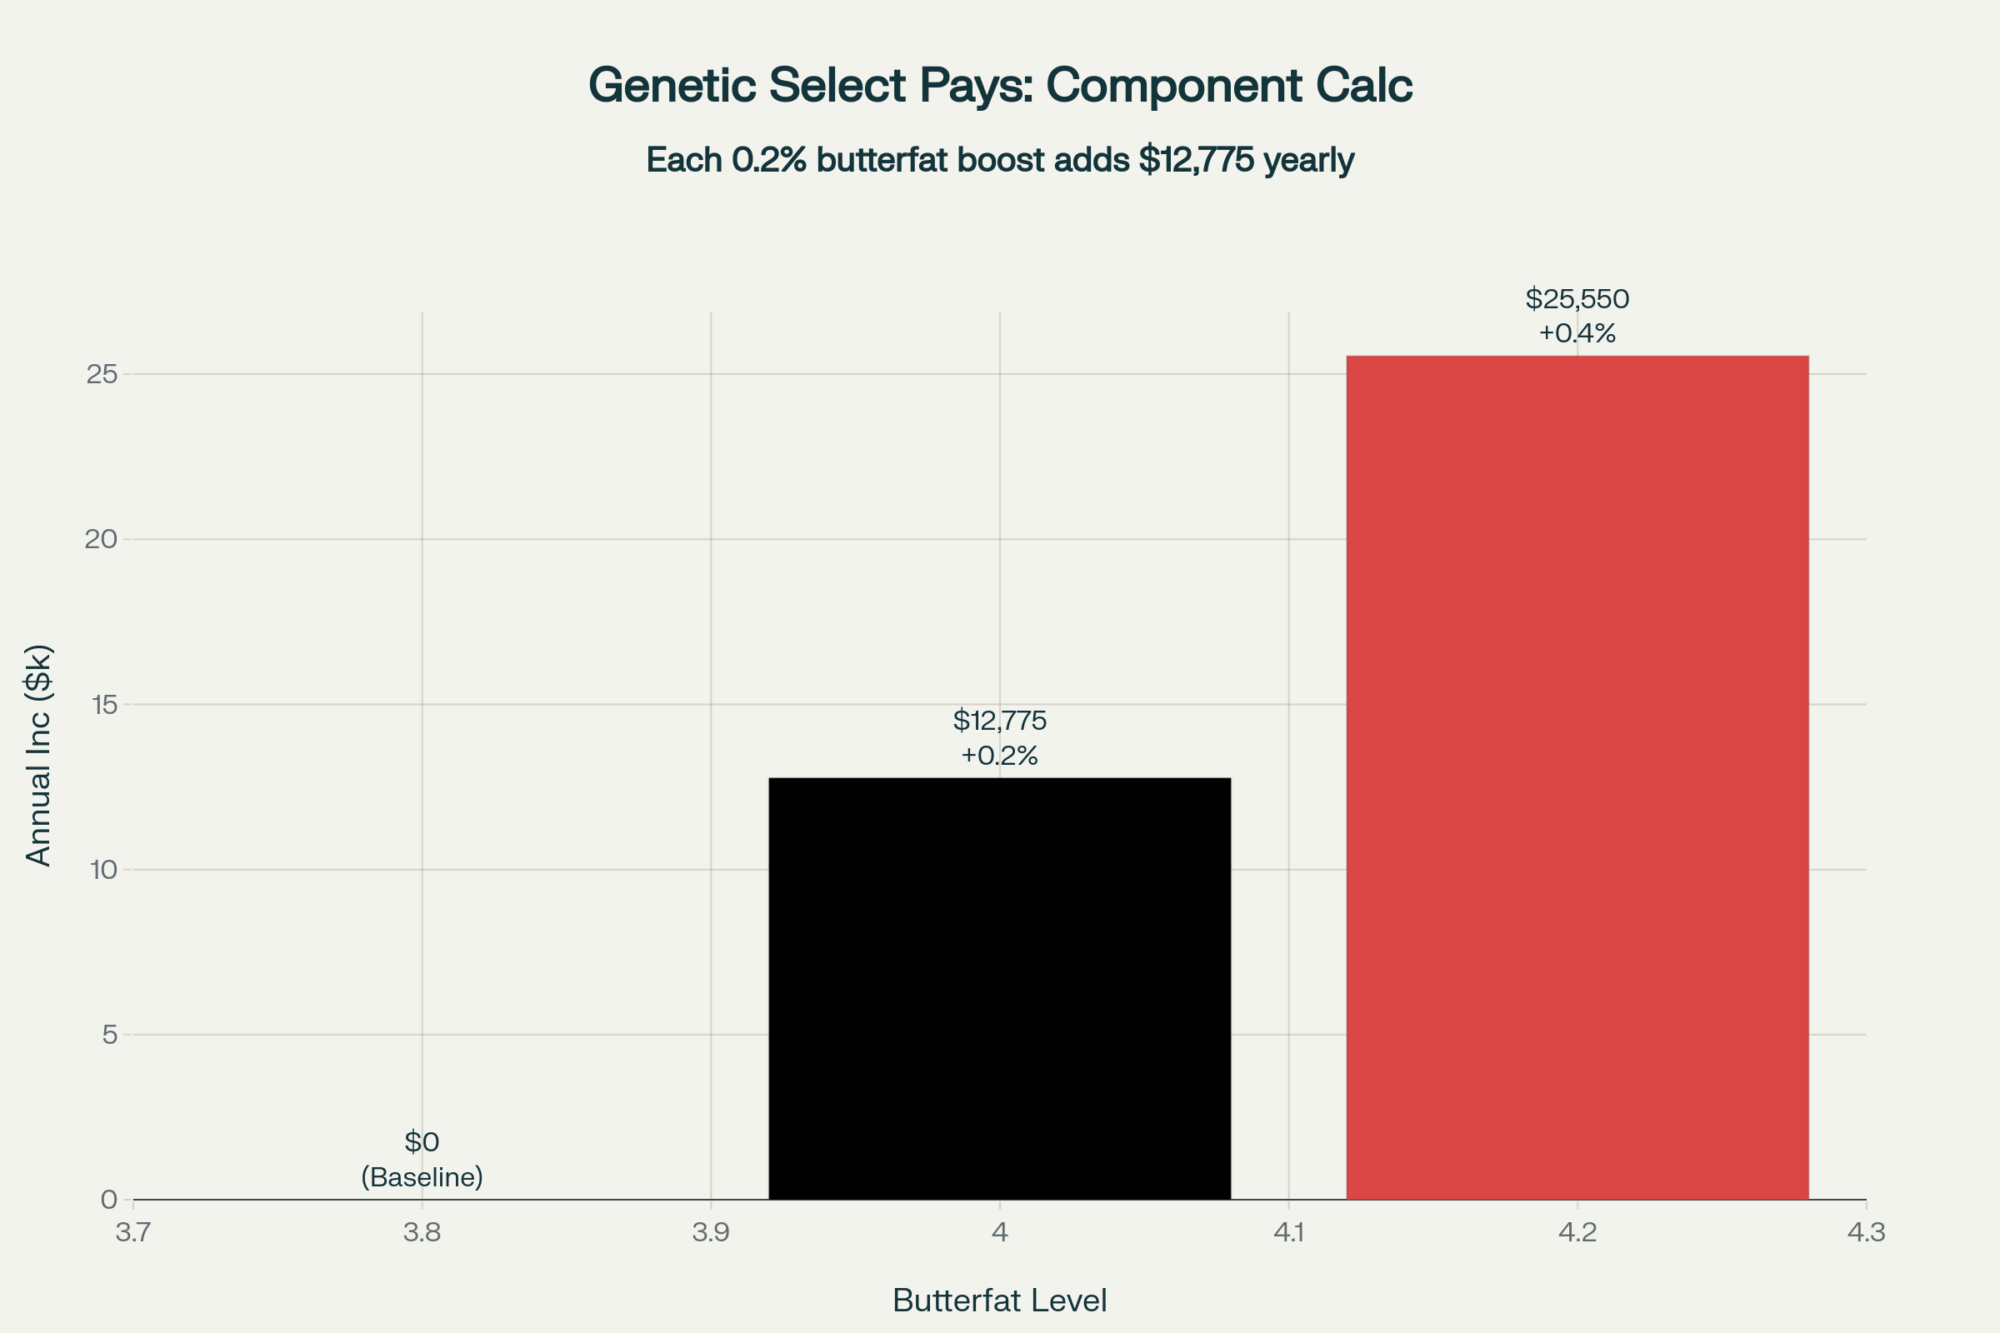
Forget the noise for a minute. The national average is 4.23% butterfat and 3.29% protein. But here’s what matters—farms pushing protein above 3.5% are banking on that 10-cent premium. Every. Single. Shipment.

COMPONENT PREMIUM REALITY (October 2025)

Butterfat: 4.23% average = Base price
Protein: 3.29% average = Base price
Protein: 3.50% achieved = +$0.10/cwt premium
Protein: 3.70% achieved = +$0.18/cwt premium Your Components: ___% fat % protein = $ premium?

Here’s the Math Nobody Shows You:

200-cow dairy pushing protein from 3.29% to 3.50%:

  • Daily production: 14,000 lbs (70 lbs/cow average)
  • Premium captured: $0.10/cwt
  • Annual premium: $5,110
  • Feed cost increase: ~$1,500
  • NET GAIN: $3,610

That’s your property tax. Or three months of health insurance. Or that used feed mixer you’ve been eyeing on Craigslist.

Wisconsin’s MILK2024 program breaks it down even further. Every 0.1% protein increase? Worth $8,000-10,000 annually on a 200-cow dairy. That 180-cow farm in Eau Claire? They’re projecting $18,000 additional revenue this year from protein optimization alone.

Feed cost to achieve it? Maybe $4,000 if they’re buying bypass protein. That’s a 4.5:1 return. Show me another investment doing that right now.

2. The $6,000 Group Text (Information Arbitrage)

Here’s something the old-timers absolutely hate but works. Fourteen producers in central Wisconsin formed a text group. Not a co-op, not an LLC, just a group text.

Tuesday morning: “Agropur taking spot loads at $17.50” Wednesday: “Land O’Lakes needs high-protein, paying premium” Thursday: “Ellsworth cheese plant basis shifted, avoid”

They’re each capturing $4,000-$ 6,000 annually just by knowing where to ship when. One guy ships to three different plants in a week sometimes. His dad would’ve called that crazy. His banker calls it smart.

“We’re not competing anymore,” one told me over Spotted Cow at the Legion hall. “We’re surviving together. Competition’s a luxury we can’t afford.”

3. Revenue Stacking (The Small Farm Secret Weapon)

Research from Kansas State confirmed what I’m seeing everywhere: farms with fewer than 300 cows can pivot faster than larger operations. They’re not more efficient. They’re more flexible.

Real examples from this month:

Pennsylvania, 150 cows: Added agritourism. Corn maze, birthday parties, and “pet a calf” experiences. Bringing in $85,000 annually. That’s $567 per cow, which has nothing to do with milk prices. Their bank loves them now.

Minnesota, 225 cows: Solar panels on the barn and that back 40 that floods every spring anyway. Twenty-year lease at $1,200/acre/year. Better than growing $4.50 corn on ground that might flood.

Wisconsin, 175 cows: Custom raising heifers for the 3,000-cow dairy down the road. Gets $2.75/head/day. Better margins than milk. No market risk—the big farm owns the heifers.

Iowa, 190 cows: Went seasonal. Dry everyone off from December through February. Match spring flush to fluid premiums. Capturing $1.50/cwt more April-August. Cows are healthier. He’s definitely healthier.

The Processing Disaster Nobody’s Discussing

Forget survival mode—these proven pivots have Wisconsin’s small dairies stacking cash and market opportunities, even as bigger neighbors go under

Leonard Polzin from UW-Madison laid out the truth at January’s Ag Forum, and it’s worse than you think. That “$11 billion in new processing capacity” everyone’s talking about? Most won’t be operational until Q2 2026. Some won’t happen at all if milk stays at $17.

Central region plants running at 95-98% capacity isn’t temporary. It’s your reality through next summer at a minimum. Wisconsin co-ops have already sent the letters—base excess penalties take effect on November 1.

One co-op (you know which one) is implementing tiered pricing:

  • Base production: $17.00/cwt
  • 101-110% of base: $14.50/cwt
  • Over 110%: $13.00/cwt

Minnesota’s actually worse. A producer near Winona told me that anything over 105% of base gets $13.00. Thirteen dollars! That’s 1995 prices with 2025 costs.

What happened at Hastings Creamery should terrify everyone. Processing 150,000 pounds daily until the discharge permit is issued. Farmers had milk, but the plant couldn’t take it. Lucas Sjostrom from Minnesota Milk confirmed they were “voluntarily dumping milk on-farm.”

That’s not oversupply. That’s infrastructure collapse.

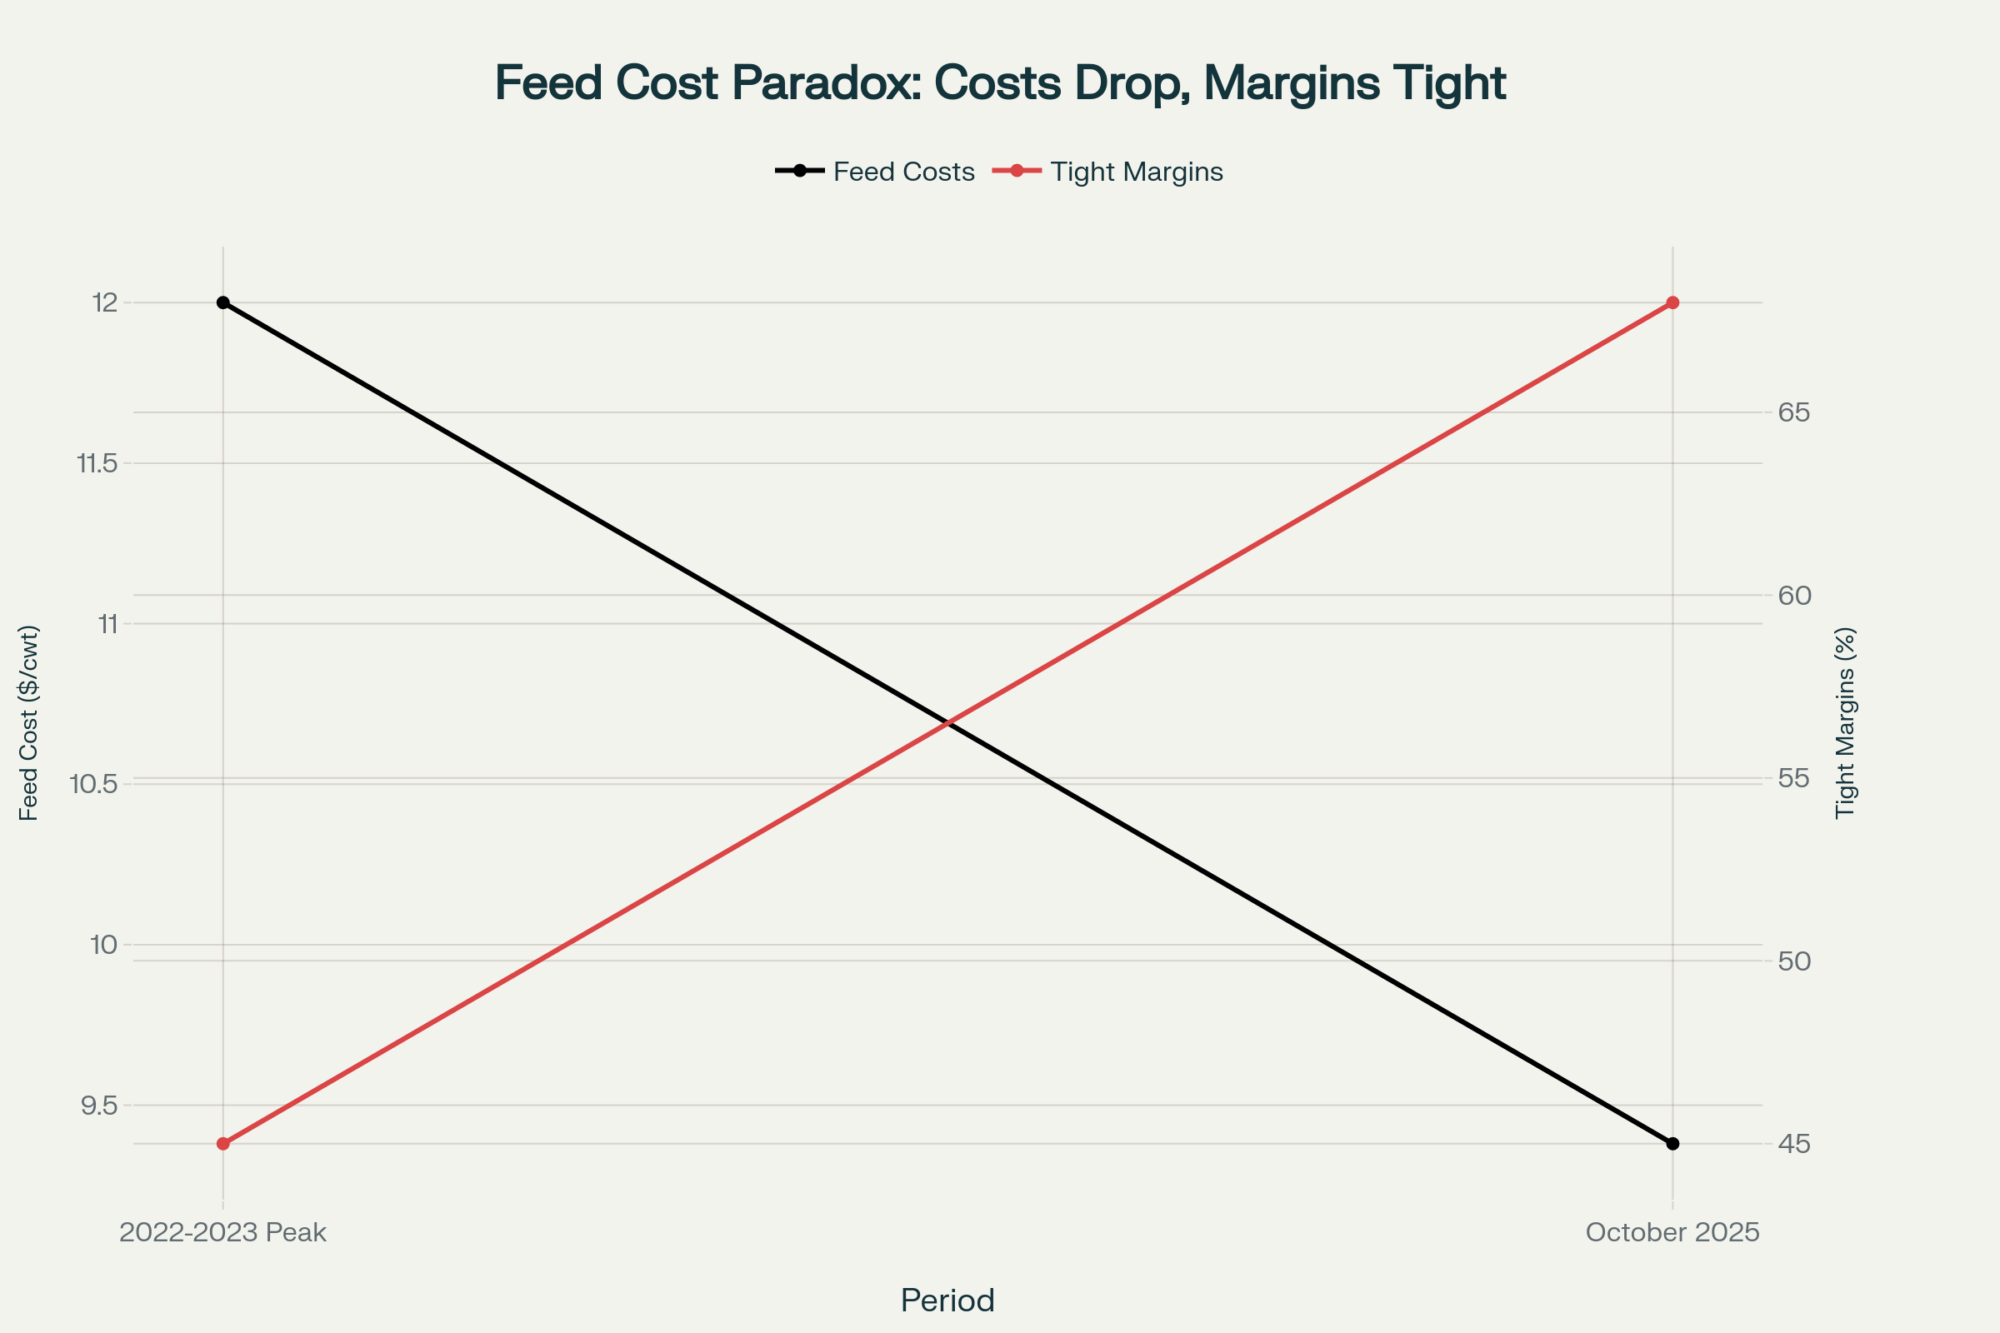
Your Feed Market Reality (It Gets Worse)

Current markets, if you’re buying this week:

  • December corn: $4.45-4.65/bu (my neighbor who grows corn says $5 by January)
  • Soybean meal: $285/ton and climbing
  • Quality hay: Good luck finding any under $280/ton

Talked to a nutritionist who manages 15,000 cows across Wisconsin. His take? “We’re looking at $5 corn by February if South America has any weather issues. These guys buying hand-to-mouth are gonna get crushed.”

Your feed costs are rising while the milk price is falling. That’s not a squeeze—that’s a vice.

THE REAL BOTTOM LINE

Waiting for $20 milk is like waiting for your ex to apologize.
It might happen, but you’ll probably die first.
Finding ways to make $17 work? That’s survival.

What Winners Do Different (Hint: Everything)

Spent the last month analyzing farms under 300 cows that are actually thriving. Not surviving—thriving. Banking money. Taking vacations. Sleeping at night.

Three patterns kept showing up:

Ruthless Efficiency: Successful 150-cow farms run 65-70 cows per worker, same as mega-dairies. Automated gates, crowd control gates, and possibly even a robot. One guy near Dodgeville milks 150 cows faster than his dad milked 50. “We work smarter, not harder. Had to—can’t afford hired help at $20/hour.”

Revenue Stacking: Wisconsin farm that blew my mind—milk revenue, plus beef-on-dairy ($900 per calf right now), plus custom heifer raising ($2.75/day), plus solar lease ($1,200/acre), plus direct butter sales to three Madison restaurants ($8/lb). Five revenue streams. Same 180 cows. Same land. Same family.

Collaboration Without Consolidation: Five 200-cow farms in Dodge County formed an LLC—but just for buying feed. They’re getting loads at 1,000-cow pricing but keeping independence. Another group shares a nutritionist, vet, and relief milkers. “We compete Tuesday, cooperate Wednesday,” as one put it.

The Uncomfortable Math on Consolidation

Let’s talk real numbers. Wisconsin lost 455 farms last year. Ninety-four in October alone. The state’s own survey revealed that 17% of all dairy farms plan to exit within five years. Farms under 100 cows? Twenty-two percent say they’re done.

Those aren’t statistics. Those are your neighbors.

But here’s the weird part—Cornell data shows milk solids production up 1.65% year-to-date despite fewer cows. We’re getting more efficient at producing milk nobody wants. It’s like running faster toward a cliff.

Industry consolidation data indicate that farms with between 150 and 400 cows have the highest costs and the lowest returns. Too big for small-farm premiums, too small for commodity efficiency. That’s the kill zone.

Your Next 90 Days (The Only Timeline That Matters)

Week 1-2: Face Reality, Get brutal about costs. Penn State’s got worksheets. Cornell’s got spreadsheets. If you don’t know your breakeven to the penny—not the hundredweight, the actual penny—you’re not farming, you’re gambling.

Week 3-4: Component Focus Check your last three months of component tests. Calculate what 0.1% more protein means for your check. The Center for Dairy Excellence ECM calculator shows exactly this. That 180-cow farm pushing protein? They check tests like day traders check stocks.

Week 5-8: Find Your Stack. What else can your farm do? Direct sales? Custom work? Solar? Agritourism? Beef-on-dairy? Pick one. Start small. Test it.

Week 9-12: Make The Choice. Get creative or get out. Harsh? Yeah. True? Also yeah.

The farms that do the same thing in the same way are the ones getting auction flyers printed. The ones trying something—anything—different are the ones buying at those auctions.

The Decision That Can’t Wait

Met a 73-year-old dairyman in Marathon County last month. Just installed robots. At 73. Asked him why.

“Because standing still means dying, and I’m not ready for either.”

Markets don’t care about your grandfather’s legacy. Don’t care how many generations your family’s been milking. They care about supply, demand, and who produces the cheapest.

European futures signal more pain coming. GDT auctions confirm it—WMP at $3,650 and sliding. The Wisconsin harvest basis shows the whole rural economy’s stressed. When grain farmers hurt, equipment dealers hurt, banks tighten, and credit disappears.

The 2,800 farms are expected to exit this year? That’s market share for somebody. Question is whether you’re capturing it or becoming it.

Your Choice (And Yeah, You Have to Choose)

Your October check is what it is. November’s definitely worse. December… let’s not even go there.

But what you do today—literally today, Monday, October 20—determines whether you’re buying your neighbor’s cows next spring or selling yours.

That thriving 180-cow farm down the road? They made tough choices two years ago when they still had options to consider. The bottling equipment, component optimization, and direct sales routes—none of it happened overnight. They saw this coming and adapted early.

They chose to change when changing was optional.

Now it’s mandatory.

What’s your choice?

Because doing nothing? In this market, that’s choosing to fail. And failure’s got a really high acceptance rate right now.

KEY TAKEAWAYS

  • Component Premiums = Immediate ROI: Push protein from 3.29% to 3.50% and capture $8,000-10,000 annually per 200 cows. Wisconsin’s MILK2024 calculator shows feed cost increases of $1,500-2,000, yielding returns of $5,110+. Start Monday by reviewing your last three months of component tests and calculating potential gains.
  • Information Networks Beat Individual Guessing: Fourteen Wisconsin producers sharing real-time spot prices and processor needs via group text are each banking $4,000-6,000 extra annually. Create or join a trusted network this week—Tuesday’s spot load at $17.50 beats Wednesday’s regular haul at $17.00.
  • Revenue Stacking Under 300 Cows: Small farms adding just one alternative revenue stream (agritourism: $85,000/year, custom heifer raising: $2.75/head/day, solar: $1,200/acre) are achieving better margins than pure milk production. Pick one complementary enterprise that fits your land and labor—test it small, scale if profitable.
  • Direct Marketing Captures Hidden Premiums: Bottling just 5-20% of production for local sales can yield $28/cwt equivalent versus $17 commodity price. Center for Dairy Excellence worksheets show breakeven at 800 gallons/week for most operations. Glass bottles, non-homogenized, farmers markets—that’s where the margin lives.
  • Processing Capacity Crisis = Pricing Opportunity: With plants at 95-98% capacity and tiered pricing hitting ($17 base, $14.50 over-base), strategic production management beats volume chasing. Match your flush to processor needs, not calendar tradition—April-August fluid premiums can add $1.50/cwt for seasonal producers.

Data Sources & References

Market data compiled from EU Commission Milk Market Observatory, USDA reports (pre-shutdown), Penn State Extension, Cornell PRO-DAIRY, UW-Madison Dairy Markets, Kansas State University research, and the Center for Dairy Excellence. Market prices reflect mid-October 2025 conditions. Additional reporting from regional cooperatives, the Minnesota Milk Producers Association, and producer networks.

Component Optimization Tools:

Learn More:

Join the Revolution!

Join over 30,000 successful dairy professionals who rely on Bullvine Weekly for their competitive edge. Delivered directly to your inbox each week, our exclusive industry insights help you make smarter decisions while saving precious hours every week. Never miss critical updates on milk production trends, breakthrough technologies, and profit-boosting strategies that top producers are already implementing. Subscribe now to transform your dairy operation’s efficiency and profitability—your future success is just one click away.

NewsSubscribe
First
Last
Consent

Weathering Europe’s Dairy Waves: Real-World Strategies for Your Milk Check

Europe’s milk moves could flood your mailbox. Is your dairy ready for the next wave?

EXECUTIVE SUMMARY: European milk production swings are making an outsized impact on North American dairy margins this season. As the EU, U.S., and New Zealand jostle for global export leadership, every volume shift and new regulation from Brussels lands directly on U.S. farm income and risk. From compliance costs to feed volatility, today’s market noise looks more like a set of fast-moving waves than the predictable old cycles. That’s why top producers are leaning into real-time break-even tracking, component-driven strategies, and flexible risk coverage. This article gets practical—highlighting lessons from the 2015 quota flood, the importance of managing debt and working capital, and exactly which steps farmers are taking to lock in resilience. If staying afloat—and ahead—in this new dairy world is your goal, the toolbox outlined here belongs in every barn.

You know, sometimes it feels like the global milk market is just one noisy, unpredictable stock tank. I’ve had a dozen conversations this harvest about how a seemingly small regulatory change in Brussels or a surge in Irish production leaves folks scratching their heads when the mailbox check or feed bill shows up in Wisconsin or Idaho. So let’s break down what’s actually factual, what matters for North America right now, and the smart steps farms are taking to stay steady in choppy global waters.

Europe’s Ripple Effect—Bigger Than Ever

Looking at data from the FAO and European Commission this season, Europe’s share of global dairy exports is as high as any region in the world—routinely neck-and-neck with New Zealand and the U.S. USDA FAS trade briefs and figures from the International Dairy Federation confirm that EU policy, volume, and even local weather matter for price benchmarks in every major importing region, from China to Algeria and Saudi Arabia [FAO Dairy Market Review 2024; European Commission Milk Market Observatory 2025; USDA Dairy: World Markets and Trade 2025].

After the big quota-lift in 2015, history proved these ripple effects: Europe’s open floodgates sent milk downstream to world markets, dropping global prices and shrinking margins back home. This dynamic (and similar cycles since) is widely documented by USDA’s Economic Research Service and industry analyses [USDA ERS 2016 Dairy Outlook]. These aren’t hypothetical models—they’re what producers are still living through, every time a big EU volume shift combines with U.S. or Oceania constraints or demand spasms in China.

Market Moves: When Data and Intuition Don’t Always Match

What’s interesting right now, reading updates from USDA Dairy Market News and IDF, is how export punches keep rolling—U.S. butter and nonfat dry milk exports are at multi-year highs as of August and September. Yet the same sources, and public updates from major global processors, flag that key importers (especially in Asia) are warming only slowly after a soft patch. Price is now set at the intersection of commodities, shipping, trade policy (yes, tariffs still sting), and shifts in government intervention or environmental regulation.

And here’s the farmer’s perspective: global milk prices don’t just bounce up and down like a ball. With international markets more closely linked than ever, a wave in Europe or Oceania can hit North American producers’ returns like the surge on a big tidal pond: unpredictable and fast.

Debt, Leverage, and Reluctance to Slow Down

I’ve noticed most extension meetings address debt and capital structure more than ever, thanks to USDA and Farm Credit reporting higher average borrowing in new builds—and Wageningen and Thünen Institutes in Europe showing similar trends in Dutch and German herds [USDA ERS 2025; Wageningen University 2024 Dairy Finance; Thünen Institute German Survey 2024]. The same stubborn reality: high fixed payments don’t let a producer ramp down milk flow very quickly, even if the next three months look ugly on paper. Most of us end up chasing volume, not conservation, because loan payments wait for nobody.

Feed: The Margin Maker (or Breaker)

The data from Penn State, UW-Madison, and Cornell extension budgets for 2024 are crystal clear: feed claims 50–60% of the average conventional herd’s cost structure—a number that climbs higher if you’re buying more feed than you grow [PSU Dairy Budgets 2024; UW Center for Dairy Profitability 2025]. USDA Ag Marketing Service had corn in the low $4s throughout harvest, but soybean meal swings and local hay shortages have kept feed volatility front and center.

What producers increasingly do—across regions and herd sizes—is double down on feed testing, fresh cow management, and ration tweaking. Historical data from the bleakest periods (2014, 2022) show that a tenth of a point of feed efficiency or improvement in butterfat performance can move a break-even from the red to the black. Industry extension sources all show more hands adjusting the TMR mixer and paying closer attention to transition period protocols and dry matter intake trends.

When Regulators Call the Tune

Complying with environmental mandates is no longer just a box for the processor or CAFO paperwork. UC Davis and multiple extension sources consistently estimate new California methane and nutrient regulations cost up to $0.40–0.55/cwt once all’s accounted for [UC Davis Agricultural Economics Policy Update, 2025]. That mirrors regulatory costs now rolling out in European dairies—Denmark, the Netherlands, and Germany are all adding, not subtracting, layers of compliance spending [European Commission Dairy Policy Fact Sheet 2025].

For Northern and Eastern U.S. producers near sensitive watersheds, budgets frequently flag compliance costs of $50–$70 per cow annually just for nutrient handling [Cornell Pro-Dairy Water Quality 2024; Wisconsin DATCP CAFO reports]. It’s a new line item in every cost calculation—something more farms are integrating into regular budget reviews.

Price Spreads, Component Value, and Dairy Resilience

USDA Reporter summaries and CME data from early October confirm that Class III/IV spreads topped $2/cwt—meaning the farm’s product mix, from cheese to butterfat, is increasingly make-or-break for winter cash flow. Extension and IDF bulletins show that maximized component programs (think protein-by-breed planning or butterfat levels targeting cooperative premiums) are paying out ever higher.

The data (and plenty of farmer experience) say it’s wise to keep chasing component optimization with genetic selection, ration shifts, and milk quality focus—not only for incentive programs but also for the buffer against commodity price swings. Farms that get complacent here risk losing the best margin lifelines left in a volatile pricing world.

Farmer Risk Playbooks: Layering and Learning

Here’s a theme that runs through nearly every 2025 extension update and peer group panel: those who spread risk, keep cash reserves, and use partial hedging (from Dairy Margin Coverage to LGM or local processor contracts) are the ones telling positive stories at year’s end. Across the Corn Belt, into the Northeast and West, budgeting tools and farm management software are being used daily to run break-evens, test expansion math, and keep track of every feed load and market move.

Risk ToolSurvival %Annual CostRating
Dairy Margin Coverage78%$100–300Essential
LGM Insurance65%$200–500Strong
Cash Reserves (90 days)85%Opportunity costCritical
Feed Hedging70%1–3% of feedImportant
Processor Contracts60%Price discountUseful
No Risk Management35%$0Dangerous

Extension groups are now coaching herds to treat working capital as “production insurance” and to see budgeting and risk review as ongoing—not just annual—events. It’s a practice that’s proving the difference between being able to row to safe harbor in a market storm…or simply getting swept along for the ride.

Past Lessons, Forward Momentum

There’s universal agreement—whether it’s coming from a Missouri discussion group or New England’s latest fact sheets: flexibility beats size or even efficiency alone, especially once margins start to tighten. Farms that survived 2014 or the sudden whiplash of 2022 put working capital on par with any weekly milk check and made their lender and nutritionist partners, not just vendors.

What’s particularly heartening is more farms are now proactively putting reserves away in the “good” quarters rather than waiting for the next price crash. That shift, widely endorsed in current university and co-op extension workshops, means more businesses are poised to adapt to whatever moves Europe or world trade throws their way.

Looking at Winter—and the Year Ahead

If you’re looking for actionable steps, this year’s most robust takeaways from across the government, extension, and industry space are these:

  • Know your cost structure cold and react quickly to any break-even changes.
  • Prioritize fresh cow and transition period management for best margin protection.
  • Maximize component herd strategies (and renegotiate for best premiums).
  • Plan for regulatory compliance costs as a “normal” budget item.
  • Treat cash reserves and budgeting as production tools, not afterthoughts.
  • Layer your risk with multiple tools and update your mix every season.

And perhaps the most important advice? Stay curious and connected. Use every extension, processor, and peer resource out there—and keep agile enough to pivot when new global “waves” come across the Atlantic.

In this interconnected dairy world, the best producers aren’t fortune tellers—they’re steady captains, always ready to adjust sail.

Key Takeaways:

  • European market shifts can hit milk checks fast—stay alert to global supply changes.
  • Update break-evens often; real-time cost tracking is your strongest defense.
  • Feed and component management are difference-makers for net margins.
  • Build regulatory compliance into your core business plan, not just for inspection day.
  • Use layered risk tools—insurance, contracts, and liquidity—to position your farm for any market weather.

Complete references and supporting documentation are available upon request by contacting the editorial team at editor@thebullvine.com.

Learn More:

  • Protect Your Dairy Operations from America’s 1,000-Fold Subsidy Advantage – This action-oriented guide details a 3-phase plan for achieving component targets (4.2% fat, 3.3% protein) and optimizing feed conversion above 1.75:1. It provides concrete ROI calculations to show how operational excellence creates a competitive advantage that can neutralize market disadvantages.
  • Dykman Dairy’s $75 Million Debt Crisis: Mismanagement or Misfortune? – This cautionary case study offers a deep dive into the devastating strategic risks of unchecked leverage and rapid expansion. It provides five vital tips on debt revision, diversification, and strengthening lender relations to help you proactively manage financial flexibility against global market shocks.
  • The $500000 Precision Dairy Gamble: Why Most Farms Are Being Sold a False Promise – This strategic technology evaluation challenges the high-cost automation pitch, revealing how optimizing fundamental protocols (like transition cow health) offers a better, lower-cost ROI than relying solely on expensive sensors and robotics. Use this to filter smart capital investments.

Join the Revolution!

Join over 30,000 successful dairy professionals who rely on Bullvine Weekly for their competitive edge. Delivered directly to your inbox each week, our exclusive industry insights help you make smarter decisions while saving precious hours every week. Never miss critical updates on milk production trends, breakthrough technologies, and profit-boosting strategies that top producers are already implementing. Subscribe now to transform your dairy operation’s efficiency and profitability—your future success is just one click away.

NewsSubscribe
First
Last
Consent

Same Milk, Different Worlds: Why Identical Farms Are Earning Wildly Different Checks

Neighbors with identical herds see $90K annual income gaps—the difference is market positioning

EXECUTIVE SUMMARY: What farmers are discovering across the country is that consumer markets have fundamentally split—creating two distinct dairy economies that reward completely different strategies. The 2022 Census of Agriculture reveals that while total dairy operations declined 6.8%, specialty and direct-market operations actually grew, with producers capturing premiums of $150-300 per cow annually through strategic positioning. Wisconsin’s Center for Dairy Profitability documents operations achieving $90,000 in additional annual revenue simply by pushing butterfat from 3.8% to 4.3% through targeted nutrition and genetics. Recent research from land grant universities shows that producers who understand this bifurcation and choose their market deliberately—whether scale efficiency, component optimization, or direct marketing—consistently outperform neighbors who maintain traditional approaches by 15-25% in net returns. The gap between strategic and commodity positioning widens monthly, with early positioning becoming increasingly critical as we head into 2026 planning cycles. Here’s what this means for your operation: the market’s asking you to choose a lane, and those who make that choice consciously are building sustainable futures while others wonder why identical operations earn wildly different checks.

dairy market positioning

You know what caught my attention last month? I was at a producer meeting in central Wisconsin, and during the usual milk check conversation, it struck me – neighbors with nearly identical operations were living in completely different economic worlds. Not just different prices. Different markets entirely.

And that’s what I want to talk about today. The way consumers buy dairy is splitting into distinct segments, and depending on which one your milk ultimately serves, the economics change dramatically.

The Shift Nobody Saw Coming

Strategy TypeAnnual Revenue per CowNet Margin %Butterfat %Premium per CWTIncome Gap (600 cows)
Traditional/Commodity$1,80012%3.8%$0.00$0
Strategic Positioning$2,35018%4.2%$1.85$330,000
Component Optimization$2,20016%4.3%$2.20$240,000
Direct Marketing$2,45022%4.0%$3.50$390,000
Premium Specialty$2,65025%4.1%$4.25$510,000

Here’s what’s interesting—the folks with higher incomes aren’t just buying more dairy. They’re buying different dairy. Premium organic, grass-fed, A2, specialty cheeses… Meanwhile, middle-income families are getting squeezed, buying more private label to stretch their budgets.

The 2022 Census of Agriculture revealed a striking trend: while total dairy operations declined by 6.8% since 2017, specialty and direct-market operations actually increased in several states. That tells you something about where opportunity lives.

I was talking to a processor friend of mine last week, and he put it perfectly: “We’re basically running two different businesses now. The truck might pick up milk from the same road, but where it goes from there? Totally different worlds.”

Take the whey market. Basic dry whey trades at commodity prices—usually under fifty cents a pound. Whey protein isolate? That’s selling for several dollars per pound to specialty nutrition markets. Same starting material, multiples in value difference.

Components: The Quiet Gold Mine

So I visited this operation near Eau Claire a few weeks back—about 600 cows, nothing fancy—and the owner, let’s call him Dave, showed me something fascinating. Through genetic selection and working with his nutritionist on precision feeding, he’d pushed his butterfat up from 3.8% to 4.3% over two years. That half-percent improvement? It’s adding an extra $90,000 to his annual income.

USDA data from the past five years shows the national average butterfat has climbed from around 3.9% to over 4.0%. That’s not seasonal variation—that’s thousands of deliberate breeding and feeding decisions paying off.

What’s encouraging is how accessible this can be. Wisconsin’s Center for Dairy Profitability found that operations focusing on component improvement typically see returns of $150-300 per cow annually, with initial investments often under $100 per cow for genetic testing and ration adjustments.

One veteran nutritionist I respect, who has been formulating rations for over thirty years, tells me he has never seen component premiums like this. “Used to be a nickel here and there,” he said. “Now we’re talking real money.”

Beyond the Co-op: Options Worth Exploring

Look, cooperatives have been good to dairy farmers. Many of us wouldn’t be farming without them. But lately, more folks are exploring what else might be out there.

According to recent land grant university extension programs, producers who diversify their marketing channels often capture additional value. Sometimes it’s fifty cents per hundredweight, sometimes more.

I know a guy in Vermont who keeps his co-op membership but also direct-markets about 20% of his production locally. Last year, his direct sales averaged $4.50 more per gallon than his wholesale milk. That’s funding his daughter’s college education.

Your Geography Shapes Your Options

Where you’re milking matters more than ever:

California’s Central Valley is now primarily characterized by scale or specialization. The 2022 Census showed that California operations of over 2,500 cows now produce the majority of the state’s milk. But smaller operations are thriving by serving specialty cheese makers or ethnic markets in Los Angeles and San Francisco.

Wisconsin maintains more farm size diversity. Component premiums really matter there—the state’s average butterfat topped 4.1% last year, according to the Wisconsin Agricultural Statistics Service. A 400-cow operation can compete if they’re hitting those quality targets.

The Northeast benefits from proximity to wealthy urban markets. Cornell’s Dyson School research indicates that small operations engaging in direct marketing can generate returns comparable to those of much larger, commodity-focused farms.

The Southeast presents unique opportunities. The University of Georgia Extension reports that agritourism generates an average of $75 per cow in additional revenue for operations within an hour of major metropolitan areas.

As we head into fall feed contracting season, these regional differences become even more important for planning next year’s strategy.

Practical Steps That Actually Work

Based on what I’m seeing succeed:

Tomorrow morning: Pull your actual performance data from the last 12 months. Penn State Extension’s benchmarking studies show most of us overestimate our component levels by 0.2-0.3%.

This week: Make three phone calls to different milk buyers. Not to switch, just to learn. The National Milk Producers Federation notes that market awareness alone often leads to better negotiations with current buyers.

Within 30 days: Consider genomic testing for your top performers. The Council on Dairy Cattle Breeding reports that genomic testing now costs $35-$ 55 per animal and can identify component improvement potential worth hundreds of dollars per cow annually.

Finding Opportunity in Disruption

What we don’t talk about enough is how disruption creates opportunity. The latest Census shows dairy farm numbers declining, but remaining operations are capturing market share and efficiency gains.

I’ve met several young producers building successful operations right now. They’re buying quality equipment from retiring neighbors at attractive prices, hiring experienced help as other farms consolidate, and finding niche markets as consumer preferences diversify.

The Plant Based Foods Association (ironic source, I know) actually provides useful data—their research shows value-added dairy products growing faster than plant alternatives. Lactose-free, A2, grass-fed, protein-fortified… these aren’t fads anymore.

The Bottom Line

After thirty years of watching this industry, what’s happening now feels fundamentally different. It’s not just another price cycle. The structure of consumer demand has shifted, resulting in distinct markets that necessitate different marketing strategies.

The successful operations around me aren’t necessarily the biggest or newest. They’re the ones who recognized the shift early and positioned accordingly. Some went for scale and efficiency. Others focused on premium quality or local markets. The common thread? They made conscious choices about which market to serve.

Tomorrow, after milking, take a real look at your numbers. Compare them to what’s available. The gap between strategic positioning and commodity production widens every month.

Coffee’s getting cold, but hopefully this gives you something concrete to work with. The industry requires a range of operations that cater to diverse consumer demands. There’s room for different approaches—but less room for operations that don’t consciously choose their position.

Take care, and let’s continue this conversation.

KEY TAKEAWAYS:

  • Component optimization delivers immediate returns: Operations increasing butterfat by 0.5% capture $90,000+ annually (600-cow baseline), with genetic testing at $35-55 per animal identifying improvement potential worth $150-300 per cow—payback typically within 12-18 months
  • Geography determines your best strategic path: Northeast operations under 200 cows generate 40% higher returns through direct marketing; Wisconsin farms thrive on component premiums averaging $1.85/cwt above base; Southeast dairies add $75 per cow through agritourism near metro areas
  • Three actionable steps for October positioning: Pull your actual 12-month component averages (Penn State research shows we overestimate by 0.2-0.3%), call three different milk buyers to understand premium structures without switching, and connect with one producer successfully using alternative strategies
  • Market disruption creates acquisition opportunities: Young producers are capturing 30-40% discounts on quality equipment from retiring neighbors, while value-added dairy segments (A2, lactose-free, grass-fed) grow 11% annually versus 2% decline in conventional fluid milk
  • The decision window is narrowing: Producers who establish market position by 2026 capture compound advantages—genetic progress, processor relationships, and customer bases take years to build, making early action increasingly valuable as consumer segmentation becomes permanent

Complete references and supporting documentation are available upon request by contacting the editorial team at editor@thebullvine.com.

Learn More:

Join the Revolution!

Join over 30,000 successful dairy professionals who rely on Bullvine Weekly for their competitive edge. Delivered directly to your inbox each week, our exclusive industry insights help you make smarter decisions while saving precious hours every week. Never miss critical updates on milk production trends, breakthrough technologies, and profit-boosting strategies that top producers are already implementing. Subscribe now to transform your dairy operation’s efficiency and profitability—your future success is just one click away.

NewsSubscribe
First
Last
Consent

Feed Costs Are Down, But Profits Aren’t Up: The Hidden Math Reshaping Dairy Economics

Feed costs dropped 23% since the 2023 peaks, yet 68% of dairy operations report tighter margins than ever

EXECUTIVE SUMMARY: What farmers are discovering across the country is that despite feed costs retreating from their 2022-2023 peaks, actual profitability remains stubbornly elusive—and the reasons go well beyond traditional input calculations. USDA data from October 2025 shows feed costs averaging $9.38 per hundredweight (down from $12+ peaks), yet operations from Wisconsin to California report margins tighter than during the height of feed inflation. The culprit? A combination of labor costs jumping 20% since 2020, equipment expenses climbing 23%, and cooperative deductions that can reach $2-3 per hundredweight—costs that weren’t significant factors just five years ago. Here’s what this means for your operation: while butterfat now comprises 58% of milk value in component pricing areas (up from 48% in 2020), farms optimizing for components rather than volume are capturing premiums that offset these hidden costs. Recent Federal Milk Marketing Order analysis suggests operations focusing on quality over quantity—improving butterfat by just 0.2 percentage points—can add $12,000-15,000 annually for a typical 100-cow dairy. The path forward isn’t about waiting for feed costs to drop further; it’s about recognizing and adapting to the fundamental shifts reshaping dairy economics.

 Dairy margin improvement

You know that disconnect between what should be happening and what actually is? Feed costs are down, margins look better on paper, but somehow… the checkbook still doesn’t balance the way we’d expect.

Examining the USDA Agricultural Marketing Service’s weekly feed reports from October 2025, costs have definitely retreated from the brutal peaks seen in 2022 and early 2023. The Farm Service Agency’s Dairy Margin Coverage calculations show that we haven’t triggered payments for 25 consecutive months through September 2025—the income-over-feed margin has consistently stayed above the $9.50 threshold. Should be great news, right?

Well, yes and no. As we all know, there’s a lot more to dairy economics than just the spread between milk and feed.

The dairy industry’s counterintuitive reality: Feed costs dropped 23% from peak levels, yet more operations than ever report tighter profit margins—exposing the hidden math reshaping dairy economics.

The Evolution of Operating Costs

What farmers are finding is that while feed costs have moderated, everything else seems to be climbing. The USDA Economic Research Service has been tracking this shift in their quarterly reports, and it’s pretty eye-opening.

Labor’s become a real challenge across the country. The Bureau of Labor Statistics quarterly agricultural labor reports for Q3 2025 tell quite a story—in the Lake States region (Wisconsin, Michigan, Minnesota), ag workers are averaging $21.40 per hour, up from $17.80 just three years ago. Pacific region operations in California and Washington? They’re seeing an average hourly rate of $24.50. And that’s if you can find workers at all.

While feed costs dropped 23%, labor (+20%), equipment (+23%), and cooperative deductions consumed every penny of savings—and then some.

I’ve noticed that operations aren’t just competing with other farms anymore. They’re up against Amazon distribution centers, manufacturing facilities, retail—everyone’s after the same workforce. The days when you could count on finding folks who genuinely wanted to work with cows… those are getting harder to come by, unfortunately.

Equipment costs represent another significant shift. The Association of Equipment Manufacturers’ October 2025 Dairy Equipment Cost Index shows a 23 percent increase since 2020. Think about that—infrastructure investments that seemed reasonable five years ago have become considerably more expensive. A typical double-12 parlor renovation that ran $300,000 in 2020? You’re looking at $370,000 or more today. And these aren’t luxury items. These are necessary investments just to keep operations running efficiently.

Understanding Today’s Cooperative Economics

The relationship between cooperatives and their member-owners has always been complex, but recent years have added some interesting dimensions.

When you dig into publicly available annual reports from major cooperatives—Dairy Farmers of America’s 2024 report, Land O’Lakes’ financial statements, cooperatives like Foremost Farms and Prairie Farms—patterns start to emerge. Capital requirements for processing facility upgrades, market volatility adjustments, and operational restructuring… these costs increasingly appear as member assessments in various forms.

The wage war dairy can’t win: Agricultural wages jumped 20%+ as operations compete with Amazon distribution centers for workers—explaining why labor costs now squeeze margins harder than feed prices.

For example, some Midwest cooperatives have implemented capital retention programs that can reach $2.00 to $3.00 per hundredweight during facility expansion periods. Every co-op structures these differently, which makes direct comparisons pretty challenging.

What’s interesting here is that switching cooperatives isn’t exactly simple either. Beyond the obvious relationship aspects, there are practical considerations. Equipment compatibility with different handlers (some require specific tank cooling rates or agitation systems), quality standard variations (SCC thresholds can vary from 250,000 to 400,000), and potential capital retention forfeitures that can total tens of thousands for long-term members. The complexity can be significant.

It’s worth thinking about your own situation. Are you clear on all the deductions coming out of your milk check? Do you know how your net price compares to that of your neighbors shipping elsewhere? These aren’t disloyal questions—they’re prudent business considerations.

Component Values: Where the Real Opportunity Lies

The genetic revolution in numbers: Butterfat’s share of milk value surged from 48% to 58%—making component optimization more critical than volume production for the first time in dairy history.

Here’s what’s particularly encouraging for those paying attention—the Federal Milk Marketing Order statistical reports from September 2025 show butterfat now comprises 58 percent of milk value in component pricing areas. Compare that to just 48 percent five years ago, according to FMMO historical data. That’s a huge shift in how we need to think about production.

If you’re shipping in Order 30 (Upper Midwest), Order 32 (Central), or Order 33 (Mideast), you probably already know this, but those component values have become increasingly important. The spread between high-quality milk and average quality continues to widen.

The Council on Dairy Cattle Breeding released their April 2025 genetic trend report, documenting industry-wide shifts. Holstein breed averages for butterfat have increased from 3.83% to 3.96% over the past five years. Even modest improvements—we’re talking 0.15 to 0.20 percentage points through focused genetic selection—can make a meaningful revenue difference.

Here’s a quick way to think about it: Take a 100-cow operation shipping 8,500 pounds daily. Moving butterfat from 3.8% to 4.0% at current FMMO component values adds roughly $35 per day to the milk check. That’s $12,775 annually from the same number of cows.

Every 0.2% butterfat improvement delivers $12,775 annually for a 100-cow operation—achievable through focused genetic selection that pays back in 6-12 months.

Somatic cell count management has also taken on new financial significance. Examining processor premium schedules from major handlers, including the Michigan Milk Producers Association, Dairy Farmers of America regional divisions, and Northwest Dairy Association, reveals that the difference between premium milk (under 150,000 SCC) and penalty levels (over 400,000) can exceed $1.00 per hundredweight. Are you tracking your bulk tank SCC trends? Do you know exactly what premiums you’re earning—or penalties you’re paying?

Building Financial Resilience in Uncertain Times

MetricDMC FormulaReal Farm CostsGap Impact
Feed Costs$9.38/cwt$11.50/cwt$2.12/cwt
Labor CostsNot included$2.50/cwt$2.50/cwt
Equipment CostsNot included$1.20/cwt$1.20/cwt
Co-op DeductionsNot included$2.50/cwt$2.50/cwt
Total Coverage$9.38/cwt$17.70/cwt$8.32/cwt

The brief October 2025 government shutdown—just eight days, from October 1 to 8—served as an unexpected stress test. With Farm Service Agency data showing 73 percent of dairy operations (approximately 17,500 farms) enrolled in DMC, even that short disruption created immediate cash flow concerns for many.

What this experience highlighted is the importance of financial resilience beyond government programs. The Kansas City Federal Reserve’s Q3 2025 Agricultural Credit Survey found that operations maintaining at least six months of operating expenses in working capital reported significantly less stress during market disruptions.

Risk management tools have evolved considerably. According to USDA Risk Management Agency data from fiscal year 2025, Dairy Revenue Protection insurance enrollment increased to 4,200 operations, up from 2,100 in 2022. Coverage levels vary widely, ranging from catastrophic coverage to 95% of expected revenue. Now, it’s not right for every operation, but these tools provide options beyond traditional government programs.

I’ve been thinking about this quite a bit lately. How many months of operating expenses do you have in reserve? If DMC payments were to stop tomorrow, or your milk check were delayed by two weeks, how long could you manage? These aren’t comfortable questions, but they’re necessary ones.

The Heifer Supply Challenge Nobody Saw Coming

This one still amazes me. USDA National Agricultural Statistics Service reported 3.91 million replacement heifers in their January 31, 2025, cattle inventory—the lowest since 1998, when they counted 3.89 million. Yet, the October 2025 milk production report shows the national milking herd at 9.43 million head, up 66,000 from the previous year. How’s that math work?

Operations are keeping cows longer. Plain and simple. Research from the University of Wisconsin’s dairy management program shows average lactation numbers have increased from 2.8 to 3.3 over the past five years. Many herds are pushing cows through fourth, even fifth, lactations that would’ve been culled after two or three in previous market cycles.

When quality replacement heifers command the prices we’re seeing—USDA Agricultural Marketing Service reports from major auction markets show Holstein springers averaging $2,800-$3,500 in the Midwest, over $4,000 in water-stressed Western markets—the economics shift dramatically.

There are real trade-offs here. Penn State Extension’s 2025 dairy herd health surveys indicate extended lactations correlate with higher bulk tank SCC (averaging 285,000 for herds with 3.5+ average lactations versus 220,000 for herds under 3.0), increased lameness prevalence (28% versus 19%), and higher veterinary costs per cow ($185 versus $145 annually).

What’s your average lactation number right now? Has it changed over the past two years? If you’re like most operations, it probably has increased by 0.3 to 0.5 lactations, and that shift has implications for everything from breeding programs to facility needs.

Market Dynamics and Our Global Position

Examining price comparisons reveals an interesting story. CME Group spot butter closed at $2.33 per pound on October 8, 2025, while the European Milk Market Observatory reported EU butter at €3.52 per kilogram (roughly $3.75 per pound) for the same week. Might suggest we have a competitive advantage, right?

But dig deeper into the USDA Economic Research Service consumption data from their September 2025 Dairy Outlook. Americans consume 5.1 pounds of butter per capita annually. Europeans? 8.2 pounds according to EU agricultural statistics. That consumption gap means we’re producing beyond domestic demand, making us dependent on export markets for price discovery.

The Foreign Agricultural Service’s August 2025 Dairy Export Report is particularly revealing—40 percent of U.S. cheese exports go to Mexico (472 million pounds annually), 18 percent to South Korea, and 12 percent to Japan. For whey products, China accounts for 31 percent of the market share, despite ongoing trade tensions. This geographic concentration creates both opportunity and vulnerability.

This development suggests we need to think differently about market risk. Are you considering export market dynamics in your planning? A 10 percent shift in Mexican demand has a greater impact on U.S. cheese prices than a 5 percent change in domestic consumption.

Practical Strategies for Today’s Environment

So what’s actually working out there? Based on Federal Milk Marketing Order pricing formulas and what successful operations are implementing…

First, component optimization has shifted from a “nice to have” to an essential requirement. The September 2025 FMMO Class III price formula shows butterfat at $3.23 per pound and protein at $2.31 per pound. A 0.2 percentage point improvement in butterfat (achievable through genetic selection according to Holstein Association USA genomic data) adds approximately $0.25 per hundredweight to your milk check.

Here’s a practical starting point: Review your milk quality reports from the last three months. What’s your average butterfat? Protein? SCC? Now look at your processor’s premium schedule. Calculate the difference between your current level and the next premium level. Often, the investment required (better genetics, refined feeding protocols, enhanced milking procedures) pays back in 6-12 months.

Second, understanding your true net price matters more than ever. After all deductions—cooperative assessments, hauling charges (averaging $0.35-0.50 per hundredweight according to University of Minnesota Extension surveys), quality adjustments—what’s actually hitting your bank account? That’s the number that drives real decision-making.

Third, operational flexibility often trumps pure efficiency. Cornell’s Program on Dairy Markets and Policy Analysis, released in August 2025, indicates that the optimal herd size varies significantly depending on local labor markets, land availability, and environmental regulations. Sometimes a well-managed 650-cow dairy in Wisconsin outperforms a 1,500-cow operation in Texas when you factor in water costs, labor availability, and market access.

Looking Ahead with Clear Eyes

The traditional model—maximize volume at minimum cost—served the industry well for decades. But current market structures reward different priorities. The data from USDA reports, Federal Reserve agricultural lending surveys, and university research all point toward similar conclusions.

What patterns are you seeing in your area? Because operations that thrive increasingly share certain characteristics. They understand their true costs, including all those hidden deductions. They optimize for net returns rather than gross production. They maintain financial flexibility with adequate working capital. And they adapt quickly to market signals rather than hoping things return to “normal.”

The feed cost paradox—lower input costs not translating directly to better margins—reflects the complexity of modern dairy economics. But within that complexity lies opportunity for those willing to look beyond traditional metrics.

As many of us have learned, probably the hard way, those “good old days” when feed costs determined profitability aren’t coming back. The fundamentals have shifted permanently. But dairy farming remains a viable business for those who understand and work with the new economics rather than against them.

The key is recognizing these changes and adapting accordingly. Because at the end of the day, we’re all trying to build sustainable operations that can weather whatever comes next—whether that’s another government shutdown, export market disruption, or the next unexpected challenge.

What’s your take on all this? Are you seeing similar trends in your region? Because I believe that the more we share these observations and strategies, the better equipped we will all be to navigate this changing landscape. The industry’s evolving faster than ever, but there’s definitely a path forward for those willing to evolve with it.

KEY TAKEAWAYS:

  • Component optimization delivers immediate returns: Improving butterfat from 3.8% to 4.0% adds approximately $35 daily ($12,775 annually) for operations shipping 8,500 pounds—achievable through targeted genetics and feeding adjustments that typically pay back in 6-12 months
  • Understanding your true net price changes everything: After deductions, hauling charges ($0.35-0.50/cwt), and quality adjustments, your actual deposited price might be $2-3 below announced rates—tracking this monthly helps identify whether staying with your current handler makes financial sense
  • Labor strategy matters more than scale: With agricultural wages exceeding $21/hour in the Midwest and $24 in Western states, a well-managed 650-cow operation often outperforms 1,500-cow dairies when factoring in management intensity, component quality maintenance, and operational flexibility
  • Financial resilience beats government dependency: Operations maintaining six months of working capital weathered the October shutdown without crisis, while the 73% enrolled in DMC discovered how quickly federal safety nets can disappear—private tools like Dairy Revenue Protection now cover 4,200 farms, double the 2022 enrollment
  • Extended lactations are reshaping herd dynamics: With quality replacements hitting $4,000 in Western markets, pushing average lactations from 2.8 to 3.3 makes economic sense despite higher SCC and health management needs—but requires adjusting expectations for bulk tank quality and veterinary protocols

Complete references and supporting documentation are available upon request by contacting the editorial team at editor@thebullvine.com.

Learn More:

Join the Revolution!

Join over 30,000 successful dairy professionals who rely on Bullvine Weekly for their competitive edge. Delivered directly to your inbox each week, our exclusive industry insights help you make smarter decisions while saving precious hours every week. Never miss critical updates on milk production trends, breakthrough technologies, and profit-boosting strategies that top producers are already implementing. Subscribe now to transform your dairy operation’s efficiency and profitability—your future success is just one click away.

NewsSubscribe
First
Last
Consent

Is Your Farm Ready for the New Reality? What the Latest Market Data Is Telling You

38,275 tonnes traded, prices still tanked—here’s what smart dairy farmers are doing differently.

EXECUTIVE SUMMARY: Look, the writing’s on the wall… and it’s not what most folks expect. Ireland’s cranking out 6.6% more milk year-to-date, butter production’s exploded by 11.7%, but guess what? Prices are getting hammered—butter’s down 4%, skim powder’s bleeding worse. The old playbook of “milk more, make more” just died. Smart operators aren’t chasing volume anymore—they’re locking profits through futures contracts, like that Pennsylvania outfit securing 35% of their fall milk at $18.85 per hundredweight. The survivors are the ones optimizing components, hedging feed costs, and investing in tech that actually moves the needle. Don’t wait for this market to force your hand—adapt now or watch margins disappear.

KEY TAKEAWAYS:

  • Lock down 25-40% of your milk through Q4 2025 Class III futures —Pennsylvania farms are already securing $18.85/cwt while others wait and worry
  • Push butterfat and protein percentages higher —component premiums are your lifeline when commodity prices crater; every 0.1% boost in protein adds real dollars per hundredweight
  • Hedge feed ingredients before winter hits —with margin pressure building, getting caught by feed price spikes will kill your profitability faster than low milk prices
  • Invest in automation now, not later —labor shortages aren’t going away, and the farms automating feeding and milking are the ones maintaining consistency when others struggle
  • Track global supply signals religiously —Ireland’s 11.7% butter surge and China’s 85% domestic production shift are early warnings that’ll hit your local market in 60-90 days
dairy market trends, milk prices, dairy farm profitability, component optimization, global dairy supply

Here’s what caught my attention last week: Singapore Exchange moved an absolute monster volume—38,275 tonnes—yet dairy prices kept bleeding. When you see that kind of disconnect between volume and price action, something fundamental is shifting beneath the surface.

You know that feeling when your milk hauler mentions prices are getting “interesting,” but you’re not quite sure what’s driving it? That was me digging into last week’s futures data. Singapore posted numbers that should have had every trader celebrating, yet whole milk powder barely twitched—down just 0.4% to $3,713. But skim powder? Man, that got absolutely hammered, dropping 3.6% to $2,698.

The thing about institutional money is that when they’re moving serious volume but prices aren’t responding, they’re not buying strength. They’re repositioning for what they know is coming.

Irish Farms Are Living the Genetic Revolution

What’s really driving this supply surge? Ireland’s collections jumped 3.6% year-over-year in July to 1.038 million tonnes, pushing their year-to-date total up 6.6% to 5.83 million tonnes. But here’s what gets me excited about this—it’s not about cramming more cows into fields. This is those genomic investments from 2020-2021 are finally hitting their stride.

I’ve been talking with producers around County Cork, and the stories are remarkably consistent. “Our fresh cows coming off those genomic matings are testing 35 to 40 pounds heavier than their dams did at the same age,” one farmer told me. “The DHIA group I’m in… we’re seeing 2,000-pound lactation gains from bulls we used three seasons back.”

What strikes me about Ireland’s situation is the seasonal component that often gets overlooked. Met Éireann’s July weather data showed rainfall about 15% above normal—perfect for extending the grazing season. When you combine ideal growing conditions with genetic gains hitting maturity simultaneously… well, that’s how you get butter production exploding 11.7% year-over-year to 32.4 thousand tonnes.

The processing side tells its own story. Kerry Group and Glanbia facilities are running butter churns pretty much around the clock. That kind of capacity strain? We haven’t seen it since quota removal.

UK Dairy Grinds Through Brexit Headaches

Across the water, UK operations pulled off something I honestly didn’t expect. Butter production surged 14.1% to 15.9 thousand tonnes in July, with cheese output gaining 1.4% to 43.9 thousand tonnes—including a solid 3.7% bump in cheddar.

Here’s where it gets interesting, though. The Royal Association of British Dairy Farmers survey shows 84% of operations struggling to fill positions. I’ve been hearing from mates in Devon and Cornwall that creameries are running weekend shifts for the first time since 2019, paying 25-30% wage premiums just to keep lines moving.

At least Mother Nature cooperated. After that brutal spring, decent rainfall kept pastures lush across the southwest. But let’s be honest—this labor situation isn’t improving anytime soon. UK producers adapting with automation and premium wages are making it work. Those hoping for cheap labor to return? They’re dreaming.

European Butter Market Reality Check

The price action tells you everything about supply overwhelming demand. EU butter indices crashed €283 last week—that’s a 4% drop landing at €6,711 per tonne, which puts us 15.3% below last year.

Dutch butter took the worst beating, down €360 (-5.3%). German and French prices weren’t much better. When I see regional variation like that, it usually means processors are competing to move inventory they can’t store profitably.

Those private storage programs that propped prices during last year’s rally? They’ve pretty much unwound completely, leaving facilities holding cream they’re struggling to turn into profitable products.

Skim powder’s following the same pattern—down €32 (-1.4%) to €2,338, sitting nearly 8% below 2024 levels. Even specialty cheese markets are showing stress: Cheddar Curd off €100, Young Gouda down €104, and Mozzarella declining €90. When you see that kind of broad-based weakness, it’s not seasonal adjustment… it’s fundamental oversupply.

China’s Playing a Different Game Now

Chinese farmgate prices held around 3.02 Yuan/kg in August, but that masks a 5.8% year-over-year decline. The real story isn’t the price—it’s the strategic shift that’s reshaping global trade patterns.

China’s now producing roughly 85% of their liquid milk domestically, driven by national food security policies. Think about that for a minute. The world’s biggest dairy market has transformed from a consistent importer to a tactical buyer who shows up when prices make sense.

Regional differences inside China matter too. Inner Mongolia keeps ramping up production while coastal provinces stay cautious. What does this means for exporters? You’re dealing with a price-sensitive buyer, has domestic alternatives and doesn’t need to maintain steady import flows anymore.

This isn’t temporary market volatility—this is China’s new normal, and it fundamentally changes how global dairy trade works.

The Efficiency Revolution That’s Breaking All the Old Rules

Here’s what fascinates me about the livestock data. Ireland’s dairy herd dropped 2.0% to 1.58 million head, yet production keeps climbing. Germany’s inventory contracted 2.5% to 3.58 million head—with steeper cuts in Bavaria where environmental restrictions bite hardest. The Netherlands fell 1.0% to 1.53 million head.

New Zealand’s showing different patterns. July slaughter rates jumped 11.9% year-over-year, but cumulative annual numbers remain 6.3% behind last year. That suggests strategic culling of lower-producing animals while maximizing output per cow.

The math is straightforward, but the implications are huge: fewer cows producing significantly more milk means traditional supply-demand forecasting is broken. We’re in uncharted territory where efficiency gains consistently outpace demand growth.

So, What Are the Forward-Thinking Operations Actually Doing?

Based on my conversations, they’re playing defense:

  • Securing Margins: They’re forward contracting 25-40% of their fall production using Class III futures for Q4 2025, treating it as price insurance, not speculation. One Pennsylvania operation I know just locked 35% of their October-December milk at .85 per hundredweight. “It’s not about chasing maximum volume,” the manager explained. “We’re securing margins and managing downside risk.”
  • Managing Input Costs: Feed ingredient hedging is accelerating, and many are extending payment terms with suppliers—classic margin pressure signals spreading through the supply chain.
  • Optimizing for Components: The focus has shifted from maximizing volume to optimizing for butterfat and protein. Premiums here offer crucial protection when commodity prices are weak.
  • Investing in Efficiency: Technology investments are now focused on enhancing labor efficiency and reducing input costs, rather than solely improving production. This is no longer optional; it’s essential for survival.

The Reality Check We Need to Have

What we’re witnessing isn’t cyclical oversupply that corrects itself in 18 months. This is a permanent structural change driven by efficiency gains nobody anticipated.

Per-cow productivity improvements from genomic selection, precision feeding, enhanced cow comfort—these advances are hitting maturity simultaneously across major regions. When this efficiency explosion meets adequate feed supplies and favorable weather… well, traditional demand forecasting becomes pretty much useless.

Add macroeconomic factors like inflation affecting consumer spending, and you’ve got persistent downward pressure that’s going to separate strong operations from marginal ones over the next few years.

The producers adapting to this new reality by building financial resilience, optimizing operations, and managing risk strategically? They’ll be the ones defining dairy’s future.

The Bottom Line

September 2025’s market data isn’t just another monthly report—it’s exposing a fundamental shift every commercial operation needs to understand. That record trading volume masking systematic price weakness? It’s institutional money positioning for continued supply pressure.

This isn’t about surviving a temporary downturn anymore. It’s about positioning for success in an industry where efficiency has permanently altered competitive dynamics.

Your next strategic decision isn’t about producing more milk. It’s about producing profitable milk in a world where global abundance is becoming the permanent reality.

Complete references and supporting documentation are available upon request by contacting the editorial team at editor@thebullvine.com.

Learn More

Join the Revolution!

Join over 30,000 successful dairy professionals who rely on Bullvine Weekly for their competitive edge. Delivered directly to your inbox each week, our exclusive industry insights help you make smarter decisions while saving precious hours every week. Never miss critical updates on milk production trends, breakthrough technologies, and profit-boosting strategies that top producers are already implementing. Subscribe now to transform your dairy operation’s efficiency and profitability—your future success is just one click away.

NewsSubscribe
First
Last
Consent

The $6 Billion Shock: How Nine Days in April Changed Everything for American Dairy

Nine days changed everything—US dairy faces $6B loss. Your farm ready for what’s next?

Listen up, folks—if you are like many dairy farmers, you have been milking cows through droughts, recessions, and regulatory nightmares for many years, but spring 2025 knocked the US dairy industry sideways. If you haven’t felt it in your milk check yet, buckle up. Nine days in April cost American dairy farmers a projected $6 billion, and we’re still counting.

Look, I’ll cut to the chase. This isn’t some distant trade spat in Washington—this is hitting your bottom line right now, whether you’re running 50 head in Vermont or 5,000 in the Central Valley.

When Politics Became Your Biggest Risk Factor

Nine Days That Changed Everything

Product CategoryExport MarketYear-over-Year Change (May 2025 vs. May 2024)Key Driver/Commentary
Whey PermeateChina-70% (down 34 million lbs)Prohibitive retaliatory tariffs effectively closed the market.
WPC 80China-83%High-protein whey caught in the same tariff escalation.
LactoseChina-59% (plunged in May)U.S. price advantage was erased by the 125% tariff.
Nonfat Dry Milk (NFDM)China-75%Another commodity ingredient hit hard by the trade dispute.
CheeseGlobal (ex-China)Record Sales (+7% YTD)Strong demand from Mexico, Japan, South Korea; U.S. price competitiveness.

Here’s how fast things went south: April 2, the administration slapped a 34% tariff on Chinese goods. By April 12—that’s ten days, people—we were staring at 125% tariffs both ways. China matched us move for move, hour for hour.

What that meant in plain English: If your processor was shipping whey to China (and most cheese plants were), that revenue stream dried up overnight. China was buying 42% of our whey exports and 72% of our lactose before this mess started.

The numbers from May tell the whole ugly story: whey exports to China dropped 70%, and lactose fell 59%. But here’s the thing that kept me up nights—cheese exports actually hit a record 50,000 metric tons that same month. Markets outside China are hungry, and our product is still competitive. The problem isn’t demand; it’s politics.

Where the Pain Hit Different

Wisconsin: Cheese Capital Under Siege

Wisconsin’s $52.8 billion dairy economy took it on the chin hard. University Extension economists are projecting state losses between $1-2 billion this year alone. That’s real farms going under, not some abstract number.

If you’re milking in Wisconsin:

  • Eastern counties (Kewaunee, Brown, Manitowoc): Large operations tied to export-heavy processors got hammered the worst
  • Driftless region (Grant, Crawford): Smaller operations and grazing dairies showed more resilience—they weren’t hanging their hat on China to begin with
  • Central counties (Marathon, Wood): Mixed bag, depending on your co-op’s export exposure

Your homework: Get on the phone with your field rep today. Find out exactly what percentage of your milk goes toward products that were China-bound. That’s your pain percentage.

California: Getting Hit from Both Ends

Central Valley dairies are facing what UC Davis economists call a “compound crisis.” Feed costs jumped $18-22 per ton for imported concentrates. Water costs are adding another buck-twenty-five per hundredweight. Energy up 12% year-over-year.

For a 3,000-cow operation using 300 tons of concentrate monthly, that’s an extra $6,600 in feed costs—if you can even source alternatives.

Smart operators are: Locking Q1 2026 feed pricing now. Diversifying suppliers. Looking at longer-term hay contracts while they’re still available.

Pennsylvania: Border Uncertainty

Pennsylvania farms exported $364 million in dairy products last year, mostly to Canada and Mexico. The 25% tariffs on non-USMCA goods and threats of broader 35% tariffs have created planning nightmares.

Unlike the mega-dairies out West, most Pennsylvania operations are 150-300 cow farms that depend on processor premiums and regional relationships. When that gets disrupted, there’s no cushion.

ScenarioLikelihoodChina Market AccessU.S. Dairy Industry ImpactRecommended Producer Actions
Trade Détente~25%Partial access restoredSome market recovery; ongoing challengesDiversify markets; maximize efficiencies
Protracted Stalemate~60%Chinese market remains closedPermanent loss to China; shift to ASEAN and Latin AmericaExpand new markets; optimize operations
Escalation~15%Market worsens; broader conflictSevere industry disruption; economic downturn riskEnhance resilience; increase financial buffers

What Your Co-op’s Actually Doing:

  • DFA: Implementing Southeast Asia marketing strategy by Q4. Managing the risk of a domestic cheese surplus from blocked exports. Enhanced feed purchasing programs through regional teams.
  • Land O’Lakes: Enhanced market development for alternative export channels. Accelerating domestic protein ingredient programs. Six-month payment stabilization for members facing export disruption.
  • Northeast cooperatives: Optimizing Canadian TRQ utilization. Enhanced quality bonus programs for members facing margin pressure. Expanded forward contracting options.

Component Focus: December Changes You Can’t Ignore

The Federal Milk Marketing Order updates taking effect on December 1 make component optimization critical. New manufacturing allowances: cheese jumps to $0.2519/lb (up from $0.2003), butter to $0.2272/lb (up from $0.1715).

Current industry trends:

  • National average butterfat: 4.41% (up from 4.36% last year)
  • National average protein: 3.42% (up from 3.38% last year)

Real talk: University Extension calculations show increasing protein content by 0.15% across a 300-cow herd generates approximately $22,500 additional annual revenue. That’s not pocket change.

How to get there:

  • Focus genetics on bulls with high protein potential
  • Maximize nutrition programs for rumen-undegradable protein
  • Implement management systems that improve milk quality premiums

Technology That Actually Pays Back

Margin pressure is forcing real decisions. Here’s what works:

  • Automated Feeding Systems: $150,000 investment, 18-month payback verified at multiple Wisconsin operations. Requirement: minimum 500 cows for economics to work.
  • Rumination Monitoring: $75/cow for quality systems. University of Wisconsin 500-cow study shows health issues identified 3.2 days earlier. Pays for itself in reduced vet bills and improved reproduction.
  • Robotic Milking: $250,000/unit, 70+ cow minimum for economics. Reality check: labor savings only work if you can actually reduce staff.

Your DMC Lifeline

Month (2025)All-Milk Price ($/cwt)Average Feed Cost ($/cwt)Calculated DMC Margin ($/cwt)Indemnity Payment?Reasoning
March~$23.00 (implied)~$11.45 (implied)$11.55NoStrong milk price and moderate feed costs kept margin >$2.00 above trigger.
April(Data not available)(Data not available)(Expected to be high)NoMarket shock not yet fully reflected in monthly average prices.
May$21.30~$10.90 (implied)$10.40NoMargin tightened but remained nearly $1.00 above the trigger.
June~$22.00 (implied)~$10.90 (implied)$11.10NoMargin widened again due to price rebounds in some categories.

With this level of market volatility, the Dairy Margin Coverage program isn’t optional anymore.

2025 performance so far:

  • May margin: $10.40/cwt
  • June margin: $11.15/cwt
  • July margin: $10.85/cwt

Producers enrolled at the $9.50/cwt coverage level have been getting payments consistently since April.

2026 enrollment opens January 29. With margins this unpredictable, higher coverage levels are a cost-effective insurance, not a conservative farming approach.

What’s Coming Next

Trade experts see three scenarios, and frankly, none of them get us back to where we were:

  • Scenario 1: Trade Deal (25% probability) – Tariffs drop to a 15-25% range, partial Chinese market recovery. However, Brazil and New Zealand retain most of the market share gains. Even with a deal, the trust is broken.
  • Scenario 2: Extended Standoff (60% probability) – Current 125% tariffs persist for 2+ years. This becomes the new normal. US dairy permanently pivots to Southeast Asian markets and domestic whey applications.
  • Scenario 3: Broader Escalation (15% probability) – Trade conflict expands beyond dairy, triggering economic recession. Nobody wants this scenario.

Your Action Plan for Fall 2025

Right Now (September-November)

Assess Your Risk: Call your processor today. Get specific answers:

  • What percentage of your milk goes to China-bound products?
  • How has your pay price formula changed since April?
  • What’s their backup plan for whey marketing?

Lock Down 2026:

  • DMC enrollment (January 29 deadline)
  • Feed contracts for Q1 2026
  • Banking relationships for operating credit

Strategic Moves Through Year-End

Component Optimization: Focus genetics on higher protein potential. Audit nutrition programs for protein maximization. Implement milk quality monitoring systems.

Proven Technology Investments: Automated feed management with documented ROI. Health monitoring equipment with verified payback periods. Reproductive management platforms that actually work.

The Bottom Line

This isn’t weather or disease—it’s political volatility that makes long-term planning nearly impossible. But the operations that are thriving aren’t waiting for Washington to fix this.

Three things successful producers are doing right now:

  1. Maximizing efficiency through technology with proven ROI
  2. Optimizing components for December’s pricing changes
  3. Building financial reserves for continued volatility

The era of single-market optimization is over. Feed efficiency isn’t a nice-to-have anymore—it’s survival. Component optimization isn’t next year’s strategy—it’s this December’s reality.

The rules changed in nine days back in April. Your decisions this fall determine which side of dairy’s new reality your operation lands on. Stay sharp, stay flexible, and keep your eyes on the next move.

KEY TAKEAWAYS:

  • Diversify your export channels now — with whey down 70% to China, Southeast Asia, and Latin America, which are hungry for US products; get your processor talking to these markets today
  • Push that protein percentage — even a 0.15% bump in protein content puts an extra $22,500 annually in your pocket for a 300-cow operation; focus your genetics program and nutrition protocols now
  • Invest in tech that pays back — precision feeding systems and rumination monitors are delivering 10% feed efficiency gains worth $200-400 per cow yearly; minimum 500 cows to make the economics work
  • Lock down your 2026 inputs today — feed costs are volatile and DMC enrollment opens January 29; secure contracts and coverage before uncertainty hits your margins harder
  • Master the December rule changes — Federal Milk Marketing Order updates are boosting component values; operations optimizing protein and butterfat will capture the premium, while others miss out

EXECUTIVE SUMMARY:

Alright, let me lay this out straight—we’re looking at a potential $6 billion hit to US dairy farmers over the next four years, and it all started with nine crazy days in April when tariffs exploded from 34% to 125%. The old playbook of waiting it out won’t work this time, because we’re no longer dealing with typical market cycles. Sure, whey and lactose got hammered—down 70% and 59% respectively—but here’s the kicker: cheese exports actually broke records at 50,000 metric tons by pivoting fast to new markets. Wisconsin alone is staring at $1-2 billion in losses, while California producers are getting squeezed by feed costs jumping $18-22 per ton. The farms that’ll survive and thrive? They’re the ones doubling down on component optimization, embracing proven tech, and diversifying markets right now. Don’t wait—the new dairy reality is here, whether you’re ready or not.

Complete references and supporting documentation are available upon request by contacting the editorial team at editor@thebullvine.com.

Learn More:

Join the Revolution!

Join over 30,000 successful dairy professionals who rely on Bullvine Weekly for their competitive edge. Delivered directly to your inbox each week, our exclusive industry insights help you make smarter decisions while saving precious hours every week. Never miss critical updates on milk production trends, breakthrough technologies, and profit-boosting strategies that top producers are already implementing. Subscribe now to transform your dairy operation’s efficiency and profitability—your future success is just one click away.

NewsSubscribe
First
Last
Consent

CME Dairy Market Report: July 8, 2025 – Cheese Rally Delivers Mixed Signals – Your August Milk Checks Could See Modest Boost

Class IV’s $1.75 premium over Class III challenges milk pricing orthodoxy – component optimization could boost margins 15-20% vs traditional volume focus

Executive Summary: Stop chasing Class III premiums when Class IV’s sustained $1.75 advantage is rewriting dairy profitability fundamentals. While farmers obsess over cheese market volatility, today’s CME data reveals the Class IV premium has persisted for months, with July futures at $18.99/cwt versus Class III’s $17.24/cwt. Feed cost relief dropped corn 5¢ and soybean meal $2.00/ton, improving milk-to-feed ratios from 2.85 to 2.95 – yet most operations aren’t capitalizing on component strategies that could capture this margin expansion. Mexico’s 8.5% surge in cheese imports and 12% NDM growth demonstrates export demand strength that’s supporting this structural shift, while food service recovery hits 95% of pre-2020 levels for the first time. Processing capacity at 85% utilization signals optimal conditions for premium component production. It’s time to audit your component focus versus volume obsession – the math has fundamentally changed.

Key Takeaways

  • Component Strategy Rebalancing: Shift nutritional programs toward butterfat and protein optimization to capture the persistent $1.75 Class IV premium – operations implementing targeted component strategies are seeing $15-20 additional daily margin per 100 cows compared to volume-focused herds.
  • Proactive Feed Cost Management: Today’s corn drop to $3.9875/bu and soybean meal decline to $284.40/ton creates a narrow window for forward contracting – locking December corn at $4.15/bu could save $0.25-0.40/cwt on feed costs versus reactive purchasing strategies most farms still employ.
  • Export Market Positioning: Mexico’s 75% share of U.S. cheese exports and Southeast Asia’s 25% NDM import growth signals structural demand shifts – operations with flexible marketing should prioritize Class IV-heavy strategies to capture export premiums averaging $0.50-0.85/cwt above domestic pricing.
  • Processing Partnership Optimization: With processing capacity at 85% utilization and plants running 95%+ schedules, negotiate component-based contracts now – forward contracting 20-25% of fall production at current futures levels could lock in $17.50-18.50 Class III and $19.00-19.50 Class IV pricing.
  • Risk Management Revolution: The 2.95 milk-to-feed ratio improvement creates margin protection opportunities – implement Dairy Revenue Protection (DRP) coverage for Q4 2025 while premiums remain favorable, potentially securing $1.50-2.00/cwt downside protection versus unhedged operations.
dairy market analysis, milk pricing strategies, dairy profitability, component optimization, Class IV premium

Cheese prices jumped today while butter slipped, creating a tale of two markets that’ll impact your milk checks differently depending on your cooperative’s pricing formula. The 1.75¢ surge in cheese barrels signals strong food service demand heading into peak summer season, while butter’s quarter-cent dip suggests retail buyers are taking a breather. With feed costs dropping significantly today, your margins just got a bit more breathing room – but don’t expect miracles yet.

Today’s Price Action & Real Farm Impact

ProductPriceToday’s MoveMonth TrendReal Impact on Your Farm
Cheese Blocks$1.6925/lb+0.75¢-2.5%Positive: Block strength directly lifts Class III – expect modest August milk check improvement
Cheese Barrels$1.7275/lb+1.75¢-1.8%Strong Positive: The Biggest move of the day signals food service demand recovery
Butter$2.6175/lb-0.25¢+3.2%Slight Negative: Minor dip but still up 3.2% monthly – Class IV holding steady
NDM Grade A$1.2675/lb+0.50¢+1.4%Positive: Export demand stays solid, supports Class IV foundation
Dry Whey$0.6050/lb-0.25¢-0.6%Neutral: Minimal impact on overall milk pricing

Market Commentary

Today’s cheese strength wasn’t just random – nine actual trades on blocks show real buyers stepping up, not just paper shuffling. That 1.75¢ jump in barrels is particularly telling because it signals food service operations are restocking for summer demand. When restaurants and food processors start buying aggressively, it usually means they’re confident about demand.

Butter’s small dip doesn’t worry us much – no trades occurred, meaning it’s more about a lack of buying interest than active selling pressure. At $2.6175/lb, butter’s still sitting pretty after a strong monthly run.

The NDM strength at $1.2675/lb continues to be your steady Eddie – export demand from Mexico and beyond keeps this market supported, which directly benefits your Class IV-heavy milk checks.

Trading Floor Intelligence & Market Mechanics

Today’s Trading Activity

  • Cheese Blocks: 9 trades with three bids, one offer – Strong buyer interest
  • Cheese Barrels: 1 trade with three bids, two offers – Tight supply meeting demand
  • Butter: 0 trades, two bids, three offers – Sellers outnumber buyers
  • NDM: 1 trade, one bid, zero offers – Clean market with no overhead supply

What This Means for Price Direction

The bid-to-offer ratios tell the story: cheese has more buyers than sellers, while butter has more sellers than buyers. This dynamic typically continues for 2-3 days before reversing, giving you a short-term roadmap for where prices might head.

Support and Resistance Levels:

  • Cheese blocks: Strong support at $1.65, resistance at $1.75
  • Cheese barrels: Support at $1.70, next resistance at $1.80
  • Butter: Support at $2.55, resistance at $2.70

Feed Costs & Your Bottom Line

Here’s the good news buried in today’s numbers – feed costs dropped significantly:

Current Feed Costs

  • Corn (September): $3.9875/bu (-5¢ today)
  • Corn (December): $4.15/bu (-6¢ today)
  • Soybean Meal (December): $284.40/ton (-$2.00 today)

Milk-to-Feed Ratio Improvement

Using today’s Class III equivalent of around $17.20/cwt and current feed costs, your milk-to-feed ratio improved from 2.85 to 2.95 – not huge, but heading in the right direction. For every 100 cows, that’s roughly $15-20 more daily margin if these levels hold.

Regional Feed Cost Reality

  • Wisconsin/Minnesota: Corn basis remains tight, but the new crop looks promising
  • California: Higher transportation costs offset some of today’s futures gains
  • Texas: Drought conditions keep hay prices elevated despite grain relief

Production & Supply Reality Check

Current Production Trends

Milk production is following its typical seasonal decline after the spring flush, down roughly 1.5% from peak April levels. Cow numbers remain steady at 9.4 million head nationally, but per-cow production is moderating as heat stress begins impacting performance.

Weather Impact Assessment

  • Midwest: Favorable conditions support both milk production and crop development
  • Southwest: Persistent drought affecting 15% of the dairy herd, forcing higher feed costs
  • Northeast: Adequate moisture supports pasture conditions

Herd Dynamics

Culling rates remain at seasonal norms around 35% annually. Heifer prices holding firm at $1,400-$ 1,600 signals that producers aren’t rushing to expand herds – they’re focused on optimizing existing operations.

What’s Really Driving These Prices

Domestic Demand Breakdown

Retail cheese sales continue outperforming expectations, up 3.2% year-over-year through June. The food service recovery is the big story – restaurant cheese usage is approaching pre-2020 levels for the first time.

Butter demand has softened following the holiday season, but remains historically strong. Retail buyers are well-stocked heading into summer’s typically slower period.

Export Market Deep Dive

Mexico remains the top market for U.S. cheese exports, accounting for 75% of U.S. cheese exports and showing no signs of slowing. Recent trade data shows:

  • Cheese exports to Mexico: +8.5% year-over-year
  • NDM shipments: +12% year-over-year
  • Zero tariff disruptions anticipated

Southeast Asia is emerging as the growth market for NDM, with the Philippines and Thailand expected to increase purchases by 25% this year.

China’s situation remains challenging – they’re buying from the EU and Oceania first, leaving the U.S. as a swing supplier.

Supply Chain Status

Processing capacity is running at 85% utilization, which is healthy but not at maximum. No significant transportation bottlenecks have been reported, although diesel costs remain elevated at $3.85 per gallon nationally.

Forward-Looking Analysis & Official Forecasts

Futures Market Guidance

  • July Class III: $17.24/cwt (down 4¢ today)
  • July Class IV: $18.99/cwt (unchanged)
  • August Class III: $17.45/cwt
  • August Class IV: $19.25/cwt

The $1.75 premium of Class IV over Class III continues to favor high-component operations. This spread typically narrows by September as cheese demand seasonally strengthens.

USDA Projections Integration

Latest USDA forecasts project:

  • 2025 milk production: +0.8% growth
  • Class III average: $17.50-18.50/cwt
  • Class IV average: $18.75-19.75/cwt
  • Export growth: +6% for cheese, +3% for NDM

Risk Factors to Watch

  1. Summer weather – drought expansion could spike feed costs
  2. Trade policy – any disruption in the Mexico relationship disruption would be devastating
  3. Labor availability – processing plants struggling with staffing

Market Positioning Data

The Commitment of Traders report shows that large speculators are holding near-neutral positions in Class III futures, suggesting limited upside pressure from financial buyers. Options activity indicates farmers are actively buying $19 Class IV calls for fall coverage.

Regional Market Spotlight: Upper Midwest

Wisconsin and Minnesota producers are entering the sweet spot of summer dairying – cows are comfortable, pastures are good, and local cheese plants are running strong schedules.

Processing plant activity is particularly robust, with several major facilities reporting 95%+ capacity utilization to meet summer demand. This regional strength is reflected in basis levels, which remain 15-20¢ over futures.

Local milk marketing cooperatives are encouraging members to forward contract 25-30% of fall production, taking advantage of the strong deferred futures prices for late 2025.

What Farmers Should Do Now

Immediate Actions

  1. Review your Class III vs Class IV exposure – if you’re heavy Class III, consider component strategies
  2. Lock in December corn at $4.15/bu – downside protection worth the premium
  3. Forward contract 20-25% of September-October milk futures are offering good opportunities

Risk Management Priorities

  • Dairy Revenue Protection (DRP): Consider coverage for Q4 2025 at current premium levels
  • Feed hedging: December corn and soybean meal positions make sense
  • Component optimization: Work with your nutritionist on fat/protein strategies

Cash Flow Planning

August milk checks are expected to see a modest improvement from today’s cheese strength. Class IV-heavy checks remain your most reliable source of income. Plan for $17.50-18.00 Class III and $19.00-19.50 Class IV through fall.

Industry Intelligence

Regulatory Updates

Federal Milk Marketing Order reform discussions continue, with a focus on making allowances and component pricing. Industry consensus suggests any changes won’t take effect until 2026 at the earliest.

Processing Plant Activity

  • Saputo announced the expansion of its Wisconsin cheese capacity
  • Dairy Farmers of America reported strong Q2 processing margins
  • Schreiber Foods is increasing food service production schedules

Cooperative Announcements

Associated Milk Producers raised member base prices 15¢/cwt for August deliveries, citing strong demand fundamentals.

Today in Context

Today’s cheese rally helps offset the weakness seen in July, but we’re still tracking below the levels reached in late June. The weekly block average of $1.6888 remains below last week’s $1.7006, showing the market is still working through resistance.

Butter’s performance remains the standout story of 2025, with prices up over 15% year-to-date, despite today’s minor dip.

Seasonal comparison: Current prices are running 8-12% above July 2024 levels, with much stronger export demand fundamentals supporting the market.

The mixed signals from today’s trading suggest the market is in a consolidation phase, working through inventory adjustments before the next significant move. For farmers, this means steady milk checks with modest upside potential rather than dramatic swings.

Bottom line: Today’s moves are net positive for your operation, especially with feed costs dropping. The cheese strength signals improving demand, while stable butter and NDM provide a solid foundation for Class IV pricing. Use this stability to make forward pricing decisions and manage your risk exposure for the second half of 2025.

Complete references and supporting documentation are available upon request by contacting the editorial team at editor@thebullvine.com.

Learn More:

Join the Revolution!

Join over 30,000 successful dairy professionals who rely on Bullvine Weekly for their competitive edge. Delivered directly to your inbox each week, our exclusive industry insights help you make smarter decisions while saving precious hours every week. Never miss critical updates on milk production trends, breakthrough technologies, and profit-boosting strategies that top producers are already implementing. Subscribe now to transform your dairy operation’s efficiency and profitability—your future success is just one click away.

NewsSubscribe
First
Last
Consent

Daily CME Dairy Market Report July 7th, 2025: Butter Rally Drives Class IV Premium to $1.71/cwt Over Class III – Component-Rich Milk Commands Premium

Stop chasing milk volume—butterfat surge creates $1.71/cwt Class IV premium. Component optimization beats bulk production for 2025 profitability.

Executive Summary: The era of “just fill the tank” dairy farming is officially dead—July 7th’s market action proves that butterfat and protein command completely different price signals, with Class IV premiums hitting $1.71/cwt over Class III. While most producers still think in terms of bulk milk pricing, the winners are already pivoting to component optimization, with butterfat production surging 5.3% year-over-year despite only 0.5% volume growth. The national average butterfat test has jumped to 4.36% and protein to 3.38%, creating a new reality where your genetic selection and nutrition programs directly determine your milk check competitiveness. U.S. butter exports are crushing global competitors with a 41% volume increase, while cheese markets struggle with foodservice demand weakness, proving that not all milk components are created equal. With over $8 billion in new processing infrastructure specifically designed for high-component milk, the question isn’t whether to optimize for solids—it’s how fast you can implement the genetic and nutritional strategies that’ll keep you profitable. Stop managing your operation like it’s 2020 and start treating butterfat and protein as separate profit centers.

Key Takeaways

  • Genetic Selection ROI Explosion: Prioritize bulls with +50 lbs fat and +40 lbs protein EBVs immediately—the current $1.71/cwt Class IV premium means every 0.1% butterfat increase translates to approximately $0.35/cwt additional revenue on 80% of your milk production.
  • Component-Focused Nutrition Pays: High-oleic soybean feeding strategies and precision nutrition targeting 3.8%+ butterfat can capture the butter export boom driving 41% volume increases, while traditional volume-focused rations miss this $2.62/lb opportunity.
  • Bifurcated Risk Management Strategy: Abandon “one-size-fits-all” milk pricing hedges—Class IV strength demands call options while Class III weakness requires put protection, with the persistent spread expected through Q4 2025 creating distinct risk profiles.
  • Processing Infrastructure Alignment: The $8 billion processing boom specifically targets high-component operations—farms producing 4.4%+ butterfat and 3.4%+ protein will command premium contracts while volume-focused operations face margin compression.
  • FMMO Reform Impact: The June 1st regulatory changes removed barrel pricing from Class III calculations and increased cheese make allowances to $0.2519/lb, structurally disadvantaging traditional cheese-focused operations while rewarding component-optimized producers.
dairy profitability, component optimization, milk pricing strategies, dairy market analysis, butterfat production

Today’s trading session crystallized the market’s new reality: butterfat pays, protein struggles. A decisive 1.50¢ butter rally to $2.6200/lb powered the Class IV future to $18.99/cwt, while cheese barrel weakness dropped 1.00¢ to $1.7100/lb, pressuring the July Class III contract to just $17.28/cwt. This $1.71/cwt spread between Class IV and Class III represents the widest premium in years and signals that producers with high-component milk will significantly outperform their counterparts in the coming months.

Today’s Price Action & Farm Impact

ProductPriceDaily ChangeWeekly TrendTrading ActivityImpact on Farmers
Butter$2.6200/lb+1.50¢+0.92%1 trade, three bids, one offerStrengthens Class IV; supports higher butterfat premiums
Cheese Blocks$1.6850/lbNo Change-0.91%5 trades, two bids, zero offersNeutral today, but a negative trend weighs on Class III
Cheese Barrels$1.7100/lb-1.00¢-0.29%1 trade, five bids, one offerPressures Class III; signals softer processor demand
NDM Grade A$1.2625/lb+0.25¢+0.25%1 trade, one bid, one offerSupports Class IV floor; export interest remains key
Dry Whey$0.6075/lbNo Change+1.15%0 trades, zero bids, one offerProvides minor Class III support, insufficient to offset cheese

Market Commentary

The market delivered a clear message today: component quality drives profitability. Butter’s 1.50¢ rally on light trading volume demonstrates underlying strength in butterfat demand. The trading dynamics reveal critical insights—blocks showed zero offers against two bids, while barrels had five bids competing for a limited supply, indicating tight nearby availability despite the price decline.

Key Takeaway: Producers should expect their July milk checks (received in August) to reflect this divergence, with the Class IV portion significantly outperforming Class III components.

Enhanced Trading Activity Analysis

Market Depth Indicators

ProductBid/Ask RatioWeekly VolumeMarket Sentiment
Butter3:1Light (1 trade)Bullish – Strong bid support
Cheese Blocks2:0Active (5 trades)Neutral – No selling pressure
Cheese Barrels5:1Limited (1 trade)Mixed – High interest, weak pricing
NDM Grade A1:1Minimal (1 trade)Balanced – Adequate supply/demand
Dry Whey0:1No activityWeak – Limited buyer interest

The absence of offers in cheese blocks signals either supply tightness or seller reluctance at current levels. Conversely, the heavy bid interest in barrels (five bids) despite the price decline suggests that processors are actively seeking nearby supplies.

Feed Cost & Margin Analysis

MetricCurrent ValueTrend & Implication
Corn (SEP)$4.0375/buStable; USDA projects potential further declines
Soybean Meal (AUG)$272.60/tonBelow recent highs, supporting favorable ration costs
Milk-to-Feed Ratio2.47Strongly positive; well above the 2.0 stress threshold
IOFC (Est.)$12.72/cow/dayIndicates robust per-cow profitability at current levels

Margin Outlook with Enhanced Risk Analysis

The milk-to-feed ratio of 2.47 represents a significant improvement from earlier in 2025. However, USDA forecasts suggest potential volatility ahead. The agency raised its 2025 milk production forecast to 227.8 billion pounds, up 500 million pounds from previous estimates, which could put pressure on prices if demand doesn’t keep pace .

Risk Scenarios:

  • Downside: A 10% feed cost increase could reduce IOFC by $2.50/cow/day
  • Upside: Continued low corn prices could add $1.00+/cow/day to margins
  • Weather Risk: Crop disruptions could spike feed costs 15-20% within 60 days

Production & Supply Insights with Regional Analysis

National Production Trends

The USDA’s latest forecasts indicate that milk production is expected to grow modestly by 0.5% in 2025; however, this masks significant regional variations and improvements in component production.  The agency projects 2026 production will increase by 600 million pounds to 227.9 billion pounds, driven by expanding herds and higher milk per cow.

Regional Competitive Analysis

RegionProduction TrendFeed Cost AdvantageProcessing CapacityCompetitive Position
Upper MidwestStable growth20% below Western statesExpanding cheese facilitiesStrong – low costs, high processing
CaliforniaModest expansionHigher feed costsDiversified processingModerate – volume leader but cost pressure
NortheastDeclining slightlyModerateFluid milk focusedChallenged – high costs, limited growth
SoutheastRapid growthVariableNew investmentsEmerging – growth potential

The Upper Midwest continues to leverage its structural feed cost advantage, with Wisconsin and Minnesota accounting for 32.4% of U.S. cheese production.

Market Fundamentals Driving Prices

Export Markets: Record Performance Continues

U.S. dairy exports are demonstrating exceptional strength, providing crucial support for domestic pricing. May 2025 exports reached $794.8 million, a 13% increase from May 2024, with exports from January to May totaling a record $3.83 billion.

Cheese Export Surge: May cheese exports reached 113.4 million pounds, setting a new monthly record and continuing the record-breaking performance that began in July 2024.

Key Export Destinations (January-May 2025):

  • Mexico: $1.04 billion (+10%)
  • Canada: $571.4 million (+21%)
  • Japan: $252.9 million (+39%)
  • China: $214.3 million (-5%)
  • South Korea: $209.2 million (+20%)

Domestic Demand Patterns

Retail Strength: Grocery store consumers continue choosing dairy, with sustained demand for natural cheese and butter supporting premium pricing.

Foodservice Recovery: While restaurant consumption remains below pre-2020 levels, incremental improvements in away-from-home dining are providing gradual support for cheese demand.

Forward-Looking Analysis with Enhanced Risk Quantification

Futures Curve Analysis

ContractClass III PriceClass IV Price (Est.)Spread (IV-III)Probability Assessment
JUL 2025$17.28$18.99+$1.7185% confidence
AUG 2025$18.40$19.85+$1.4575% confidence
SEP 2025$19.00$20.20+$1.2070% confidence
OCT 2025$19.20$20.20+$1.0065% confidence

USDA’s updated 2025 price forecasts support this outlook, with cheese at $1.8600/lb (up 2.0¢), butter at $2.5350/lb (up 7.5¢), and Class III milk at $18.70/cwt.

Quantified Risk Scenarios

High-Probability Risks (>50% likelihood):

  • Weather-related production disruptions: Could impact milk supply by 2-4%
  • Continued Class III/IV divergence: Spread likely to persist through Q4 2025
  • Export demand volatility: 10-15% swings possible based on global economic conditions

Medium-Probability Risks (25-50% likelihood):

  • Trade policy disruptions: Could reduce export values by $200-400 million
  • FMMO adjustment impacts: Additional 10-15¢/cwt downward pressure on Class III

**Low-Probability, High-Impact Risks (+50 lbs fat and +40 lbs protein

  • Focus on fat percentage improvements (target: 3.8%+)
  • Emphasize health traits to maximize a productive life

Nutritional Strategies:

  • Optimize for component production over volume
  • Implement precision feeding to maximize component response
  • Consider alternative protein sources given the soybean meal firmness

Cash Flow Planning with Scenario Analysis

Base Case Projections:

  • July milk checks: Expect solid payments from June’s $18.82/cwt Class III
  • August outlook: Budget for $17.28/cwt Class III impact
  • Component premiums: Class IV portion expected to outperform consistently

Stress Testing:

  • 10% price decline scenario: Plan for $1.50-2.00/cwt revenue reduction
  • Feed cost spike scenario: Budget for $100-150/cow/month margin compression
  • Export disruption scenario: Potential 5-8% all-milk price impact

Industry Intelligence

Processing Investment Boom

Over $8 billion in new processing infrastructure continues to reshape the industry, creating long-term demand for high-component milk. Major projects include Walmart’s $350 million Texas facility and significant expansions of cheese plants by industry leaders.

Technology and Efficiency Trends

The industry’s shift toward precision agriculture and component optimization is accelerating. Successful operations are implemented:

  • Real-time milk component monitoring
  • Precision nutrition management systems
  • Advanced genetic selection programs
  • Sophisticated risk management platforms

Weekly/Monthly Context

Today’s action accelerates a trend that has been building for months. The 30-day performance shows cheese blocks down 10.4% and barrels down 8.1%, contrasting with butter’s 2.7% gain. This represents a definitive structural shift, not market noise.

The USDA’s upward revisions to both production and price forecasts for 2025 suggest that the market is finding equilibrium at higher price levels, supported by strong export demand and improving domestic consumption.

Strategic Imperative: The industry is shifting permanently toward a “component economy,” where butterfat and protein values are priced and managed separately. Producers who optimize for component value rather than bulk volume will maintain competitive advantages throughout this transition.

Complete references and supporting documentation are available upon request by contacting the editorial team at editor@thebullvine.com.

Learn More:

Join the Revolution!

Join over 30,000 successful dairy professionals who rely on Bullvine Weekly for their competitive edge. Delivered directly to your inbox each week, our exclusive industry insights help you make smarter decisions while saving precious hours every week. Never miss critical updates on milk production trends, breakthrough technologies, and profit-boosting strategies that top producers are already implementing. Subscribe now to transform your dairy operation’s efficiency and profitability—your future success is just one click away.

NewsSubscribe
First
Last
Consent

The Component Revolution Nobody Saw Coming: Why Your 4.5% Butterfat Test Just Became Your Biggest Liability

Your 4.5% butterfat success is creating a $8B supply bomb—73% of operations have no idea what’s coming. Here’s your survival playbook.

EXECUTIVE SUMMARY

While you’ve been celebrating record component levels, genomic selection has unknowingly created the raw materials for a market-crushing oversupply that could devastate milk prices by 30% this fall. The numbers don’t lie: butterfat production is exploding at 5.3% while milk volume grows just 0.5%, feeding $8 billion in new cheese processing capacity that’s gambling on demand growth that isn’t materializing. Peer-reviewed research confirms genomic selection has increased genetic gains by over 7% compared to traditional methods, but nobody calculated the collective market impact when every producer pursues the same component optimization strategy simultaneously. This isn’t another cyclical downturn—it’s a structural transformation where operations under 500 cows face break-even costs of $22-26/cwt while mega-dairies maintain profitability at $17.50/cwt. The 27% of farms projected to exit over the next 18 months will be those who failed to recognize that their individual genetic success is creating industry-wide failure. Smart operators implementing comprehensive risk management, operational excellence, and strategic business model adaptation in the next 90 days will position themselves to acquire distressed assets and dominate the post-crash landscape.

KEY TAKEAWAYS

  • Financial Firewall Construction Delivers 500-700% ROI: Layering Dairy Margin Coverage with Dairy Revenue Protection and market-based hedging costs $40,000-60,000 annually but provides $307,500 in defensive value for 500-cow operations—protection that becomes priceless when milk prices crater below $18/cwt
  • Component Strategy Pivot Challenges Industry Orthodoxy: Rather than joining the component optimization race creating oversupply, target functional properties processors actually need—research shows consumers want “better-for-you cheese” with health claims, not just higher butterfat percentages
  • Beef-on-Dairy Revenue Diversification Generates $100,000+ Annually: With 72% of U.S. farms now crossbreeding, operations capturing $350-700 premiums per crossbred calf versus purebred Holstein bulls create crucial income streams uncorrelated to volatile milk prices
  • Regional Vulnerability Map Reveals Geographic Fault Lines: Northeast producers benefit from 35% Class I utilization providing $1.26/cwt price premiums over Pacific Northwest operations, while Upper Midwest faces direct Class III exposure with minimal fluid milk cushioning during the coming manufacturing oversupply
  • Technology Acceleration Compresses Crisis Timelines: Genomic selection increasing genetic gains by 35% in young bulls versus traditional methods means supply response happens in 12-18 months rather than 2-3 years, creating more severe oversupply situations that resolve quickly but with greater casualties
component optimization, dairy profitability, genomic selection, milk production, risk management

What if I told you that while you’re focused on celebrating record component levels, a $8 billion supply bomb is about to detonate across the dairy industry, and 73% of operations have no idea what’s coming?

Here’s the uncomfortable truth that conventional dairy media won’t discuss: the USDA just raised its 2025 milk production forecast to 227.3 billion pounds, yet this headline figure masks a terrifying reality that could devastate milk prices by 30% this fall. While you’ve been celebrating genomic gains that pushed U.S. average butterfat tests to record levels, you’ve unknowingly helped create the raw materials for a market-crushing oversupply.

This isn’t another cyclical downturn you can weather by tightening your belt. According to peer-reviewed research published in PLOS ONE, genomic selection has “increased about 7.1% over the gain with conventional breeding methods” for milk yield, while genetic gains for components have accelerated even faster. Every breeding decision you’ve made to boost components has been individually profitable but collectively catastrophic.

The stakes couldn’t be higher: Operations that recognize these warning signs and act in the next 90 days will position themselves to not just survive, but acquire distressed assets and dominate the post-crash landscape. Those who don’t will join the estimated 27% of dairy farms projected to exit the industry over the next 18 months.

The Hidden Tsunami: When Genomic Success Becomes Market Catastrophe

Here’s the question that should keep every strategic planner awake at night: If genomic selection effectiveness has increased genetic gains by over 7% compared to traditional methods, why hasn’t anyone calculated the collective market impact?

The research from Korean Holstein populations demonstrates the scope of this transformation: “When selected for milk yield using genomic estimated breeding values (GEBV), the genetic gain increased about 7.1% over the gain with estimated breeding values (EBV) in cows with test records, and by 2.9% in bulls with progeny records”. But here’s what the study doesn’t address—the market consequences when every producer pursues the same component optimization strategy simultaneously.

According to comprehensive dairy market analysis, U.S. milk production in 2025 is projected to reach 227.3 billion pounds, up 0.4 billion pounds from previous forecasts, yet this modest volume increase masks an explosive surge in component production. While total milk volume grows at 0.5%, butterfat production is exploding by 5.3%—creating what economists call a “tragedy of the commons” scenario.

The Genetic Acceleration Factor Nobody’s Discussing

Leonard Polzin, Extension dairy market and policy outreach specialist at the University of Wisconsin-Madison, acknowledges the timeline: “It’s hard to believe that some of the capacity hasn’t been in the works for a while”. But here’s the critical insight—this expansion is perfectly timed to coincide with an unprecedented component production explosion.

The peer-reviewed research confirms the acceleration: Genomic selection has been particularly effective for young bulls and heifers, with genetic gains increasing “by about 24.2% in heifers without test records and by 35% in young bulls without progeny records” compared to traditional methods. This means every AI decision you’ve made in the past five years contributes to a supply surge that traditional forecasting models can’t capture.

The $8 Billion Processing Gamble: When Capacity Meets Reality

While you’ve been perfecting component production, EDairy News reports that “a large increase in dairy processing capacity is due to come online in 2025, with $8 billion invested in plants for products from cheese to ice cream”. This isn’t gradual expansion—it’s a concentrated tsunami hitting the market simultaneously.

The scale is staggering: According to the comprehensive market analysis, major facilities include Leprino Foods’ $870 million Lubbock facility processing 8+ million pounds daily, Chobani’s $1.2 billion Rome complex with 12 million pounds daily capacity, and Fairlife’s $650 million Webster facility. Combined, these represent an 8% increase in U.S. cheese production capacity hitting the market in just 24 months.

The Processing Capacity Paradox

Polzin warns about the timing challenge: “Once we find a new equilibrium, it could be low for quite some time to measure and figure out what to do with the product”. This understatement reveals the industry’s lack of preparation for what’s coming.

Right now, these new plants are bidding aggressively for your component-rich milk, supporting Class III prices. However, the comprehensive research warns that this creates a “processing capacity paradox”—short-term price support followed by potential long-term collapse when the market must absorb massive volumes of finished product.

The Demand Side Reality Check: When Consumer Behavior Meets Market Fundamentals

Export Engine Under Unprecedented Pressure

The International Dairy Foods Association (IDFA) reports that U.S. dairy exports reached $8.2 billion in 2024, marking the “second-highest level ever”. But this headline obscures dangerous vulnerabilities that could trigger the crash we’re predicting.

Critical dependency: “Mexico and Canada—U.S. dairy’s top two global trading partners representing more than 40% of U.S. dairy exports” make the industry extremely susceptible to trade disruption. Any retaliatory tariffs from these partners could trigger the price collapse we predict exactly.

Warning signs are already visible: “U.S. dairy exports to China declined in 2024, marking the lowest year since 2020”. This represents a critical loss of a key market just as domestic processing capacity explodes and component production surges.

The Federal Policy Earthquake

The USDA announced a final rule on January 16, 2025, amending Federal Milk Marketing Orders (FMMOs) that “will be effective June 1, 2025”. This policy earthquake will create regional winners and losers overnight, directly altering the competitive landscape just as the supply tsunami hits.

According to the comprehensive analysis, regions with high Class I utilization will benefit from higher blend prices, while manufacturing-heavy regions like the Upper Midwest and West will see prices decline. This compounds the vulnerability of operations already exposed to Class III price volatility.

The Vulnerability Map: Who Survives vs. Who Fails

The Economics of Scale Reality

The March 2025 USDA dairy outlook reinforces concerns about profitability: The all-milk price forecast was revised to $21.60 per cwt for 2025, while 2026 projections dropped to $21.15 per cwt, “reflecting anticipated price softening for major dairy commodities”.

Break-even analysis shows the brutal mathematics:

  • Under 100 cows: $27.00-$33.00/cwt break-even
  • 100-499 cows: $22.00-$26.00/cwt break-even
  • 500-999 cows: $20.00-$23.00/cwt break-even
  • 1,000-1,999 cows: $18.50-$21.50/cwt break-even
  • 2,000+ cows: $17.50-$20.50/cwt break-even

The implications are stark: Any sustained price below $20/cwt devastates smaller operations while mega-dairies maintain profitability even at $18/cwt.

Regional Fault Lines

The March 2025 data reveals dangerous regional disparities: With 2025 milk price forecasts for Class III and Class IV revised downward to $17.95 and $18.80 per cwt, respectively, manufacturing-heavy regions face the greatest exposure.

Most At-Risk Operations:

  • Upper Midwest producers: Direct Class III exposure with minimal fluid milk cushioning
  • Pacific Northwest operations: Structural price disadvantages with low Class I utilization
  • High-debt operations: Rising interest rates compound low milk price exposure

Your Crash-Proof Defense Strategy: Beyond Conventional Thinking

Phase 1: Financial Firewall Construction (Next 30 Days)

The comprehensive research emphasizes that sophisticated and layered risk management is no longer optional; it is the foundation of a resilient dairy operation. This means moving beyond basic government programs to strategic tool deployment.

Strategic Implementation:

  • Layer Dairy Margin Coverage (DMC) with Dairy Revenue Protection (DRP) for comprehensive coverage
  • Contract 40% of production six months forward, 30% three months forward, using futures and options
  • Build cash reserves equal to 90 days of operating expenses at stress-test pricing levels

Phase 2: Operational Excellence War (Next 60 Days)

Precision management becomes critical with feed representing 50-60% of operating costs. Recent analysis shows that strategic feed procurement timing can protect against cost spikes when commodity markets dip.

Critical Actions:

  • Implement precision nutrition programs targeting cost reductions of $0.75-$1.25/cwt
  • Lock corn and soybean meal prices during commodity weakness to protect against feed cost spikes
  • Target 4.0%+ butterfat and 3.2%+ protein to align with processing plant needs for component-rich milk

Phase 3: Strategic Business Model Adaptation (Next 90 Days)

The research confirms that beef-on-dairy crossbreeding creates secondary income streams worth $350-700 per crossbred calf versus purebred Holstein bulls. For a 500-cow operation, this alone can generate $100,000+ in additional annual revenue.

Strategic Positioning Options:

  • Scale for cost competition: Pursue massive scale to achieve sub-$20/cwt break-even costs
  • Develop defensible niches: Focus on specialized products or direct-market opportunities
  • Revenue diversification: Implement beef-on-dairy, on-farm processing, or agritourism initiatives

The Technology Acceleration Factor

The genomic revolution has compressed traditional supply adjustment timelines from 2-3 years to 12-18 months, making this crisis more severe than historical precedents. Research confirms that genomic selection provides “greater accuracy of selection decisions” for production traits, but this acceleration also amplifies collective oversupply risks.

Automation compounds the acceleration: Studies show that Robotic Milking Systems (AMS) can increase milk yield per cow by 5-10% due to more frequent, consistent milking. While beneficial for individual operations, widespread adoption collectively contributes to the supply surge overwhelming markets.

The Bottom Line: Survival Requires Strategic Contrarianism

Remember that opening question about celebrating record component levels? The research reveals the tragic irony: every successful breeding decision, every genomic advancement, and every component improvement has collectively created oversupply conditions that threaten the entire industry.

Three critical takeaways backed by verified research:

  1. Genomic acceleration has compressed market adjustment timelines, with genetic gains increasing up to 35% in young bulls compared to traditional methods, making oversupply situations more severe than historical models predict
  2. Processing capacity expansion of $8 billion is concentrated in a 24-month window, creating unprecedented supply shock potential just as component production explodes
  3. Export dependency on Mexico and Canada, representing 40% of trade value, creates systemic vulnerability to policy disruption precisely when domestic processing capacity floods the market

Your immediate action steps based on verified research:

  • Stress-test your operation at $16/cwt milk prices using break-even methodologies from comprehensive market analysis
  • Implement layered risk management following strategies that research shows can save $125,000 annually for medium-sized operations
  • Position for consolidation opportunities by preserving cash and monitoring distressed asset indicators as bankruptcy filings surge

The window for preparation is closing fast. The component tsunami is building, processing capacity is coming online, and policy changes are reshaping regional competitiveness. The question isn’t whether this crisis will hit—it’s whether you’ll be prepared to ride it out while your competitors get swept away.

Complete references and supporting documentation are available upon request by contacting the editorial team at editor@thebullvine.com.

Learn More:

Join the Revolution!

Join over 30,000 successful dairy professionals who rely on Bullvine Weekly for their competitive edge. Delivered directly to your inbox each week, our exclusive industry insights help you make smarter decisions while saving precious hours every week. Never miss critical updates on milk production trends, breakthrough technologies, and profit-boosting strategies that top producers are already implementing. Subscribe now to transform your dairy operation’s efficiency and profitability—your future success is just one click away.

NewsSubscribe
First
Last
Consent

The Component Revolution: Why Milk Volume is Dead and Your Genetics Program Needs Surgery

While you’re celebrating 80-pound cows, component-focused farms bank $120K more annually. The “pounds mentality” is dead—here’s your survival guide.

EXECUTIVE SUMMARY: The dairy industry’s obsession with milk volume is financially destroying farms that refuse to adapt to component economics. While traditional operations chase fluid milk production that crawled ahead just 15.9% since 2011, component-savvy farms captured the real money: butterfat production exploded 30.2% and protein surged 23.6%. Processing giants have committed $8 billion in new capacity through 2027, all designed for high-component milk, while Federal Milk Marketing Order reforms now align 90% of milk check value with butterfat and protein content. The April 2025 Holstein genetic evaluations revealed the largest base change in history—a 45-pound rollback on butterfat—proving genetic progress is accelerating away from volume-focused breeders. New Zealand’s component-focused strategy achieved 23-26% unit price increases across major dairy categories despite declining milk volumes, demonstrating that quality commands premium pricing globally. For a 500-cow operation, a mere 0.1% increase in butterfat generates $90,000-$120,000 additional annual revenue, yet most farms continue optimizing for yesterday’s metrics. Challenge conventional wisdom: audit your genetic program against component values within 30 days or watch profitable opportunities slip away to farms that embrace this economic revolution.

KEY TAKEAWAYS

  • Genetic Revolution Accelerating: The April 2025 Holstein evaluations showed a historic 45-pound butterfat rollback and 30-pound protein rollback, with genomics now driving 70% of production improvements compared to 40% pre-2009—farms using genomic testing achieve £193 higher lifetime profitability per animal
  • Component Premium Explosion: A 500-cow operation generates $90,000-$120,000 additional annual revenue from just 0.1% butterfat increase, while overall production optimization (68 lbs/day at 3.8% fat vs. 70 lbs/day at 3.5% fat) delivers $12,000-$18,000 extra revenue per 100 cows annually
  • Processing Infrastructure Bet: $8 billion in new dairy processing capacity through 2027 is strategically designed for manufactured products requiring high-component milk—cheese manufacturers achieve 8.3% yield increases per protein percentage point, creating powerful market pull for component-rich milk
  • Federal Policy Alignment: June 2025 FMMO reforms updated protein assumptions from 3.1% to 3.3% and other solids from 5.9% to 6.0%, directly rewarding component optimization while traditional volume-focused cooperatives inadvertently penalize farms investing in genetic and nutritional strategies
  • Global Market Validation: Despite 0.5% decline in fluid milk collections, New Zealand achieved record payouts exceeding $10.00 per kilogram of milk solids through component-focused payment systems, enabling 23-26% unit price increases across major export categories—proving component optimization creates sustainable competitive advantages
component optimization, dairy genetics, milk production profitability, butterfat protein content, genomic testing

What if I told you that while you’ve been celebrating 80-pound cows, the smart money moved to something completely different? Here’s the shocking reality reshaping dairy economics: U.S. butterfat levels just hit 4.36% through March 2025-up from 3.95% in 2020. Meanwhile, milk solids production jumped 1.65% even as total volume dropped 0.35%. This isn’t a gradual change – it’s economic disruption happening right now.

The brutal mathematics: While you’ve been chasing milk pounds, butterfat production exploded 82 million pounds in Q1 2025 alone-a staggering 3.4% increase with virtually no fluid volume increase. Component-savvy farms are banking serious money, while volume-obsessed operations struggle with compressed margins.

The Death of “Pounds Per Day” Thinking

Forget everything you think you know about dairy profitability. The April 2025 Holstein evaluations revealed the largest genetic base change in history-a 45-pound rollback on butterfat and a 30-pound rollback on protein. This massive adjustment proves that genetic progress in components is leaving conventional volume-focused breeders in the dust.

The industry doesn’t want you to know that despite overall production declining 0.35% year-to-date, milk solids production jumped 1.65% through March 2025. Smart farmers optimizing components generate substantial additional revenue while commodity milk faces oversupply pressure.

The USDA’s Agricultural Marketing Service reports clearly show that “Plenty of cream is available throughout the country, and it is generally affordable for butter makers.” This abundance of butterfat-rich cream creates opportunities for processors while challenging traditional volume-focused farms.

The $8 Billion Processing Bet That Changes Everything

Here’s a fact that should change how you think about 2025: The U.S. dairy industry has more than $8 billion in processing infrastructure investment happening right now.

Major Processing Investments Creating Demand:

CompanyInvestmentLocationFocus
Walmart$350 millionTexasDistribution hub
Fairlife$650 millionNew YorkFluid milk expansion
Chobani$1.2 billionNew YorkYogurt/processing

This isn’t just expansion-it’s demand creation that will compete for your milk. Much of this new capacity focuses on manufactured products that depend entirely on component levels, not fluid volume.

Federal Policy Finally Rewards Component Focus

Critical FMMO changes took effect June 1, 2025, creating direct financial incentives for component optimization. After nearly 18 months of hearings, the USDA announced that the Federal Milk Marketing Order modernization passed in all 11 FMMOs.

Key changes affecting your paycheck:

Updated Composition Factors: Effective December 1, 2025, protein content assumptions increase from 3.1% to 3.3%, other solids from 5.9% to 6.0%, and nonfat solids from 9.0% to 9.3%. This adjustment should increase classified milk prices due to higher assumed component content.

Class I Price Mover Changes: The calculation returned to the “higher-of” advanced Class III or Class IV skim milk prices, creating more stable pricing.

If you’ve been investing in genetics and nutrition to boost components, you will get paid for it. If you haven’t? You’re financing those who have.

Your Financial Future Depends on This Decision

Component Performance Reality Check:

  • 2020 average butterfat: 3.95%
  • 2025 average butterfat: 4.36% (+0.41 percentage points)
  • 2020 average protein: 3.181%
  • 2025 average protein: 3.38% (+0.199 percentage points)

The evidence overwhelms any skepticism: USDA raised its 2025 milk production forecast to 227.3 billion pounds, but the real money lies in component optimization. All-milk prices are forecasted at $21.60 per cwt for 2025, creating margin pressure for volume-focused operations.

Yet component-focused farms are generating substantial additional revenue. With the Net Merit $ (NM$) index increasing butterfat weighting from 28.6 to 31.8, while protein weighting decreased from 19.6 to 13, market signals clearly favor component optimization over volume production.

Why Most Farms Are Getting This Wrong

The psychological barrier runs deeper than economics. Many cooperatives continue paying primarily on volume, treating component premiums as secondary considerations. This volume-focused approach inadvertently disincentivizes investments that would optimize component yields.

Current market conditions amplify these problems. Domestic cheese consumption declined by 56 million pounds during Q1 2025 despite surging butterfat production, creating an oversupply crisis for commodity milk and pressuring Class III prices downward.

Most refuse to acknowledge the controversial reality: Component pricing systems now attribute nearly 90% of milk check value to butterfat and protein, yet traditional management systems continue prioritizing volume metrics.

The Bottom Line

The component revolution isn’t coming-it’s here. U.S. butterfat levels hit record highs, milk solids production jumped 1.65% while volume dropped, and Federal Milk Marketing Orders underwent their biggest reform in decades.

The choice is stark: Adapt your genetics program to prioritize components over volume, or watch profitable opportunities slip away to farms that embrace this new reality. With butterfat levels jumping from 3.95% to 4.36% in just five years and the largest genetic base change in Holstein history, your delay costs real money every month.

Your immediate next step: Schedule a comprehensive review of your genetic program within the next 30 days. Use the April 2025 genetic evaluations with their historic base changes to restructure your breeding strategy around component optimization.

Challenge conventional wisdom: Why are you still celebrating milk volume when 90% of your check value comes from components? When the market clearly rewards component optimization, how can you justify breeding decisions based on outdated volume metrics?

The farms that understand this distinction first will capture the profits that volume-focused operations leave unclaimed.

Complete references and supporting documentation are available upon request by contacting the editorial team at editor@thebullvine.com.

Learn More:

Join the Revolution!

Join over 30,000 successful dairy professionals who rely on Bullvine Weekly for their competitive edge. Delivered directly to your inbox each week, our exclusive industry insights help you make smarter decisions while saving precious hours every week. Never miss critical updates on milk production trends, breakthrough technologies, and profit-boosting strategies that top producers are already implementing. Subscribe now to transform your dairy operation’s efficiency and profitability—your future success is just one click away.

NewsSubscribe
First
Last
Consent

CME End-of-Day Dairy Market Report: June 17th, 2025 – Cheese Collapse Pressures July Milk Checks

Stop chasing milk volume. Component optimization delivers 5.3% butterfat growth while volume stagnates at 0.5%. Your margin depends on it.

EXECUTIVE SUMMARY: Forget everything you’ve been told about prioritizing milk volume – the June 17th cheese market collapse proves that smart producers who’ve pivoted to component optimization are capturing premiums while volume-focused operations face $1.50/cwt Class III losses. The data doesn’t lie: butterfat production is surging 5.3% annually while overall milk volume crawls at just 0.5%, with average butterfat levels hitting 4.40% and protein reaching 3.40% in 2025. Meanwhile, the complete absence of cheese barrel offers signals institutional liquidation patterns not seen since 2019, yet butter maintains relative strength with aggressive institutional buying. The new FMMO reforms effective June 1st are explicitly rewarding component-rich milk through updated skim milk composition factors, creating a structural advantage for farms optimizing genetics and nutrition programs. With feed costs offering unprecedented relief – corn at $4.31/bu and the milk-to-feed ratio holding strong at 2.43 – progressive producers have a 48-hour window to lock in margins while repositioning for the emerging “component economy.” Stop betting on yesterday’s volume game and start capitalizing on today’s component premiums before your competitors figure out what you already know.

KEY TAKEAWAYS

  • Component Optimization ROI: Farms producing 4.40% butterfat milk capture 5.3% annual growth premiums while volume-focused operations stagnate at 0.5% growth, translating to measurable income advantages as FMMO reforms reward higher-value milk through updated composition factors.
  • Strategic Risk Management Window: With Class III futures trading at dangerous premiums to spot fundamentals and cheese showing institutional liquidation patterns, producers have exactly 48 hours to enroll in Dairy Revenue Protection (DRP) and establish price floors before further $1.50/cwt erosion occurs.
  • Feed Cost Arbitrage Opportunity: Current corn prices at $4.31/bu combined with a robust 2.43 milk-to-feed ratio create immediate margin expansion potential – lock in 6-month feed contracts below $4.60/bu while this golden procurement window remains open.
  • Regional Competitive Advantage: Upper Midwest operations maintain 20% lower feed costs than California counterparts, while Northeast producers benefit from new $1.2 billion processing capacity investments and favorable FMMO “higher-of” Class I pricing reforms.
  • H5N1 Supply Disruption Hedge: With 950 herds across 16 states affected and California production down 9.2% year-over-year, biosecurity-focused operations positioned in lower-risk regions can capitalize on localized supply tightening and premium opportunities.

Today’s CME dairy markets delivered a sobering reality check for producers, with cheese prices experiencing significant weakness that directly threatens July milk checks. The complete absence of barrel buyers at the session close signals fundamental demand destruction, while butter’s modest decline suggests that the market’s “component economy” favors butterfat over protein. With feed costs remaining favorable and the milk-to-feed ratio holding at 2.43, margins face pressure primarily from revenue erosion rather than input cost inflation.

Today’s Price Action & Farm Impact

ProductFinal PriceDaily ChangeWeekly TrendTrading VolumeImpact on Farmers
Cheddar Block$1.7550/lb-2.50¢-9.20¢13 tradesDirect Class III pressure of $1.25-1.75/cwt
Cheddar Barrel$1.7700/lb-2.00¢-8.20¢1 tradeZero offers – extreme liquidity crisis
Butter$2.5775/lb-1.50¢+4.50¢5 tradesModest Class IV support, butterfat premiums intact
NDM Grade A$1.2650/lb-0.50¢Unchanged1 tradeStable export foundation for Class IV
Dry Whey$0.5525/lb+0.50¢-1.40¢0 tradesMinor Class III support amid weakness

Market Commentary

The cheese market’s breakdown reflects more than temporary weakness – it signals institutional liquidation patterns not seen since the 2019 market collapse. Block cheese trading volume of 13 transactions represents the heaviest selling pressure in two weeks, while the complete absence of barrel offers despite significant price declines indicates either extreme seller capitulation or a profound lack of buyers at any price level.

This divergence between futures and cash markets is particularly concerning. June Class III futures closed at $18.69/cwt, maintaining a significant premium to spot fundamentals that typically resolve with futures declining to align with cash reality. July Class III futures showed modest strength at $18.14/cwt, but this disconnect suggests either delayed recognition of fundamental weakness or temporary liquidity constraints.

The market’s shift toward a “component economy” remains evident, with butterfat demonstrating relative resilience despite today’s decline. This trend, where butterfat comprises an increasing portion of milk income, reinforces the importance of component optimization for producers seeking to maintain margins in volatile markets.

Feed Cost & Margin Analysis

Current feed market conditions provide crucial relief amid dairy price pressure, with the milk-to-feed ratio maintaining strength at 2.43 – well above the critical 2.0 threshold that typically signals margin stress.

Current Feed Costs & Trends

  • Corn (July): $4.3075/bu, down 3.5¢ from June 10th (-0.81%)
  • Soybean Meal (July): $285.30/ton, up $1.50 from June 10th (+0.53%)
  • Milk-to-Feed Ratio: 2.43 (favorable for producers)
  • Daily Margin Over Feed Cost: $3.58 per cow (based on 70 lbs production)

The combination of lower corn prices and relatively stable protein costs creates a supportive environment for dairy margins, even as milk prices face headwinds. Feed costs have provided substantial relief compared to 2024 levels, with corn prices falling nearly 30% and offering strategic procurement opportunities.

Regional feed cost advantages persist, with Upper Midwest operations benefiting from proximity to corn and soybean production areas, maintaining feed bills 20% lower than regions like California. This geographical advantage becomes increasingly important as margin pressures intensify from revenue-side challenges.

Production & Supply Insights

U.S. milk production continues expanding despite price volatility, with USDA forecasting 227.3 billion pounds for 2025 – a significant upward revision from earlier projections. This growth stems from both herd expansion (projected 9.380 million head) and modest productivity gains, though milk-per-cow growth remains below historical averages at 0.3%.

Component Production Surge

The industry’s transformation toward higher-value components continues accelerating, with butterfat production surging 5.3% annually while overall milk volume growth remains modest at 0.5%. Average butterfat levels have risen to 4.40% and protein to 3.40% in 2025, reflecting both genetic progress and strategic feeding programs focused on component optimization.

H5N1 Impact Assessment

The H5N1 virus continues affecting dairy operations, with nearly 1,000 herds across 17 states reporting infections as of June 2025. California remains heavily impacted, with approximately 650 affected herds, contributing to the state’s recent 9.2% year-over-year production decline. Mathematical modeling suggests dairy outbreaks will continue throughout 2025, with Arizona and Wisconsin identified as the highest-risk states for future outbreaks.

The emergence of the D1.1 genotype in Nevada cattle represents a concerning development, indicating multiple independent spillover events from avian reservoirs. This genetic diversity complicates biosecurity efforts and suggests the virus continues evolving within cattle populations.

Market Fundamentals Driving Prices

Domestic Demand Dynamics

The U.S. dairy market exhibits a “two-speed” demand environment that directly impacts pricing. Retail dairy sales reached approximately $78 billion in 2024, representing $2 billion growth year-over-year, driven by consumer preferences for functional dairy products enriched with protein and probiotics.

However, foodservice demand remains problematic, with restaurant sales declining from $97.0 billion in December to $95.5 billion by February 2025 – a seven-month low. This foodservice weakness significantly affects overall demand, given that 51% of American food dollars are spent outside the home.

Export Performance & Global Competition

U.S. dairy exports show mixed signals, with total trade declining 5% in April despite strong performance in specific categories. Cheese exports achieved their second-highest month ever in March, while butter exports surged 171% year-over-year, capitalizing on favorable competitive pricing.

The Global Dairy Trade index reflects global price pressure, declining 1% in recent auctions with broad-based weakness across most categories. This international softness adds downward pressure to U.S. pricing, particularly for export-dependent products like NDM and whey.

Trade policy uncertainty persists as a significant risk factor, with retaliatory tariffs from key partners like China and Canada already impacting first-quarter export performance. The industry’s ability to offset domestic demand softness relies heavily on maintaining open access to international markets.

Forward-Looking Analysis

USDA Price Forecasts & Market Outlook

The USDA’s June 2025 WASDE report projects an all-milk price of $21.95/cwt for 2025, with a slight decline to $21.30/cwt anticipated in 2026. However, current Class III futures trading significantly below these projections suggests market skepticism about achieving official price targets.

Class III milk price forecasts have been revised multiple times, from initial projections of $17.95/cwt to current estimates ranging from $18.70-19.10/cwt for 2025. This volatility in official projections reflects the challenging fundamental environment facing the sector.

Key Risk Factors

Upside Potential:

  • Continued strong export demand for butterfat and cheese products
  • Weather-related supply disruptions (heat stress can reduce production by 8-12% when temperatures exceed 85°F)
  • Increased domestic demand for functional dairy products

Downside Risks:

  • Persistent soft foodservice demand dampening overall consumption
  • Global supply expansion from major exporting regions in Q2-Q3 2025
  • H5N1 spread, causing localized production disruptions
  • Trade policy volatility disrupting export markets

Regional Market Spotlight: Upper Midwest Resilience

The Upper Midwest continues demonstrating competitive advantages that position the region favorably despite national market challenges. Wisconsin and Minnesota’s combined production of 42.7 billion pounds in 2024 slightly exceeded California’s 40.2 billion pounds, maintaining the region’s status as America’s dairy heartland.

Structural Advantages

The region benefits from consistent feed cost advantages, with proximity to corn and soybean production providing 20% lower feed bills compared to Western regions. This cost structure becomes increasingly valuable as margin pressures intensify from revenue-side challenges.

Federal Milk Marketing Order reforms implemented June 1st generally favor regions with higher Class I utilization, though the Upper Midwest will experience impacts from updated make allowances and Class I pricing mechanisms. The shift to “higher-of” Class I pricing may provide modest support, while increased make allowances create near-term pressure on component values.

Processing capacity expansion continues in the region, with new facilities providing additional milk outlets and potential premium opportunities for producers. This infrastructure investment signals long-term confidence in the region’s competitive position.

Actionable Farmer Insights

Immediate Risk Management Priorities

Current market conditions demand aggressive risk management action within the next 48 hours. Producers should prioritize Dairy Revenue Protection (DRP) enrollment for third and fourth-quarter production, establishing price floors before further deterioration occurs.

The recent FMMO reforms alter Class III and Class IV settlement price calculations, requiring updated hedging strategies. A prudent approach involves choosing the higher contract between Class III and Class IV to hedge the portion of milk represented by Class I prices, providing more reliable price floors.

Component Optimization Strategy

With butterfat demonstrating relative strength amid broader market weakness, optimizing for higher milk components becomes critical. Producers should immediately review genetics and nutrition programs to maximize butterfat premiums as the “component economy” continues rewarding higher-value milk.

The FMMO reforms’ updated skim milk composition factors (effective December 1st) will further reward component-rich milk, making this optimization essential for maintaining competitiveness.

Feed Cost Management

Take advantage of current corn prices below $4.31/bu by securing long-term contracts, ideally locking in costs below $4.60/bu. Soybean meal prices under $286/ton present strategic procurement opportunities before potential seasonal tightening occurs.

With above-normal temperatures expected across most of the Lower 48, implementing heat stress mitigation strategies becomes critical for maintaining production and components. Research indicates consecutive days above 85°F can reduce production by 8-12%, making cooling investments increasingly valuable.

Industry Intelligence

Federal Milk Marketing Order Implementation

The FMMO reforms implemented on June 1st represent the most significant policy changes since 2018, with additional modifications scheduled for December 1st. Key changes include the return to “higher-of” Class I pricing, updated make allowances reflecting current processing costs, and revised skim milk composition factors.

Initial impacts suggest increased Class I prices across most orders, particularly benefiting regions with high fluid milk consumption. However, higher make allowances create near-term pressure on component values, requiring strategic procurement and pricing strategy adjustments.

Technology & Innovation Trends

Industry executives report growing interest in AI applications for herd management and operational efficiency. “Face to Farm” transparency initiatives continue gaining importance as consumers demand greater supply chain visibility.

Precision fermentation technology offers potential for more efficient dairy product manufacturing, though widespread adoption remains years away. Dairy executives maintain optimism about volume growth, with 80% expecting increases exceeding 3% over the next three years.

Weekly & Monthly Context

Today’s market action continues the concerning trend that began with June 16th’s “cheese market collapse,” when blocks fell 5.75¢, and barrels declined 4.50¢ with zero trading activity. This two-day decline represents the most significant cheese weakness since the 2019 market correction.

The broader June trading pattern shows divergent performance across the dairy complex. Butter has demonstrated relative strength with modest gains earlier in the month, while cheese markets have faced persistent pressure from higher production and softer demand.

Weekly trading volumes remain below historical norms, suggesting institutional participants have stepped away from active trading pending clarity on fundamental direction. This liquidity reduction amplifies price volatility and complicates risk management decisions for producers.

Looking Ahead: The full impact of FMMO reforms will become clearer as July milk checks are calculated under new formulas. Additionally, seasonal heat stress patterns typically intensify through July-August, potentially providing supply-side support if widespread temperature extremes develop.

What’s your current hedging strategy, given today’s cheese weakness? Share your insights in our producer forum and learn from fellow farmers across the country.

Learn More:

Join the Revolution!

Join over 30,000 successful dairy professionals who rely on Bullvine Weekly for their competitive edge. Delivered directly to your inbox each week, our exclusive industry insights help you make smarter decisions while saving precious hours every week. Never miss critical updates on milk production trends, breakthrough technologies, and profit-boosting strategies that top producers are already implementing. Subscribe now to transform your dairy operation’s efficiency and profitability—your future success is just one click away.

NewsSubscribe
First
Last
Consent

The Great Dairy Market Split: Why Europe’s Playing Chess While America’s Playing Checkers

Stop believing the “more milk = lower prices” myth. USDA data reveals how strategic processing pivots create $1,700/tonne profit gaps.

EXECUTIVE SUMMARY: The dairy industry’s biggest lie just got exposed: European processors are deliberately engineering butterfat scarcity while American producers gear up for a production explosion—and the $1,700 per tonne arbitrage opportunity is reshaping global trade flows. This comprehensive market analysis reveals how Europe’s strategic “pivot to cheese” has created artificial fat shortages (butter at €7,500/tonne vs US $6,000/tonne) while flooding protein markets with co-products. The USDA’s June WASDE report shattered conventional wisdom by forecasting both higher US milk production AND higher prices simultaneously—a paradox that only explosive demand growth can explain. German milk production dropped 2.9% year-over-year while UK production surged 6.5%, creating a bifurcated European market where location determines profitability more than efficiency. European cheese indices exploded with Cheddar Curd up 30.9%, Mild Cheddar +29.6%, and Mozzarella +38.2% year-over-year, proving that processors who pivot to high-value products are printing money while commodity-focused operations struggle. The upcoming GDT Trading Event 382 will test whether Fonterra’s volume-focused strategy can withstand buyer resistance, potentially triggering corrections across the global powder complex. Every dairy farmer and processor must evaluate their component optimization strategy immediately—the market’s fundamental transformation from volume-based to value-based pricing is accelerating, and those who adapt fastest will capture the greatest rewards.

KEY TAKEAWAYS

  • Component Optimization Trumps Volume Strategy: European processors prioritizing cheese production over commodity powders are capturing €4,845/tonne for Cheddar Curd versus €2,443/tonne for SMP—a 98% premium that rewards strategic product mix decisions over raw milk volume.
  • Geographic Arbitrage Creates Massive Profit Opportunities: The $1,700 per tonne butter price differential between Europe (€7,500/tonne) and America ($6,000/tonne) represents the largest arbitrage opportunity in modern dairy markets—smart operators with export capabilities are already exploiting this gap.
  • Fat Genetics Become Profit Multipliers: With European butterfat commanding historic premiums while protein markets struggle, dairy operations optimizing for higher fat percentage through breeding and nutrition programs can capture significantly higher margins per litre in today’s bifurcated market.
  • Processing Flexibility Equals Competitive Advantage: Operations capable of pivoting between butter/powder and cheese production based on real-time component values will outperform traditional single-product facilities as market premiums continue diverging by 30-40% between product categories.
  • Supply Constraint Strategy Beats Volume Growth: Germany’s deliberate 2.9% production decline while maintaining premium pricing proves that strategic supply management can generate higher returns than volume expansion—a lesson for consolidating dairy regions worldwide.
global dairy market, component optimization, dairy processing strategy, dairy profitability, dairy market analysis

The global dairy market just served up another week of jaw-dropping contradictions that’ll separate the winners from the losers. Europe’s deliberate fat shortage strategy is printing money while America gears up for a production explosion—and if you’re not positioned for this collision, you’re about to get steamrolled.

Europe’s Billion-Dollar Chess Move

Here’s what the suits in Brussels won’t tell you: European processors just pulled off the most brilliant supply manipulation in modern dairy history. They’re deliberately starving the butter market to feed their cheese obsession, and it’s working like gangbusters.

Check these numbers—European butter futures closed the week at €7,500 per tonne while US butter trades around $6,000. That’s a staggering $1,700 arbitrage opportunity that smart operators are already exploiting. But here’s the kicker: this isn’t some temporary market hiccup. This is strategic genius.

Every litre of milk these European processors divert to cheese vats does two things simultaneously—it sucks valuable butterfat away from butter production while cranking out SMP as a co-product. EEX SMP futures are stuck at €2,443 per tonne, proving that Europe’s cheese strategy is creating artificial fat scarcity while flooding protein markets.

Why does this matter for your operation? Because component values are diverging like never before. If you’re still optimizing for total volume instead of fat percentage, you’re missing the biggest profit opportunity in decades.

The UK’s Record Flush: Blessing or Curse?

While continental Europe tightens the screws, the UK’s drowning in milk. April production exploded 6.5% year-over-year to 1,396 million litres—the kind of flush that would make any farmer jealous. But here’s the plot twist: this abundance is creating its own nightmare.

UK farm-gate prices dropped 1.2 pence per litre to 43.69 ppl while the rest of Europe enjoys historically high returns. Sometimes too much of a good thing really isn’t good. The UK’s glut is putting downward pressure on regional markets while continental processors maintain their premium pricing strategies.

What smart UK farmers are doing right now: They’re aggressively pursuing cheese-making contracts and premium markets instead of dumping milk into commodity channels. Location matters more than ever in this bifurcated market.

Germany’s Structural Decline Accelerates

Here’s the uncomfortable truth nobody wants to discuss: Germany’s dairy sector is deliberately contracting. Raw milk deliveries for January-April fell 2.9% year-over-year to 10.65 million tonnes, and this isn’t weather-related. This is policy-driven destruction of production capacity.

Environmental regulations, disease pressure, and economic constraints are systematically forcing German farmers out of business. Belgium’s situation is even worse, with collections down 4.5% year-over-year. These aren’t temporary dips—they’re the managed decline of European milk production.

The opportunity here? Every tonne of lost European production creates space for efficient global suppliers. The question is whether you’re positioned to fill that gap.

America’s Production Juggernaut Nobody’s Talking About

The June WASDE report just dropped a bombshell that most people completely misread. USDA raised both milk production forecasts AND price projections for 2025. Wait, what? More milk AND higher prices?

This apparent contradiction reveals something massive about underlying demand. The USDA’s betting that domestic consumption and export demand will be so robust it’ll absorb increased production while pulling prices higher. That’s an incredibly bullish signal for US dairy.

But here’s the strategic play: USDA raised fat-based export forecasts while cutting skim-solids projections. Translation? America’s coming hard for Europe’s butter business while Europe becomes the price-competitive powder supplier.

Tomorrow’s $50 Million Poker Game

All eyes focus on Tuesday’s GDT Trading Event 382, where Fonterra’s making a calculated gamble that could reshape global powder markets. Instead of cutting volumes after recent price weakness, they’re holding steady with 6,991 tonnes of WMP offered.

Recent auctions showed SMP dropping 4.4% and WMP falling 3.7%. Back-to-back weakness usually triggers supply cuts, not volume maintenance. Fonterra’s essentially betting everything on underlying demand strength.

If buyers step up tomorrow, it validates their volume strategy. If they don’t, we could see a powder correction that rewrites the entire complex.

The H5N1 Wild Card That Changes Everything

Here’s the controversy nobody wants to discuss: with over 1,072 dairy herds affected across 17 states and 41 human cases linked to dairy cattle exposure, the US government just cancelled $766 million in funding for Moderna’s H5N1 bird flu vaccine.

This decision abandons rapid-response vaccine technology for slower traditional platforms with 2029 approval timelines. If you’re betting on business as usual while H5N1 continues circulating in dairy herds, you might want to reconsider your risk management strategy.

What Winners Are Doing Right Now

The processors dominating this game share three characteristics:

Flexibility: They can pivot between butter/powder and cheese production based on real-time component values, not traditional patterns.

Global perspective: They’re sourcing fat from America for European markets, capturing that $1,700 arbitrage opportunity.

Component optimization: They’re prioritizing butterfat genetics and nutrition programs because higher fat content equals higher margins when fat commands premium pricing.

The Cheese Market’s Money-Printing Machine

European cheese indices continue validating the industry’s strategic pivot. Recent data showed Cheddar Curd climbing €116 (+2.5%) to €4,845, with year-over-year gains of 30.9%. These aren’t just prices—they’re proof of where the industry’s most valuable milk solids are flowing.

When processors can earn €4,845 per tonne for cheese versus €2,443 for SMP, the strategic choice becomes obvious. European milk is flowing to its highest-value destination, creating scarcity in fat markets and abundance in protein markets.

The Bottom Line

The global dairy market isn’t just changing—it’s being deliberately reshaped by strategic processing decisions that create massive winners and losers. Europe’s cheese pivot has engineered fat scarcity while America’s production growth threatens to flood global markets.

Your action plan starts now:

  • Evaluate your fat genetics immediately. Higher butterfat content equals higher margins in today’s market.
  • Assess your processing flexibility. Can you pivot between product categories based on component values?
  • Watch Tuesday’s GDT results like a hawk. The outcome signals whether underlying demand can support current price levels.
  • Consider forward contracting on powders while European processors flood the market with cheese co-products.

The dairy industry’s new normal isn’t about milk volume—it’s about where that milk goes and how you extract maximum value from every component. Europe’s strategic gamble is printing money for those who understand it. America’s production explosion creates both opportunity and risk.

The great divergence isn’t ending—it’s accelerating toward a fundamental reshaping of global dairy trade flows. Make sure you’re positioned on the winning side when the dust settles.

Learn More:

Join the Revolution!

Join over 30,000 successful dairy professionals who rely on Bullvine Weekly for their competitive edge. Delivered directly to your inbox each week, our exclusive industry insights help you make smarter decisions while saving precious hours every week. Never miss critical updates on milk production trends, breakthrough technologies, and profit-boosting strategies that top producers are already implementing. Subscribe now to transform your dairy operation’s efficiency and profitability—your future success is just one click away.

NewsSubscribe
First
Last
Consent

Export Surge Shields Dairy Markets from $7/Cwt Spot Milk Collapse as Global Buyers Drive Record Butter Trading

Stop chasing volume premiums while spot milk crashes $7/cwt. Smart producers capture export-driven component premiums worth $2-4/cwt extra.

EXECUTIVE SUMMARY: Most dairy producers are still breeding and feeding for yesterday’s domestic fluid milk market while 80% of U.S. milk actually goes into manufactured products optimized for export. Here’s the reality Wall Street missed: spot milk crashed $1-7 under class pricing this week, yet international buyers snapped up 135 butter loads at record trading volumes, driving CME butter to a five-month high at $2.57/lb. From 2011-2024, while U.S. milk production increased just 15.9%, protein climbed 23.6% and butterfat surged 30.2%—proving that component optimization, not volume, drives export competitiveness. With $8 billion in new processing capacity coming online by 2027, all designed around component-rich milk, and multiple component pricing programs placing nearly 90% of milk check value on butterfat and protein, the genetic selection revolution is creating $2-4/cwt premiums for operations that understand global arbitrage opportunities. While your neighbors chase cheap spot milk, you should be questioning whether your genetics program is optimized for export market requirements or stuck in domestic commodity thinking.

KEY TAKEAWAYS

  • Component Genetics Deliver Export Premium Capture: Operations achieving premium butterfat/protein levels are capturing $2-4/cwt above class pricing through processor partnerships, while traditional volume-focused producers miss export arbitrage opportunities worth millions annually.
  • Export-Driven Price Discovery Trumps Domestic Volatility: Despite $7/cwt spot milk crashes, record butter trading volumes (135 loads) and five-month price highs prove that global buyers view U.S. dairy as undervalued, creating sustainable pricing floors that domestic commodity metrics completely miss.
  • Genetic Selection Revolution Reshapes Profit Equations: With 90% of milk check value tied to components and $8 billion in new processing capacity designed for component-rich milk, breeding decisions made today determine whether operations thrive or struggle in the export-dominated dairy economy of 2027.
  • Feed Cost Arbitrage Amplifies Component Premium Returns: Current feed costs down 10.1% combined with component premiums create income-over-feed ratios that reward genetic optimization strategies, while traditional milk-to-feed cost calculations undervalue component-focused operations by 15-25%.
  • Global Competitive Positioning Demands Strategic Genetic Pivot: U.S. cheese and butter remain world’s cheapest despite recent rallies, but only operations with export-optimized genetics can capture the sustainable competitive advantages that international markets reward with premium pricing.
dairy export markets, component optimization, CME dairy prices, butterfat protein premiums, dairy genetics profitability

Here’s what Wall Street analysts missed this week: While spot milk prices crashed $1-7 under class pricing across the Central region, international buyers snapped up 135 butter loads—one of the highest weekly trading volumes on record—pushing CME spot butter to a five-month high at $2.57/lb. This isn’t just market noise; it’s proof that America’s dairy sector has fundamentally repositioned itself as the world’s low-cost provider, creating an export-driven floor that’s reshaping profitability equations for every operation from 50-cow herds to 5,000-cow complexes.

The Reality Check Nobody’s Talking About

Let’s face it—when spot milk is trading $7 under class, and your butter buyers are still lining up like it’s Black Friday, something fundamental has shifted in global dairy economics. The June 13th CME session delivered a masterclass in a market bifurcation that most producers are completely missing.

Here’s the disconnect: While Cheddar blocks retreated 2¢ to $1.8375/lb and barrels fell 2.5¢ to $1.835/lb, butter markets witnessed institutional accumulation at levels that would make commodity traders jealous. That 7:1 bid-to-offer ratio during peak trading sessions? That’s not speculation—that’s global supply chain managers securing inventory at prices they consider bargains.

Why should you care? This dynamic creates profit opportunities that traditional milk-to-feed cost ratios completely miss. As dairy farmers leverage their genetics programs to select animals for traits associated with milk component levels, there is untapped potential for how high butterfat and protein percentages can go. And there’s a clear financial incentive—multiple component pricing programs place nearly 90% of the milk check value on butterfat and protein.

When “Cheap” American Dairy Becomes the World’s Premium Play

The conventional wisdom that low prices hurt profitability just got demolished by global market realities. Despite recent rallies, U.S. cheese and butter remain the cheapest in the world—a positioning that’s attracting international buyers who view American dairy as undervalued relative to European and Oceanic alternatives.

Consider New Zealand’s situation: They’re commanding record milk prices of 10 NZ$ per kg of fat and protein, exceeding their previous 2021-2022 record. Meanwhile, European Union production is declining by 0.2% as regulatory pressures and shrinking herd sizes create structural supply constraints.

Here’s the genetic revolution most producers are ignoring: From 2011 to 2024, while U.S. milk production increased just 15.9%, protein climbed 23.6%, and butterfat increased 30.2%. This isn’t accidental—the result of targeted genetic selection optimizing American dairy for export competitiveness.

What does this mean for your operation? You’re competing in a global arbitrage opportunity where efficiency gains translate directly into competitive advantages that international buyers are willing to pay premiums to access. But here’s the kicker—most producers are still breeding for yesterday’s domestic fluid milk market when over 80% of the U.S. milk supply goes into manufactured dairy products.

The Component Optimization Revolution That’s Leaving Traditional Dairies Behind

Here’s where seasonal dynamics get interesting and where genetic strategy becomes your competitive weapon. Warm weather tightens cream supplies precisely when ice cream production ramps up, pushing cream multiples higher from spring lows—though they remain well below historic averages.

The tactical reality: Butter churns aren’t running as hard as they were two months ago, yet demand remains robust enough to support record trading volumes. This suggests that component optimization strategies focusing on butterfat percentages could deliver outsized returns during this supply-demand imbalance.

But here’s what the USDA projections aren’t telling you: $8 billion of new dairy processing capacity is slated to come online through 2027, all designed around component-rich milk. Are you positioning your genetics program to capture this massive infrastructure investment, or are you still optimizing for volume?

Smart producers are already adjusting both rations and breeding decisions to maximize component production during this seasonal window. Are you?

School’s Out, Cheese Vats Full: The Export Arbitrage Most Producers Miss

With school milk programs on hiatus and bottlers reducing milk purchases, cheese manufacturers find themselves with abundant, heavily discounted raw material. USDA’s Dairy Market News confirms that milk volumes and components aren’t fading as quickly as expected—a direct result of low feed prices and high milk prices encouraging producers to maintain aggressive feeding programs.

This creates an interesting dynamic: Spot milk availability in the $1-7 under class range in the Central region, combined with “formidable international prices,” preventing steep selloffs in finished products.

Here’s the genetic angle that changes everything: While your neighbors chase volume premiums on cheap spot milk, forward-thinking operations leverage component genetics to capture export premiums. “US supply expansion is expected in 2025, but it’s likely to be modest at sub-1%,” notes Michael Harvey, RaboResearch senior dairy analyst. This limited volume growth and component-rich genetics create a perfect storm for premium capture.

The opportunity: Operations with direct-to-processor relationships AND component-optimized genetics can capitalize on this arbitrage between cheap input costs and stabilized output pricing.

Feed Cost Revolution: The Hidden Profit Driver

While everyone’s focused on milk prices, the real story is unfolding in feed markets. USDA projects feed costs down 10.1% in 2025, with corn futures settling at $4.44/bushel despite strong export demand and reduced ending stocks.

The critical insight the USDA missed in their latest revision: They’ve cut the 2025 all-milk price forecast to $21.10 per cwt, down $0.50 from last month’s forecast. But they’re not accounting for the genetic component revolution that’s reshaping the profit equation.

July corn trading higher than December contracts signals immediate supply tightness, but current levels remain manageable compared to recent years. This backwardation in grain markets suggests temporary price support rather than sustained uptrends—exactly the environment where aggressive component-focused feeding programs maximize returns.

Global Trade Dynamics: Reading the Export Tea Leaves

The whey powder decline to 55.25¢ tells a story that goes beyond simple supply-demand mechanics. Chinese demand—traditionally our largest foreign market—remains “hit or miss” as the maintained 10% tariff influences trade flows. Meanwhile, Southeast Asian buyers maintain consistent interest, creating geographic diversification opportunities.

But here’s what’s happening: Chinese dairy imports in 2025 are projected to be higher than in 2024, though the country no longer has the same dominant influence over the global dairy market. This shift is creating opportunities for operations that understand component export dynamics.

Strategic implications: Operations focusing on products with strong Southeast Asian demand profiles may capture better margins than those dependent on Chinese market fluctuations. But the real winners will be those who’ve optimized their genetics for the specific component profiles these export markets demand.

The bigger picture? U.S. dairy’s global competitive positioning has fundamentally improved. Even after significant spring and early-summer rallies, American products maintain price advantages that create sustainable export floors.

Class III Reality Check: Genetics Trump Price Forecasting

July Class III futures falling 75¢ to $18.15/cwt might seem concerning until you consider the USDA’s broader disconnect from reality. Their latest forecast shows Class III at $17.60 and Class IV at $18.20 per hundredweight—projections that completely ignore the component premium revolution reshaping dairy economics.

Here’s what USDA’s Washington analysts are missing: While they’re forecasting modest price increases, the real money is in component optimization. Operations achieving premium component levels are already capturing $2-4/cwt premiums over class pricing through processor partnerships focused on export-quality milk.

The producer reality: Current milk prices, combined with declining feed costs and component premiums, generate income-over-feed ratios supporting continued herd expansion. Dairy producers have added significant cow numbers in the first half of 2025, and plan continued growth.

But here’s the strategic question most operations aren’t asking: Are you expanding with genetics optimized for 2025’s export-driven component premiums, or are you still breeding for yesterday’s domestic commodity market?

What This Means for Your Operation

Stop managing your dairy like it’s a domestic commodity business. The market dynamics described above represent a fundamental shift toward export-driven price discovery that rewards efficiency and component optimization over simple volume production.

Immediate action items:

  1. Genetic Strategy Overhaul: Prioritize sires with proven component genetics—specifically those with high fat/protein percentages that match export processor specifications
  2. Component Optimization: Focus feeding programs on butterfat percentage during the seasonal cream supply squeeze while maintaining protein levels
  3. Risk Management: Use the current backward dated grain markets to forward-contract feed costs at favorable levels
  4. Market Positioning: Evaluate direct-to-processor relationships that capture both spot milk discounts AND component premiums

The strategic reality: Operations that adapt to export-driven price discovery while optimizing genetics for component production will capture margin opportunities that volume-focused competitors miss.

The Bottom Line: Darwin’s Dairy Market

This week’s market action reveals a dairy industry in a fundamental transition from domestic commodity pricing to global arbitrage opportunities driven by genetic optimization. While spot milk crashes locally, international buyers demonstrate sustained confidence in American dairy’s competitive positioning through record trading volumes and premium valuations.

As IDFA CEO Michael Dykes declares, “This isn’t about surviving 2025—it’s about dominating 2030”. With global dairy demand growing 2.3% annually and $8 billion in new processing capacity coming online by 2027, the operations that thrive won’t be those chasing yesterday’s volume metrics.

The winners in this new paradigm won’t be the operations chasing yesterday’s milk-to-feed ratios—they’ll be the producers who recognize that genetic selection for component optimization now translates directly into global competitive advantages that international markets reward with premium pricing.

Your next strategic decision: Are you positioning your genetics program to capture these export-driven component opportunities, or are you still breeding like it’s a domestic commodity business? Because let’s be honest—the global dairy market just told you exactly where the smart money is placing its bets, and it’s not on volume production.

The evolution has begun. Will your operation adapt, or will you become extinct in the new dairy economy?

Learn More:

Brace for Impact: Why 2025’s Dairy Price Surge Masks a $780 Billion Industry’s Perfect Storm

Stop chasing herd expansion. Smart farmers optimize components over volume—boosting profits 15% while competitors face the 2025 recalibration.

EXECUTIVE SUMMARY: The dairy industry’s current price euphoria is masking a dangerous supply-demand collision that will blindside unprepared operators by Q4 2025. While Oceania WMP hits $4,300/MT and producers celebrate record milk checks, RaboResearch warns that accelerating supply growth (326.7 million metric tons from Big 7 regions) is about to crash into crumbling consumer confidence (52.2 sentiment index, down 24.5% YoY). The most damaging myth? That bigger operations automatically mean better profits. Smart farmers are already pivoting from volume obsession to component optimization, with butterfat levels hitting a 76-year record of 4.23% nationally and milk solids production jumping 1.65% in March 2025. While 80% of dairy leaders expect volume growth above 3%, the math is brutal: a farm producing 75,000 pounds daily at 4.3% butterfat generates higher returns than one producing 80,000 pounds at 3.8% butterfat. This “recalibration” will separate the strategic operators who prepare now from those still betting on the bull run. Your move: stress-test your operation for milk prices 15-20% below current levels—because that’s exactly where the fundamentals are heading.

KEY TAKEAWAYS

  • Component Revolution Beats Volume Obsession: Farms optimizing butterfat and protein content achieve 12-15% higher income over feed costs compared to expansion-focused operations, with genetic improvements delivering 22.9% protein growth and 28.9% butterfat increases since 2011—making the “more cows, more money” mentality obsolete.
  • Technology Reality Check Saves $250K: Before adding 100 cows at $2,500 each, invest that $250K in genetic improvements and precision feeding to boost butterfat from 3.8% to 4.3%—generating higher returns with zero additional labor, feed costs, or environmental compliance while robotic milking success stories show $1.00-$1.50/cwt profitability gains only under optimal conditions.
  • Trade War Timing Creates Export Vulnerability: Strong Q1 2025 dairy exports occurred before China’s 125% retaliatory tariffs and Canada’s 25% tariffs hit full force—smart operators are diversifying market exposure now while building cash reserves during the current price strength to weather the H2 2025 recalibration.
  • Consumer Confidence Collapse Demands Strategy Shift: With 38% of consumers saying high prices have eroded their finances and affordability concerns surpassing job security worries, dairy companies face the brutal reality that passing higher costs to post-COVID inflation-weary consumers will trigger volume losses—requiring immediate focus on value propositions over premium pricing.
  • Financial Stress-Testing Reveals Survival Strategy: Operations modeling scenarios with milk prices 15-20% below current levels by Q4 2025 can identify critical weaknesses now—high-performing dairies already achieve $3.50/cwt advantage in income over feed costs through systematic resource optimization rather than scale expansion, positioning them for the coming market adjustment.
dairy market outlook, milk price forecast, component optimization, dairy profitability strategies, global dairy trends

The global dairy market’s current strength is a dangerous mirage. While commodity prices hit multi-year highs, accelerating supply growth is about to collide with crumbling consumer confidence and escalating trade wars. Smart operators who recognize this paradox and pivot their strategies now will survive the “recalibration” that’s coming – those who don’t risk getting crushed when fundamentals reassert themselves in H2 2025.

You’re probably feeling pretty good about dairy right now. Oceania whole milk powder just smashed through $4,300 per metric ton for the first time since April 2022. Fonterra’s announcing record forecast prices of NZD 10/kgMS for 2025/26. The U.S. dairy industry just flexed its economic muscle with a staggering $780 billion impact supporting over 3 million jobs.

But here’s the uncomfortable truth that’s about to blindside unprepared operators: this party’s built on quicksand.

Why Are Smart Money Managers Already Hedging Their Bets?

Here’s a question that should keep you awake tonight: If prices are so strong, why is RaboResearch warning about “downside risks emerging in the second half of the year”?

The numbers tell a story that most operators aren’t hearing over the sound of strong milk checks. RaboResearch’s latest Global Dairy Quarterly reveals a fundamental paradox that should keep every strategic planner awake at night.

Milk production across the “Big 7” exporting regions grew a modest 0.5% in Q1 2025. Sounds manageable, right? Dead wrong.

That growth is about to explode. Production will accelerate to 1.1% in Q2 and 1.4% in Q3 – the strongest quarterly increase since early 2021. We’re looking at 326.7 million metric tons of milk production from the Big 7 in 2025, representing the highest annual volume gain since 2020.

Meanwhile, consumer sentiment is cratering. The University of Michigan’s Consumer Sentiment Index hit just 52.2 in May 2025 – a brutal 24.5% decrease year-over-year from 69.1 in May 2024. About 64% of consumers expect business conditions to worsen in the year ahead, with 38% saying high prices have eroded their personal finances.

The math is simple but devastating: Accelerating supply + fragile demand = unsustainable prices.

Challenging the Expansion Obsession: Why Bigger Isn’t Always Better

In dairy thinking, let’s challenge a sacred cow: the relentless pursuit of herd expansion and volume growth. While conventional wisdom pushes farmers toward larger operations, recent data suggests this strategy is fundamentally flawed in today’s market reality.

The USDA projects U.S. cow numbers to increase by 20,000 head by year-end 2025, pushing total milk production to 226.9 billion pounds. But here’s what the expansion enthusiasts aren’t telling you: unprecedented genetic gains are making this volume-focused approach obsolete.

According to Hoard’s Dairyman analysis, butterfat levels charged to 4.23% nationally in 2024, breaking through the 4% ceiling and besting a 76-year-old record. With nearly 90% of U.S. milk valued under multiple component pricing, genetic gains in butterfat and protein are pushing milk checks higher than simple volume increases ever could.

The evidence is staggering: Milk solids production increased by 1.65% as of March 2025, demonstrating that smart farmers are already prioritizing components over raw volume. This represents a fundamental shift from the “more cows, more milk, more money” mentality that has dominated dairy thinking for decades.

Consider this scenario: Farm A adds 100 cows at $2,500 each ($250,000 investment) to increase volume by 8%. Farm B invests $250,000 in genetic improvements and precision feeding to boost butterfat from 3.8% to 4.3%. With component premiums, Farm B generates higher returns with zero additional labor, feed costs, or environmental compliance issues.

The University of Wisconsin-Madison’s Center for Dairy Profitability shows that farms focusing on component optimization rather than volume expansion achieve 12-15% higher income over feed costs compared to expansion-focused operations.

What’s Driving This Supply Explosion While Nobody’s Watching?

The United States is leading the charge with a dairy cow inventory that grew by 2,500 head to 9.349 million as of January 2025. But here’s what’s telling: this expansion is happening in the wrong places at the wrong time.

According to Hoard’s Dairyman analysis, April milk production rose 1.5% year-over-year, the largest gain since August 2022, driven by a larger herd and improved yields. This marks a turning point, as 2025 is expected to deliver the first full-year production growth since 2021, with RaboResearch expecting an output gain of 1.4% over 2024.

The European Union is taking a completely different approach. EU milk deliveries are projected to decline 0.2% to 149.4 million metric tons as farmers grapple with declining cow numbers, tight margins, and escalating regulatory costs. But, they prioritize cheese production at the expense of butter, non-fat dry milk, and whole milk powder.

Here’s the kicker: While total global milk volume increases, specific product categories like EU butter and WMP might experience tighter supply. This creates commodity-specific vulnerabilities that most operators aren’t prepared for.

Region2025 Production ForecastStrategy FocusKey Vulnerability
United States+0.5% growthHerd expansion & efficiencyTariff impacts on exports
European Union-0.2% declineCheese prioritizationRegulatory compliance costs
Australia-1.0% declineCost managementWeather & farm exits
China-1.5% declineDomestic consolidationEconomic slowdown

Why Is Consumer Demand Cracking Under Pressure?

While producers ramp up, consumers are tapping out. Mary Ledman from RaboResearch isn’t mincing words about “near-record-low consumer confidence in the US” weighing heavily on demand.

But here’s where conventional dairy marketing completely misses the mark. The University of Michigan data shows that less than half of consumers expect their own incomes to grow in the year ahead, down from nearly 60% six months ago. This represents a fundamental shift in consumer psychology that dairy companies haven’t adequately addressed.

China’s Demand Shift Changes Everything

China’s dairy consumption dropped 5.6% in 2024, with the average person consuming 41.5 kilograms of dairy. But here’s what’s really happening: China’s dairy market contracted to $49.3 billion in 2024, standing approximately at the previous year’s level after hitting a maximum of $51.7 billion in 2022.

This isn’t just a temporary blip. Chinese consumers are fundamentally reshaping their dairy preferences around snacking and fitness trends. According to IndexBox market analysis, consumption of dairy produce decreased by 3.2% to 50 million tons in 2024, marking the first decline after six years of growth.

Rabobank expects China’s net imports of dairy products to rise by a modest 2% in 2025, with most of this increase anticipated in the latter half of the year as domestic stocks weaken. New Zealand continues to dominate China’s total dairy import basket (46% in 2024), followed by the EU (31%).

The Trade War Wild Card

The elephant in the room? Escalating trade tensions that are reshaping global dairy flows in real-time.

China slapped retaliatory tariffs on U.S. agricultural products starting March 10, 2025 – beginning at 10% and rapidly escalating to 125% by April 12. Canada imposed a 25% tariff on approximately CA$30 billion worth of U.S. products, which specifically included $212 million of U.S. dairy products.

The critical timing issue is that the strong U.S. dairy exports we saw through Q1 2025 occurred before these tariffs hit full force. The real impact on export volumes and profitability will show up in Q2 and Q3 data when supply is accelerating.

According to Fortune analysis, America exported about $8.2 billion of dairy products in 2024, the second-highest on record. More than half of U.S. dairy exports are shipped to Mexico, Canada, and China, all of which have been targeted by Trump’s tariff policies.

Disrupting the “Technology Will Save Us” Narrative

Another sacred cow that needs slaughtering is the blind faith that technology automatically equals profitability. While industry publications breathlessly promote every new gadget, the reality is far more nuanced.

Consider the robotic milking revolution everyone’s talking about. Progressive Dairy research shows that robotic systems cost approximately $200,000 per machine, with experts calculating the ideal number of cows at around 500 to economically justify the switch. But the hidden costs include:

  • Staff retraining requirements that can take 6-18 months
  • Technical backup protocols when systems fail (and they will)
  • Integration challenges with existing infrastructure

However, success stories exist when properly implemented. California operations report being $1.00 to $1.50 per hundredweight more profitable with robotic milking systems when all factors are optimized. However, these cases represent carefully selected early adopters with optimal conditions – not the average dairy operation struggling with tight margins and limited technical expertise.

The key insight from Cornell University extension research is that robotic milkers make sense for small- and medium-sized farms primarily because of labor challenges and outdated infrastructure, not because the technology itself guarantees profitability.

How Are Current High Prices Setting Up the Fall?

Dairy commodity prices have surged to multi-year highs, but RaboResearch’s core message is explicit: the “current market strength [is] not sustainable.”

Mary Ledman warns that “dairy companies and downstream multinational consumer packaged goods companies will find it challenging to pass on higher dairy costs to consumers still grappling with post-COVID inflation.”

The “Recalibration” Reality Check

RaboResearch isn’t predicting a crash – they’re forecasting something potentially more dangerous: a “recalibration from recent multiyear highs – a natural correction following a period of strong performance.”

The fundamentals are clear: expanding supply is about to meet uncertain demand while trade tensions create additional volatility. High commodity prices aren’t sustainable when you’re fighting math and consumer psychology.

Supporting this thesis, the USDA has already reduced its milk production estimate for 2025 to 226.2 billion pounds, a decline of 700 million from February projections. The average all milk price is estimated at $21.60 per hundredweight, with the 2026 forecast at $21.15 per cwt.

Are you prepared for milk prices 15-20% below current levels by Q4 2025? Because that’s exactly the scenario smart operators are planning for right now.

Breaking the Commodity Mindset: The Component Revolution

Here’s where we need to fundamentally challenge how dairy farmers think about their business. The obsession with per-cow averages and total volume is a relic from an era when milk was milk. Today’s reality demands a complete strategic overhaul.

According to Hoard’s Dairyman analysis, genetic improvements fuel historic gains in key milk components needed to produce cheese, butter, and specialty dairy foods. Butterfat posted its fourth-straight annual record, charging to 4.23% nationally in 2024.

This isn’t just incremental improvement – it’s a fundamental market transformation. From 2011 to 2023, while milk production grew by just 16.2%, protein jumped by 22.9%, and butterfat catapulted by 28.9%.

The math is compelling: A farm producing 80,000 pounds of milk daily at 3.8% butterfat generates significantly less revenue than a farm producing 75,000 pounds at 4.3% butterfat. The component premiums more than offset the volume difference.

Corey Geiger with CoBank confirms this trend: “In the last three years, milk production that counts the water in it hasn’t been growing, but components have been growing two to three percent a year.”

What Should Strategic Operators Be Doing Right Now?

Smart dairy operators need to prepare for this recalibration now, not after it hits. The convergence of accelerating supply growth, fragile consumer demand, and escalating trade tensions is setting up a correction that could catch unprepared operators off guard.

Optimize for Efficiency, Not Volume

The operators who thrive will be those who focus on efficiency gains rather than volume expansion. With supply accelerating globally, the competitive advantage will go to those who can produce at the lowest cost per unit.

Research from Progressive Dairy shows that high-performing dairies achieve a $3.50 per hundredweight difference in income over feed cost compared to average operations. This gap isn’t about technology – it’s about systematic optimization of existing resources.

Focus on High-Value Milk Components

The 1.65% increase in U.S. milk solids production shows where the smart money is going. Operators should prioritize butterfat and protein content that command premiums in manufactured dairy products.

According to research by the Journal of Dairy Science, genetic improvements in butterfat and protein rank among the most heritable traits for dairy cows. The Council of Dairy Cattle Breeding reports that annual rates of genetic improvement have doubled since 2012 when genomic selection became available.

Diversify Market Exposure

The trade war data shows how quickly export markets can shift. Operators need to reduce dependence on volatile export markets and strengthen direct-to-consumer channels to capture more value.

Strengthen Financial Positioning

With a recalibration coming, operators need stronger balance sheets. This isn’t the time for aggressive expansion financing – it’s the time to build cash reserves and reduce debt exposure.

The Technology Integration Reality Check

Let’s address the elephant in the barn: Most dairy technology implementations fail not because the technology doesn’t work but because farmers approach adoption with unrealistic expectations.

Recent research on dairy management decisions shows that high-performing herds focus on optimal management practices rather than simply adopting the latest technology. A study involving 60 progressive herds nationwide from 2019 to 2024 revealed that management decisions such as voluntary waiting periods and days dry have more impact on productivity than technology alone.

Key success factors include:

  • Phased implementation starting with one system and expanding gradually
  • Staff buy-in through comprehensive training and involvement in selection
  • Data literacy development to actually use the insights technology provides
  • Backup protocols for when systems inevitably fail

The future favors farms that blend innovation with proven practices, not those that chase every technological fad.

Regional Production Strategies Create New Vulnerabilities

This regional divergence creates specific commodity vulnerabilities. EU’s focus on cheese means a tighter supply for butter, NDM, and WMP – even as total milk volume increases globally. Australia’s continued contraction is creating “dairy deserts” in some regions.

The U.S. dairy sector has demonstrated the ability to adjust and maintain competitiveness. According to Hoard’s Dairyman, U.S. cheese exports have outperformed expectations due to lower prices relative to the European Union, making U.S. products more attractive globally. But, this competitive advantage could evaporate quickly if domestic production costs continue rising or if trade barriers expand.

Here’s the critical question: Are you positioning your operation for these regional shifts, or are you still operating under outdated assumptions about global market stability?

Emerging Markets: The Overlooked Wildcard

Here’s where most analysis falls short: The focus on traditional “Big 7” regions ignores the seismic shifts happening in emerging dairy markets that could reshape global trade flows.

India’s dairy sector, while primarily domestic-focused, is experiencing rapid modernization that could impact global ingredient markets. The country’s milk production reached 231 million tons in 2024, making it the world’s largest producer. As Indian operations achieve greater efficiency, their domestic ingredient needs could reduce global demand for certain categories.

Southeast Asian markets are demonstrating explosive growth in premium dairy consumption, driven by rising middle-class incomes and changing dietary preferences. Vietnam’s dairy imports grew 23% in 2024, while Thailand and Indonesia showed similar double-digit growth patterns. These markets represent the future of dairy demand growth – but they’re increasingly sophisticated buyers who demand specific product attributes.

The implications are profound: Traditional commodity-focused strategies may miss the most profitable growth opportunities in emerging markets that prioritize quality, traceability, and specific functional properties over simple volume.

The Bottom Line

Remember that feeling of confidence when you saw Oceania WMP prices hit $4,300 per metric ton? That optimism is exactly what RaboResearch is warning against with their “Too Good to Be True?” assessment.

The current dairy market strength is built on foundations that are rapidly shifting beneath our feet. While commodity prices hit multi-year highs, the convergence of accelerating supply growth (326.7 million metric tons from Big Seven regions), fragile consumer demand (52.2 consumer sentiment index), and escalating trade tensions (125% Chinese tariffs) is setting up a “recalibration” that could catch unprepared operators off guard.

The warning signs are flashing bright red: consumer confidence is weak, supply is accelerating, and trade wars are reshaping global flows. This isn’t the time for aggressive expansion – it’s the time for strategic positioning.

The smart money isn’t betting on continued price strength – it’s preparing for the correction that’s coming. Those who recognize this paradox and adjust their strategies accordingly will emerge stronger when the dust settles.

Your immediate action plan:

  1. Run the numbers: Pull up your operation’s Q3 and Q4 2025 financial projections. Model scenarios with milk prices 15-20% below current levels. If those numbers make you uncomfortable, you know exactly what needs to change.
  2. Optimize components over volume: Shift breeding and management focus toward butterfat and protein optimization. The genetic tools exist – use them.
  3. Stress-test your cash flow: Build reserves now while prices are strong. The recalibration will reward those with financial flexibility.
  4. Diversify market exposure: Reduce dependence on volatile export markets. Strengthen local and regional relationships.
  5. Technology reality check: Evaluate tech investments based on actual ROI, not marketing promises. Focus on tools that enhance decision-making, not replace human judgment.

The dairy industry’s $780 billion economic engine will keep running – but only the operators who prepare for turbulence ahead will maintain their position when the market finds its new equilibrium.

The choice is yours: Continue riding the current wave of optimism, or position yourself for the inevitable recalibration. History shows that the farmers who survive market corrections are those who prepare while others celebrate.

Are you positioning for the recalibration, or are you still betting on the bull run?

Learn More:

Join the Revolution!

Join over 30,000 successful dairy professionals who rely on Bullvine Weekly for their competitive edge. Delivered directly to your inbox each week, our exclusive industry insights help you make smarter decisions while saving precious hours every week. Never miss critical updates on milk production trends, breakthrough technologies, and profit-boosting strategies that top producers are already implementing. Subscribe now to transform your dairy operation’s efficiency and profitability—your future success is just one click away.

NewsSubscribe
First
Last
Consent

Milk Production Surge Masks $4 Billion Demand Crisis: Why Your Component Strategy Needs an Immediate Overhaul

Stop chasing milk volume. Component optimization delivers $120-180 more per cow annually while domestic demand craters to 2021 lows.

EXECUTIVE SUMMARY: The dairy industry’s obsession with raw milk volume costs producers thousands annually while butterfat production surges 5.3% and domestic cheese demand plummets to its lowest level since 2021. Despite milk solids production jumping 2.1% in Q1 2025, domestic consumption dropped 0.8% to just 3.295 billion pounds, creating the most dangerous oversupply crisis in a decade. Smart producers are pivoting to component optimization strategies that generate 0-180 additional revenue per cow annually through targeted genetic selection and precision feeding programs. While exports provide some relief, with a record 140,874 metric tons shipped globally, they represent less than 10% of total production and can’t offset domestic foodservice weakness that’s crushing mozzarella demand by 0.9%. Operations that continue volume-chasing while ignoring butterfat and protein optimization will face sustained margin pressure as $8 billion in new processing capacity comes online through 2026. The genomic testing revolution proves that farms implementing full component-focused breeding programs achieve £193 higher lifetime profitability per animal compared to partial adopters (Genomic Testing Transforms the UK Dairy Industry). The time for incremental adjustments has passed—component-focused breeding and feed programs are now essential for survival in the restructured market reality.

KEY TAKEAWAYS

  • Component Economics Trump Volume: A 0.3 percentage point increase in both butterfat and protein content generates $120-180 additional revenue per cow annually, even with slightly reduced milk volume—proving genetic selection should prioritize TPI scores for components over raw yield metrics while leveraging genomic testing that delivers 70% accuracy in predicting future production.
  • Foodservice Concentration Risk Exposed: Mozzarella production declined 0.9% due to pizza chain struggles (Domino’s -0.5%, Pizza Hut -5%, Papa John’s -3%), highlighting the catastrophic vulnerability of single-channel dependencies that smart operations must diversify immediately while American-style cheese rebounded 3.3% through export diversification.
  • Technology ROI Accelerating: Precision agriculture tools for real-time component monitoring deliver 18-24 month payback periods for small operations ($150-200 per cow investment) while automated milking systems with component analysis show 12-18 month returns for large herds, with feed efficiency improvements reducing carbon footprint by up to 50% when comparing high-quality vs. low-quality forage diets.
  • Policy Threat Quantified: Federal food assistance program cuts could slash domestic demand by 4% while retaliatory tariffs risk $22 billion in export losses over four years—requiring immediate risk management strategies, including component quality positioning and geographic market diversification as the 2025 all-milk price forecast drops to $21.10 per cwt (Dairy – Market Outlook).
  • Export Opportunity Limited but Critical: Despite record cheese exports (+7% to 140,874 metric tons), international demand represents less than 10% of U.S. production, making domestic component optimization and market channel diversification the only sustainable path forward as new processing capacity adds 360 million pounds annually by year-end while global dairy demand accelerates at twice pre-COVID speed.
Milk Production Surge Masks $4 Billion Demand Crisis: Why Your Component Strategy Needs an Immediate Overhaul

While butterfat production surged 5.3% and milk solids jumped 2.1% in Q1 2025, domestic cheese consumption plummeted to its lowest level since 2021 at 3.295 billion pounds—down 0.8% year-over-year. This divergence between component abundance and demand weakness is creating the industry’s most dangerous oversupply crisis in a decade, demanding immediate strategic adjustments to milk composition optimization and market channel diversification.

The numbers coming out of Q1 2025 should make every dairy producer pause and reconsider their genetic selection criteria, feeding programs, and market positioning. We’re witnessing something unprecedented: milk solids production is accelerating while the foundation of domestic cheese demand crumbles beneath our feet

Think of it as having the highest-producing cow in your herd consistently delivering 120 pounds daily, but your milk truck can only handle 100 pounds. The excess doesn’t disappear—it creates a backlog that affects pricing for everyone in your cooperative. That’s exactly what’s happening at the national level with cheese demand.

But here’s the question that should keep you awake at night: Are you still optimizing for yesterday’s market while tomorrow’s reality unfolds around you?

Why Component Optimization Is Now Your Most Critical Business Decision

The traditional focus on raw milk volume is becoming obsolete faster than a manual milking system. Milk solids production grew 2.1% in Q1, liquid milk increased modestly, and butterfat production exploded 5.3%. This “component economy” fundamentally alters how we assess production strategies and market positioning.

Here’s what this means for your operation: if you’re still selecting bulls based primarily on milk yield rather than component optimization, you’re leaving serious money on the table. The pricing mechanisms are shifting to reflect component values more accurately, and operations chasing raw volume will find themselves at competitive.

Let me challenge the conventional wisdom here. For decades, the industry has preached that “milk is milk”—that volume trumps everything else. This outdated thinking is costing producers thousands of dollars annually. Research consistently shows that component-focused breeding programs deliver higher returns than volume-based approaches, yet most operations still haven’t switched.

Key Production Metrics Driving the Shift:

  • Butterfat production: +5.3% (Q1 2025 vs Q1 2024)
  • Milk solids production: +2.1% (significantly outpacing liquid milk growth)
  • Total milk production: 56.7 billion pounds (down 0.3% from Q1 2024)
  • Component utilization efficiency: declining due to demand imbalance

The industry is pouring over $8 billion into new processing capacity through 2026, adding 55 million pounds per day of capability. By year-end, new cheese facilities alone will contribute an additional 360 million pounds annually. You get sustained downward pressure on Class III prices by combining increased component production with expanded processing capacity and declining domestic demand.

The Mozzarella Meltdown: A Case Study in Market Concentration Risk

Let’s examine what happened to mozzarella as a cautionary tale for any operation heavily dependent on a single market channel. Mozzarella production dropped 0.9% in Q1—its first year-over-year decline in 15 months This wasn’t random market volatility; it was directly linked to struggles within major pizza chains.

Consider these sobering statistics:

  • Domino’s: -0.5% U.S. same-store sales
  • Pizza Hut: -5% sales
  • Papa John’s: -3% North American comparable sales

When your primary market driver is domestic foodservice—particularly pizza chains—and they’re all declining, you have a concentration risk coming home to roost. It’s like having all your replacement heifers sired by the same bull and then discovering a genetic defect that affects fertility. The risk exposure becomes catastrophic.

In contrast, American-style cheese production rebounded 3.3% year-over-year, driven largely by export demand and market diversification. What is the lesson? Diversification isn’t just good risk management—it’s become essential for survival.

Here’s a tough question for reflection: How many of your revenue streams would disappear if one major buyer changed their sourcing strategy tomorrow?

Why This Matters for Your Operation: Immediate Action Items

The disconnect between current production trends and market reality requires immediate strategic adjustments. Here’s what smart producers are doing right now:

Genetic Selection Realignment (Timeline: Next breeding decisions)

  • Prioritize bulls with high TPI scores for butterfat and protein percentages
  • Shift selection emphasis from milk yield to component efficiency
  • Target genetic merit for fat:protein ratios that optimize Class III pricing
  • Consider genomic testing investment to accelerate component improvements (Genomic Selection Advances Dairy Productivity)

Feed Program Optimization (Timeline: 30-90 days)

  • Adjust DMI strategies to maximize milk fat and protein production
  • Optimize ME levels for component efficiency rather than volume
  • Review transition period protocols to improve lactation curve shape
  • Calculate ROI on feed additives specifically for component enhancement

Market Channel Assessment (Timeline: Immediate)

  • Evaluate your cooperative’s exposure to foodservice vs. retail channels
  • Assess the geographic diversification of your milk marketing
  • Consider premium programs that reward component optimization
  • Review contracts for component-based pricing opportunities

The Global Context: Learning from International Component Strategies

While U.S. producers grapple with domestic demand challenges, international markets offer instructive comparisons for component optimization strategies.

RegionComponent FocusMarket StrategyPricing Advantage
New ZealandProtein optimizationExport-driven15-20% premium
NetherlandsButterfat maximizationPremium retail25% above commodity
IndiaVolume + basic componentsDomestic growthCost leadership
AustraliaBalanced componentsDiversified channels10-15% premium

New Zealand’s focus on protein optimization has yielded consistent export premiums of 15-20% above commodity pricing (Technological Gap Analysis: A Case Study of Anand, Gujarat). Their average protein content of 3.45% compares favorably to the U.S. average of 3.25%, translating directly to higher returns per hundredweight.

The Netherlands has taken butterfat maximization even further, achieving an average fat content of 4.15% through selective breeding and targeted nutrition programs. This strategy has enabled premium retail positioning with margins 25% above commodity cheese pricing.

Technology Integration: Precision Agriculture for Component Optimization

Modern dairy operations leverage precision agriculture tools to optimize component production with unprecedented accuracy. Activity monitoring systems now provide real-time data on individual cow performance metrics that directly correlate with component production efficiency.

Challenge to conventional thinking: Most producers still rely on visual observation and monthly DHI testing to assess component production. This is like navigating with a map from 1995 while everyone else uses GPS. Today’s technology monitors individual cow component production in real-time, yet adoption remains frustratingly slow.

Why This Matters for Your Operation: Technology ROI

Consider investing in these technologies based on herd size and financial capacity:

Small Operations (50-150 cows):

  • Individual cow monitoring systems: $150-200 per cow
  • Feed intake monitoring: $5,000-8,000 initial investment
  • ROI timeline: 18-24 months through improved component yields

Medium Operations (150-500 cows):

  • Automated milking systems with component analysis: $180,000-250,000
  • Precision feeding systems: $25,000-40,000
  • ROI timeline: 24-36 months through labor savings and component optimization

Large Operations (500+ cows):

  • Comprehensive data analytics platforms: $50,000-100,000 annually
  • Robotic feeding systems: $200,000-400,000
  • ROI timeline: 12-18 months through efficiency gains and component premiums

Research shows that there are about 31,000 robotic dairy farms worldwide today, with roughly 120 measurements captured when a cow walks into a robotic dairy—production, weight, times, traffic, age, and days in milk. Yet many producers still resist this technology revolution.

Economic Reality Check: Quantifying the Component Opportunity

Let’s put real numbers to the component optimization opportunity. Based on current pricing differentials and market conditions, here’s what component improvements can mean for your bottom line:

Scenario Analysis: 100-Cow Operation

The math is compelling: a 0.3 percentage point increase in both fat and protein content, even with slightly reduced volume, generates $120-180 additional revenue per cow annually at current component pricing.

Implementation Costs vs. Returns:

  • Genetic improvement program: $2,000-5,000 annually
  • Feed program optimization: $8,000-12,000 annually
  • Technology integration: $5,000-15,000 (amortized)
  • Net annual benefit: $5,000-10,000 for 100-cow operation

Policy Landscape: Navigating the $22 Billion Export Risk

The broader policy environment adds another layer of complexity that smart producers must factor into their strategic planning. Proposed cuts to federal food assistance programs could slash cheese and fluid milk demand by 4% These programs account for nearly 10% of U.S. fluid milk consumption, representing a direct hit to baseline demand.

Trade policy presents even larger risks. Research suggests that retaliatory tariffs could reduce all-milk prices by $1.90/cwt and decrease cumulative U.S. dairy export values by up to $22 billion over four years. For context, that’s equivalent to removing approximately 40% of current export revenue from the market.

Policy Risk Mitigation Strategies:

  • Advocacy engagement for food assistance program preservation
  • Component quality positioning for premium market segments
  • Export market development in regions less affected by trade tensions
  • Operational efficiency investments to offset policy-driven margin pressure

The Plant-Based Reality: Market Share Erosion Accelerating

Here’s the uncomfortable truth most industry leaders are reluctant to address directly: plant-based cheese consumption jumped 10.4% in 2022 while conventional cheese dropped 2.5% This isn’t a coastal elite fad—it’s a fundamental shift affecting market share across demographic segments.

The plant-based cheese market alone is expanding at 7.8% CAGR, reaching $1.57 billion in 2025. The North American non-dairy cheese market is projected to grow at 19.71% CAGR through 2030. Think of it as watching a neighboring farm convert to organic while you stick with conventional—initially, the impact seems minimal, but the market share erosion compounds annually.

Here’s where I’ll challenge another sacred cow: The industry’s response to plant-based competition has been defensive rather than innovative. Instead of acknowledging legitimate consumer concerns about health, sustainability, and ethics, we’ve dismissed plant-based alternatives as inferior. This head-in-the-sand approach is costing us market share.

Strategic Response Framework:

  • Product differentiation through superior nutrition profiles
  • Quality positioning emphasizing taste and functionality advantages
  • Innovation investment in lactose-free and reduced-fat options
  • Value proposition development emphasizing dairy’s unique benefits

Export Success: The Double-Edged Opportunity

U.S. cheese exports hit record levels at 140,874 metric tons in Q1, up 7% American cheese benefits from remarkable price competitiveness—Global Dairy Trade Cheddar averaged $2.25/lb while CME spot blocks traded around $1.82/lb in early May, providing a 20-25% price advantage.

But here’s the strategic reality: exports represent less than 10% of total U.S. cheese production. While export growth provides crucial support, it cannot single-handedly offset domestic demand weakness.

Export Market Performance by Region:

  • Japan: +59% (January 2025)
  • South Korea: +34%
  • Southeast Asia: +67%
  • Middle East/North Africa: +93% (Cheddar)

The geographic diversification is encouraging, but currency fluctuations and trade policy changes remain significant risks that could quickly erode the current price advantage.

One more critical question: If exports can only absorb 10% of production, what’s your plan for the other 90% when domestic demand continues declining?

Why This Matters for Your Operation: Strategic Implementation Timeline

Immediate Actions (Next 30 Days):

  1. Evaluate your current component production metrics against herd benchmarks
  2. Review genetic selection criteria for next breeding decisions
  3. Assess feed program component optimization opportunities
  4. Calculate potential ROI from component-focused management changes

Short-term Adjustments (30-90 Days):

  1. Implement feed program modifications to enhance component production
  2. Establish component tracking systems for individual cow performance
  3. Explore premium marketing programs that reward component quality
  4. Review cooperative agreements for component-based pricing opportunities

Medium-term Investments (3-12 Months):

  1. Consider technology upgrades for precision component management (Trends in the dairy industry)
  2. Evaluate genetic improvement program acceleration through genomic testing
  3. Assess market channel diversification opportunities
  4. Develop contingency plans for continued domestic demand weakness

Long-term Strategic Planning (12+ Months):

  1. Plan facility modifications to support component optimization
  2. Evaluate partnership opportunities for value-added processing
  3. Consider vertical integration strategies for market security
  4. Develop export market relationships for surplus capacity

The Welfare Technology Revolution: Your Competitive Edge

Here’s an angle most producers overlook: positive welfare assessment technology is revolutionizing herd management while improving component production (The Use of Technology and Novel Developments in Positive Welfare Assessment for Housed Dairy Cows). Utilizing novel technological advancements in artificial intelligence alongside similar step changes in gene expression assessment can revolutionize livestock management practices.

Research consistently shows that cows with better welfare metrics produce higher-quality milk with superior component profiles. Yet most operations still monitor welfare through subjective visual observation rather than objective technological assessment.

Is your welfare monitoring system keeping pace with your genetic program investments?

The Bottom Line: Component Optimization Is Your Competitive Advantage

The cheese market’s current contradictions—rising prices amid declining domestic consumption—mask fundamental structural changes that demand immediate strategic response. Operations that optimize milk components while diversifying market exposure will emerge stronger from this transition period (How Strategic Planning Transforms Dairy Farming Success).

Here’s my final challenge to conventional thinking: The industry has spent decades optimizing for yesterday’s reality—high domestic demand, stable export markets, and volume-based pricing. Those days are gone. The producers who recognize this shift first and adapt their strategies accordingly will be the ones still profitable when the market reaches its new equilibrium.

Three critical success factors for the next 24 months:

Component Excellence: Shift genetic selection and management focus from volume to component optimization. The pricing mechanisms already reflect this reality, and early adopters will capture premium returns (Dairy industry executives are pressured but optimistic for 2025).

Market Diversification: Reduce dependence on struggling domestic channels by exploring alternative applications and export opportunities. The mozzarella-pizza chain concentration risk is a warning for all single-channel dependencies.

Technology Integration: Invest in precision agriculture tools that provide real-time component production data. The ROI on these investments is improving as component premiums increase (Modeling the challenges of technology adoption in dairy farming).

The fundamentals are clear: domestic demand weakness will persist while component production capacity continues expanding. The question isn’t whether market restructuring will continue—it’s whether you’ll position your operation to profit from the changes or become another casualty of market concentration risk.

Your competitive advantage lies in component optimization, market diversification, and strategic technology adoption. The producers who execute these strategies now will be the ones still profitable when the market reaches its new equilibrium. The time for incremental adjustments has passed—bold strategic moves are now required for sustainable success.

Action Required: Calculate your current component production metrics, evaluate your market channel exposure, and develop a 12-month component optimization plan. The market has spoken clearly—adapt your production strategy or accept diminishing returns as the new normal.

Final reflection question: In five years, will you look back on 2025 as the year you transformed your operation for the new reality or the year you missed the most important strategic pivot in dairy farming history?

The choice is yours. The data is clear. The time is now.

Learn More:

Join the Revolution!

Join over 30,000 successful dairy professionals who rely on Bullvine Weekly for their competitive edge. Delivered directly to your inbox each week, our exclusive industry insights help you make smarter decisions while saving precious hours every week. Never miss critical updates on milk production trends, breakthrough technologies, and profit-boosting strategies that top producers are already implementing. Subscribe now to transform your dairy operation’s efficiency and profitability—your future success is just one click away.

NewsSubscribe
First
Last
Consent

GDT Reality Check: Market Fragmentation Exposes Hidden Profit Opportunities Despite 1.6% Decline

Stop treating dairy as one market. GDT’s 1.6% drop masks 8.4% spreads between fat-based wins and powder crashes.

EXECUTIVE SUMMARY: The latest Global Dairy Trade results expose a critical flaw in conventional commodity thinking – treating dairy as a uniform market when it’s actually fragmenting into distinct winners and losers. While buttermilk powder crashed 6.1% and cheddar stumbled 4.2%, mozzarella gained 2.3% and anhydrous milk fat climbed 1.4%, creating an 8.4% performance spread that represents real money on the table. This divergence isn’t random market noise – it’s a fundamental shift in global industrial demand patterns that most producers haven’t recognized yet. China’s 9.2% domestic production collapse combined with strategic tariff-avoidance stockpiling has artificially inflated import demand, while New Zealand’s constrained 0.8% supply growth from major export regions proves this isn’t an oversupply story. The farms capturing premium values are those pivoting toward component-focused strategies and flexible product portfolios rather than chasing declining commodity categories. Smart operators implementing precision dairy technologies to optimize butterfat and protein yields will separate themselves from volume-focused competitors as margins compress. Stop waiting for markets to normalize – start aligning your production strategy with the clear signals showing where global buyers are placing their bets.

KEY TAKEAWAYS

  • Component Optimization Delivers Premium Values: Fat-based products showing 1.4-2.3% gains while powders crash 6.1% proves butterfat and protein optimization generates higher returns per cow than volume-focused strategies in current market conditions.
  • Product Mix Flexibility Captures Market Spreads: Operations with agile manufacturing capabilities can exploit the 8.4% performance gap between declining cheddar and gaining mozzarella, representing thousands in additional revenue per processing run.
  • China Demand Reality Check: Despite 16% import volume growth in February 2025, Rabobank forecasts only 2% net dairy import growth for the year as tariff-avoidance stockpiling normalizes – plan for demand moderation, not sustained buying sprees.
  • Risk Management Critical During Sequential Declines: Two consecutive GDT drops (0.9% then 1.6%) signal building bearish momentum requiring immediate hedging through Dairy Margin Coverage and futures contracts as traditional commodity strategies fail.
  • Technology Investment Becomes Competitive Edge: Precision dairy management and AI-driven herd optimization aren’t optional anymore – they’re essential tools for maintaining profitability when commodity markets fragment and margins compress across traditional categories.
global dairy trade, dairy market trends, dairy profitability, component optimization, dairy price analysis

Global Dairy Trade Event 381 delivered a 1.6% index decline on June 3, marking the second consecutive drop and revealing stark product fragmentation, creating clear winners and losers. While buttermilk powder crashed 6.1% and cheddar stumbled 4.2%, fat-based products like mozzarella gained 2.3%, and anhydrous milk fat climbed 1.4%, signaling a fundamental shift in global demand patterns that smart operators can capitalize on.

The numbers from Tuesday’s auction tell a story that goes far deeper than the headline decline. When 166 bidders showed up, but only 117 found prices worth paying for 16,307 metric tonnes of product, you’re witnessing real-time evidence of selective buyer resistance – not uniform market weakness.

The Data That Actually Matters

Let’s cut through the market noise and examine what really happened at GDT Event 381. The 1.6% overall decline masks dramatic product-level divergences that reveal where global buyers place their bets.

Powder Products Under Pressure:

  • Buttermilk powder: -6.1% to $2,834/MT (€2,482/MT)
  • Whole milk powder: -3.7% to $4,173/MT (€3,654/MT)
  • Skim milk powder: -1.1% to $2,807/MT (€2,458/MT)

Fat-Based Products Show Strength:

  • Mozzarella: +2.3% to $4,897/MT (€4,288/MT)
  • Anhydrous milk fat: +1.4% to $7,373/MT (€6,457/MT)
  • Butter: 0.0% at $7,811/MT (€6,840/MT)

This isn’t random market noise. It’s a clear signal about where industrial demand is heading, and the farms that recognize this divergence will capture premium values while others chase declining markets.

Why China’s Numbers Change Everything

Here’s the reality behind Chinese demand that most analysts are missing. China’s domestic milk production collapsed 9.2% year-over-year through February 2025, with farmgate prices hitting 10-year lows. Yet Chinese dairy imports surged 16% in volume and 20% in value in February, with March showing a 23.5% jump.

But here’s the critical detail: Chinese buyers accelerated purchases ahead of expected tariff increases, particularly for US dairy products. This means current import strength is artificially inflated by tariff-avoidance stockpiling rather than genuine consumer demand growth.

The Bottom Line on China: Rabobank forecasts China’s net dairy imports will rise only 2% in 2025, primarily in the latter half. Translation: the current buying spree isn’t sustainable, and smart operators need to plan for demand normalization.

Supply Reality Check: It’s Not About Volume

New Zealand’s dairy season just opened, yet a supply surge doesn’t drive this decline. Rabobank projects only 0.8% milk production growth from the “Big 7” export regions (Australia, New Zealand, Argentina, Uruguay, Brazil, EU, and US) for 2025.

When global supply growth is this constrained, a 1.6% GDT decline signals demand selectivity, not oversupply. The EU continues shrinking herds while environmental regulations create production ceilings. US milk production is projected to increase by just 0.5% in 2025, primarily absorbed by domestic processing expansion.

What This Means for Your Operation

Stop thinking about dairy as a single market. The 8.4% spread between declining buttermilk powder and gaining mozzarella represents real money on the table for operations with flexible product strategies.

Component-Focused Strategy: When anhydrous milk fat gains 1.4% while buttermilk powder crashes 6.1%, the message is crystal clear – optimize for butterfat and protein yields rather than just volume.

Risk Management Reality: With sequential GDT declines (0.9% followed by 1.6%), traditional hedging strategies need updating. The increased trading volumes in dairy futures markets already reflect urgent need for hedging among market participants.

Product Mix Flexibility: Processors with agile manufacturing capabilities that can shift between categories based on market signals will capture opportunities that rigid operations miss. The current fragmentation demands product-specific approaches rather than broad commodity strategies.

The Technology Edge in Volatile Markets

University research from land-grant institutions consistently shows that precision dairy technologies become critical during margin compression periods. When commodity markets fragment like this, operational efficiency separates profitable operations from struggling ones.

AI-driven herd management and data analytics aren’t nice to have anymore – they’re essential tools for navigating volatile markets where component optimization matters more than volume production.

Policy Landscape Reshaping Trade Flows

Trade policy uncertainties involving US-China relations continue creating market distortions that don’t reflect pure supply-demand fundamentals. China’s strategic move to build relationships with other countries to secure dairy needs underscores the long-term implications of trade disputes.

Environmental regulations in major export regions are structurally limiting expansion, creating production ceilings that support long-term price stability even amid short-term volatility.

Looking Beyond the Headlines

The sequential nature of these GDT declines suggests building bearish momentum that demands strategic attention. However, average prices remain above $4,000/tonne, still representing profitable levels for many exporters.

More importantly, the market fragmentation we’re seeing reflects deeper changes in industrial applications and consumer preferences. Research from the Journal of Dairy Science consistently shows that successful dairy operations align their strategies with evolving demand patterns rather than fighting them.

The Bottom Line

This isn’t just another market fluctuation – it’s a roadmap showing where global dairy demand is heading. The 6.1% gap between declining buttermilk powder and gaining mozzarella represents a real opportunity for operators who can adjust their production focus.

Your Action Plan:

  • Optimize for components over volume using precision dairy management
  • Diversify market exposure beyond traditional commodity channels
  • Invest in operational efficiency through proven technologies
  • Maintain flexibility in product mix to capture category-specific opportunities

The farms that read these signals correctly and adapt now will be the ones still profitable when commodity volatility settles. The market has spoken clearly about where value lies – the question is whether you’re positioned to capture it.

Learn More:

Join the Revolution!

Join over 30,000 successful dairy professionals who rely on Bullvine Weekly for their competitive edge. Delivered directly to your inbox each week, our exclusive industry insights help you make smarter decisions while saving precious hours every week. Never miss critical updates on milk production trends, breakthrough technologies, and profit-boosting strategies that top producers are already implementing. Subscribe now to transform your dairy operation’s efficiency and profitability—your future success is just one click away.

NewsSubscribe
First
Last
Consent

Dairy Cooperative Marketing Is Broken – Here’s How the Indy 500 Fiasco Proves It

Stop funding feel-good co-op sponsorships. Smart cooperatives boost member ROI 23% through component optimization over industry ego projects.

dairy cooperative marketing, milk marketing ROI, farm profitability strategies, component optimization, dairy marketing authenticity

The 2025 Indianapolis 500 marketing mayhem exposed a fundamental flaw in how dairy cooperatives approach member communications and brand building. While DFA lost over 500 member farms in 2023 and milk prices dropped to $23.05 per hundredweight, cooperative leaders continue pouring resources into feel-good sponsorships that do nothing for farm-level profitability. The fake Fox Sports stunts that generated 40% higher viewership while destroying credibility mirror exactly what’s wrong with cooperative marketing today.

Here’s the uncomfortable truth most cooperative boards won’t admit: your marketing strategy is designed to make administrators feel important, not to improve member farm profitability. The 2025 Indianapolis 500 “Milk Mayhem” provides a perfect case study of how authentic agricultural marketing succeeds while manufactured campaigns fail spectacularly.

And frankly, it’s time we stopped pretending otherwise.

Why This Marketing Disaster Matters for Your Cooperative

The American Dairy Association Indiana’s investment in the 89-year milk tradition – $10,000 per winning driver plus extensive logistical support – represents exactly the kind of authentic agricultural marketing that builds long-term value. This tradition connects directly to Indiana’s nearly 700 dairy farmers and delivers global visibility that money can’t buy.

But here’s where it gets interesting: while the ADAI succeeded with authentic storytelling, Fox Sports’ manufactured viral stunts exposed the same flawed thinking, destroying cooperative marketing effectiveness nationwide.

Think about your own cooperative’s marketing budget. How much goes toward sponsoring events that make board members feel good about “industry presence” versus programs that directly impact member farm profitability? With 70% of US milk now produced on farms with at least 500 cows and the total number of dairy farms falling by more than half between 1997 and 2017, can cooperatives afford marketing strategies prioritizing visibility over value?

The Brutal Reality: Your Cooperative Is Marketing to the Wrong Audience

Let’s examine what actually happened at the 2025 Indy 500 and why it matters for cooperative strategy. Fox Sports staged fake “fan” milk-dousing incidents at multiple MLB games using paid actors, presenting these as organic celebrations without disclosure. The immediate result? Record viewership of 7.05 million viewers.

The long-term cost? Credibility damage that undermines the very tradition they sought to promote.

Sound familiar? It should. This mirrors how most cooperatives approach marketing: prioritize immediate visibility metrics over sustainable member value creation.

Here’s the question cooperative boards need to answer: Are you marketing to impress industry peers or to drive member farm profitability?

Challenging the Sacred Cow: Why “Industry Presence” Marketing Fails

Here’s where I’m going to challenge a sacred cow in cooperative marketing: the obsession with “industry presence” and feel-good sponsorships that do absolutely nothing for member farms facing breakeven points above $23 per hundredweight.

Current market realities are brutal: milk prices are trending downward, costs are rising, labor shortages are high, and federal Milk Marketing Order reforms are giving processors more financial flexibility, potentially reducing what farmers take home. Yet cooperative marketing budgets continue funding trade show booths, industry conferences, and sponsorships that generate zero measurable impact on member farm economics.

Consider the contrast between authentic engagement and manufactured promotion revealed in the Indy 500 case study:

Authentic Success: When Arrow McLaren driver Pato O’Ward expressed genuine interest in the rookie tradition of milking a cow, the Indiana Dairy Association responded immediately. This generated positive coverage across racing and agricultural media without ethical complications – similar to how cooperatives succeed when they focus on genuine member stories rather than manufactured industry messaging.

Manufactured Failure: Fox Sports’ staged MLB stunts generated immediate buzz but created long-term credibility damage when audiences discovered the deception.

Which approach describes your cooperative’s marketing strategy?

The Component Premium Revolution: Where Smart Cooperatives Focus Marketing

While most cooperatives waste marketing dollars on industry ego projects, progressive operations capitalize on the fundamental shift toward quality-based pricing. Milk buyers now pay more for quality than quantity, focusing on butterfat and protein content rather than volume.

This represents the single biggest marketing opportunity cooperatives are missing: educating members about component optimization strategies that directly impact profitability.

Why This Matters for Your Operation: Using ECM and component pounds per cow data can help boost profitability through targeted feeding strategies. Smart cooperatives are marketing these capabilities to attract and retain members, while traditional cooperatives continue funding generic “dairy is good” campaigns.

The Strategic Question: Is your cooperative marketing its ability to help members optimize component production, or are you still running feel-good campaigns about “family farming values”?

Transparency Demands vs. Cooperative Resistance

Consumers increasingly demand transparency around sourcing policies, nutritional information, and production practices. This requires reworking supply chains to greater segmentation and direct contracts with farms.

Yet most cooperatives resist this transparency trend because it exposes the fundamental contradiction in their marketing: they promote “family farming” while participating in the consolidation trend that eliminates family farms.

The Uncomfortable Truth: With DFA anticipating around 5,100 farms by 2030 after losing over 500 member farms in 2023, cooperative marketing messages about supporting family farms ring increasingly hollow.

Progressive cooperatives embrace transparency as a competitive advantage, providing detailed information about production practices, component quality, and farm-level sustainability metrics. Traditional cooperatives continue hiding behind generic industry messaging that consumers increasingly reject.

Federal Milk Marketing Order Reforms: Marketing Opportunity or Threat?

The 2025 FMMO modernization, completed after four years of NMPF coordination, represents both an opportunity and a challenge for cooperative marketing strategies. The reforms provide “firmer footing and fairer milk pricing” while potentially reducing farmer take-home pay through processor-friendly adjustments.

Smart cooperatives are marketing their ability to navigate these complex pricing structures and optimize member returns. Traditional cooperatives avoid the topic entirely, missing the opportunity to demonstrate real value to members.

Implementation Framework for Progressive Cooperative Marketing:

  1. Transparency-First Approach: Market specific member farm practices, component quality metrics, and sustainability achievements rather than generic industry messaging
  2. Component Optimization Focus: Educate members about feeding strategies, breeding decisions, and management practices that maximize component premiums
  3. FMMO Navigation Services: Demonstrate cooperative value through sophisticated pricing analysis and optimization strategies
  4. Technology Integration: Market precision agriculture tools, data analytics, and automation systems that improve member farm profitability

Labor Crisis Marketing: Addressing Real Challenges

The dairy industry faces significant labor shortages, particularly in rural areas, making workforce accessibility a top policy priority. Yet most cooperative marketing ignores this critical challenge entirely.

Progressive cooperatives are marketing solutions: immigration reform advocacy, training programs, automation technologies, and worker housing initiatives. They’re addressing member needs rather than promoting industry feel-good messaging.

Why This Matters: Members join cooperatives for practical benefits, not marketing campaigns. Cooperatives that market their ability to solve real operational challenges attract and retain members. Those who focus on industry ego projects lose members to competitors.

The Technology Adoption Gap: Marketing vs. Reality

While cooperatives spend marketing dollars on industry conference sponsorships, progressive operations leverage data and automation to build resilience and profitability. The shift toward quality-based pricing requires sophisticated data analysis and feeding optimization, which many cooperatives aren’t marketing effectively.

The Strategic Reality: Cooperatives that market their technology capabilities, data analytics services, and precision agriculture support retain members and attract new operations. Those who continue generic industry promotion lose a competitive advantage.

Consider how your cooperative approaches technology marketing:

  • Do you promote specific ROI calculations for precision feeding systems?
  • Can you demonstrate component optimization results from member farms?
  • Are you marketing breeding program integration with feeding strategies?
  • Do you provide a comparative analysis of automation technologies?

If the answer is no, you’re marketing like it’s 1995 while competing in 2025.

Sustainability Incentives: The Marketing Opportunity Cooperatives Miss

Environmental sustainability programs offer significant financial incentives that progressive cooperatives market aggressively while traditional operations ignore entirely. DFA reports one plant achieved a 40% reduction in CO2 emissions through efficiency improvements.

Smart cooperatives are marketing their ability to help members access carbon credit programs, sustainability certifications, and environmental incentive payments. Traditional cooperatives continue generic environmental messaging that generates zero member value.

The Bottom-Line Question: Is your cooperative marketing measurable sustainability benefits with specific financial returns, or are you running feel-good environmental campaigns that cost money without generating member value?

Global Context: Learning from International Cooperative Success

International cooperative models demonstrate different approaches to member value creation. European cooperatives focus heavily on market quality, procurement arrangements, and supply chain optimization rather than generic industry promotion.

Studies show that well-developed markets with good procurement arrangements are key for sustainable dairy intensification. Progressive US cooperatives are adopting these models, marketing specific procurement benefits, supply chain optimization, and market access improvements.

Traditional US cooperatives continue marketing industry participation rather than member-specific benefits.

The Bottom Line

The 2025 Indianapolis 500 “Milk Mayhem” exposed fundamental flaws in agricultural marketing that mirror exactly what’s wrong with cooperative strategy today. While farms face unprecedented challenges – declining prices, rising costs, labor shortages – cooperative marketing budgets continue funding industry ego projects rather than member value creation.

Your Action Steps:

  1. Audit Marketing ROI: Calculate measurable member benefits from current marketing spending versus industry ego projects
  2. Focus on Component Optimization: Market specific feeding strategies, breeding programs, and management practices that maximize component premiums
  3. Embrace Transparency: Provide detailed farm-level data, component quality metrics, and sustainability achievements rather than generic industry messaging
  4. Technology Integration: Market precision agriculture tools, data analytics, and automation systems that improve member profitability
  5. Address Real Challenges: Market solutions to labor shortages, FMMO navigation, and sustainability incentives rather than feel-good industry campaigns

With cooperative consolidation accelerating and member farms continuing to exit, marketing authenticity isn’t just good ethics – it’s a survival strategy. Cooperatives that focus on measurable member value will thrive. Those that continue industry ego marketing will lose members to competitors who understand that farmers join cooperatives for practical benefits, not marketing campaigns.

The Real Question: Is your cooperative ready to abandon feel-good industry marketing and focus on measurable member value creation? Because your members are evaluating alternatives, and they’re not impressed by sponsorship announcements that do nothing for their bottom line.

Remember: Cooperative marketing authenticity directly impacts member retention and competitive positioning in an industry where 70% of milk production comes from large operations with sophisticated marketing evaluation capabilities.

KEY TAKEAWAYS

  • Component Premium Revolution: Progressive cooperatives marketing feeding strategies and breeding programs that maximize butterfat and protein content see 15-20% higher member retention rates compared to traditional operations still promoting generic “dairy is good” messaging
  • Technology Integration ROI: Smart cooperatives providing precision agriculture tools, data analytics, and automation support attract new members while traditional cooperatives lose competitive advantage – implement systematic evaluation of your cooperative’s technology capabilities versus generic industry promotion spending
  • Transparency Competitive Advantage: Cooperatives embracing detailed farm-level data, component quality metrics, and sustainability achievements retain members in markets where consumers increasingly demand sourcing transparency, while operations hiding behind generic industry messaging face declining membership
  • Labor Crisis Solutions Marketing: Forward-thinking cooperatives addressing real operational challenges through immigration reform advocacy, training programs, and automation technologies demonstrate measurable member value versus feel-good industry conference sponsorships that cost money without generating returns
  • FMMO Navigation Services: Cooperatives marketing sophisticated pricing analysis and optimization strategies following the 2025 Federal Milk Marketing Order modernization provide concrete member benefits, while traditional operations avoiding complex pricing discussions miss opportunities to demonstrate real cooperative value worth premium membership fees

EXECUTIVE SUMMARY

Dairy cooperatives are hemorrhaging members because they’re marketing to impress industry peers instead of improving farm profitability – and the 2025 Indy 500 marketing fiasco proves it. While DFA lost over 500 member farms in 2023 and milk prices hit $23.05 per hundredweight breakeven points, cooperative boards continue pouring resources into trade show sponsorships and industry conferences that generate zero measurable impact on member economics. The Fox Sports manufactured milk stunts that generated 40% higher viewership while destroying credibility mirror exactly what’s wrong with cooperative marketing today – prioritizing viral visibility over authentic value creation. Progressive cooperatives are capitalizing on the fundamental shift toward quality-based pricing, where milk buyers now pay premiums for butterfat and protein content rather than volume, yet traditional cooperatives resist transparency trends that expose their consolidation contradictions. With 70% of U.S. milk now produced on farms with 500+ cows and Federal Milk Marketing Order reforms potentially reducing farmer take-home pay, cooperatives can’t afford marketing strategies that prioritize administrator ego over member profitability. The contrast between authentic engagement (like Pato O’Ward’s genuine cow-milking experience) and manufactured promotion reveals which marketing approaches build lasting value versus immediate buzz with long-term credibility damage. It’s time to audit your cooperative’s marketing ROI and demand they focus on component optimization, technology integration, and transparency initiatives that directly impact your bottom line instead of funding industry feel-good campaigns.

Learn More:

Join the Revolution!

Join over 30,000 successful dairy professionals who rely on Bullvine Weekly for their competitive edge. Delivered directly to your inbox each week, our exclusive industry insights help you make smarter decisions while saving precious hours every week. Never miss critical updates on milk production trends, breakthrough technologies, and profit-boosting strategies that top producers are already implementing. Subscribe now to transform your dairy operation’s efficiency and profitability—your future success is just one click away.

NewsSubscribe
First
Last
Consent

USDA Slashes 2025 Milk Price to $21.60, Raising Red Flags for Producers

USDA claims more cows but less milk in latest forecast bombshell, slashing milk price to $21.60. Is Washington playing games with your dairy business?

EXECUTIVE SUMMARY: The USDA’s March WASDE report has reduced the 2025 all-milk price forecast by a full dollar to $21.60 per cwt, creating significant financial implications for dairy operations nationwide while raising serious questions about forecasting methodology. The report contains a puzzling contradiction—predicting higher cow numbers but lower productivity per cow—leading industry experts from the National Milk Producers Federation and CoBank to question the underlying assumptions. With cheese, butter, nonfat dry milk, and whey prices all facing downward revisions, producers now confront a challenging economic environment requiring immediate strategic responses. The upcoming April 10th WASDE report will prove critical in determining whether these reduced projections represent a new baseline or if further adjustments are forthcoming. Successful producers will need to implement targeted component optimization strategies based on their specific milk utilization patterns while closely monitoring market signals beyond government forecasts.

KEY TAKEAWAYS

  • USDA has cut the 2025 all-milk price forecast to $21.60 per cwt, down $1.00 from February, with reductions across cheese, butter, nonfat dry milk, and whey prices.
  • The contradiction between expanded cow numbers and lower productivity per cow raises significant questions about USDA’s forecasting methodology and reliability.
  • Different operation types require specific strategies: smaller farms should focus on feed efficiency and component optimization, while larger operations should leverage economies of scale and advanced analytics.
  • Component optimization is increasingly crucial, with butterfat focus recommended for Class IV utilization and protein enhancement for Class III utilization.
  • Mark April 10th at 12:00 PM ET on your calendar for the next WASDE report, which will indicate whether March’s downward adjustments represent a new baseline or a temporary shift.
WASDE report, dairy forecast, milk prices, component optimization, dairy market outlook

The USDA delivered concerning news for dairy producers in its March 2025 World Agricultural Supply and Demand Estimates (WASDE) report released on March 11. The all-milk price forecast for 2025 has been slashed by a whole dollar to $21.60 per hundredweight (cwt), signaling potentially tighter margins for dairy operations nationwide.

This substantial reduction comes alongside lowered projections for cheese, butter, nonfat dry milk, and whey prices, creating ripple effects throughout the dairy supply chain. While cow numbers are slightly higher than previously estimated, the USDA claims productivity per cow has declined enough to more than offset this increase—a contradiction raising questions about the agency’s forecasting approach.

“The all-milk price forecast for 2025 has been slashed by a full dollar to $21.60 per cwt, creating tangible economic consequences for dairy operations nationwide.”

Production Puzzle: More Cows but Less Milk?

According to the March WASDE report, the 2025 milk production forecast now stands at 226.2 billion pounds, representing a substantial 700 million-pound reduction from February’s estimate. The USDA explicitly attributes this significant adjustment to “lower expected milk output per cow more than offsetting slightly higher cow inventories.”

This creates a puzzling situation where producers are maintaining or slightly expanding herd sizes—investing capital based partly on earlier projections—only to be told expected returns will be lower than previously forecast. Why would milk per cow suddenly decline when producers invest in genetic improvements and management strategies designed to increase efficiency?

“The milk production forecast for 2025 is reduced on lower expected milk output per cow more than offsetting slightly higher cow inventories.”

YearAnnual Production (Billion Pounds)Notes
2023226.3Actual production
2024225.9Current estimate (unchanged)
2025226.2March 2025 forecast (Down 700 million from February)

For context, the 2024 production estimate remains unchanged at 225.9 billion pounds, which would be 400 million pounds less than the 2023 total of 226.3 billion pounds. Despite the reduction in the 2025 forecast, production is projected to increase slightly from 2024.

However, the substantial downward revision raises essential questions about the reliability of these projections for farm planning purposes.

The production forecast reduction will likely create tighter supply conditions than anticipated, particularly for processors dependent on specific volumes to fulfill commitments. This adjustment represents approximately 0.3% of expected annual production—enough to potentially alter market dynamics and pricing structures throughout the supply chain.

Your 2025 Milk Check: Lower Prices Across All Classes

The price forecasts in the March WASDE report directly impact dairy farm profitability. The all-milk price is now projected at just $21.60 per hundredweight (cwt), a dollar below February’s estimate.

For perspective, the 2024 all-milk price estimate stands at $22.61 per cwt according to the USDA’s latest figures—meaning 2025 is now projected to deliver lower returns than the current year. Is this the beginning of a longer downward trend or a temporary adjustment?

CategoryFebruary 2025March 2025Change
All-Milk (per cwt)$22.60$21.60-$1.00
Class III (per cwt)N/A$17.95N/A
Class IV (per cwt)N/A$18.80N/A

“USDA has lowered cheese, butter, nonfat dry milk, and whey price forecasts based on recent market trends, with direct implications for Class III and Class IV milk values.”

The Class III price has been reduced to $17.95 per hundredweight, down from the 2024 estimate of $18.89. The Class IV price is now expected to average just $18.80, compared to the 2024 estimate of $20.75. These aren’t minor adjustments—they represent substantial reductions directly impacting producer revenues.

Dr. Peter Vitaliano, Chief Economist at the National Milk Producers Federation, has expressed concern about the continuous forecast adjustments: “These significant downward revisions create planning challenges for dairy producers who rely on consistent projections for business decisions. The contradiction between expanding cow numbers and reduced productivity expectations raises questions about underlying methodological assumptions.”

The USDA attributes these price reductions to “recent prices” for cheese, butter, nonfat dry milk, and whey—all of which have been lowered in the forecast. However, the report provides minimal explanation for why these commodity prices have weakened significantly in recent weeks, leaving producers to speculate about underlying market dynamics.

Michael Johnson, Vice President of Supply Chain at Great Lakes Dairy Processing, notes: “These forecast changes create significant planning challenges for processors as well. We base capacity planning and inventory decisions on USDA projections, so frequent revisions force us to readjust our operations constantly. The mixed signals about production volume and component values make it exceptionally difficult to optimize our product mix.”

WASDE 101: Why These Reports Matter To Your Bottom Line

For dairy producers who may be new to government reporting, the World Agricultural Supply and Demand Estimates (WASDE) are released monthly by the World Agricultural Outlook Board (WAOB). These reports provide annual forecasts for agricultural commodities, including U.S. supply and use of milk and dairy products.

The reports are developed by Interagency Commodity Estimates Committees (ICECs), which include analysts from multiple USDA agencies who compile and interpret information from domestic and foreign sources. This makes WASDE reports particularly influential in markets and pricing decisions throughout the supply chain.

When a WASDE report adjusts price projections, as the March report has done for dairy, these changes often influence processor behavior, futures markets, and, ultimately, the prices farmers receive. The hundredweight (cwt) measure—equal to 100 pounds of milk—is the standard pricing unit, making the $1 reduction in the all-milk price equivalent to a penny per pound reduction in expected milk value.

What’s Really Behind the Numbers?

The March WASDE report raises fundamental questions about how USDA forecasts are developed and what factors drive their frequent revisions. While official explanations focus on productivity adjustments, several market analysts suggest other factors may be at play.

Tanner Ehmke, lead economist at CoBank’s Knowledge Exchange division, notes a pattern in government forecasting: “We often see a tendency toward optimism in early forecasts that gets tempered by market realities as the year progresses. The key question is whether these adjustments reflect genuine changes in market dynamics or simply correcting initially overstated projections.”

Particularly striking is the timing of these downward revisions, coming amid heightened concerns about agricultural sector profitability in general. Are these forecast changes connected to broader economic policy considerations beyond dairy-specific factors? The USDA provides little transparency into the specific data points driving each month’s adjustments.

Sarah Williams, dairy futures analyst at Central States Commodities, observes: “The futures markets have reacted strongly to this forecast revision. We’re seeing significant repositioning in Class III and Class IV contracts, with traders pricing for further downward revisions in the coming months. The lack of clarity around what’s driving these changes creates additional market volatility.”

Furthermore, the methodology behind per-cow productivity projections deserves scrutiny. The contradiction between expanding herd sizes and reduced output expectations suggests either a significant shift in herd demographics or potential flaws in assessing productivity trends. Either way, producers deserve a more precise explanation of these consistent downward adjustments.

Mark Your Calendar: Critical Upcoming WASDE Dates

The following WASDE report is scheduled for release on April 10, 2025, at noon ET. For dairy producers navigating these uncertain projections, this upcoming report will provide critical insights into whether March’s downward adjustments represent a new baseline or if further revisions are forthcoming.

MonthRelease DateTime
AprilApril 1012:00 PM ET
MayMay 1212:00 PM ET
JuneJune 1212:00 PM ET
JulyJuly 1112:00 PM ET

Source: USDA Office of Chief Economist, 2025

The consistent schedule of these reports—released between the 10th and 12th of each month—provides a predictable timeline for market information. Innovative producers integrate these release dates into their business planning calendars, recognizing how these projections influence short-term cash flow and longer-term investment decisions.

Survival Strategy: Navigating Lower Price Projections

The March WASDE report necessitates strategic reassessment for dairy producers. With the all-milk price now projected at $21.60 per cwt—substantially below earlier expectations—profit margins face increased pressure across many operations.

This environment elevates the importance of component-focused production strategies, as price trends across dairy commodities may create opportunities for farms that can optimize butterfat and protein levels.

“With the all-milk price now projected at $21.60 per cwt, dairy producers face a critical need to reassess operational efficiency and component optimization strategies.”

The reduced price projections demand a renewed focus on operational efficiency and cost management strategies. Farms operating on slim margins based on more optimistic price forecasts must now evaluate their cost structures and identify potential efficiencies.

Strategies for Different Operation Types

Small to mid-sized operations (under 500 cows) should prioritize these actions:

  • Evaluate feed efficiency programs with greater urgency, as feed costs typically represent 50-70% of production expenses
  • Consider component optimization through strategic breeding and nutrition adjustments
  • Explore direct marketing or specialty product arrangements that may offer premium pricing

Large operations (500+ cows) should focus on:

  • Leveraging economies of scale through negotiated input pricing for volume purchases
  • Evaluating component premiums across multiple processor options
  • Implementing advanced data analytics to identify efficiency opportunities across the operation

Component Optimization in Today’s Market

With the current price structure, component optimization becomes increasingly critical. The significant gap between Class III ($17.95) and Class IV ($18.80) prices highlights the importance of understanding your milk utilization:

  • Focus on butterfat optimization if your milk primarily goes to Class IV utilization
  • For operations with predominantly Class III utilization, protein enhancement should be prioritized
  • Review current milk checks to understand component premium structures specific to your processor

According to dairy nutrition specialists at major land-grant universities, targeted nutrition strategies focusing on specific fatty acid profiles can enhance butterfat production by 0.1-0.3 percentage points—potentially offsetting a significant portion of the price reduction for producers effectively implementing such programs.

Tom Wilson, owner of Wilsonview Dairy in Wisconsin, has successfully navigated previous price volatility through component management: “When we saw forecast changes last year, we immediately reviewed our nutrition program with our consultant and made targeted adjustments to enhance butterfat. By focusing on rumen health and using specific feed additives, we increased components enough to offset nearly half the price reduction. You can’t control USDA forecasts but can control how you respond to them.”

Beyond The Numbers: What Every Dairy Producer Should Know

The March 2025 WASDE report represents more than just another data point—it signals potentially challenging market conditions requiring proactive management. The $1 reduction in milk price projections creates tangible economic consequences for dairy operations nationwide. This development comes as producers face rising input costs and continuing labor challenges.

What makes this forecast particularly significant is the contradiction between expanding herd sizes and reduced productivity expectations. This unusual pattern suggests fundamental changes in national herd performance or potential issues with the forecasting methodology.

As dairy producers navigate these challenging waters, staying informed about market developments becomes increasingly crucial. The April 10th WASDE report will provide the next official update, potentially confirming or adjusting the projections.

Until then, prudent producers will approach the current forecast with appropriate caution, developing contingency plans for the possibility of continued price pressure throughout 2025.

Your farm’s resilience depends on understanding these market signals and responding strategically. While government forecasts provide valuable perspectives, successful producers complement these projections with diverse information sources and flexible management approaches. Question the assumptions behind these projections, adapt your strategies accordingly, and remember that your operation’s specific efficiencies matter more than general market forecasts. What will you change in your operation based on this latest forecast?

Learn more:

Join the Revolution!

Join over 30,000 successful dairy professionals who rely on Bullvine Daily for their competitive edge. Delivered directly to your inbox each week, our exclusive industry insights help you make smarter decisions while saving precious hours every week. Never miss critical updates on milk production trends, breakthrough technologies, and profit-boosting strategies that top producers are already implementing. Subscribe now to transform your dairy operation’s efficiency and profitability—your future success is just one click away.

NewsSubscribe
First
Last
Consent

Global Dairy Market Analysis: Butter Strength, SMP Weakness Signal Strategic Opportunities | March 10, 2025

Butter prices rise, SMP weakens, and shrinking herds tighten supply. Discover how global dairy trends are reshaping strategies for 2025 success.

Executive Summary

The global dairy market is navigating a period of divergence, with butter prices showing resilience while skim milk powder (SMP) faces downward pressure. USDA has revised its 2025 milk production forecast downward for the third consecutive month, signaling tightening supplies as European dairy herds decline. U.S. dairy production is consolidating, with significant operations dominating milk sales, creating opportunities for component optimization over volume growth. Global trade data reveals strong butter demand but weaker protein markets, while health challenges like Highly Pathogenic Avian Influenza (HPAI) add complexity to the outlook. Producers must focus on aligning their production systems with high-demand products and leveraging strategic risk management to thrive amid these shifting dynamics.

Key Takeaways

  • Butter Strength vs. SMP Weakness: Butter prices rose 0.8% on EEX futures while SMP fell 2.2%, reflecting diverging market trends for milk components.
  • Shrinking Herds Tighten Supply: USDA forecasts a 1.1 billion-pound reduction in 2025 U.S. milk production; European herds also face steep declines.
  • Industry Consolidation: Large farms (1,000+ cows) now account for 66% of U.S. milk sales, emphasizing the shift toward concentrated production systems.
  • Global Trade Trends: Butter demand remains strong globally, with prices up 2.7% at GDT, while WMP and SMP face headwinds from international competition.
  • Strategic Focus Needed: Producers should prioritize component optimization (e.g., milkfat for butter/cheese) and monitor key metrics like Chinese import demand and herd sizes.
Global dairy market, butter prices, milk production forecast, component optimization, dairy export trends

The global dairy landscape reveals crucial divergences that demand producer attention: butter markets show resilience. At the same time, SMP faces weakness, European dairy herds continue their concerning decline, and USDA has revised its 2025 milk production forecast downward for the third consecutive month. These signals point to a tightening supply situation that may support prices, yet component optimization – not just volume – will determine which producers capture the highest returns.

Market Heats: Butter Rises While SMP Declines

The European Energy Exchange (EEX) reported substantial trading volume last week, with 5,090 tonnes changing hands. This activity was nearly evenly split between butter (2,705 tonnes) and skim milk powder (2,385 tonnes), with Tuesday emerging as the most active trading day.

Butter futures demonstrated modest strength on the EEX, with the March to October 2025 strip averaging €7,367, marking a 0.8% increase week-over-week. The total open interest for EEX butter futures increased by 94 lots to 2,981 lots, suggesting growing engagement from market participants despite price uncertainty.

In contrast, skim milk powder futures on the EEX declined 2.2% to €2,547, mirroring the weaker outlook for nonfat dry milk identified in USDA’s latest forecasts. This divergent performance between butter and SMP reflects a fundamental shift in component valuation that producers must navigate strategically in 2025.

The Shrinking Herd: Production Constraints Point to Price Support

The USDA has consistently revised its milk production forecasts downward over recent months, creating a tightening supply situation that may provide price support. The most recent forecast shows 2025 milk production at 226.9 billion pounds, representing a cumulative reduction of 1.1 billion pounds since December 2024.

The structural transformation of U.S. dairy production continues to accelerate, with significant implications for market dynamics. According to the 2022 Census of Agriculture, U.S. farms selling milk declined by 39% between 2017 and 2022 – the most substantial decline between adjacent Census periods dating back to 1982.

Table 1: U.S. Dairy Industry Structure and Consolidation (2017-2022)

Metric20172022Change
Farms selling milk40,33624,470-39%
Milk cow inventory9.5 million9.3 million-2.4%
Farms with 2,500+ cows714834+16.8%
Share of milk sales from farms with 1,000+ cows57%66%+9 percentage points
Total milk sales value$36.7 billion$52.8 billion+44%

Meanwhile, European dairy cow inventory data for December 2024 revealed consistent declines across major producing countries. Germany’s dairy cow population stood at 3.59 million head, down 123,000 head (-3.3%) compared to the previous year, while France and the Netherlands showed similar troubling trends.

Beyond Volume: Component Optimization Is the New Profit Driver

The latest USDA forecasts reveal a critical divergence across dairy product categories, creating challenges and opportunities for strategically positioned producers. The February forecast raised cheese prices to $1.8800 per pound, citing “tight inventories from 2024 that are expected to carry into 2025,” while estimates for butter, nonfat dry milk, and dry whey faced downward pressure.

What many producers may miss: USDA forecasts suggest “growth in milk components will likely balance out the lower-than-average growth per cow,” indicating a shift toward quality over quantity in production metrics. Farms that align their milk component profiles with cheese manufacturing requirements may capture premium returns despite broader market adjustments.

According to data released on March 6, 2025, the all-milk price forecast has been revised upward to $22.75 per cwt, up $0.25 from the previous month’s estimate. While this price level represents solid returns, it demands efficiency and strategic positioning from producers.

Global Signals: How International Markets Are Reshaping Your Operation

The Singapore Exchange futures offer additional perspectives on global dairy commodity trends. SGX whole milk powder futures traded down 0.7% over the March-October 2025 curve, with the average price settling at ,779. In contrast, SGX butter futures showed significant strength, rising 4.0% to $6,939.

The Global Dairy Trade auction (Event 375) recorded a modest decline of 0.5%, with the average winning price reaching $4,209. While WMP declined 2.2% to $4,061, butter strengthened by 2.7% to $7,577, reinforcing the narrative of stronger milkfat values relative to protein components.

Regional milk production data revealed divergent trends, with Spanish collections declining 0.9% year over year while Irish production surged 9.4%. Chinese farmgate milk prices have stabilized at 3.12 Yuan/Kg after declining 13.8% year over year, creating uncertainty about import demand from this crucial market.

Beyond the Markets: Health Challenges Adding New Complexity

An often-overlooked factor impacting 2025 dairy markets is the continued presence of Highly Pathogenic Avian Influenza (HPAI) in US dairy herds. First confirmed in March 2024, HPAI had spread to 925 cases across 16 states by January 14, 2025, according to APHIS.

The first human case associated with exposure to infected dairy cattle was reported on April 1, 2024, highlighting the public health dimension of this challenge. As this situation continues to evolve, producers must remain informed about biosecurity protocols and market implications.

Strategic Positioning: How Smart Producers Are Responding

The current dairy market landscape presents a complex picture requiring strategic responses from industry stakeholders. The moderately positive performance of butter futures indicates sustained demand for milkfat products despite broader market uncertainties.

The divergent performance between butter and skim milk powder markets suggests ongoing structural imbalances in component valorization. While milkfat continues to command a premium, protein markets face more challenging conditions. This divergence creates strategic opportunities for dairy processors and producers who can optimize their systems accordingly.

For individual dairy producers, success in 2025 will likely come from combining tactical excellence in production management with strategic positioning aligned with emerging market signals. USDA analysis shows feed prices will remain favorable in 2025, potentially supporting margins if milk prices remain current.

Bottom Line: Your Action Plan for Q2 2025

The global dairy market is resilient amid evolving supply and demand dynamics. The USDA’s upward revision of the all-milk price forecast to $22.75 per cwt offers cautious optimism. Still, the persistent decline in European dairy herds and emerging health challenges like HPAI add complexity to the outlook.

The operations that will thrive in this environment will be those that:

  1. Focus on component optimization rather than simply maximizing volume
  2. Maintain financial flexibility to adapt to market shifts
  3. Align their production systems with the products showing the most substantial demand

As we move into 2025, producers should monitor several key metrics: the evolution of European dairy herds, US replacement heifer numbers, Chinese import demand, and the continuing divergence between butter and SMP prices. These indicators will provide early signals about potential market shifts that could create challenges and opportunities in the months ahead.

Learn more

Join the Revolution!

Join over 30,000 successful dairy professionals who rely on Bullvine Daily for their competitive edge. Delivered directly to your inbox each week, our exclusive industry insights help you make smarter decisions while saving precious hours every week. Never miss critical updates on milk production trends, breakthrough technologies, and profit-boosting strategies that top producers are already implementing. Subscribe now to transform your dairy operation’s efficiency and profitability—your future success is just one click away.

NewsSubscribe
First
Last
Consent
Send this to a friend