






August’s DMC margin fell 18.9%. The milk kept coming anyway. Here’s the Bullvine math on where it’s growing, and what to test before you add cows.
Key Takeaways
- Wisconsin, Kansas, Texas, New York and Idaho supplied 324 million pounds, or 65.6% of the net 24-state increase, by Bullvine’s calculation. Declines in Arizona, Utah, Illinois and New Mexico cut 28 million.
- Using revised July figures, the larger herd more than accounted for July’s reconstructed increase, while lower yield offset part of it. In September, higher yield contributed about one-third.
- August’s $9.34 DMC margin is $2.18 below a year earlier, but it’s milk price minus formula feed cost. It skips labor, debt and depreciation, so it can’t tell you whether expansion pays.
While those five states added milk, the latest margin data point the other way. In August, the most recent month covered by the margin data used here, U.S. production rose 2.4% from a year earlier, according to USDA’s October 22 Milk Production report, while the Dairy Margin Coverage margin fell 18.9%, by Bullvine’s calculation from USDA’s October 16 Livestock, Dairy, and Poultry Outlook. That comparison describes national conditions. The return on another cow depends on your milk terms and the costs she adds.
Defining the Margin Squeeze: Behind the $9.34 DMC Trigger
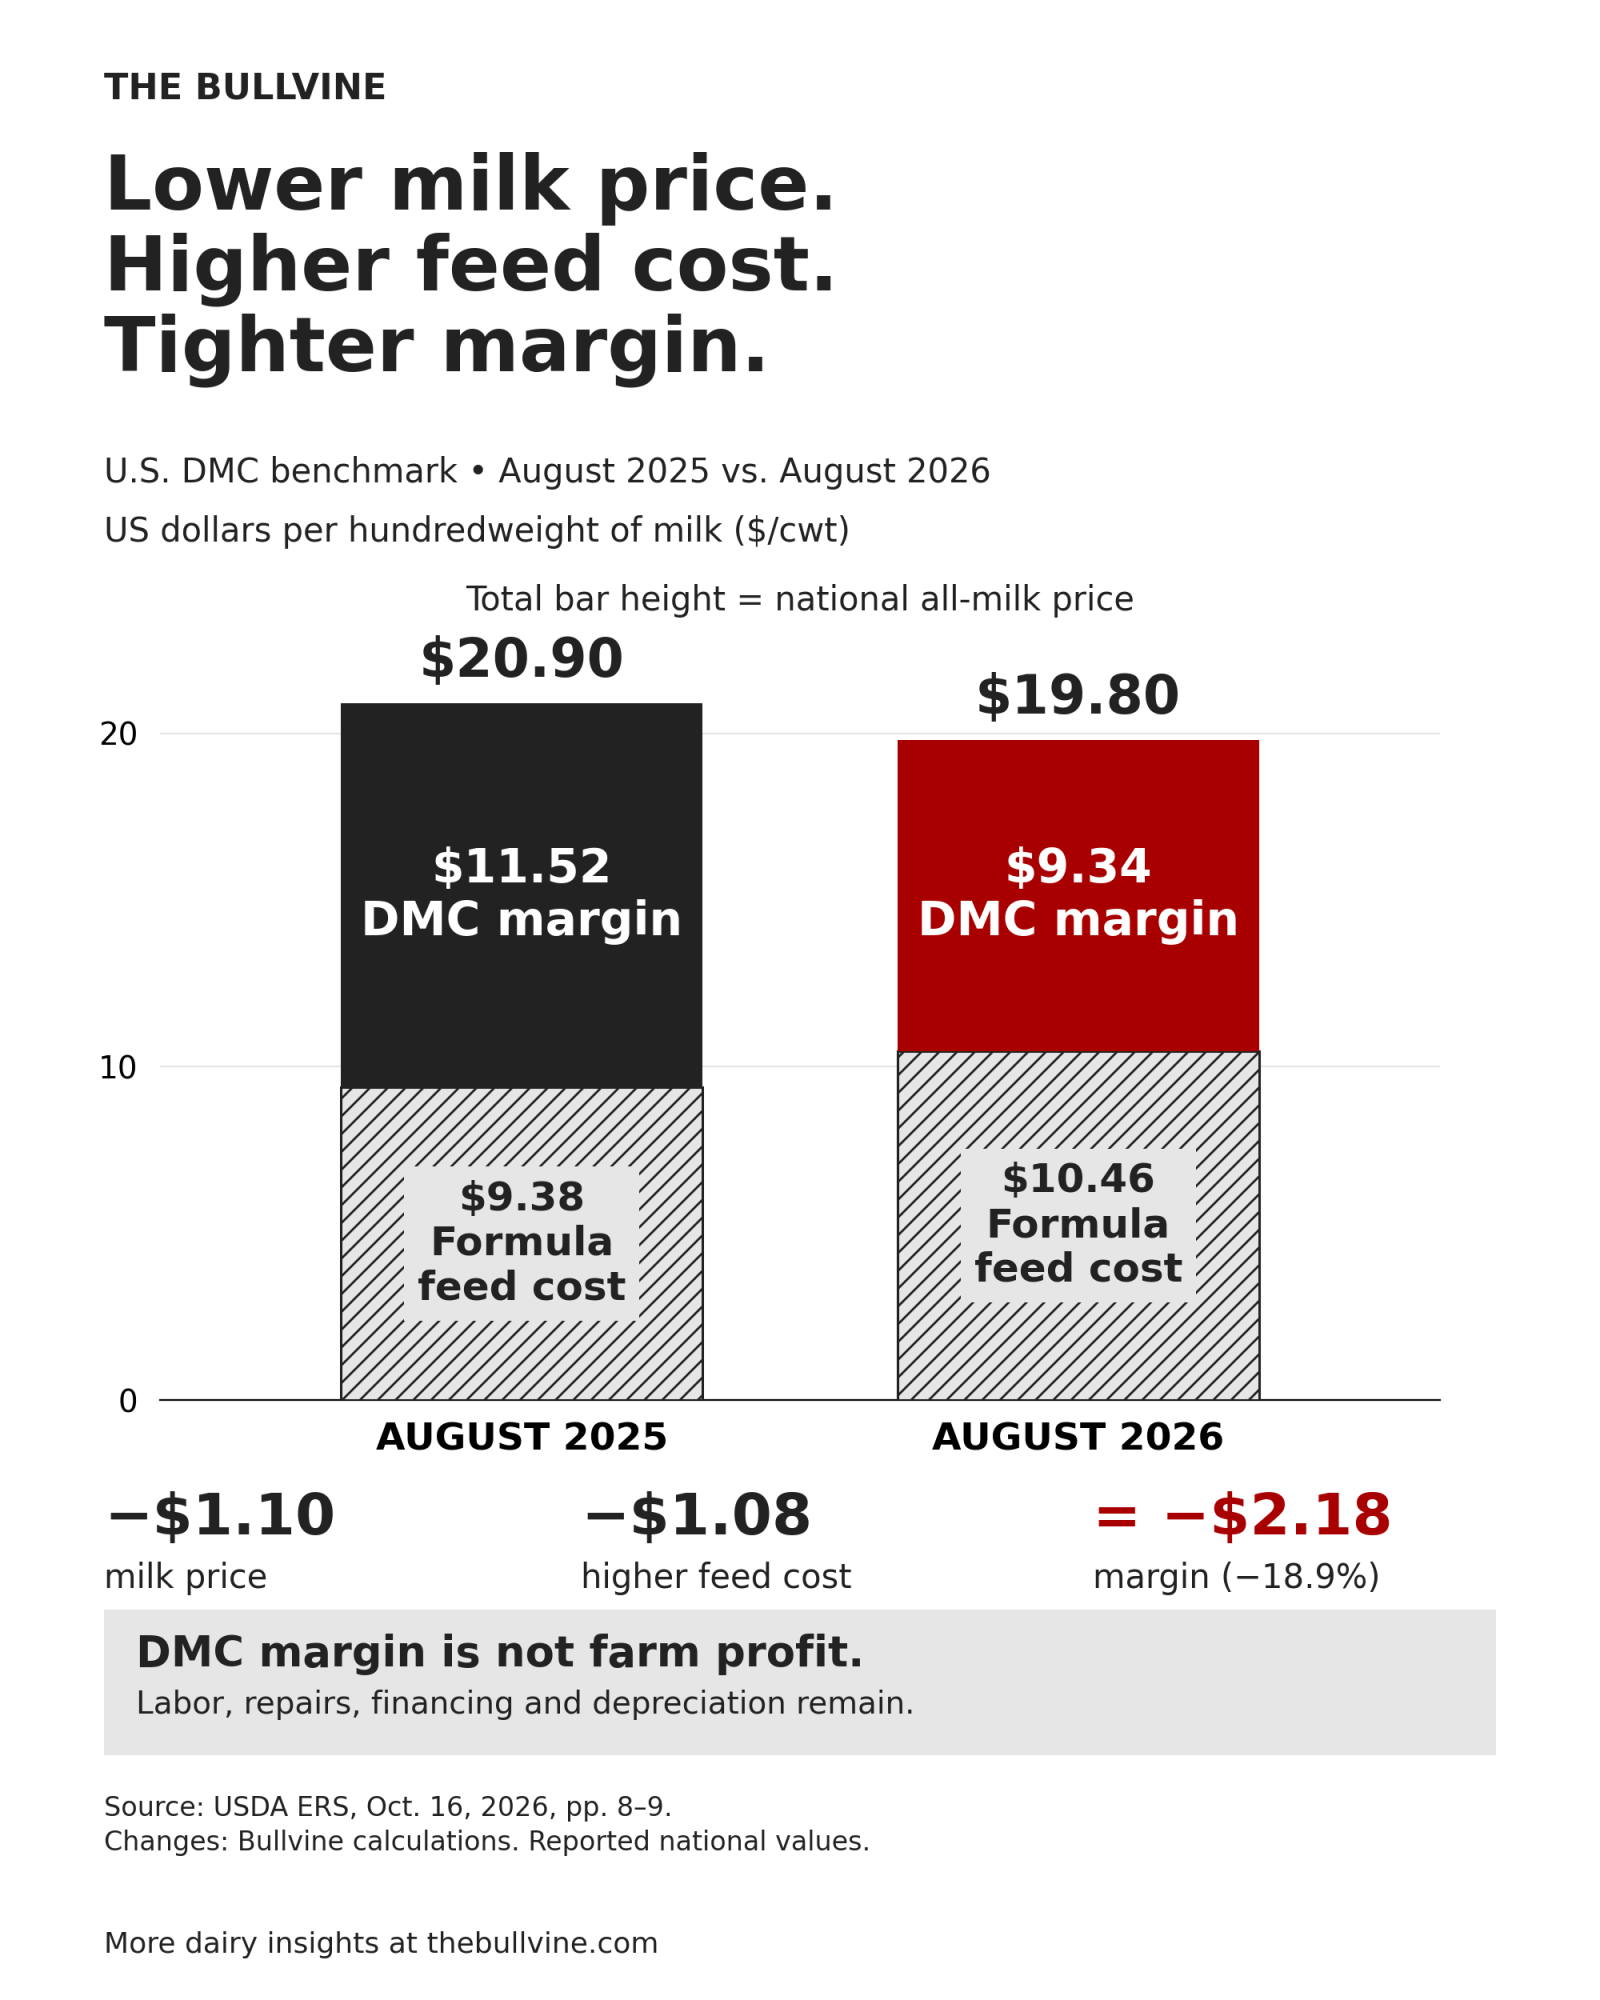
USDA’s August DMC margin was $9.34 per hundredweight, down from $11.52 in August 2025. That’s a $2.18 decline, or 18.9%, calculated by Bullvine from figures on pages 8–9 of the ERS outlook. Both sides moved against the margin: the all-milk price fell $1.10, while formula feed costs increased $1.08. August’s $9.34 margin triggered payments for participating operations with $9.50 coverage.
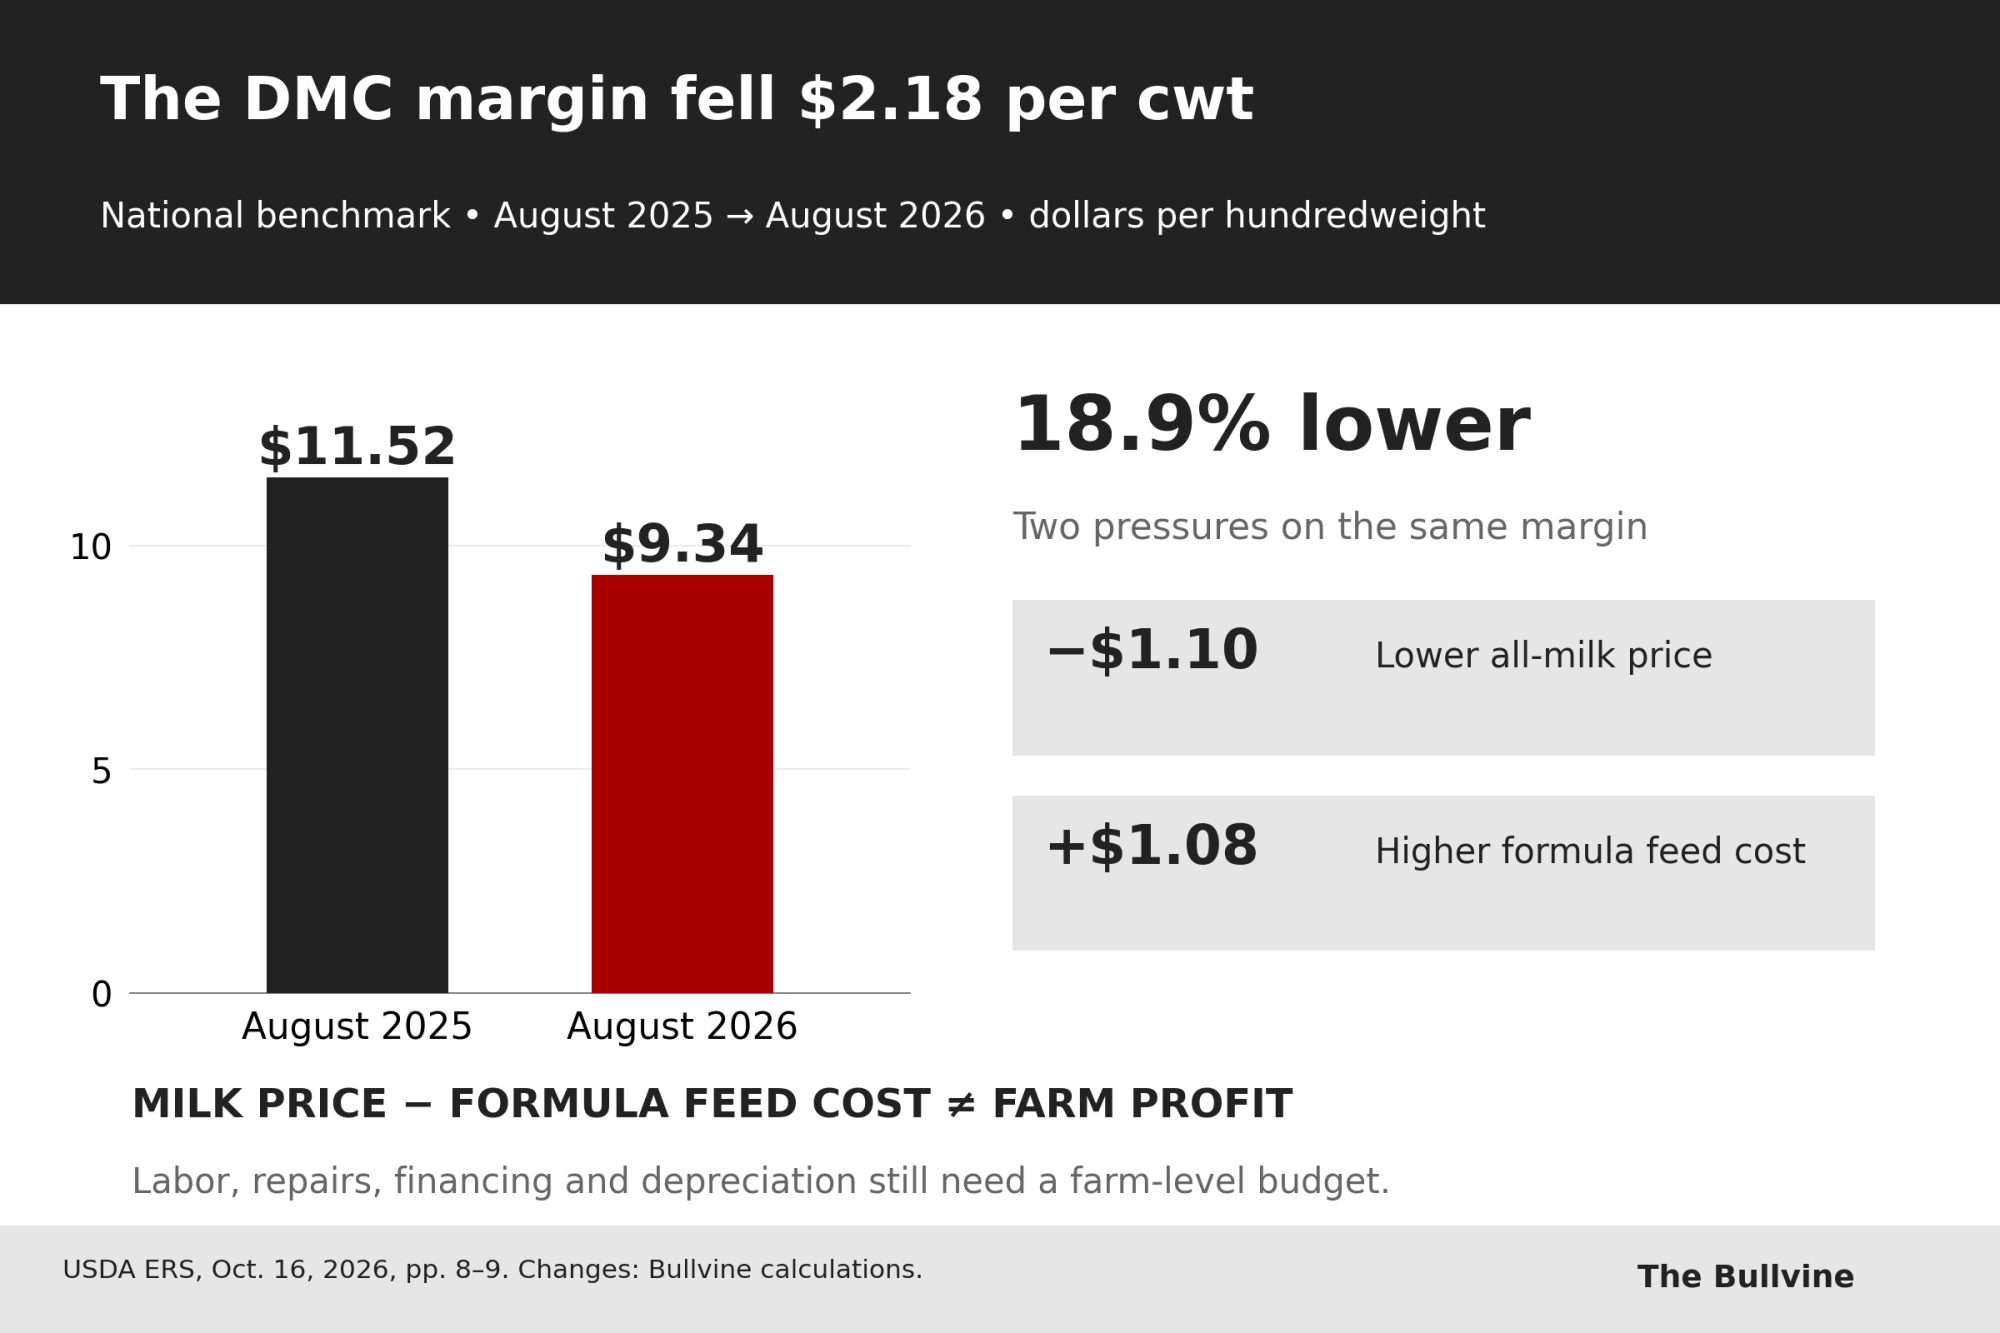
| National measure | August 2025 | August 2026 | Change |
| All-milk price | $20.90/cwt | $19.80/cwt | −$1.10 |
| DMC formula feed cost | $9.38/cwt | $10.46/cwt | +$1.08 |
| DMC milk-feed margin | $11.52/cwt | $9.34/cwt | −$2.18 |
| Milk production, October report vintage | 19.560 billion lb | 20.039 billion lb | +2.4% |
Sources: USDA ERS’s October 16 outlook, pages 8–9, and USDA NASS’s October 22 Milk Production report, page 2. Changes and percentage comparisons are Bullvine calculations.
DMC measures the difference between the national all-milk price and standardized feed costs. It does not deduct the farm’s entire labor bill, repairs, financing costs, depreciation or the economic cost of owned resources. Nor does it add calf receipts, cull-cow income or risk-management payments. A $9.34 DMC margin is therefore neither $9.34 of profit nor proof of a loss. August is the latest margin month; September’s production estimate is a separate, newer observation, so neither a September DMC result nor a farm-level loss is established here.
Even the all-milk price isn’t the amount deposited into every producer’s account. NASS defines it as a gross price before deductions including hauling, promotion and cooperative dues, with premiums and discounts included. Your realized milk price and actual ration cost are the starting points for your budget, not the national spread.
Where the pounds came from
USDA’s October 22 report put September national milk production at 19.443 billion pounds, up 2.6% from September 2025. The often-quoted 2.7% belongs to the separate 24-state series, which reached 18.724 billion pounds. National July–September production totaled a preliminary 59.529 billion pounds, up 2.3%.
Bullvine ranked the September state changes by additional pounds, not percentage growth. Wisconsin supplied the largest increase, even though Kansas posted the faster percentage gain. Together, the five leading states contributed almost two-thirds of the 24-state net increase.
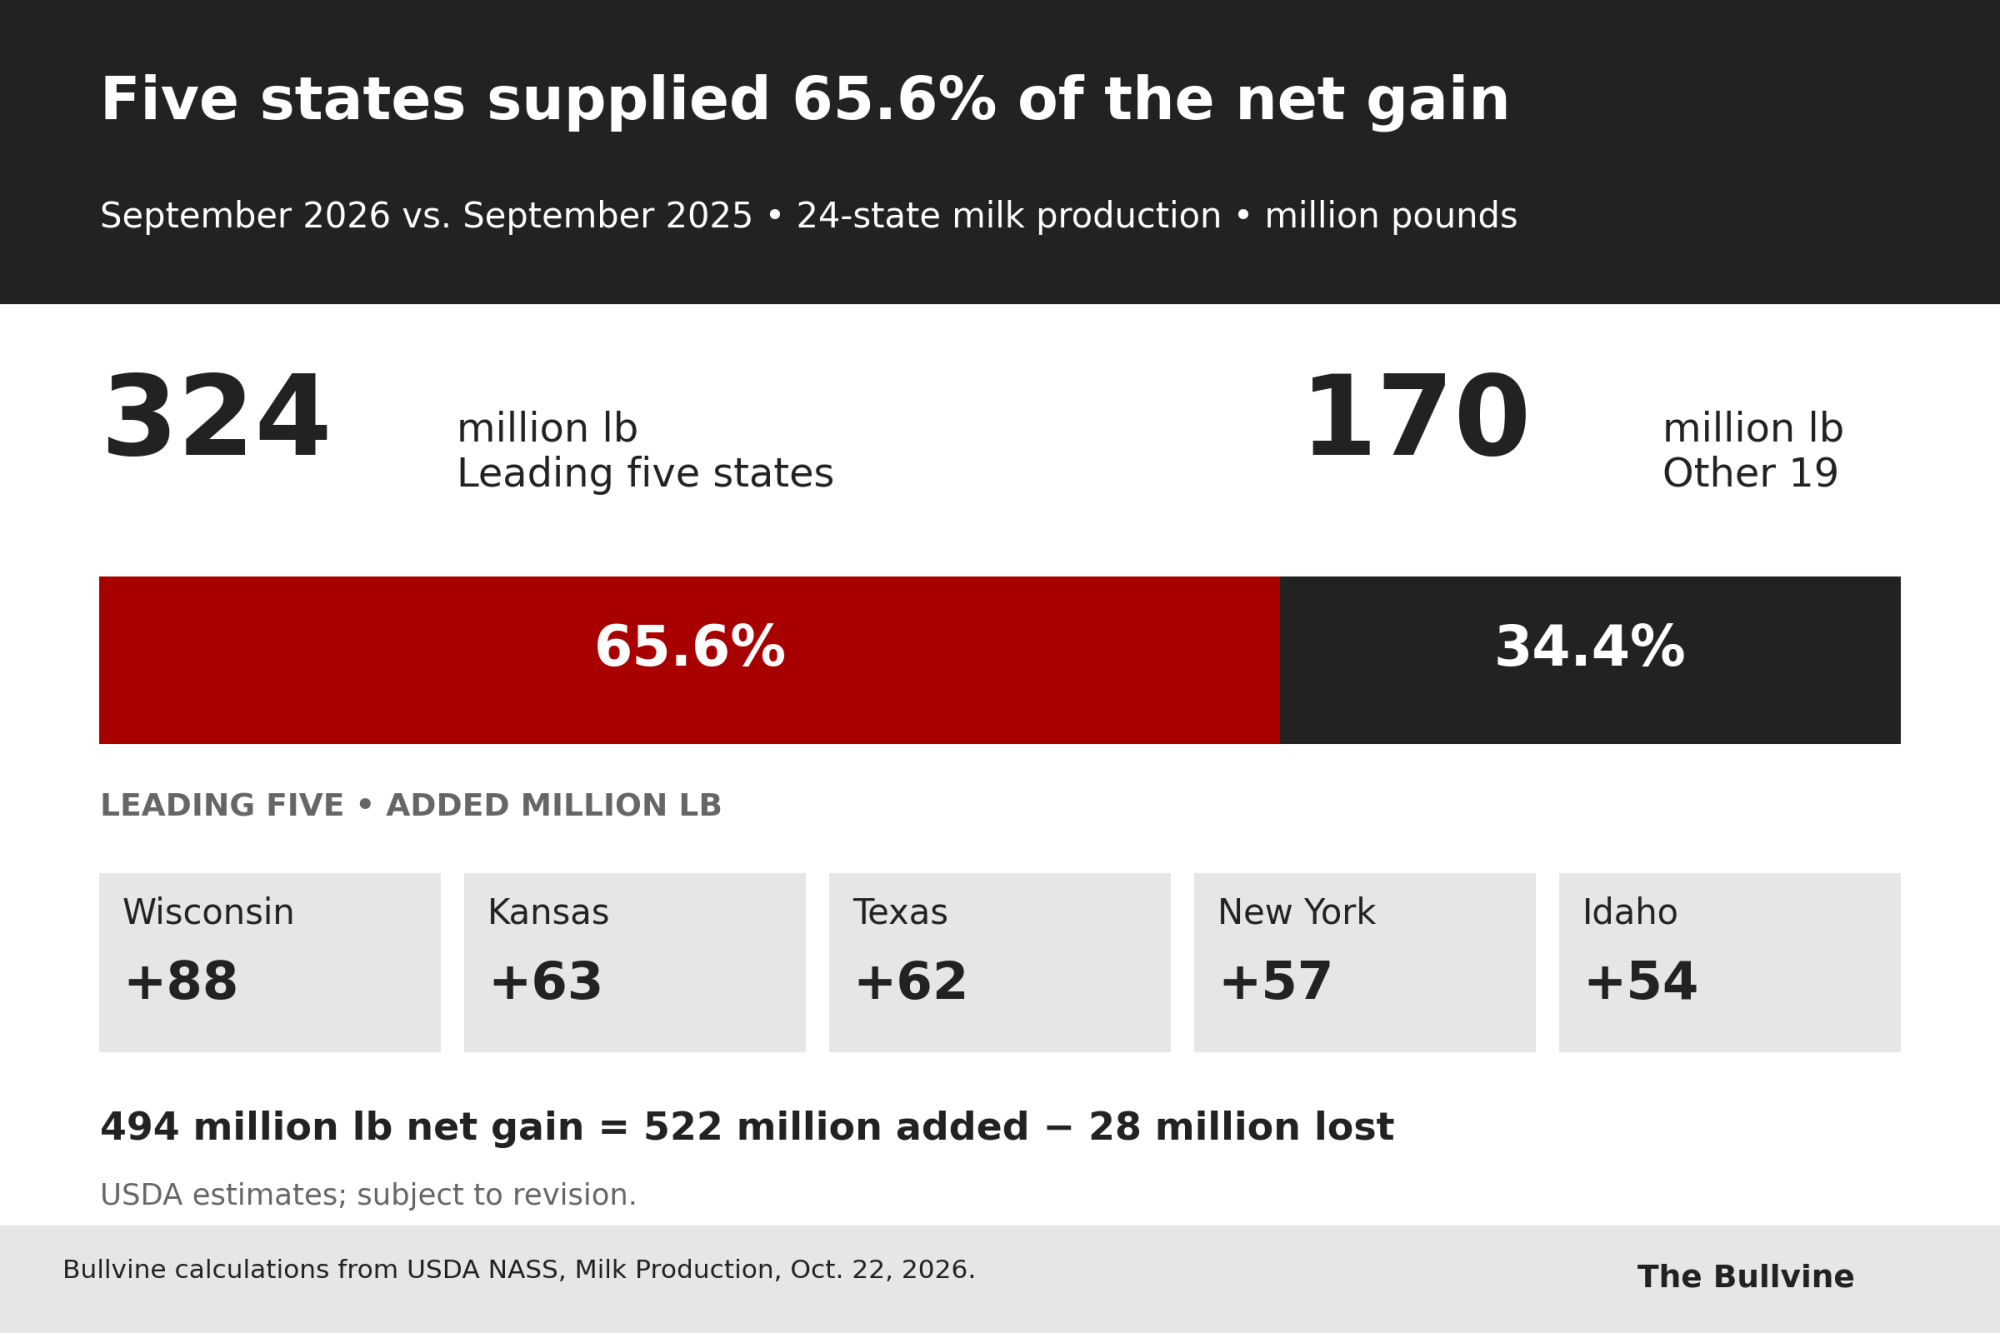
| State or group | September 2025, million lb | September 2026, million lb | Added million lb | Share of net 24-state growth |
| Wisconsin | 2,694 | 2,782 | 88 | 17.8% |
| Kansas | 429 | 492 | 63 | 12.8% |
| Texas | 1,500 | 1,562 | 62 | 12.6% |
| New York | 1,360 | 1,417 | 57 | 11.5% |
| Idaho | 1,541 | 1,595 | 54 | 10.9% |
| Leading five | 7,524 | 7,848 | 324 | 65.6% |
| Remaining 19 states | 10,706 | 10,876 | 170 | 34.4% |
| 24-state total | 18,230 | 18,724 | 494 | 100.0% |
Bullvine calculations from USDA NASS’s September state table, October 22 release.
Growth varied widely across states. California added only 1 million pounds, while Arizona, Utah, Illinois and New Mexico declined. Across all growing states, additions totaled 522 million pounds; declines elsewhere removed 28 million, leaving the 494-million-pound net gain. A state total also doesn’t tell us how many individual farms expanded.
September’s estimates remain revisable. The same report raised August’s 24-state production by 132 million pounds from the previous preliminary estimate. Use the release date when citing these estimates; subsequent reports can revise them.
More cows did more work
Nationally, USDA reported 9.743 million milk cows in September, up 169,000 from a year earlier, and 1,996 pounds per cow, up 18 pounds. Those are approximately 1.8% more cows and 0.9% more milk per cow. The cow count includes dry cows and excludes heifers that haven’t freshened; it is not a count of dairy operations.
By Bullvine’s calculation, the larger herd accounted for about 65.6% of September’s reconstructed increase and higher milk per cow for about 33.8%. Yes, that’s the same 65.6% as the five-state share. It’s two separate calculations that happen to match, not one number counted twice. These figures can’t tell us whether those cows went into new stalls, filled existing facilities or stayed in production longer. The full calculation is in the appendix.
Yield vs. Herd Size: The July-to-September Shift
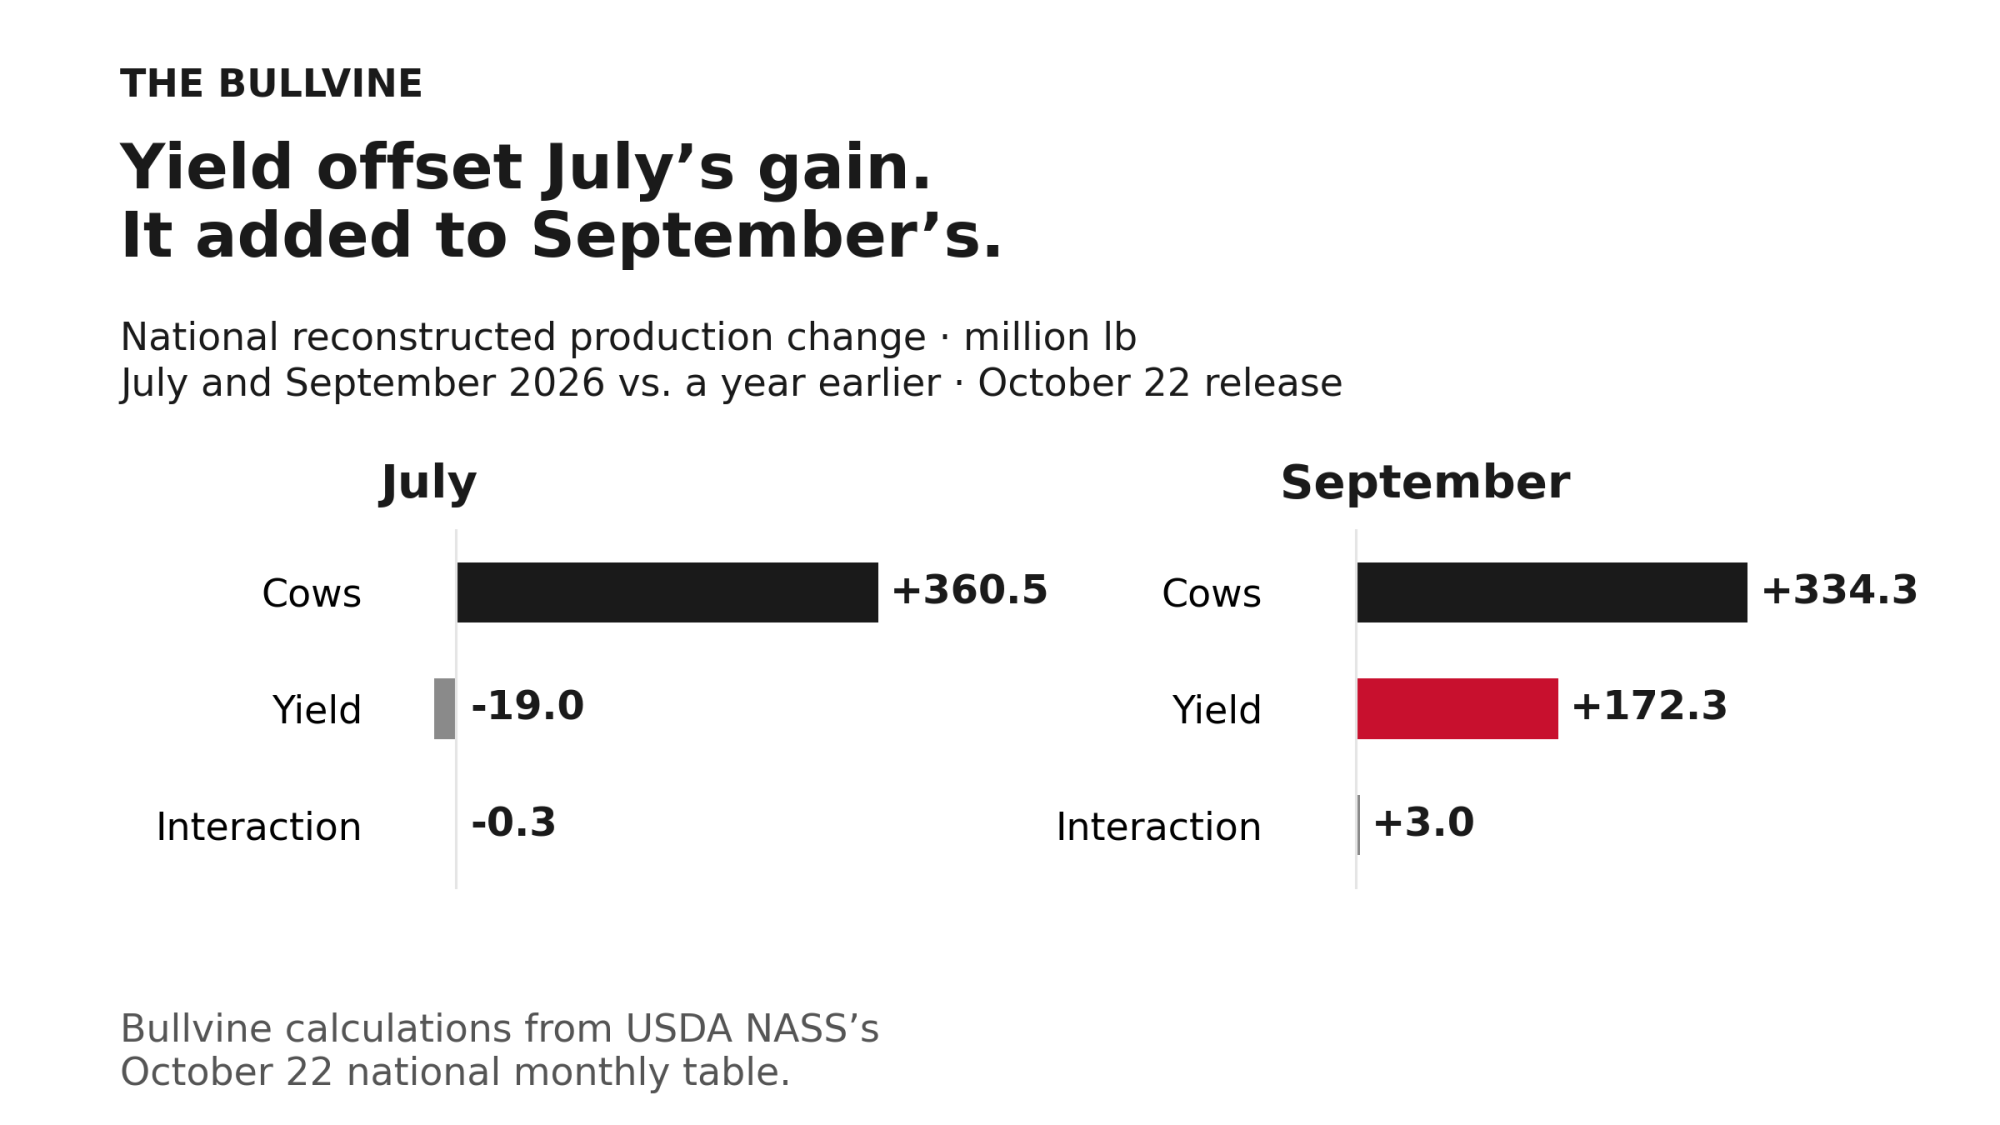
Bullvine’s July analysis put cows at about 93% of July’s year-over-year gain, based on USDA’s August 21 first estimate. The October 22 report revised July production down 98 million pounds, to 20.047 billion. On the revised figures, more cows accounted for more than July’s entire increase, because milk per cow slipped 2 pounds.
By September, the picture had shifted. Milk per cow rose 18 pounds from a year earlier and supplied about a third of the gain. Cows still did most of the work, but two months isn’t a trend, and these figures don’t say why yield moved.
Kansas shows the processing link
Kansas offers a documented link between added milk and a plant that’s actually operating, not just announced. Hilmar’s March 17, 2025, release confirmed cheese production at Dodge City, identified more than $600 million in capital investment and thanked Southwest Kansas dairy families for their investment to supply the plant with milk.
But Hilmar’s release doesn’t disclose September 2026 milk intake, utilization or supplier returns. Kansas’s added 63 million pounds fit with an operating plant and earlier supply investment; the documents don’t establish how much of the state’s increase Hilmar caused.
The decision changes once facilities are operating. Keeping an existing cow producing requires a different budget from buying replacements and building another barn. USDA’s national DMC result can’t answer either budget on its own.
Demand isn’t one milk bucket
ERS reported January–August export growth of 27.4% on a milk-fat milk-equivalent basis, but 3.3% on a skim-solids basis. Domestic use grew 0.5% and 2.2%, respectively. Fat and skim-solids equivalents are separate measures and cannot be added together as raw-milk volume. These January–August changes provide demand context, but they do not establish how much of September’s additional milk went to exports.
USDA’s price expectations also differed by product stream. Its October outlook lowered the 2026 annual Class III forecast to $15.80 per cwt while raising Class IV to $18.90. Those are forecasts, not realized farm returns, but their divergence is another reason not to assume every additional hundredweight faces the same economics.
Don’t make calves prove too much
Budget warning: keep calf money out of the milk math. Neither NASS’s production tables nor ERS’s DMC measure establishes that beef-cross calf revenue caused the larger national milk herd. The national expansion figures don’t establish that calves are financing expansion. Evaluate nonmilk receipts separately before deciding whether they cushion your weaker milk returns.
Use net additional calf contribution, not the sale price of the highest-priced calf. Deduct the associated breeding and calf costs, account for saleable calves actually produced, preserve the required replacement pipeline and subtract the value of the dairy calf displaced. Keep cull-cow receipts separate: ERS reports cull cow prices have fallen sharply from mid-year highs, so use your own expected sale receipts. And don’t add cattle revenue twice if the whole-farm budget already contains it.
What this means for your operation
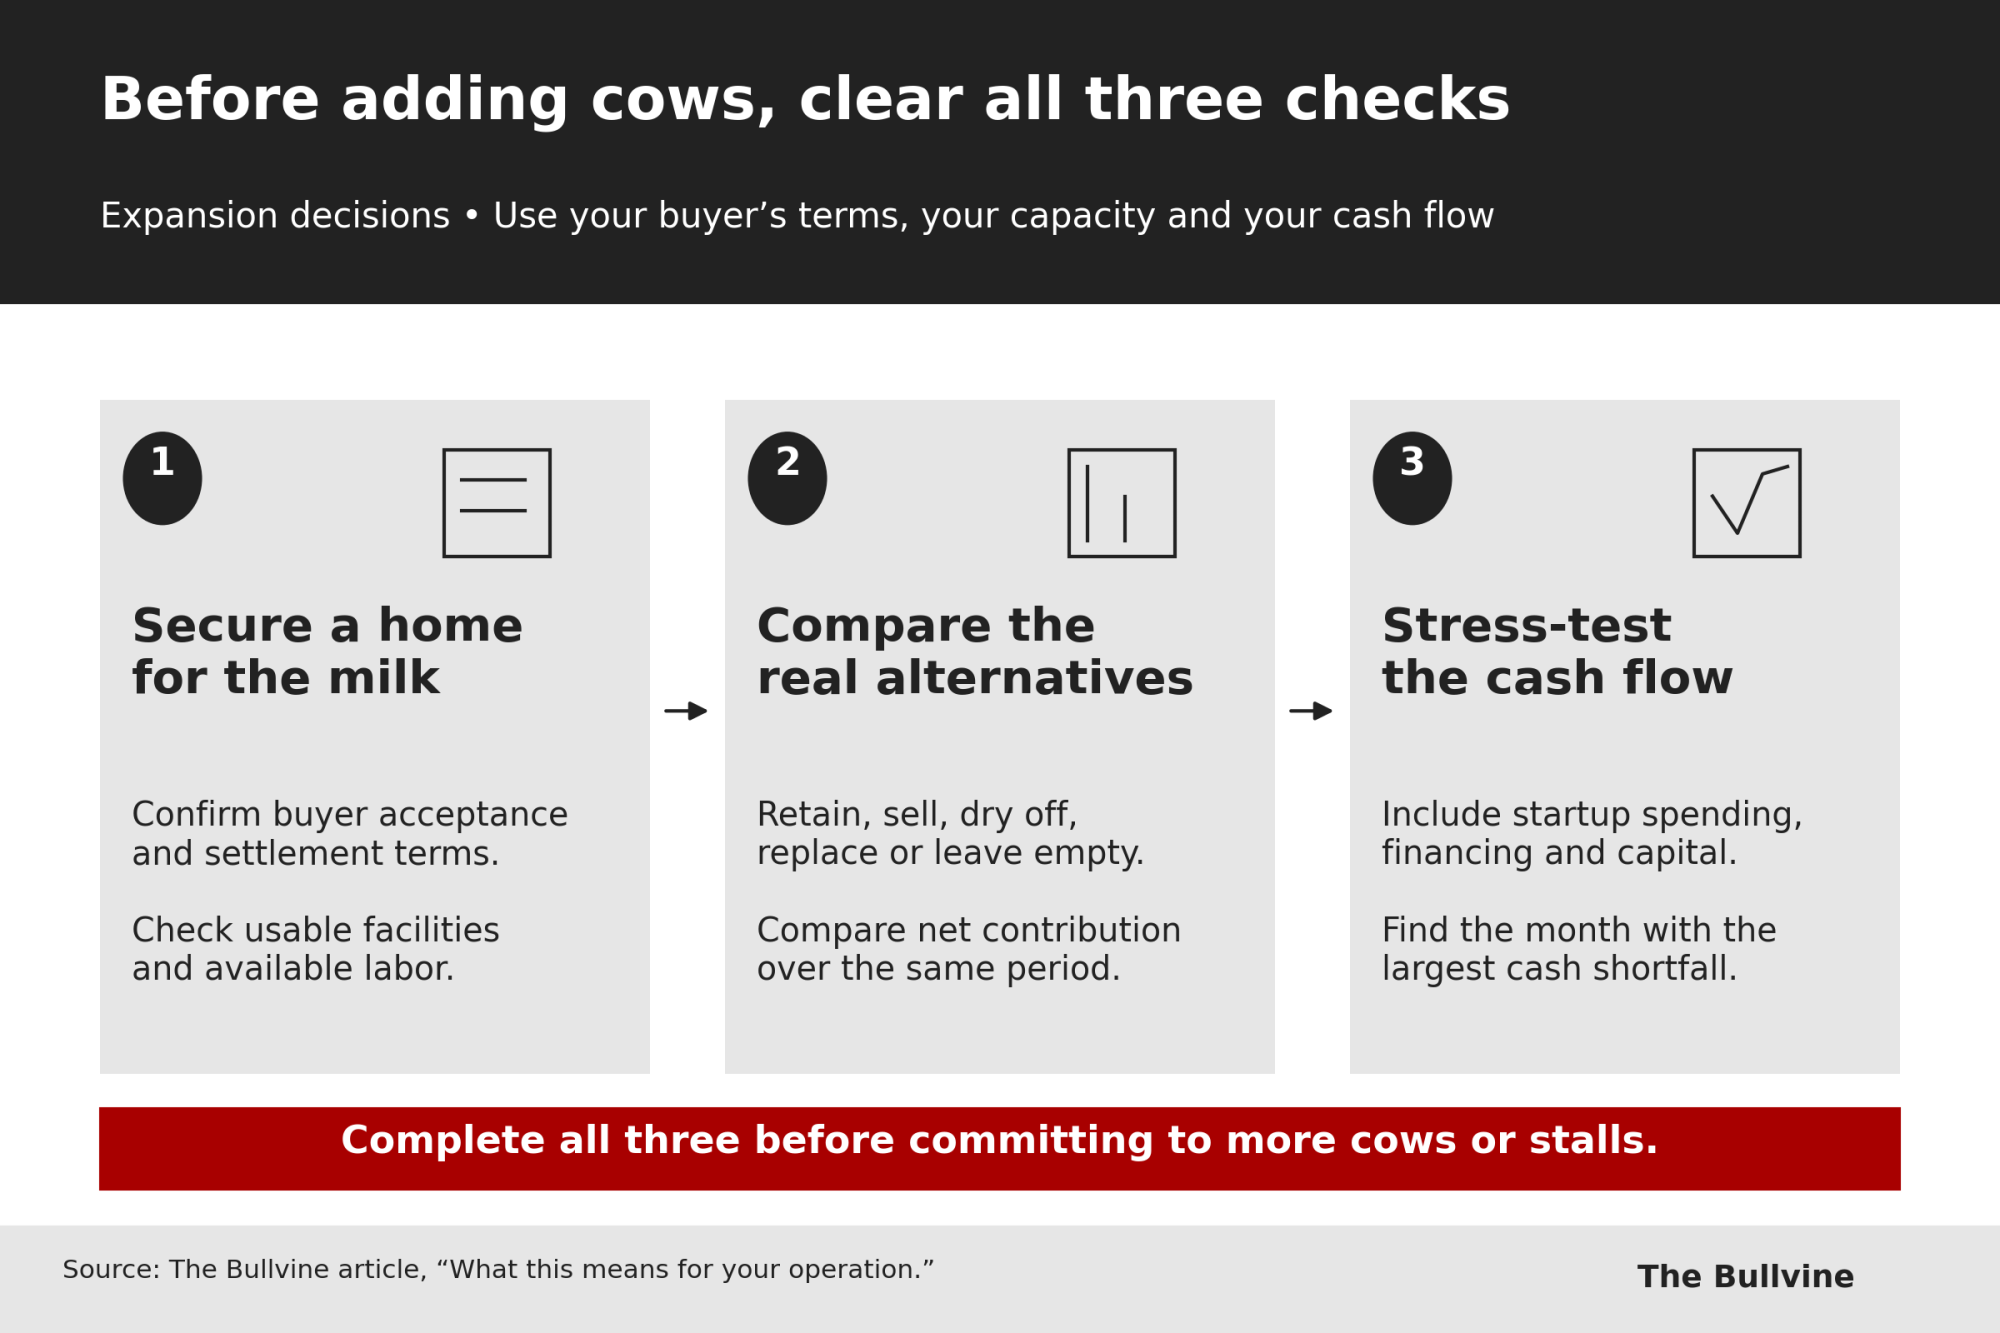
Before committing to additional cows or stalls, run three separate tests through the expansion budget.
- Compare retention with the alternatives. Set the expected net contribution of keeping a cow against selling her, replacing her or leaving the stall empty, over the same period and including replacement costs and timing. Go ahead only if keeping her comes out ahead.
- Confirm milk acceptance and usable capacity. Check your settlement terms and whether your buyer will take the added volume. Then confirm your facilities and labor can handle it without spending you haven’t budgeted.
- Test startup and downside cash needs. Include added labor, replacements, financing and capital, and record net calf and cull receipts separately from milk. Identify the month with the largest cash shortfall. The Bullvine’s Dairy Profit Projector projects 12-month whole-herd margin and breakeven milk price from your own herd, milk and ration inputs. Run it first with cull and calf revenue set to zero, then add your expected receipts. Use the projector as an initial operating-margin screen. Build startup spending, loan payments and capital requirements in a separate monthly cash-flow schedule, checking that costs already included in the operating estimate are not counted twice.
| Budget question | Supplied evidence or interpretation | Limit / practical use |
| Does a $9.34 DMC margin mean $9.34 of profit? | No. DMC subtracts standardized feed costs from the national all-milk price, not all farm expenses. It also excludes calf receipts, cull-cow income and risk-management payments. | The figure triggered payments at $9.50 coverage for participating operations; it establishes neither farm profit nor farm loss. |
| Can August’s margin establish September’s economics? | No. August is the latest margin month in the supplied material; September production is a separate, newer observation. | Pair August economics with August production. A September DMC result is not established here. |
| What should be tested before adding cows? | Bullvine interpretation: compare retaining, selling, drying off, replacing or leaving a stall empty over the same period. Confirm buyer acceptance, settlement terms, usable facilities and labor. | Compare each option’s additional receipts, costs and timing; national production growth cannot decide the farm budget. |
| How should calf receipts and expansion cash needs be handled? | Bullvine interpretation: record net additional calf and cull receipts separately; include startup spending, financing and capital in monthly cash flow. | Avoid assuming calf revenue caused national herd growth or counting cattle receipts and costs twice. |
DMC deadline: December 18, 2026. Review your eligible production, coverage options, premiums and existing election with your FSA office before December 18. If you already hold a multiyear election, complete the annual requirements needed to maintain coverage. (USDA FSA, September 30)
For the next monthly budget update, keep August economics paired with August production until the corresponding September margin evidence is available. Then replace the national benchmark with your own milk settlements and costs. Don’t turn a national payment trigger into your farm’s expansion breakeven.
USDA’s figures establish expanding production, a larger herd and a weaker August milk-feed margin. They don’t establish that expansion is universally profitable, or that it’s irrational. Before signing for the next group of replacements, ask the question the national figures can’t answer: at the price and volume your buyer will actually accept, does that group cover its additional costs and required return without an unsupported calf-revenue assumption?
| September production finding | Evidence | What it means |
| Five states supplied most of the net increase | Wisconsin, Kansas, Texas, New York and Idaho added 324 million lb. Bullvine calculation: 324 ÷ 494 × 100 = 65.6% of net 24-state growth. | Share of additional pounds—not share of total production or number of expanding farms. |
| Declining states offset some growth | Arizona, Utah, Illinois and New Mexico lost a combined 28 million lb. Bullvine calculation: 522 million lb in gross additions − 28 million lb in declines = 494 million lb net growth. | Gross additions overstate the increase available across the 24-state market. |
| National and 24-state growth rates differ | September national production: 19.443 billion lb, up 2.6% year over year. The 24-state series: 18.724 billion lb, up 2.7%. | Keep the geography attached to the growth rate. |
| More cows supplied most of the reconstructed national increase | September cow numbers rose 169,000; yield rose 18 lb per cow. Bullvine’s decomposition assigns roughly two-thirds to herd size and one-third to yield. | The reconstructed gain is 509.656 million lb versus the published 501 million lb; the −8.656 million lb residual remains unassigned. These figures do not explain why farms added or retained cows. |
Appendix: Data Reconciliation
How Bullvine calculated this
- Production split: monthly production equals milk cows multiplied by milk per cow, using USDA’s national figures from the October 22 release for every month shown.
- Cow contribution: change in cow numbers × prior-year milk per cow.
- Yield contribution: prior-year cow numbers × change in milk per cow.
- Interaction: change in cow numbers × change in milk per cow.
- Units: USDA publishes cows in thousands; they’re converted to head before multiplying, and results are in million pounds.
- Rounding: The published cow, yield and production figures do not reconcile exactly when multiplied.USDA notes that figures may not add because of rounding. Bullvine shows the residual without assigning it to either contribution.
- State shares: each state’s added pounds divided by the 494-million-pound net 24-state increase.Subtotals are summed from the state rows. Because some states declined, gross additions (522 million pounds) exceed the net gain.
- Margin change: August 2025 and August 2026 DMC values from the ERS October outlook chart; the dollar and percentage changes are Bullvine calculations.
September 2026 vs. September 2025, national
| Term | Inputs | M lb |
| Cow term | 169,000 × 1,978 lb | 334.282 |
| Yield term | 9,574,000 × 18 lb | 172.332 |
| Interaction | 169,000 × 18 lb | 3.042 |
| Rebuilt | Sum of three | 509.656 |
| Published | 19,443 − 18,942 | 501.000 |
| Residual | Published − rebuilt | −8.656 |
July vs. September, national (October 22 release)
| Term | Jul 2026 | Sep 2026 |
| Cows YoY | +174,000 | +169,000 |
| Milk/cow YoY | −2 lb | +18 lb |
| Cow term | +360.5M | +334.3M |
| Yield term | −19.0M | +172.3M |
| Interaction | −0.3M | +3.0M |
| Published | +341.0M (+1.7%) | +501.0M (+2.6%) |
| Residual | −0.2M | −8.7M |
Bullvine calculations, not USDA attribution. Figures in million pounds. Both months come from USDA’s October 22 national monthly table.
Learn More
- The $17,500 Dairy Margin Coverage Gamble: The 6‑Year Lock‑In Decision Most Farms Haven’t Run the Numbers On Yet — Securing five-figure indemnity payments during weak margins requires precise calculation. This blueprint breaks down the exact math on the 2026 DMC lock-in checkbox, arming you with a 200-cow model to maximize Tier 1 coverage returns.
- The $8 Billion Infrastructure Trap: Why America’s Dairy Boom Could Become Its Biggest Bust — Follow the money on the $8 billion wave of new cheese plants to expose a severe market threat. You gain critical visibility into the 12-to-24-month gap where regional supply outpaces demand and crushes class prices.
- Critical Research Exposes Dairy Labor Crisis as Policy Uncertainty Threatens Industry Stability — Hard numbers on robotic automation dismantle the cost myths surrounding the dairy workforce collapse. By slashing labor dependency up to 29%, this operational edge positions your herd to capture maximum component premiums when staffing fails.
The Sunday Read Dairy Professionals Don’t Skip.

Every week, thousands of producers, breeders, and industry insiders open Bullvine Weekly for genetics insights, market shifts, and profit strategies they won’t find anywhere else. One email. Five minutes. Smarter decisions all week.